Article

Prediction of Potential Suitable Distribution Areas of Quasipaa spinosa in China Based on MaxEnt Optimization Model

College of Animal Science and Technology, Hunan Agricultural University, Changsha 410128, China
*
Author to whom correspondence should be addressed.
Submission received: 2 February 2023 / Revised: 17 February 2023 / Accepted: 23 February 2023 / Published: 25 February 2023
(This article belongs to the Special Issue Integrating Science into Aquatic Conservation)

Abstract

:

Simple Summary

In this study, in order to understand the distribution and optimal living environment of Quasipaa spinosa in China, we made predictions about the impacts of different environmental climates on its habitat. Our results show that our model is highly reliable. The mountainous areas in southern China with sufficient water supply are the main suitable areas for this species. The future reduction in emission concentration will be friendly to the ecological environment in the suitable areas of this species, better protecting the reproduction of its natural population.

Abstract

Quasipaa spinosa is a large cold-water frog unique to China, with great ecological and economic value. In recent years, due to the impact of human activities on the climate, its habitat has been destroyed, resulting in a sharp decline in natural population resources. Based on the existing distribution records of Q. spinosa, this study uses the optimized MaxEnt model and ArcGis 10.2 software to screen out 10 factors such as climate and altitude to predict its future potential distribution area because of climate change. The results show that when the parameters are FC = LQHP and RM = 3, the MaxEnt model is optimal and AUC values are greater than 0.95. The precipitation of the driest month (bio14), temperature seasonality (bio4), elevation (ele), isothermality (bio3), and the minimum temperature of coldest month (bio6) were the main environmental factors affecting the potential range of the Q. spinosa. At present, high-suitability areas are mainly in the Hunan, Fujian, Jiangxi, Chongqing, Guizhou, Anhui, and Sichuan provinces of China. In the future, the potential distribution area of Q. spinosa may gradually extend to the northwest and north. The low-concentration emissions scenario in the future can increase the area of suitable habitat for Q. spinosa and slow down the reduction in the amount of high-suitability areas to a certain extent. In conclusion, the habitat of Q. spinosa is mainly distributed in southern China. Because of global climate change, the high-altitude mountainous areas in southern China with abundant water resources may be the main potential habitat area of Q. spinosa. Predicting the changes in the distribution patterns of Q. spinosa can better help us understand the biogeography of Q. spinosa and develop conservation strategies to minimize the impacts of climate change.

1. Introduction

The geographical distribution of species is the result of adaptation to climate, topography, soil, biology, migration history, and human activities during the long evolutionary process, which reflects the evolutionary history of species, population expansion, and the ability to adapt to the environment [1]. In recent years, habitat destruction due to human disturbance and global climate change has led to the migration, rapid decline, or disappearance of amphibian species [2]. Therefore, it is of great significance to study the suitable areas of species to protect their habitats in situ. The application of niche models to predict and evaluate species habitats is becoming a new hot topic [3,4]. There are more than 10 species distribution models (SDMs) that have been reported, but the MaxEnt model is low cost, simple to operate, short to run, and can simulate the fitness range of species well with a very small number of samples (n ≥ 5) [5]. At present, it is also widely used in the prediction research of amphibian habitats, such as Odrrana hainanensis [2], and five species of Scutiger [6], and others such as Rana Zhenhaiensis [7], Buergeria oxycephala [8], Nanorana parkeri [9], Plethodon [10], and Quasipaa boulengeri [11], and so on.
Quasipaa spinosa, commonly known as stone frog, rock frog, etc., belongs to Anura, Dicroglossidea, and Quasipaa [12]. As a large frog, it breeds in cold water streams and is mainly distributed in the hills of southern China and mountainous areas of northern Vietnam [12,13,14,15,16], which has a special ecological and biological status. Due to overfishing, the wide application of chemical pesticides and environmental changes, the wild population of Q. spinosa has decreased dramatically [17]. It has been designated as a vulnerable species by the International Union of the Conservation of Nature (IUCN) Red List and the Red List of Chinese Species [18].
As an important economic frog with high nutritional value and homology of medicine and food, Q. spinosa is honored as the “King of Hundred Frogs” [15,19,20]. In the last ten years, the market demand of Q. spinosa has been rising, and the price of Q. spinosa has increased 20–30 times from 1980s to now [18], which has promoted the rapid development of Q. spinosa breeding in China, becoming one of the most important industries for poverty alleviation in mountainous areas. Although artificial breeding has relieved the pressure of hunting for the wild population to some extent, the effect has been limited [21]. At present, research on Q. spinosa focuses on gut microbiology [13,14,22], diseases [23,24], genetic transcriptomes [25,26], and captive breeding [16,27,28,29]. It is very important to better protect and reasonably utilize the existing wild Q. spinosa resources to achieve a win–win situation for environmental protection and resource utilization. These have now become a new hot spot in fisheries resources research.
In this paper, we applied a MaxEnt optimization model and ArcGIS technology to comprehensively analyze the key environmental factors affecting the distribution of Q. spinosa, with the aim of understanding the current distribution of its habitat suitability, exploring its habitat range, and predicting its potential geographical distribution in order to provide reference for the conservation of Q. spinosa diversity, habitat restoration, and biogeography research.

2. Materials and Methods

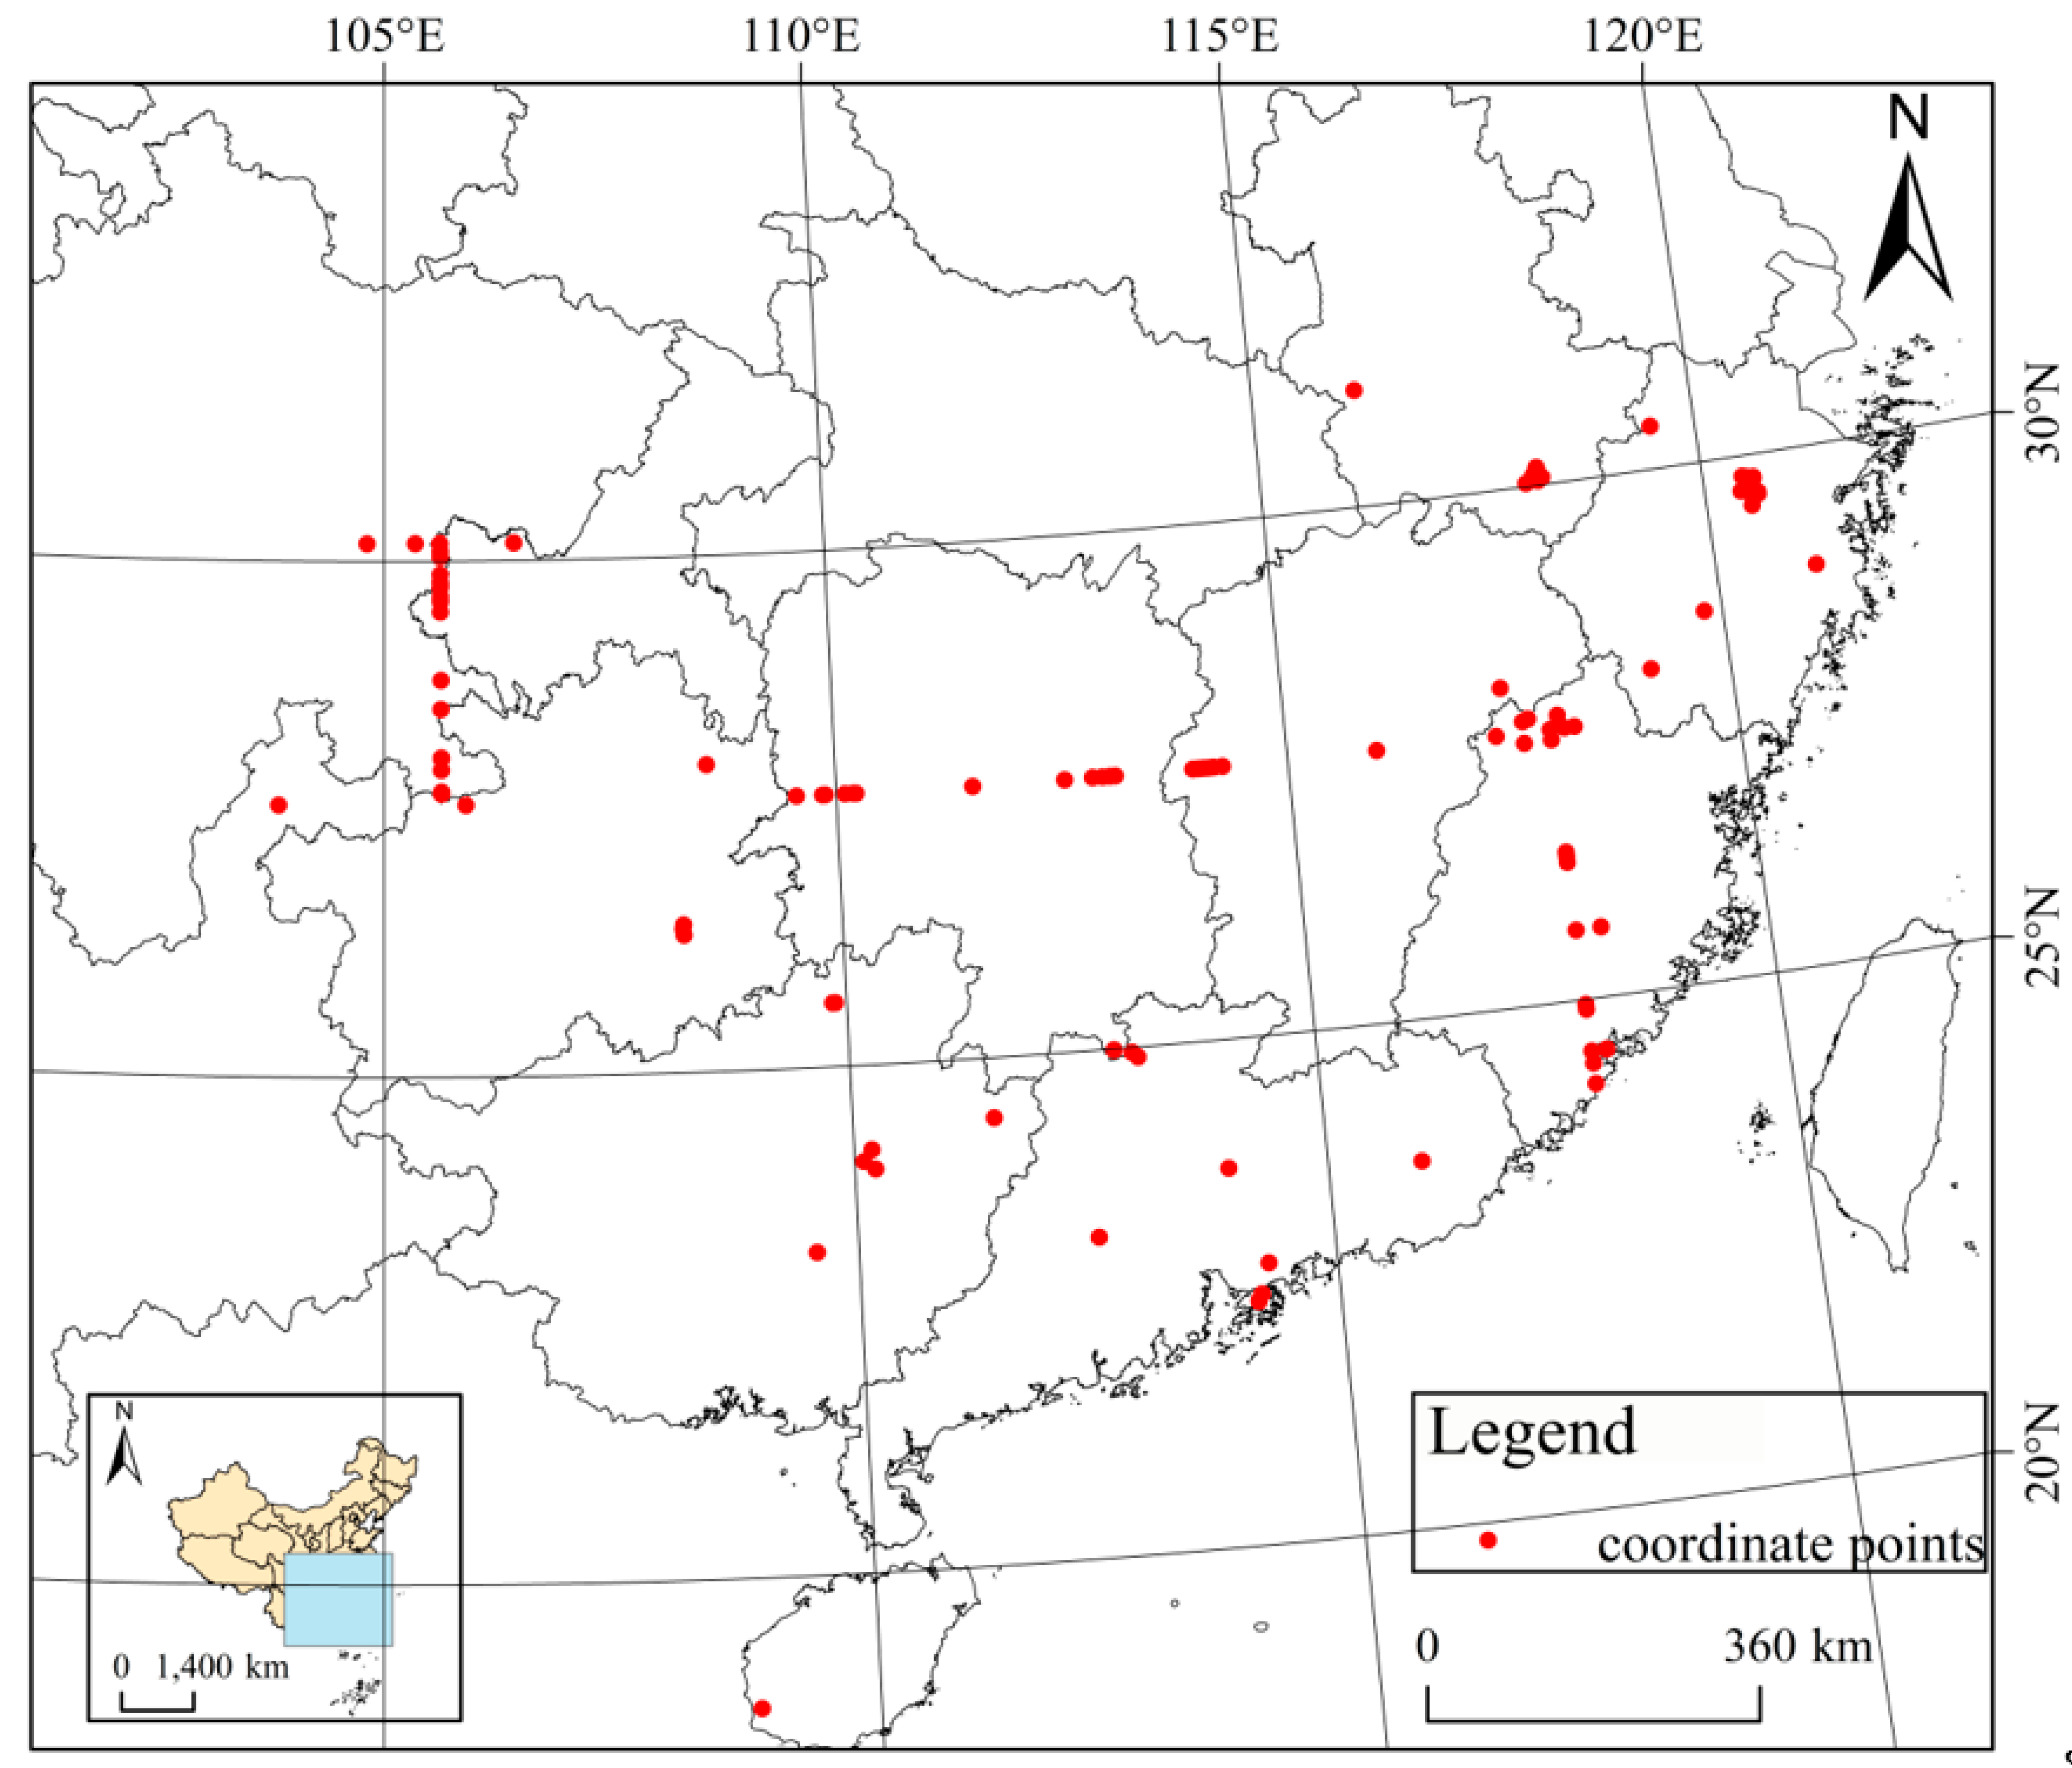
2.1. Data Collection and Processing

The distribution points information of Q. spinosa in this study comes from the Global Biodiversity Information Facility (GBIF; https://www.gbif.org/, accessed on 6 March 2022) [30]. After retrieval, a total of 1779 distribution records of Q. spinosa was obtained. Through https://jingweidu.51240.com/, the longitude and latitude information of Q. spinosa was determined, and the data without detailed geographic location, duplicate specimens, and location deviations were excluded. Finally, 130 geographical distribution points of Q spinosa were screened. We converted the obtained sample point data into .csv format and used ArcGIS 10.2 to draw a map of Q. spinosa distribution in China (Figure 1).
Human footprints data were downloaded from the Socioeconomic Data and Applications Center (SEDAC, https://sedac.ciesin.columbia.edu, accessed on 22 April 2022) [31]. Altitude and 19 bioclimatic variables in current (1970–2000), future 2050s (2041–2060), and future 2070s (2061–2080) were downloaded from WorldClim (http://www.worldclim.org/). The future (2050s, 2070s) climatic variables were selected from two of the four greenhouse gases (RCP2.6 and RCP8.5) under the general climate system mode proposed in the fifth assessment report of IPCC—AR5—representing the lowest and highest scenarios of greenhouse gas emissions [32]. The Chinese province boundary map was downloaded from the Institute of Geographic Sciences and Natural Resources Research, Chinese Academy of Sciences (http://www.resdc.cn/). All data have a unified resolution of 2.5 min, the coordinate system was WGS 1984, and was converted to “asc” with ArcGIS 10.2 software (Environmental Systems Research Institute, Inc., America).
In order to minimize the bias fitting of the model, the ENMTools package (Package) was used to perform correlation analysis on 21 environmental factors [33]. When the correlation was greater than |0.8|, the variables with small contribution rates were removed. Finally, 10 significant factors were screened out (Table 1).

2.2. Species Distribution Modeling, Optimization, and Evaluation

Optimized maxent model was implemented in the R programming environment using the package ENMeval [34]. We set 5 regularization multiplier values (β, 1, 2, 3, 4, and 5) and adopted 6 features (H, L, LQ, LQH, LQHP, and LQHTP), among which L, Q, H, P, and T were linear, quadratic, hinge, product, and threshold, respectively [35,36]. Finally, the best model parameter combination with the lowest Akaike Information Criterion Correction (AICc) value (delta. AICc = 0) was obtained for the establishment of MaxEnt model.
Q. spinosa distribution occurrence data and selected environmental variables were loaded into the MaxEnt model. The data were randomly divided: 75% of the location point data were used as a training model, with the remaining 25% used for validating the MaxEnt model [37,38]. By default, the maximum number of iterations was set as 10,000, the model was repeated for 10 times, and the predicted results were output in “Cloglog” format and “asc” file type [39]. The maximum number of iterations after optimization is 420. The prediction effect was tested by AUC under the receiver operating characteristic curve (ROC) [40]. AUC value between 0.5 and 0.6 was considered to be unqualified, 0.6~0.7 was poor, 0.7~0.8 was average, 0.8~0.9 was good, and 0.9~1.0 was excellent [34]. When the TSS value was <0.4, the predictive power of the model was considered “poor”, while 0.4–0.8 was considered “good” and 0.8–1 was considered “excellent” [41].

2.3. Classification of Suitable Living Grade of Q. spinosa

The average value of MaxEnt simulation results in each period was imported into ArcGIS 10.2 software, and the model distribution area was divided into suitability grades and visualized [42]. The habitat suitability index was divided into four levels: high-suitability area, medium-suitability area, low-suitability area, and non-suitable area by the Nature Breaks (Jenks) method. They were represented by different colors: red is high-suitability area, yellow is medium-suitability area, green is low-suitability area, and white is non-suitable area. We used ArcGIS raster tools to count the area of suitable areas.

3. Results

3.1. Model Optimization and Accuracy Evaluation

The MaxEnt model was used to simulate the potential distribution areas in different scenarios currently and in future (2050s and 2070s) according to the AICc (the minimum information criterion) for the screened 130 Q. spinosa distribution points and 10 environmental variable layers. The optimal parameter combination of FC = LQHP and RM = 3 is obtained after the optimization of the ENMeval program package. At this time, AICc is the smallest and delta.AICc = 0. The optimized AICc and the difference between the AUC value of the training set and the AUC of the test set are both lower than the default settings (Table 2).
The MaxEnt simulations for modern and future (2050s and 2070s) time periods with optimal parameters are performed, and the AUC results are shown in Figure 2. The values of the area under the receiver operating characteristic curve were all greater than 0.95 (Table 3). The true skill statistics were all greater than 0.8 (Table 3). In conclusion, the optimized MaxEnt model has high reliability in the prediction results of the potential suitable areas of Q. spinosa. The 10 environmental factors used for modeling included 8 climate factors, 1 terrain factor, and 1 anthropogenic factor (Table 1).

3.2. The Importance of Environmental Variables

Percent contribution (PC) and permutation importance (PI) are the main indicators for evaluating the importance of environmental variables. The larger the index value, the higher the importance of environmental variables. The top 5 environmental variables with percent contributions are precipitation of the driest month (bio14, 79.3%), elevation (ele, 5.5%), mean diurnal range (bio2, 3.9%), isothermality (bio3, 3.4%), and temperature seasonality (bio4, 2.6%), accounting for 94.7% in total. The top 5 environmental variables with permutation importance are temperature seasonality (bio4, 40.9%), isothermality (bio3, 20.0%), precipitation of the driest month (bio14, 11.7%), minimum temperature of the coldest month (bio6, 9.6%), and elevation (ele, 8.2%), accounting for 90.4% of the total.
The Jackknife test results show (Figure 3F–H) that test gain, regularized training gain, and AUC are basically the same without variables and with all variables. When only variables are used, the top five factors with the largest test gain, regularized training gain, and AUC are precipitation of the driest month (bio14), mean diurnal range (bio2), minimum temperature of the coldest month (bio6), precipitation of the warmest quarter (bio18), and temperature seasonality (bio4), indicating that these five environmental factors have the greatest impact on the distribution of Q. spinosa. In conclusion, the precipitation of the driest month, temperature seasonality, elevation, isothermality, and minimum temperature of the coldest month are the dominant variables affecting the distribution of Q. spinosa.
The environmental variables (>0.63) were the most suitable for the survival of Q. spinosa when the precipitation of the driest month was 28.4–166.1 mm, the altitude was 79.6–635.8 m, the minimum temperature of the coldest quarter was 0.1–9.0 °C, the temperature seasonality was 584.0–821.3, and the isothermality was 21.2–28.0 (Figure 3A–E).

3.3. Current and Future Potential Suitable Areas and Their Spatiotemporal Changes

The distribution range of the potential suitable habitats of Q. spinosa in the future is generally the same, mainly in Hunan, Hubei, Guangxi, Fujian, Zhejiang, Anhui, Jiangxi, Guizhou, Guangdong, Sichuan, Taiwan, Hong Kong, and other provinces (Figure 4a–e). According to the MaxEnt simulation results, the modern potential total suitable area of Q. spinosa is 1.65 × 10⁶ km2, accounting for 17.19% of the total land area in China, including the high-suitability area of 4.9 × 10⁵ km2, accounting for 5.10%; the medium-suitability area of 6.3 × 10⁵ km2, accounting for 6.56%; and the low-suitability area of 5.3 × 10⁵ km2, accounting for 5.52% (Table 4; Figure 4f). In the future 2050s, the proportion of the total suitable area for the frog under high-concentration (RCP8.5) and low-concentration (RCP2.6) emission scenarios will be 17.92% and 18.33%, respectively. In the future 2070s, the proportions of the total suitable area of Q. spinosa under the high-concentration (RCP8.5) and low-concentration (RCP2.6) emission scenarios will be 17.29% and 17.71%, respectively, which are higher than the modern 17.19% (Table 4). In the future 2050s and 2070s, the proportion of suitable areas under the high-concentration emission scenario (RCP2.6) is larger than that under the low-concentration emission scenario (RCP 8.5).
Compared with the current time period, the proportion of high-suitability areas in the 2050s and 2070s was reduced. Under the future low-concentration emission scenario (RCP2.6), the area of the low-suitability area first increased and then decreased, but was higher than that of the present time; the area of the medium-suitability area was the smallest in 2050s and the largest in 2070s; and the high-suitability area showed a decreasing trend. Under the future high-concentration emission scenario (RCP8.5), the areas of medium- and low-suitability areas both increased first and then decreased but were higher than that of the current generation; and the areas of high-suitability areas decreased first and then increased, but were lower than that of the current generation.
Compared with the current potential distribution range of Q. spinosa, the newly added potentially suitable areas of 2050s-RCP2.6, 2050s-RCP8.5, 2070s-RCP2.6, and 2070s-RCP8.5 were all larger than the lost areas, increasing by 60,000, 20,000, 130,000, and 80,000 km2, respectively, accounting for 3.64%, 1.21%, 7.88%, and 4.85% of the modern area, respectively (Table 5). In the future, the potential suitable area of Q. spinosa showed a trend for migration to the northwest and north, and the potential suitable area in the south gradually decreased. In the future 2050s and 2070s, the loss areas are mainly in Yunnan, Guizhou, Guangdong, Taiwan, Jiangsu, and other provinces, and the newly added areas are mainly in Sichuan, Gansu, and Qinling (Figure 5). Under the future low-concentration emission scenario (RCP 2.6), Yunnan is both the main increase area and the main loss area of suitable habitat. Under the high-concentration emission scenario (RCP 8.5), more suitable habitats of Q. spinosa were lost in Yunnan, and the loss area increased with time (Figure 5).
Under the low-concentration emission scenario (RCP2.6), the increase in the area of suitable areas increased from 3.64% in the 2050s to 7.88%. Under the high-concentration emission scenario (RCP8.5), the area ratio increases from 1.21% in the 2050s to 4.45% in the 2070s. Under the low-concentration emission scenario in the future 2070s, the area of suitable habitats will increase the most (Table 5).

4. Discussion

4.1. Rationality of Model

Currently, among the reported species distribution models, the MaxEnt model has better stability and higher accuracy, and has less distortion in dealing with group temperature and precipitation factors [43,44,45]. Amphibians are ectothermic animals, and the external environment, especially temperature, precipitation, and so on, is the main restricting factor for their growth and development [46,47,48]. In this paper, temperature, altitude, and precipitation related to the characteristics of amphibians are selected as the main climatic factors, and climatic extreme values are selected to make related predictions. This study uses the ENMeval program package to optimize MaxEnt to reduce the degree of overfitting and sampling bias, improving the prediction accuracy [49,50]. The model prediction results shows that the AUC and TSS values of the current and future time periods (2050s and 2070s) are all greater than 0.95 and 0.80, respectively, indicating the high accuracy and distinguishing ability of the prediction results. The results of the optimized MaxEnt model showed that the potential suitable habitats of the vulnerable species Q. spinosa were mainly in the provinces south of the Qinling Mountains in China, which was basically consistent with the reported distribution range of Q. spinosa [51,52,53,54].

4.2. Main Environmental Factors Affecting the Distribution of Q. spinosa

Q. spinosa is a water-dwelling frog [55], which mainly inhabits the areas beside streams in mountainous areas, and temperature and water sources have an important impact on its survival [56]. Altitude is closely related to temperature changes to a certain extent. The results of the Jackknife, AUC, PC, and PI tests indicated that the importance of precipitation in the driest month, temperature seasonality, elevation, isothermality, and the mean temperature of the coldest quarter played a major role in affecting the distribution of Q. spinosa. This is similar to Rana hanluica [57] and Buergeria oxycephala [8], but the precipitation factor has a lower gain on the distribution model of Buergeria oxycephala, which may be related to the lower water dependence of its adult frog habitat. The distribution of Odrrana hainanensis is less affected by temperature, humidity, and sunshine, which may be related to the fact that its study area is located in the equatorial tropics [2]. While Q. spinosa is a cold-water frog with a small suitable temperature range and a distribution area mainly located in the subtropical region, large changes in temperature and precipitation have a great impact on its distribution. The main factors influencing their potential distribution varied among the five species of Scutiger [6]. The precipitation of the warmest quarter and temperature seasonality are the main factors affecting the potential distribution of Rana heaviness [7]. In summary, different species have different ecological requirements, and the main environmental factors affecting their potential distribution are also different.
This study is basically consistent with the findings of Zou et al. [58]. The results show that the most suitable habitat altitude of Q. spinosa is 79.6–635.8 m. However, Liu [55] found that the distribution range of Q. spinosa was 150–1000 m above sea level, while Fei et al. [59] found that it was 300–1500 m, and Liang et al. [60] found that it was 700–800 m. The reason may be related to climate change in recent years, sample bias, and different sampling intensities. When the altitude was lower than 79.6 m or higher than 635.8 m, the suitability of Q. spinosa decreased dramatically. The lower elevations in the south are mainly plains, where human dwellings congregate, and water is plentiful, but summer temperatures are high. Higher altitudes, however, are not conducive to the survival of Q. spinosa due to the low temperatures and low biodiversity combined with the lack of water and food. From the 1950s to 2007, the annual precipitation in the central region of South China decreased year by year, and the temperature showed an upward trend [61]. The changes in temperature and precipitation were related to the altitude [62,63,64], which led to the change in the habitat altitude of Q. spinosa. When the mean diurnal range is 3.5–7.7 °C and the max temperature of the warmest month is 29.5–34.3 °C (Figure 6), it is most suitable for the survival of Q. spinosa, which is basically consistent with the reports [16,51]. Southern China is dominated by a subtropical monsoon climate, with rain and heat in the same period. The Q. spinosa is optimally distributed in areas with a warmest quarter precipitation of 549.5–850.9 mm, which is basically consistent with the precipitation climate in southern China [61].
In this study, the human footprint refers to the pressure humans put on the environment. This factor has little effect on the distribution of Q. spinosa, which may be due to the fact that the human capture factor is not included in this environmental data and the living area of Q. spinosa is mainly near mountain streams.

4.3. Changes in Potential Suitable Areas

Compared with the current time period, under the two emission scenarios in the future, the area of low-suitability areas increased more than that of high-suitability areas, and the area of potentially suitable areas showed an overall upward trend. Under the low-concentration emission scenario, the area of suitable habitat for Q. spinosa showed an increasing trend, and maintaining the low-concentration emission scenario would expand the suitable habitat distribution range of Q. spinosa; however, the high-suitability area gradually decreased. Under the high-concentration emission scenario, the size of the suitable area first increased and then decreased. Although the area of the high-suitability area increased in the 2070s, it was still smaller than the current time period.
The prediction results of the optimization model showed that the distribution area of Q. spinosa tended to expand to the north and northwest in the future, which is mainly reflected in the increase in the potentially suitable areas in Qinling, Sichuan, Gansu, and other provinces. During the past century of climate change in China, the eastern region showed a decreasing trend for precipitation as a whole [65], the accumulated temperature in the southern region showed an increasing trend, the high-accumulated-temperature region gradually decreased from the southeast to the northwest, and the annual precipitation in the central region of the south decreased year by year [61]. Q. spinosa is a cold-water frog with an optimal survival temperature of 22–26 °C, and 80% of its life cycle is in water. Mountainous areas have good water retention, with the reduction of ice and snow providing water replenishment, which explains the expansion direction of the future suitable area for Q. spinosa and the reduction in high-suitability areas.

4.4. Resource Conservation of Q. spinosa

Based on the goal of striving to achieve peak carbon by 2030 and carbon neutrality by 2060 (referred to as the “dual carbon” goal) [66], China’s energy structure is continuing to transition to green energy. Although carbon emissions continued to grow for the fourth consecutive year, with an increase of 0.6%, the carbon emission intensity decreased by 1%, and the overall carbon emission per unit of GDP showed a downward trend and is now only 0.7 (2018) [67]. For carbon emissions trading, relevant policies have been issued to standardize the operation of the carbon market [68]. From the perspective of economic and social development status and energy structure, China’s carbon neutrality goal still faces many challenges and uncertainties [69]; however, China is committed to improving the ecological environment and promoting harmonious coexistence between man and nature. China’s carbon peak by 2030 and carbon neutrality by 2060 can be expected.
Global warming, the increase in harsh climates, and man-altered mountains and rivers have greatly affected the ecological balance of biological habitats. Q spinosa feeds on live insects [27,70], and climate change may indirectly affect the survival and distribution of its prey organisms, leading to the frog migrating to more suitable habitats. Comprehensive analysis shows that the changes in environmental climate since modern times have caused some changes in the habitat of Q. spinosa, and it tends to be in areas with an altitude of about 600 m, small temperature differences, and excellent water sources.
The following suggestions should be helpful for the conservation of Q. spinosa resources. First of all, under the “dual carbon” goal, the state should further strengthen the coupled management of resources and establish and improve a sustainable forest resource management mechanism, which is of great significance to further improve the natural ecosystem. Secondly, the state should put Q. spinosa on the list of protected animals in China, prohibiting the sale and capture of wild Q. spinosa. Thirdly, the state should further clarify the prohibited types and prohibited areas of pesticides, or limit the amount of use. Finally, we need to take multiple measures to protect the natural population of Q. spinosa, such as in situ protection, ex situ protection, proliferation and release, etc. Priority protection can only be achieved when the whole of society works together.

5. Conclusions

In this study, the MaxEnt model for Q. spinosa provided satisfactory results. The prediction results can provide an important reference for wild Q. spinosa development and protection. Frog diversity conservation and biogeographical research are enriched by our results. Q. spinosa is mainly distributed around the streams in the mountains of southern China. Climate is one of the important factors for the distribution of Q. spinosa. In the future, maintaining a low-carbon life could alleviate climate deterioration and protect the habitat of spiny chestnut frogs. In addition, improving mountain and wildlife protection strategies is also important.

Author Contributions

J.H. conceived the study. J.X. designed the study. J.H. processed the data, performed the analyses, analyzed the results, and wrote the manuscript. J.X., D.L. and X.L. edited the manuscript. All authors have read and agreed to the published version of the manuscript.

Funding

This research was funded by [National Natural Science Foundation of China] grant/award number [31772832]; [National Key Research and Development Program of China] grant/award number [2019YFD0900603]; [Hunan Provincial Modern Agricultural Research System] grant/award number [2019-105].

Institutional Review Board Statement

Not applicable.

Informed Consent Statement

Not applicable.

Data Availability Statement

All data generated by this study are available from the corresponding author upon reasonable request.

Acknowledgments

Thanks to the reviewers for their constructive and valuable comments and the editors for their assistance in refining this article.

Conflicts of Interest

The authors declare no conflict of interest.

References

  1. Soberon, J.; Peterson, A.T. Interpretation of models of fundamental ecological niches and species’ distributional areas. Biodivers. Inform. 2005, 2, 1–10. [Google Scholar] [CrossRef] [Green Version]
  2. Huang, Y.; Lu, J.; Wang, F.; Lin, Y.; Liu, L.; Mi, H.; Fangxu, M.; Fang, J.; Jialing, L. Predicting the potential geographical distribution of Hainan odorous frog (Odorrana hainanensis) in Hainan province. Chin. J. Zool. 2017, 1, 30–41. [Google Scholar] [CrossRef]
  3. Ward, D.F. Modelling the potential geographic distribution of invasive ant species in New Zealand. Biol. Invasions 2007, 9, 723–735. [Google Scholar] [CrossRef]
  4. Zhu, G.; Bu, W.; Gao, Y.; Liu, G. Potential geographic distribution of brown marmorated stink bug invasion (Halyomorpha halys). PLoS ONE 2012, 7, e31246. [Google Scholar] [CrossRef] [PubMed]
  5. Pearson, R.G.; Raxworthy, C.J.; Nakamura, M.; Townsend Peterson, A.J.J.o.b. ORIGINAL ARTICLE: Predicting species distributions from small numbers of occurrence records: A test case using cryptic geckos in Madagascar. J. Biogeogr. 2007, 34, 102–117. [Google Scholar] [CrossRef]
  6. Zhao, Z.; Xiao, N.; Liu, G.; Li, J. Prediction of the potential geographical distribution of five specices of Scutiger in the south of hrngduan Mountains Biodiversity Conservation Priority Zone. Acta Ecol. Sin. 2022, 42, 2636–2647. [Google Scholar]
  7. Zhang, K.; Yang, K.; Wo, Y.; Tong, H.; Jin, Y.; Jin, Y. Suitability evaluation of potential geographic distribution for Rana zhenhaiensis based on MaxEnt. Chin. J. Ecol. 2018, 37, 164–170. [Google Scholar] [CrossRef]
  8. Mu, S.; Qi, X.; Xie, L.; Qian, T.; Zhou, Z.; Lu, Y.; Mo, Y.; Li, P. MaxEnt-based prediction on the geographical distribution of Hainan stream treefrog (Buergeria oxycephala) in Hainan island. Chin. J. Wildl. 2021, 42, 809–816. [Google Scholar] [CrossRef]
  9. Zhou, W.W.; Zhang, B.L.; Chen, H.M.; Jin, J.Q.; Yang, J.X.; Wang, Y.Y.; Jiang, K.; Murphy, R.W.; Zhang, Y.P.; Che, J. DNA barcodes and species distribution models evaluate threats of global climate changes to genetic diversity: A case study from Nanorana parkeri (Anura: Dicroglossidae). PLoS ONE 2014, 9, e103899. [Google Scholar] [CrossRef] [Green Version]
  10. Nottingham, S.; Pelletier, T.A. The impact of climate change on western Plethodon salamanders’ distribution. Ecol. Evol. 2021, 11, 9370–9384. [Google Scholar] [CrossRef]
  11. Zhao, Z.; Xiao, N.; Shen, M.; Li, J. Comparison between optimized MaxEnt and random forest modeling in predicting potential distribution: A case study with Quasipaa boulengeri in China. Sci. Total Env. 2022, 842, 156867. [Google Scholar] [CrossRef]
  12. Long, J.; Hou, J.; Zhou, W.; Xiang, J.; Pan, W. Analysis of karyotype in Quasipaa spinosa. J. Anhui Agric. Sci. 2021, 49, 95–97+103. [Google Scholar]
  13. Long, J.; Xiang, J.; He, T.; Zhang, N.; Pan, W. Gut microbiota differences during metamorphosis in sick and healthy giant spiny frogs (Paa spinosa) tadpoles. Lett. Appl. Microbiol. 2020, 70, 109–117. [Google Scholar] [CrossRef] [PubMed]
  14. Xiang, J.G.; He, T.Y.; Wang, P.P.; Xie, M.; Xiang, J.; Ni, J.J. Opportunistic pathogens are abundant in the gut of cultured giant spiny frog (Paa spinosa). Aquac. Res. 2018, 49, 2033–2041. [Google Scholar] [CrossRef]
  15. Ye, C. Rare and Economical Amphibians of China; Sichuan Science and Technology Press: Sichuan, Chian, 1993. [Google Scholar]
  16. Zhou, W.; Li, J.; Hou, J.; Xiang, J.; Pan, W. Culture technology of Quasipaa spinosa (first)—Site selection and design. Curr. Fish. 2021, 46, 80–81. [Google Scholar]
  17. Liang, Z.; Xu, Q.; Jiang, Y.; Qin, J.; Deng, W. Breeding situation and development strategy of Rana spinosa in Yongfu County. Guangxi J. Anim. Husb. Vet. Med. 2013, 29, 244–246. [Google Scholar]
  18. Chan, H.K.; Shoemaker, K.T.; Karraker, N.E. Demography of Quasipaa frogs in China reveals high vulnerability to widespread harvest pressure. Biol. Conserv. 2014, 170, 3–9. [Google Scholar] [CrossRef]
  19. Gao, S. Annals of Animal Medicine in China; Jilin Science and Technology Publishing House: Jilin, China, 1996. [Google Scholar]
  20. Mei, Y.; Zheng, R.; Zheng, S.; Yan, H.; Liu, Z.; Hong, Y. Gonad differentiation and the effects of temperature on sex determination in Quasipaa spinosa. Acta Ecol. Sin. 2018, 38, 4809–4816. [Google Scholar]
  21. Yu, Z.; Ma, B. Status of the Quasipaa spinosa industry in Jiangxi. Jiangxi Fish. Sci. Technol. 2012, 130, 4–8. [Google Scholar] [CrossRef]
  22. Hou, J.; Long, J.; Xiang, J.; Pan, W.; Li, D.; Liu, X. Ontogenetic characteristics of the intestinal microbiota of Quasipaa spinosa revealed by 16S rRNA gene sequencing. Lett. Appl. Microbiol. 2022, 75, 1182–1192. [Google Scholar] [CrossRef]
  23. Yu, S.S.; Zhao, Z.H.; Gong, X.F.; Fan, X.L.; Lin, Z.H.; Chen, J. Antimicrobial and immunomodulatory activity of beta-defensin from the Chinese spiny frog (Quasipaa spinosa). Dev. Comp. Immunol. 2022, 126, 104264. [Google Scholar] [CrossRef] [PubMed]
  24. Lei, X.P.; Yi, G.; Wang, K.Y.; OuYang, P.; Chen, D.F.; Huang, X.L.; Huang, C.; Lai, W.M.; Zhong, Z.J.; Huo, C.L.; et al. Elizabethkingia miricola infection in Chinese spiny frog (Quasipaa spinosa). Transbound Emerg. Dis. 2019, 66, 1049–1053. [Google Scholar] [CrossRef] [PubMed]
  25. Liu, Z.P.; Gu, W.B.; Wang, S.Y.; Wang, L.Z.; Zhou, Y.L.; Dong, W.R.; Shu, M.A. Functional differences of three CXCL10 homologues in the giant spiny frog Quasipaa spinosa. Dev. Comp. Immunol. 2020, 109, 103719. [Google Scholar] [CrossRef] [PubMed]
  26. Wang, X.D.; Xie, Y.G.; Hu, W.; Wei, Z.Y.; Wei, X.Y.; Yuan, H.; Yao, H.Y.; Dunxue, C. Transcriptome characterization and SSR discovery in the giant spiny frog Quasipaa spinosa. Gene 2022, 842, 146793. [Google Scholar] [CrossRef]
  27. Hou, J.; Zhou, W.; Li, J.; Xiang, J.; Pan, W. Culture technology of Quasipaa spinosa (V)—Commercial frog farming. Curr. Fish. 2021, 6, 68. [Google Scholar]
  28. Zhou, W.; Li, J.; Hou, J.; Xiang, J.; Pan, W. Breeding technology of Quasipaa spinosa (III)—Tadpole breeding. Curr. Fish. 2021, 46, 80+82. [Google Scholar]
  29. Li, J.; Zhou, W.; Hou, J.; Xiang, J.; Pan, W. Breeding technology of Quasipaa spinosa (IV)—Feeding and management during metamorphosis. Curr. Fish. 2021, 46, 75–79+81. [Google Scholar]
  30. Global Biodiversity Information Facility (GBIF) Occurrence Download. Available online: https://www.gbif.org/occurrence/download/0173717-210914110416597 (accessed on 6 March 2022).
  31. Venter, O.; Sanderson, E.W.; Magrach, A.; Allan, J.R.; Beher, J.; Jones, K.R.; Possingham, H.P.; Laurance, W.F.; Wood, P.; Fekete, B.M.; et al. Last of the Wild Project, Version 3 (LWP-3): 2009 Human Footprint, 2018 Relisades; NASA Socioeconomic Data and Applications Center (SEDAC): Palisades, NY, USA, 2018. [Google Scholar] [CrossRef]
  32. Shi, W.; Zhu, E.; Wang, Y.; Ma, F.; He, Q.; Yi, C. Prediction of potentially suitable distribution area of Propomacrus davidi Deyrolle in China based on MaxEnt model. Chin. J. Ecol. 2021, 40, 2836–2944. [Google Scholar] [CrossRef]
  33. Warren, D.L.; Glor, R.E.; Turelli, M. ENMTools: A toolbox for comparative studies of environmental niche models. Ecography 2010, 33, 607–611. [Google Scholar] [CrossRef]
  34. Phillips, S.J.; Dudik, M. Modeling of species distributions with Maxent: New extensions and a comprehensive evaluation. Ecography 2008, 31, 161–175. [Google Scholar] [CrossRef]
  35. Carlson, C.J.; Burgio, K.R.; Dougherty, E.R.; Phillips, A.J.; Bueno, V.M.; Clements, C.F.; Castaldo, G.; Dallas, T.A.; Cizauskas, C.A.; Cumming, G.S.; et al. Parasite biodiversity faces extinction and redistribution in a changing climate. Sci. Adv. 2017, 3, e1602422. [Google Scholar] [CrossRef] [Green Version]
  36. Chen, Q.H.; Yin, Y.J.; Zhao, R.; Yang, Y.; da Silva, J.A.T.; Yu, X.N. Incorporating local adaptation into species distribution modeling of paeonia mairei, an endemic plant to China. Front. Plant Sci. 2020, 10, 1717. [Google Scholar] [CrossRef] [PubMed]
  37. Rabinowitz, T.; Polsky, A.; Golan, D.; Danilevsky, A.; Shapira, G.; Raff, C.; Basel-Salmon, L.; Matar, R.T.; Shomron, N. Bayesian-based noninvasive prenatal diagnosis of single-gene disorders. Genome Res. 2019, 29, 428–438. [Google Scholar] [CrossRef] [PubMed] [Green Version]
  38. Yuan, Y.D.; Tang, X.G.; Liu, M.Y.; Liu, X.F.; Tao, J. Species distribution models of the Spartina alterniflora loisel in its origin and invasive country reveal an ecological niche shift. Front. Plant Sci. 2021, 12, 738–769. [Google Scholar] [CrossRef] [PubMed]
  39. Li, X.; Huang, Y.; Ruan, T.; Wei, W. Maxent model-based evaluation og habitat suitability of Chinese red panda in Qionglai mountains. J. Guizhou Norm. Univ. Nat. Sci. 2022, 40, 34–39. [Google Scholar] [CrossRef]
  40. Tin, A.; Marten, J.; Kuhns, V.L.H.; Li, Y.; Wuttke, M.; Kirsten, H.; Sieber, K.B.; Qiu, C.X.; Gorski, M.; Yu, Z.; et al. Target genes, variants, tissues and transcriptional pathways influencing human serum urate levels. Nat. Genet. 2019, 51, 1459–1474. [Google Scholar] [CrossRef] [Green Version]
  41. Allouche, O.; Tsoar, A.; Kadmon, R. Assessing the accuracy of species distribution models: Prevalence, kappa and the true skill statistic (TSS). J. Appl. Ecol. 2006, 43, 1223–1232. [Google Scholar] [CrossRef]
  42. Wang, W.; Li, Z.J.; Zhang, Y.L.; Xu, X.Q. Current Situation, Global Potential Distribution and Evolution of Six Almond Species in China. Front. Plant Sci. 2021, 12, 619883. [Google Scholar] [CrossRef]
  43. Elith, J.; Graham, C.H.; Anderson, R.P.; Dudík, M.; Ferrier, S.; Guisan, A.; Hijmans, R.J.; Huettmann, F.; Leathwick, J.R.; Lehmann, A.J.E. Novel methods improve prediction of species’ distributions from occurrence data. Ecography 2006, 29, 129–151. [Google Scholar] [CrossRef] [Green Version]
  44. Merow, C.; Smith, M.J.; Silander, J.A. A practical guide to MaxEnt for modeling species’ distributions: What it does, and why inputs and settings matter. Ecography 2013, 36, 1058–1069. [Google Scholar] [CrossRef]
  45. Phillips, S.J.; Anderson, R.P.; Schapire, R.E. Maximum entropy modeling of species geographic distributions. Ecol. Model. 2006, 190, 231–259. [Google Scholar] [CrossRef] [Green Version]
  46. Bull, C.M.; Burzacott, D. Changes in climate and in the timing of pairing of the Australian lizard, Tiliqua rugosa: A 15-year study. J. Zool. 2002, 256, 383–387. [Google Scholar] [CrossRef]
  47. Lin, W. Studies on the Physiology and Biochemistry of Juvenile Quasipaa Spinosa and the Growth and Breeding Technology of Year-Round Phenology; Fuzhou University: Fuzhou, China, 2017. [Google Scholar]
  48. Soares, C.; Brito, J.C. Environmental correlates for species richness among amphibians and reptiles in a climate transition area. Biodivers. Conserv. 2007, 16, 1087–1102. [Google Scholar] [CrossRef]
  49. Kong, W.; Li, X.; Zou, H. Optimizing MaxEnt model in the prediction of species distribution. Chin. J. Appl. Ecol. 2019, 6, 2116–2128. [Google Scholar] [CrossRef]
  50. Ye, X.; Zhang, M.; Lai, W.; Yang, M.; Fan, H.; Zhang, G.; Chen, S.; Liu, B. Prediction of potential suitable distribution of Phoebe bournei based on MaxEnt optimization model. Acta Ecol. Sin. 2021, 41, 8135–8144. [Google Scholar]
  51. Chen, Q. Physiological and Ecological Studies and the Annual Growth and Culture Techniques of Rana spinosa Tadpoles; Fuzhou University: Fuzhou, China, 2017. [Google Scholar]
  52. Kong, S. Interspecific Hybridization of Quasipaa spinosa and Hybrid Tadpole Fitness Research; Zhejiang Normal University: Jinhua, China, 2017. [Google Scholar]
  53. Xie, Y.; Wei, Z.; Wei, X.; Luo, H.; Chen, D. Acute Toxicity of four conventional disinfectants in aquaculture on tadpoles of Quasipaa spinosa. Fish. Sci. 2021, 1–10. [Google Scholar] [CrossRef]
  54. Zhang, D. Molecular Basis of Local Adaptation and Speciation of Quasipaa spinosa; Zhejiang Normal University: Jinhua, China, 2020. [Google Scholar] [CrossRef]
  55. Liu, C.; Hu, S. The Tailless Amphibians of China; Science Press: Beijing, China, 1961. [Google Scholar]
  56. Tao, Z.; Ma, B.; Yu, Z.; Huang, J.; Zhang, H.; Zhang, A.; Li, Z.; Zhu, G. Effects of environmental factors on the growth of Rana spinosa tadpole. Hunan Agric. Sci. 2015, 2, 55–56+59. [Google Scholar]
  57. Xia, X.; Li, Y.; Yang, D.; Pi, Y. Potential geographical distribution of Rana hanluica in China under climate change. Chin. J. Appl. Ecol. 2021, 32, 4307–4314. [Google Scholar] [CrossRef]
  58. Zou, M.; Zhong, Y. Ecological investigation and artificial trial culture observation of Quasipaa spinosa in northwest Fujian. Chin. J. Zool. 1986, 3, 4–8. [Google Scholar] [CrossRef]
  59. Fei, L.; Ye, C.; Jiang, J. Color Map of Amphibians and Their Distribution in China; Sichuan Science and Technology Press: Sichuan, Chian, 2012. [Google Scholar]
  60. Liang, R.; Dong, Y. Ecological survey of Rana spinosa. J. Anhui Norm. Univ. Nat. Sci. 1984, 1, 30–38. [Google Scholar]
  61. Zhao, J.; Yang, X.; Liu, Z.; Cheng, D.; Wang, W.; Chen, F. The possible effect of global climate changes on cropping systems boundary in China II. The characteristics of climatic variables and the possible effect on northern limits of cropping systems in south China. Sci. Agric. Sin. 2010, 43, 1860–1867. [Google Scholar] [CrossRef]
  62. Guo, Y.; Zhao, Y.; Zhou, Y.; Huang, Q.; Yu, Z.; Gu, Z. Diurnal variation of summer precipitation and its relationship with altitude in Tianshan Mountains of Xinjiang. Arid Land Geogr. 2022, 1, 57–65. [Google Scholar]
  63. Miao, W.; Liu, S.; Zhu, Y.; Duan, S.; Han, F. Spatio-temporal differentiation and altitude dependence of temperature and precipitation in Meili Snow Mountains. Clim. Chang. Res. 2022, 18, 328–342. [Google Scholar]
  64. Yang, Q.; Ma, Z.; Chen, L. A preliminary study on the relationship between precipitation trend and altitude in China. In Proceedings of the 28th Annual Meeting of the Chinese Meteorological Society—S17 3rd Annual Meeting of Graduate, Xiamen, China, 1 November 2011; p. 138. [Google Scholar]
  65. Zhang, H.; Zhang, Q.; Liu, Q.; Yan, P. Analysis on variation characteristics and differences of the Climate drying degree between South and North of China. Plateau Meteorol. 2016, 35, 1339–1351. [Google Scholar] [CrossRef]
  66. Zhao, R.; Huang, X.; Yun, W.; Wu, K.; Chen, Y.; Wang, S.; Lu, H.; Fang, K.; Li, Y. Key issues in natural resource management under carbon emission peak and carbon neutrality targets. J. Nat. Resour. 2022, 37, 1123–1136. [Google Scholar] [CrossRef]
  67. Tian, S. Study on impact of “Operation Green Fence” on China’s carbon emission. Jiangxi Univ. Financ. Econ. 2021. [Google Scholar] [CrossRef]
  68. Yin, Y.; Chang, X. Does China’s carbon emission trading policy promote regional green total factor productivity? Financ. Econ. 2022, 3, 60–70. [Google Scholar] [CrossRef]
  69. Normile, D. Can China, the world’s biggest coal consumer, become carbon neutral by 2060? Science 2020. [Google Scholar] [CrossRef]
  70. Wang, S. Comparative study on tadpole growth and development of Quasipaa spinosa introduced from different places and local species. Mod. Agric. Sci. Technol. 2010, 278–279. [Google Scholar]
Figure 1. Confirmed coordinate distribution of Quasipaa spinosa in China.
Biology 12 00366 g001
Figure 2. AUC value of Q. spinosa predicted by MaxEnt model.
Biology 12 00366 g002
Figure 3. Response curves and Jackknife test of the environment variables. (AE) Respectively represent the response curves of isothermality, temperature seasonality, min temperature of coldest month, precipitation of driest month and Altitude. (FH) The contribution of each environmental factor to each scenario using the Jacknife test in In test gain, regularized training gain and AUC, respectively.
Biology 12 00366 g003
Figure 4. Potential distribution area of Q. spinosa under different scenarios. (ae) Predicted distribution map of different suitable areas of Q. spinosa at current, 2050s and 2070s. (f) Statistical maps of different suitable areas of Q. spinosa in China at different periods.
Biology 12 00366 g004
Figure 5. Spatial transformation pattern of Q. spinosa suitable area in different periods. (a) Greenhouse gas emission concentration is lowest in 2041–2060; (b) greenhouse gas emission concentration is highest in 2041–2060; (c) greenhouse gas emission concentration is lowest in 2061–2080; (d) greenhouse gas emission concentration is highest in 2061–2080. The increase and loss of suitable areas are derived and compared to current area.
Biology 12 00366 g005
Figure 6. Response curve of the partial environment variables. (AC) Respectively represent the response curves of mean diurnal range, max temperature of warmest month and precipitation of warmest quarter.
Biology 12 00366 g006
Table 1. Various parameters of the main environmental variables of Q. spinosa.
Environmental VariablesDescriptionUnitPC (%)PI (%)
eleElevationm5.58.2
bio2Mean Diurnal Range°C3.93.2
bio3Isothermality-3.420.0
bio4Temperature Seasonality-2.640.9
bio5Max Temperature of Warmest Month°C0.60
bio6Min Temperature of Coldest Month°C1.99.6
bio14Precipitation of Driest Monthmm79.311.7
bio15Precipitation Seasonality-1.62.9
bio18Precipitation of Warmest Quartermm0.71.9
peopleHuman Foot-0.51.7
Table 2. Evaluation metrics of MaxEnt model generated by ENMeval.
TypeFCβdelta. AICcavg. diff. AUC
DefaultLQHPT1101.90030.1211
OptimizedLQHP300.1008
FC: feature combination; RM: regulatory multiplier; AICc: LQPH: linear features (L) + quadratic features (Q) + product features (P) + hinge features (H); LQH: linear features (L) + quadratic features (Q) + hinge features (H); delta. AICc: the minimum information criterion AICc value; avg. diff. AUC: difference between the AUC value.
Table 3. Evaluate the AUC and TSS index values of the MaxENT model.
Current50s-RCP2.650s-RCP8.570s-RCP2.670s-RCP8.5
AUC0.962 ± 0.00730.958 ± 0.00730.958 ± 0.00730.959 ± 0.00720.959 ± 0.008
TSS0.817 ± 0.0140.813 ± 0.0090.804 ± 0.0100.822 ± 0.0150.818 ± 0.015
Note: The values in the table are expressed as “mean ± standard deviation”.
Table 4. Area statistics of suitable areas for Q. spinosa under different climate scenarios.
CircumstancesLow SuitabilityMedium SuitabilityHigh SuitabilityAll
Area (×104 km2)Percentage (%)Area (×104 km2)Percentage (%)Area (×104 km2)Percentage/%Area (×104 km2)Percentage (%)
Current535.52636.56495.1016517.19
2050s-RCP 2.6676.98586.04474.9017217.92
2050s-RCP 8.5666.88676.98434.4817618.33
2070s-RCP 2.6616.35646.67414.2716617.29
2070s-RCP 8.5646.67616.35454.6917017.71
Note: The area percentages are the ratios of the suitable areas of different grades to the national land area (960 × 104 km2) under different climate scenarios.
Table 5. Spatial variations in suitable habitat for Q. spinosa in different periods.
CircumstancesArea (×104 km2)Rate of Change (%)
GainLossChangeGainLossChange
2050s-RCP2.614868.484.853.64
2050s-RCP8.59725.454.241.21
2070s-RCP2.61851310.913.037.88
2070s-RCP8.514688.483.644.85
Note: The rate of change is the percentage of the area of each period and the area of the contemporary suitable area. The current Q. spinosa area of the potential suitable habitat is 165 × 104 km2.
Disclaimer/Publisher’s Note: The statements, opinions and data contained in all publications are solely those of the individual author(s) and contributor(s) and not of MDPI and/or the editor(s). MDPI and/or the editor(s) disclaim responsibility for any injury to people or property resulting from any ideas, methods, instructions or products referred to in the content.

