
An Assessment Framework for the Transformation of Mobility 4.0 in Smart Cities

1
Department of Engineering Management (Ph.D. Program), Institute of Pure and Applied Science, Marmara University, Göztepe Campus, Istanbul 34722, Turkey
2
Department of Industrial Engineering, Faculty of Engineering, Marmara University, R.T.E. Campus, Istanbul 34840, Turkey
*
Author to whom correspondence should be addressed.
Systems 2022, 10(1), 1; https://0-doi-org.brum.beds.ac.uk/10.3390/systems10010001
Submission received: 9 November 2021
/
Revised: 8 December 2021
/
Accepted: 21 December 2021
/
Published: 23 December 2021
(This article belongs to the Special Issue The Enabling Role of Industry 4.0 for Customer Centricity and Environmental Sustainability)
Abstract
:Investing in digital transformation turns out to be a strategic action to tackle contemporary issues and to improve competitiveness for enterprises. The high variability of options in the digital transformation process enforces a higher complexity level in configuring and setting up objectives and goals based on cities’ needs; hence, a systematic approach is required to assist decision makers for better and sustainable transformation. A reference model is described in this paper to support decision makers with comprehensive assessment data for digital transformation cities transport. The proposed reference model assesses the cities based on digital transformation of transport services to assist policy makers for better decisions in transforming the Mobility 4.0. The proposed model in this study functions as a knowledge-based systematic framework for assessing the capabilities of the cities, diagnosing their needs under given circumstances and identifying the best fitting workflow for digital transformation of urban transportation systems and related services. The reference model takes on board a group of smart city indices with respective assessment criteria in determining a smartness level of transportation components. A conceptual 4-tier smartness scale has been proposed to establish a consistent assessment subject to cities circumstances in many respects. The reference model has been formalised into a mathematical model to characterise the assessments. The mathematical model encompasses strategic assessments by experts to identify priorities of investments in the digitalization process, which are aligned with strategic goals and policies of cities’ management.
1. Introduction
Transport services are the primary set of operations that impact city life [1]. Limited resources and facilities make transportation management critical [2]. For authority of transportation, services such as traffic congestion, environmental pollution, accessibility, public transport, parking lots, freight distribution, and pricing prioritise the main concerns and respective operations need to be carried out that are of high quality, cost effective and efficient. Most require a comprehensive set of knowledge, investments and business capabilities to facilitate computer support with digital technologies and artificial intelligence, inevitable in dealing with relevant challenges.
Local city governments aim to make their cities as attractive as possible not only for people to live, but also for investors to improve the respective facilities and infrastructure [3]. Resources for cities, such as highway infrastructure and parking spaces, are limited. These limited resources are used together for freight and passenger transport. It is known that transportation policies implemented on limited resources will affect all stakeholders. Traffic safety practices, freight transport restrictions, pedestrianisation and green logistics practices should be evaluated together with freight and passenger transport stakeholders. An integrated approach is recommended in determining the required level of digital transformation intelligence in the implementation of policies. For this reason, while determining the transportation policies to be evaluated, it is expected that the cities will cover the freight and passenger services in the transportation transformation. It is now clear that digital transport opens up new opportunities for cities. Even so, as with all other services, identifying the needs and priorities to transform the right services in the right places and for the right purpose, becomes one of the main concerns. The requirements and necessities of digitalisation must, therefore, be carefully analysed.
Digitalisation implies digitising business processes using information and communication (ICT) infrastructure, which is supported by digital technologies, including artificial intelligence [4,5]. Attempting to receive potential benefits provided by ICT, it is necessary to perform a comprehensive analysis of the business process and define key areas to be digitalised. In this way, it will be possible to define the right set of digital capabilities for the correct need of the city. It will also enable the reduction of costs, ensure effective resource utilisation and effective management. Furthermore, this may contribute to the smartness of the city and foster the concept of a smart city [6].
Transforming smart cities is a complex system and many parameters must be taken into account in the decision-making process. The economic development of the city, the level of ICT infrastructure, the population of the city and its geographical features may be the determining parameters. In the case of smart mobility systems, parameters such as traffic density, current transportation physical capacity, traffic safety and mobility rate can be evaluated. The major methods used for the assessment schemes of smart city applications are mostly based on expert opinions (52%). In addition, as examined by Sharifi [7], other methods used include literature reviews (33%), stakeholder consultation (11%) and best practices analysis (4%). A framework that uses a hybrid approach based on the above methods in smart city assessments would be beneficial for city policy makers. A general digital transformation framework approach, expressed mathematically, will assist policy makers make decisions about investing in the smart cities.
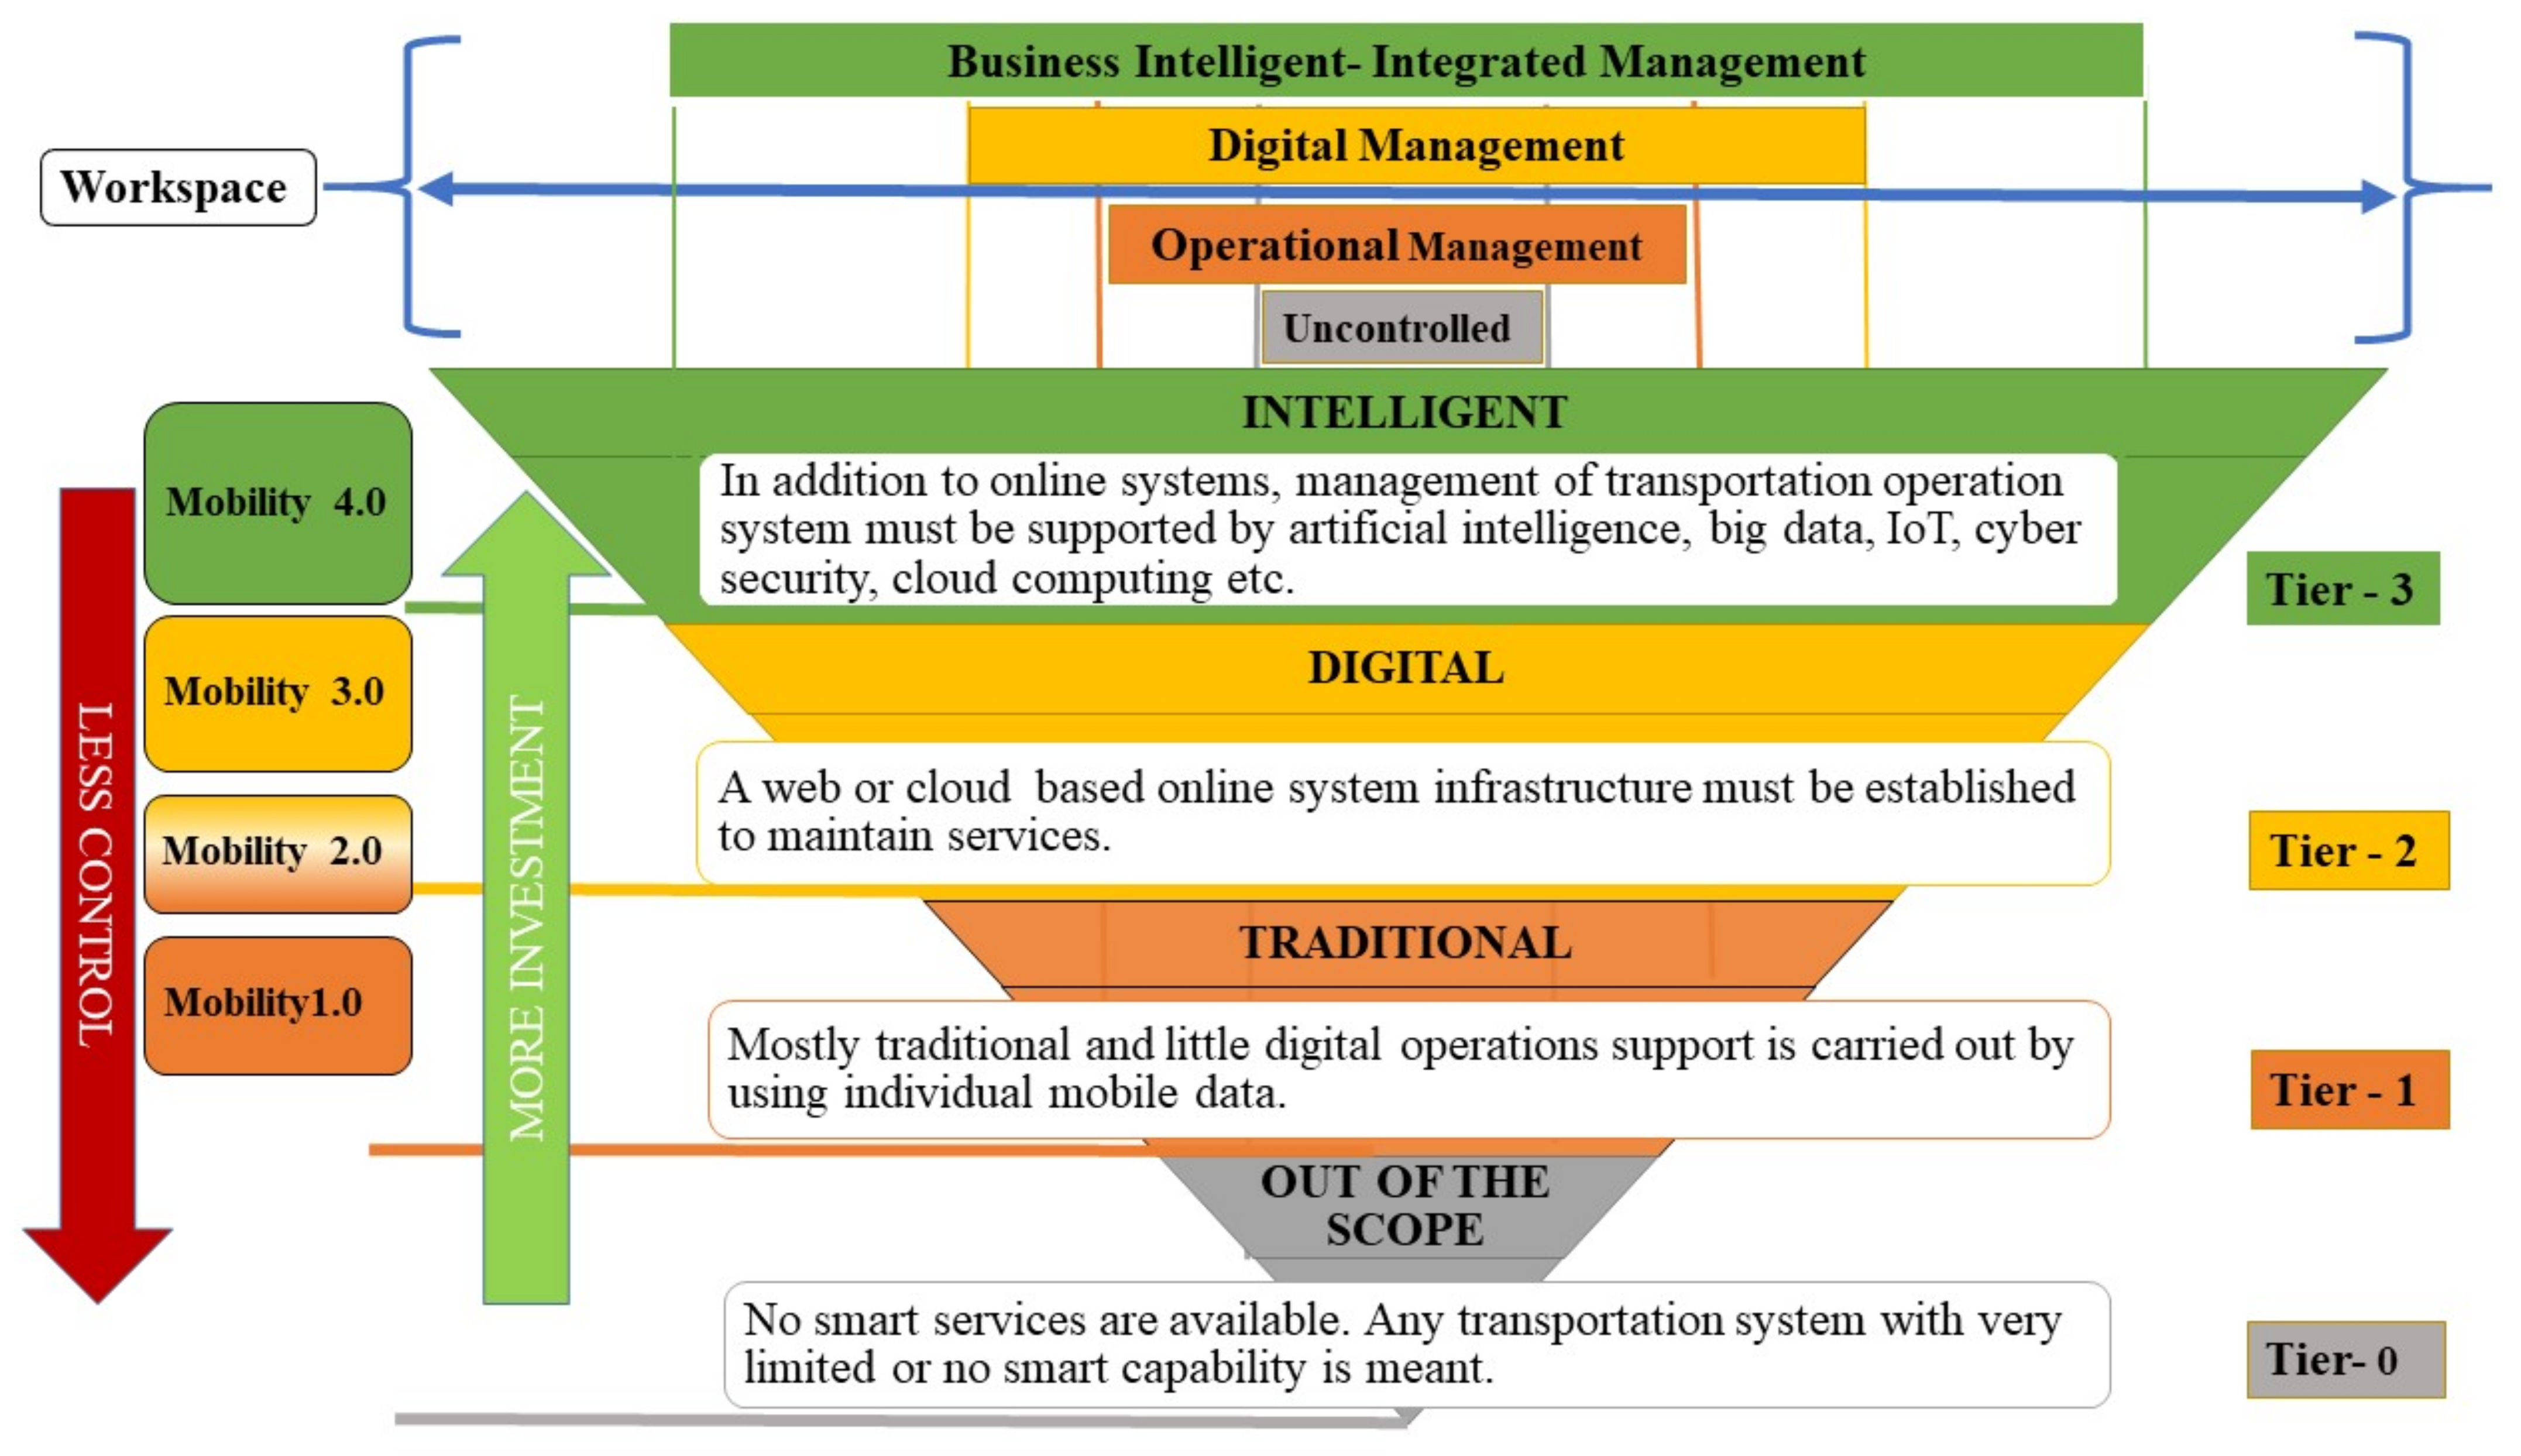
As the digitisation requirements for transportation services are explained above, the process appears to be very complex and requires in-depth analysis and systematic modelling capability. To the best knowledge of the authors and based on the literature review carried out, it seems that no model is available to assess the digital capability of integrated transportation authorities. Although assessment models have been developed for assessing the digital transformation of the enterprises are introduced and reviewed in the literature (see [8] for more information), they are rather generic and are implementable to enterprises on an abstract level or to only some degree of detail. A comprehensive model seeking digital capabilities of transportation services from various aspects seems to be missing. This study intends to fill this gap, in addition to the models proposed mainly based on visual inspection or operational analysis. The literature hardly provides an integrated transportation model of any sort represented by a mathematical model. With this respect, the proposed model is a good initiative to generate the mathematical model, which could then be implemented in optimising the respective digitalisation practices. As part of the explanation above, the frame of the reference model to be used in the transformation of smart cities developed as part of the study is shown in Figure 1.
The reference model is designed as a 4-tier model, including “out of scope”, “traditional”, “digital” and “intelligent”. Each tier indicates the level of smartness. Traditional systems are transforming themselves to digital ones, and digital services are transforming to autonomous systems, which are capable of self-decision making and performing operations with no or little human intervention. Especially, with the rise of industry 4.0 (see [8] for more information), mobility 4.0 becomes a key issue in digital transportation. This is to enrich transportation services with intelligent capabilities and provide solutions to public problems with artificial intelligence technologies (see [9] for more information). In the reference model proposed, if no need emerges for a digital application, it is considered as an “out of scope” case. If the respective operations and services are running with no or little digital support, it considers that services run on a “traditional” level (Mobility 1). If the respective transformation services are conducted with fully or highly significantly digital processes, then, the system level is upgraded to “digital” level (Mobility 2 and Mobility 3) and last but not least, enriching the services with intelligent capabilities transform themselves to “intelligent” level (Mobility 4).
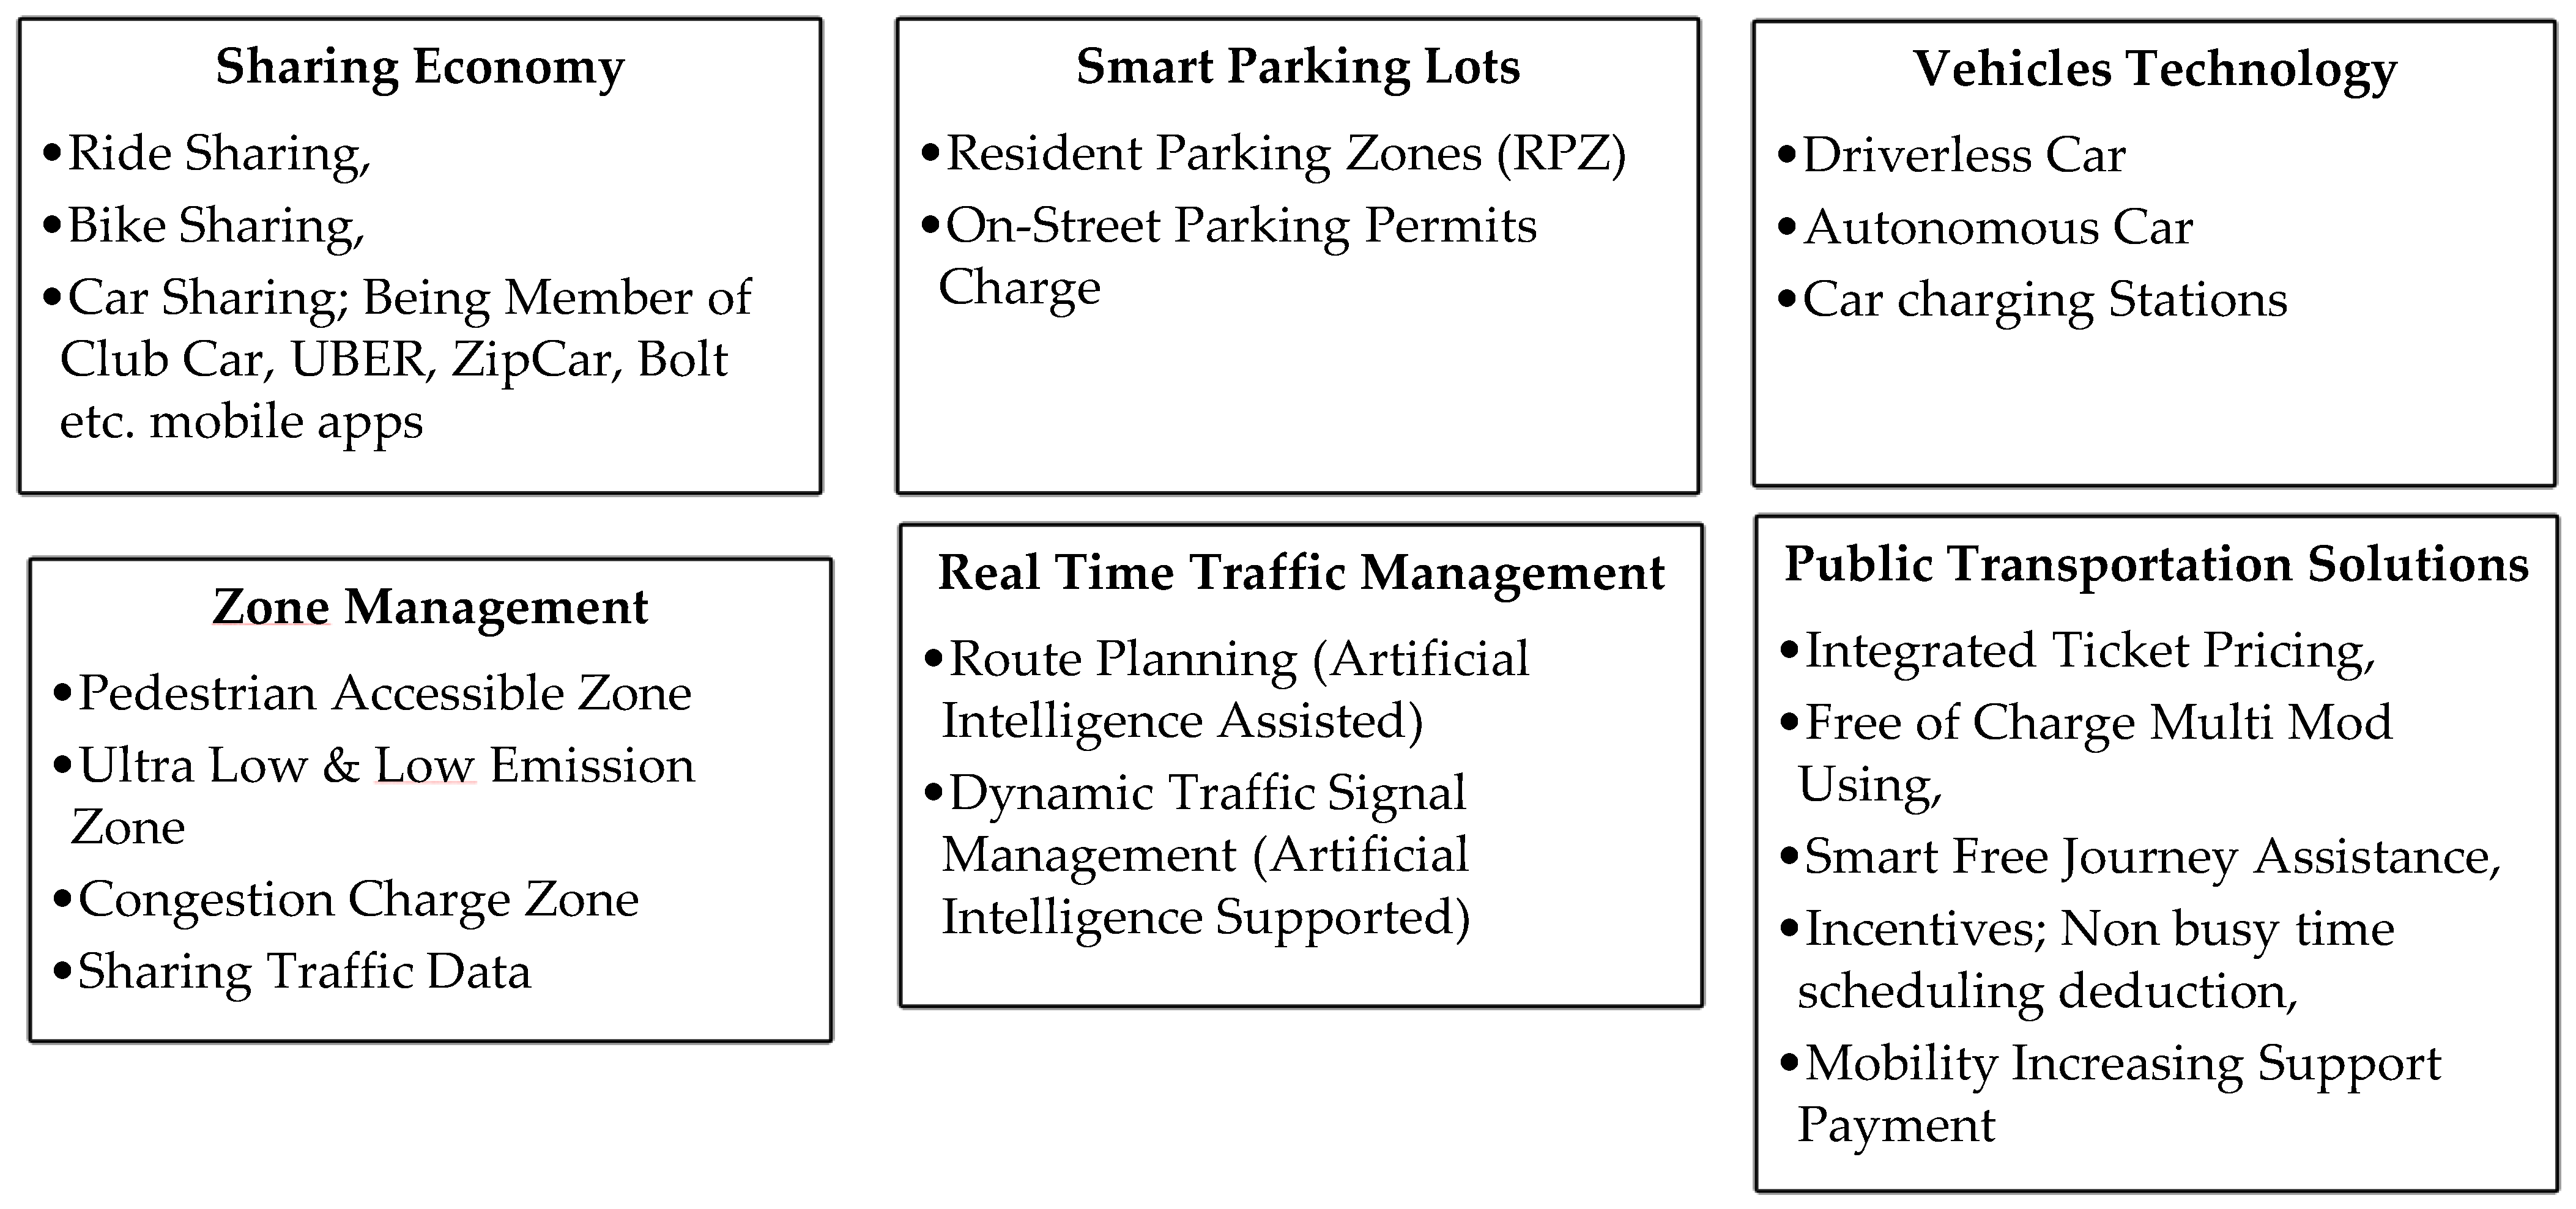
The tier-4 smartness level, which encompasses Mobility 4.0 phases covering today and the near future, is called the period of smart mobility in this study. In the period of Mobility 4.0; cyber physical system components such as artificial intelligence, big data and internet of things are expected to be widely used in transportation services. This period adopts the use of integrated transportation systems in the proposed model approach. Today, transportation service components are managed in an integrated manner in digitalised cities with developed economies. Main sub-components of Mobility 4.0 using in this model are shown in Figure 2.
Since the transportation services are important components of the smart city, the digitalisation is expected to solve some major problems such as, traffic congestion, lack of public transport capacity and lack of infrastructure, fuel consumption for increasing or reducing emissions; see [10,11,12] for some of the urban transport problems that would be sorted out effectively through digital services. Obviously, the transportation community seeks better solutions for utilising digital technologies and tries to make the systems increasingly more capable in dealing with complex problems generated by urban traffic.
2. Related Works
The relevant literature as well as city applications covering the last decade has been reviewed in connection with the titles of “Smart City” “Mobility 4.0 transformation”, “integrated transportation management”, “digitalisation of transport management” and “smart mobility”. Especially, a holistic mathematically expressed reference model for the evaluation of the smartness level of the integrated transportation management for the city is sought. Note that in creating smart mobility systems, a subsystem of smart cities requires expensive investments. It is thought that the reference model that will guide practitioners in the right way will heavily lead to important gains. The answers to the questions of how the smart city management models should be built and maintained are to be elaborated. Similarly, the review is based on the understanding that there is a need for a reference model that takes into account expert opinions and will guide the smart transformation of the cities especially from the transportation point of view. Thus, the review is extended to investigate an applicable baseline model that can assess capabilities of smart mobility transformation through an integrated transportation management approach for cities. Furthermore, there has been many strategies on digital transportation of cities together with transportation services. This topic is well addressed mostly around smart cities and intelligent transportation. The review would not be complete if the respective strategies are not taken into account. Generally speaking, the literature survey revealed that there is a limited number of studies on assessing the digitalisation capacity and capability of city management with respect to transformation of transportation. Therefore, the review is focussed on understanding basic components of smart transportation activities with respective components and services. This study is justified based on this review as explained below.
In the literature, smart mobility is usually associated with smart city applications as the transportation is one of the main components of city management [13]. There has been several research studies about smart city management such as concept of a smart city management [14] intelligent transportation infrastructure capability levels [15], multi-stakeholder co-creation analysis experience [16], information management in the smart city [17] and modelling frameworks for integrated planning and management [18]. These involve specific data analysis, sharing of experiences and conceptual suggestions. Moreover, there has been little research about smart mobility transformation research such as intelligent vehicle network system management [19], mobility management [20], and “Smart Urban Mobility Management” general architecture [21]. A common characteristic of those studies is that they involve technological infrastructure transformation proven by some case studies.
Having smart transport system capabilities requires the use of some level of ICT infrastructure [22], new investments [23], the implementation of new transportation policies [24] and expertise, as well as some key performance indicators to monitor [25]. Integrated services based on technology appears inevitable [26]. It is also clear that the experience of various types of smart transportation expertise and other expertise must be brought together. For the success of the assessment, expert views should be aligned with all of the success factors described [27]. However, it may not be possible to gather all the experts. Literature research on assessing the capabilities of smart cities and the maturity of cities was also reviewed. According to a study in which current smart city maturity models are reviewed [28], it is stated that there is a limitation in determining the next level of progress and providing guidance between maturity levels. However, the studies on measuring the degree of smartness and digital transportation so transformation systems are limited. Therefore, it would be useful to develop a reference model to assess the components of transportation in terms of smart city indicators.
It is well-known that the assessment of the digital capabilities of the cities is conducted using a set of indicators. The methodology primarily used in the literature is index-based comparative studies. Some of those are listed below.
Each indicator represents different characteristics of the city under assessment. All criteria are brought together in order to make decisions, which would usually be affected by the opinion of the assessor. For interpreting the criteria values, some methods such as the (weighted) linear aggregation, the (weighted) arithmetic mean, the (weighted) geometric mean and the (weighted) geometric aggregation of the variable scores [7] are utilised. Over the past few years, knowledge-based systems and expert views have been preferred in the literature as well [56]. This article introduces a systematic approach to assist the decision-making process. Similarly, the literature also revealed that it is essential to identify a set of principles and a generic reference model to define the areas to be digitalised with respect to the needs of the cities and to guide the practitioners for making better decisions [57,58].
Besides models developed for smart city implementations concentrating on assessing the current situation, little information is provided with respect to future developments. When it comes to the assessment of the digital transformation of transportation services, studies mainly concentrate on comparative studies rather than pointing out true needs and requirements of the respective authority. Moreover, few studies take the strategic priorities of the city management into account. The literature reveals the fact that there is a need for a comprehensive (integrated, flexible, adaptable and wholly covered) assessment model for not only identifying the level of existing smartness but also highlighting possible areas of improvements with respect to strategic objectives and priorities. This study intends to fill this gap by providing a reference model taking operational, tactical and strategical issues into account. To the knowledge of the authors and based on the literature survey carried, the literature out does not reveal any mathematical model for handling the complexity of the process has not been studied. Therefore, the reference model proposed in this paper is focused on sustaining smart transportation and achieving some target and strategic objectives. The reference model also enables the generation of a road map on the basis of capabilities and capacities of the cities for possible implementations. In order to determine the points where a city is suitable for transformation, the components of transportation management will be analysed and suggestions will be made for the prioritized investment areas.
As a result of the review process, it was clearly revealed that the digital transformation of cities is generally understood as the use of communication and technological infrastructures for the benefit of society. However, assessing the effectiveness of transformation plans still needs to be analysed with proper assessment methods. It was not also possible to reach mathematical models developed for this purpose. It seems that the mathematical analysis should be carried out from various aspect of the assessment. A reference model proposed in this paper is one of the attempts along this line.
3. Proposed Model
This section provides the mathematical structure of the reference model that to be used by decision makers in cities to assess their decisions and investments in digital transformation. Consequently, the model proposes investment priorities for the digitalization targets of the city to be evaluated and the transport service components. Various algorithmic implementations of this mathematical model can be developed based on various sets of assumptions and circumstances of different platforms. A case study section follows help understand the implementation of the mathematical model.
The model proposed has some essential components. One of them is “the goal”. There are 4 different goals to be taken into account. These are:
- G (O) (G: Goals) where the policy makers may choose some of the components for not being taken into account in the assessment and no investment on transportation is planned. Here O represent “out of scope”.
- G (T) indicates systems which the decision makers is wishing to run using traditional methods for the time being. “T” in this case represents “Traditional System”.
- G (D) indicates that the respective component is run with digital capabilities where “D” indicates “digital” applications.
- G (I) shows that the respective component has a smart capability that is why “I” indicates “intelligent” functions.
Taking these into account, the model runs two sub-goals to determine the management smartness level for each transportation component (sub-goal 1) and to prioritise the transportation component to be transformed (sub-goal 2) with a strategic focus.
The model architecture is justified based on the preferences and request of the policy makers regardless of how good and effective those. Thus, it allows the defining of set of indicators so called indexes to be used in the assessment as well as judging the strategy chosen. With this respect the model can be considered a generic reference model for which the city management or decision makers fills out their expectation and run the model to see the effect of their choices over city characteristics such as population, historical background, transportation capacity, mobility based statistics and economic power.
Based on the request (strategic expectations of the policy makers) and respective set of parameters, the model is executed in such a way that it provides some information regarding to the level of smartness in respective transportation services.
The architecture and execution of the model is explained in more detail in the following paragraphs and in the case study.
Level of Smartness is indicated as 0 ≤ (G (O), G (T), G (D), G (I)) ≤ 1 where closing to 0 means (for G (O) and G (T)) the respective city’s transportation services have no need for digital transformation. On the other hand, the 1 approach (for G (D) and G (I)) means that the city concerned should have digital or smart system improvement targets transport services.
The main architecture of the model for each sub component of smart mobility (Xj) includes “component assessment” (g (Xj)) and “strategically focused priority” (Sfj), which have been evaluated with expert opinion and use the proposed model.
Sub-Goal 1, which estimates the Smartness Level of Each Transport Management Components is represented by g(Xj).
The Strategic focus determines different strategies and transformation priorities for the users. This increases the effectiveness of the model dynamically in the decision-making process. Since it is known that the cities will dynamically have strategic focal points based on sustainable, liveable and people-oriented principles, the transportation components determined by the opinions of the experts on this issue were evaluated comparatively. Four strategic approaches have been adopted in the proposed model:
- general (Sgj);
- people oriented (Spj);
- function oriented (Scj);
- possibility based (Sej).
The general model approach does not provide a ranking priority among the model’s recommendations by preserving the main model results. People oriented strategy has been associated with “citizen priority” and “liveability”. Function oriented strategy is a strategy approach focused on “sustainability”. Finally, possibility based strategy is considered as a strategic approach focused on “cost-benefit”.
Sub-Goal 2 is to indicate transformation priority of mobility services is given by
Sfj = [Sgj, Spj, Scj, Sej]
Sfj = Strategy focused assessment for jth subcomponent of Smart Mobility priority, by Sfj = [Sgj, Spj, Scj, Sej], j = {1,2,…,J}
Decision variable Xj is used to define the smartness level of transportation component j. It is an integer variable, where Xj = {0; Out of the Scope, 1; Traditional, 2; Digital, 3; Intelligent}.
The transformation requirements in terms of expert opinions (represented by αjn) are also taken into account. Note that the following parameters are used for embedding expert opinions into the model. The suggested indicators in the assessment of the transition of the transportation systems through to Smart City Indexes (SCIs) are as follows: Efficiency, Mobility, Traffic Safety, Pollution and Public Transportation Capacity.
- Efficiency (capacity management: population, economic power of city, technological infrastructure of city, current transportation physical capacity, etc.);
- Traffic congestion levels (traffic congestion index);
- Travel time management (index for mobility);
- Incident management, traffic safety, accident rate (index for traffic accident);
- Real-time information about transportation services and parking;
- Integrated public transport system and its quality, diversity, and multimodality (index for operational efficiency);
- Street/pedestrian zone smart/reflexive lighting management system using ICT (index for accessibility);
- Pollution reduction (share of total trips made by active (non-motorized)/public transport modes).
Although the indexes selected in the general model were determined by expert opinions, the opportunity to determine the index group to be used in its own digital transformation was provided for each city. The relevant value ranges of SCIs to be used in the model are defined using 5- or 2-point Likert scales. The number of criteria to be selected among SCIs is specified as N in the general model. Each SCI criterion is denoted by “q”. For the customized model, “qN” represents “N” SCI criteria.
q = Value of the selected City for each criterion where q is a vector of 1 × N integer variables, q = [q1, q2,……, qN]
With expert opinions, the minimum requirement for each transport component is determined at each level of smartness (αjn = [αtjn; αdjn; αijn]) (For general form see in Table 1).
This is defined as αjn is the expert driven parameter of the model.
αjn = jth Sub component of Smart Mobility, and nth minimum requirement by SCI (Related to Expert Opinion) αjn = [αtjn (traditional requirement); αdjn (digital requirement); αijn (intelligent requirement)]
The assessment for each component is made with the Key Performance Index (KPIj = [KPItj; KPIdj; KPIij]) vector.
KPItj = Calculated Key Performance Index (KPI) Value of Traditional Operation for J. Sub component of Smart Mobility. KPItj = [0,1] is a Binary Variable
KPIdj = Calculated Key Performance Index (KPI) Value of Digital Operation for J. Sub component of Smart Mobility. KPIdj = [0,1] is a Binary Variable
KPIij = Calculated Key Performance Index (KPI) Value of Intelligent Operation for J. Sub component of Smart Mobility; KPIij = [0,1] is a Binary Variable.
This section may be divided by subheadings. It should provide a concise and precise description of the experimental results, their interpretation, as well as the experimental conclusions that can be drawn.
With the “Component Assessment” module, Component “J” of the transportation management model are evaluated with expert opinions in terms of digitalisation transformation needs defined in the 4-tier model. The general framework of N indices that can be used to evaluate jth components with the nominal group technique and a 4-tier model is presented in Table 2.
A Preference Function (P (αjn)) is also defined as the function of the evaluation of minimum requirement by Criteria with respect to expert opinion (αjn), performs comparisons and calculates the Key Performance Index (KPIj = [KPItj; KPIdj; KPIij]) values in vector form.
P (αjn) = Preference Function P (αjn) = [P (αtjn); P (αdjn); P (αijn)]
With the component assessment, each component is evaluated with a 4-tier model approach. The evaluation is done with the Preference Function (P (αn) = [P (αtjn); P (αdjn); P (αijn)], which is the function of the expert opinion (αn). The values of the KPIj = [KPItj; KPIdj; KPIij] vector determine the operational processing level of the component. The sub-goal (1) g (XJ) is calculated using KPIJ, which is the matrix of the traditional, digital and intelligent assessment. It is given above Table 2 in General form of multi-criteria assessment approach of proposed model. With traditional assessment Equation (1), digital assessment Equation (2) and intelligent assessment Equation (3) are component assessments shown below.
The determination of the operational operating level for each component is evaluated with the nominal expert opinions determined with an integrated approach. A strategically focused digital transformation decision support model is offered with key performance index with flexible and dynamic model architecture.
The decision space of the model is limited to the options determined by the 4-step operational management level approach. The formulation of the main goal (Equations (4)–(6)) and sub-goal 1 (Equations (7) and (8)) defined for the model is shown below.
Once the model is run, it determines at which operational level each component should be managed. Subsequently, the transformation priorities of these components, whose operating level is determined, are identified strategically. This assessment is repeated for each enquires, specific to the flexible indices chosen by the decision maker and the city qualifications evaluated. This section provides suggestions for the transformation priorities of components according to 4 different strategies for digital transformation components with a strategic focus. Strategy focused assessment (sfj = [sgj; spj; scj; sej]) is modelled as in Equations (9)–(13).
Finally, dynamically prioritization is made with strategically focused assessment function (sfj) for those whose operational management level is determined, and suggestions are made for transformation priorities in different perspectives. The formulation of the sub-goal 2 (Equation (14)) defined for the model is shown in below.
4. Case Study
This case study is introduced to illustrate how the mathematical model proposed above is implemented and how the framework produces successful results. In this context, a scenario analysis was carried out, accepting that the decision makers of the city of London wanted to make a strategic assessment for the digitalisation of transport services. It is acknowledged that the selected groups of the Smart Cities Indexes are evaluated using the expert opinions.
The proposed model is executed with the following information:
- Current situations/values of smart indexes of the city to be evaluated is entered into the model. Twenty indicators are used for the decision maker to include the respective indexes within the model. Note that these indicators are defined by subject matter experts using nominal group techniques as explained below. However, it is possible to update the list with respect to some other considerations and the expectations of the city managements.
- The decision maker is then asked to make his/her choice of strategic priority among four defined strategies as defined earlier.
- The mathematical model is executed with the selected information.
- The results are reported. The decision maker can repeat this process as much as he likes in order to see the effect of various strategies and parameters (indicators) and define those appropriate for the city.
- Based on this assessment, an action plan is to be created for priority of applications. The progress along this line can then be monitored. The model can be executed at any time with the above sequence.
Note that by implementing the above process, one of the objectives of this study is to identify the level of smartness of transportation systems of smart cities using expert opinion by implementing the nominal group technique for 20 smart city indices or parameters to be evaluated. The experts, whose views were consulted in this study, have been selected among those who work in the public and private sectors and have expertise in transport management in various capacities including engineers, specialists and junior/ senior managers, who are actively on duty either in academia or in industry. It should be noted that expert opinions were obtained from 21 experts while developing conceptual and reference models. Note that the experts from the UK or Turkey have at least 5 years of experience in the transportation sector. The main expertise sought was the factors related to the digitalisation of transportation services as well as some indicators of smart cities with respective information on sufficient conditions for the smartness levels as proposed.
For the case study, before setting up, a comprehensive set of parameters for digital and smart transportation services are defined. A hybrid approach for classifying cities was adopted using existing criteria including economic power, infrastructure, innovation and impact on the population. The hybrid criteria used were grouped into three main categories, including Smart City General Indicators (efficiency indexes) (Table 3), Mobility Special Indicators (Table 4) and Current Transportation Capacity (Table 5).
The flexible and dynamic approach that the model offers the decision maker in the decision-making process was considered as a case study. In the smart city review, City of London was selected for the case study, where index values were accessed as open data.
London’s population is 9.6 million. According to Transport of London (TfL), the city’s transport authority, the transportation capacity is 8600 buses, 21,000 cab (taxi), 402 km underground line, 27 km tram line and over 100 ferries. According to the 2020 Tomtom traffic congestion index value, London’s traffic congestion rate is calculated at 27%. London’s crime index value is also 52.67. The level of public transport coverage is 86% of the urban area. The percentage of low-emission areas is 99% of the city’s area.
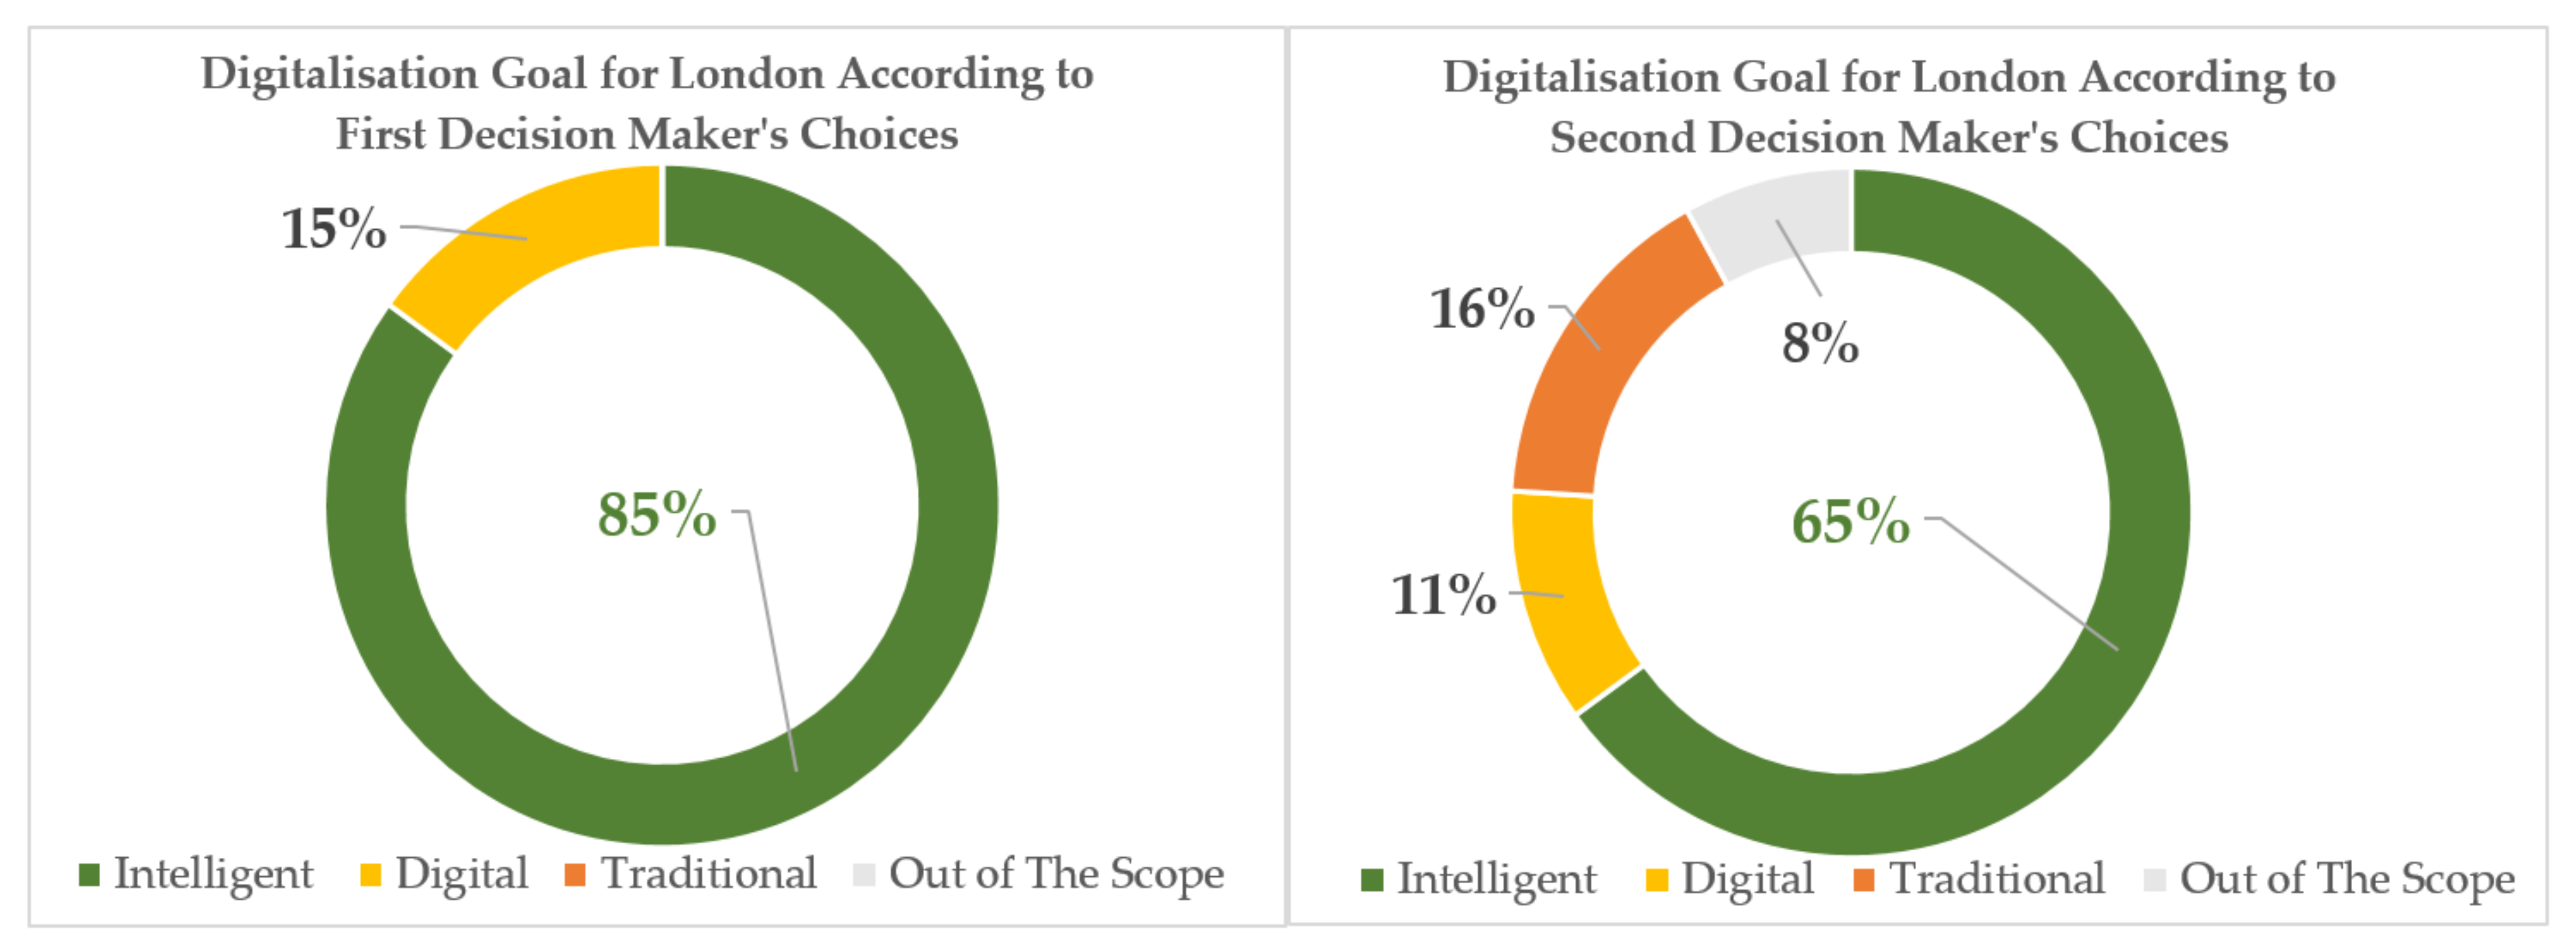
In the case study section, scenario analysis has been carried out for two different decision maker approaches. In the first scenario, the decision maker wants to make an evaluation that adopts the “function oriented (city function)” strategy using all the indices specified in the model. In the second scenario, the decision maker wants to use a decision-making process that does not want to include the efficiency indexes in the model and adopts a “people-oriented” strategy.
The model was run for both scenarios. According to the model’s proposal to the first decision maker, London urban transportation management digital transformation goal, it should be managed with 85% “intelligent” service systems and 15% “digital” service systems. The model digitalisation target proposal according to the preferences of the second decision maker is it consists of 65% “intelligent” service systems, 11% “digital” service systems, 16% “traditional” service systems and 8% “out of scope” services. Figure 3 shows the different digitalisation goals for different scenarios for the City of London.
The model presented different digitalisation targets for the same city in relation to the indices participating in the assessment. This feature provides flexibility to decision makers for digitalisation considerations.
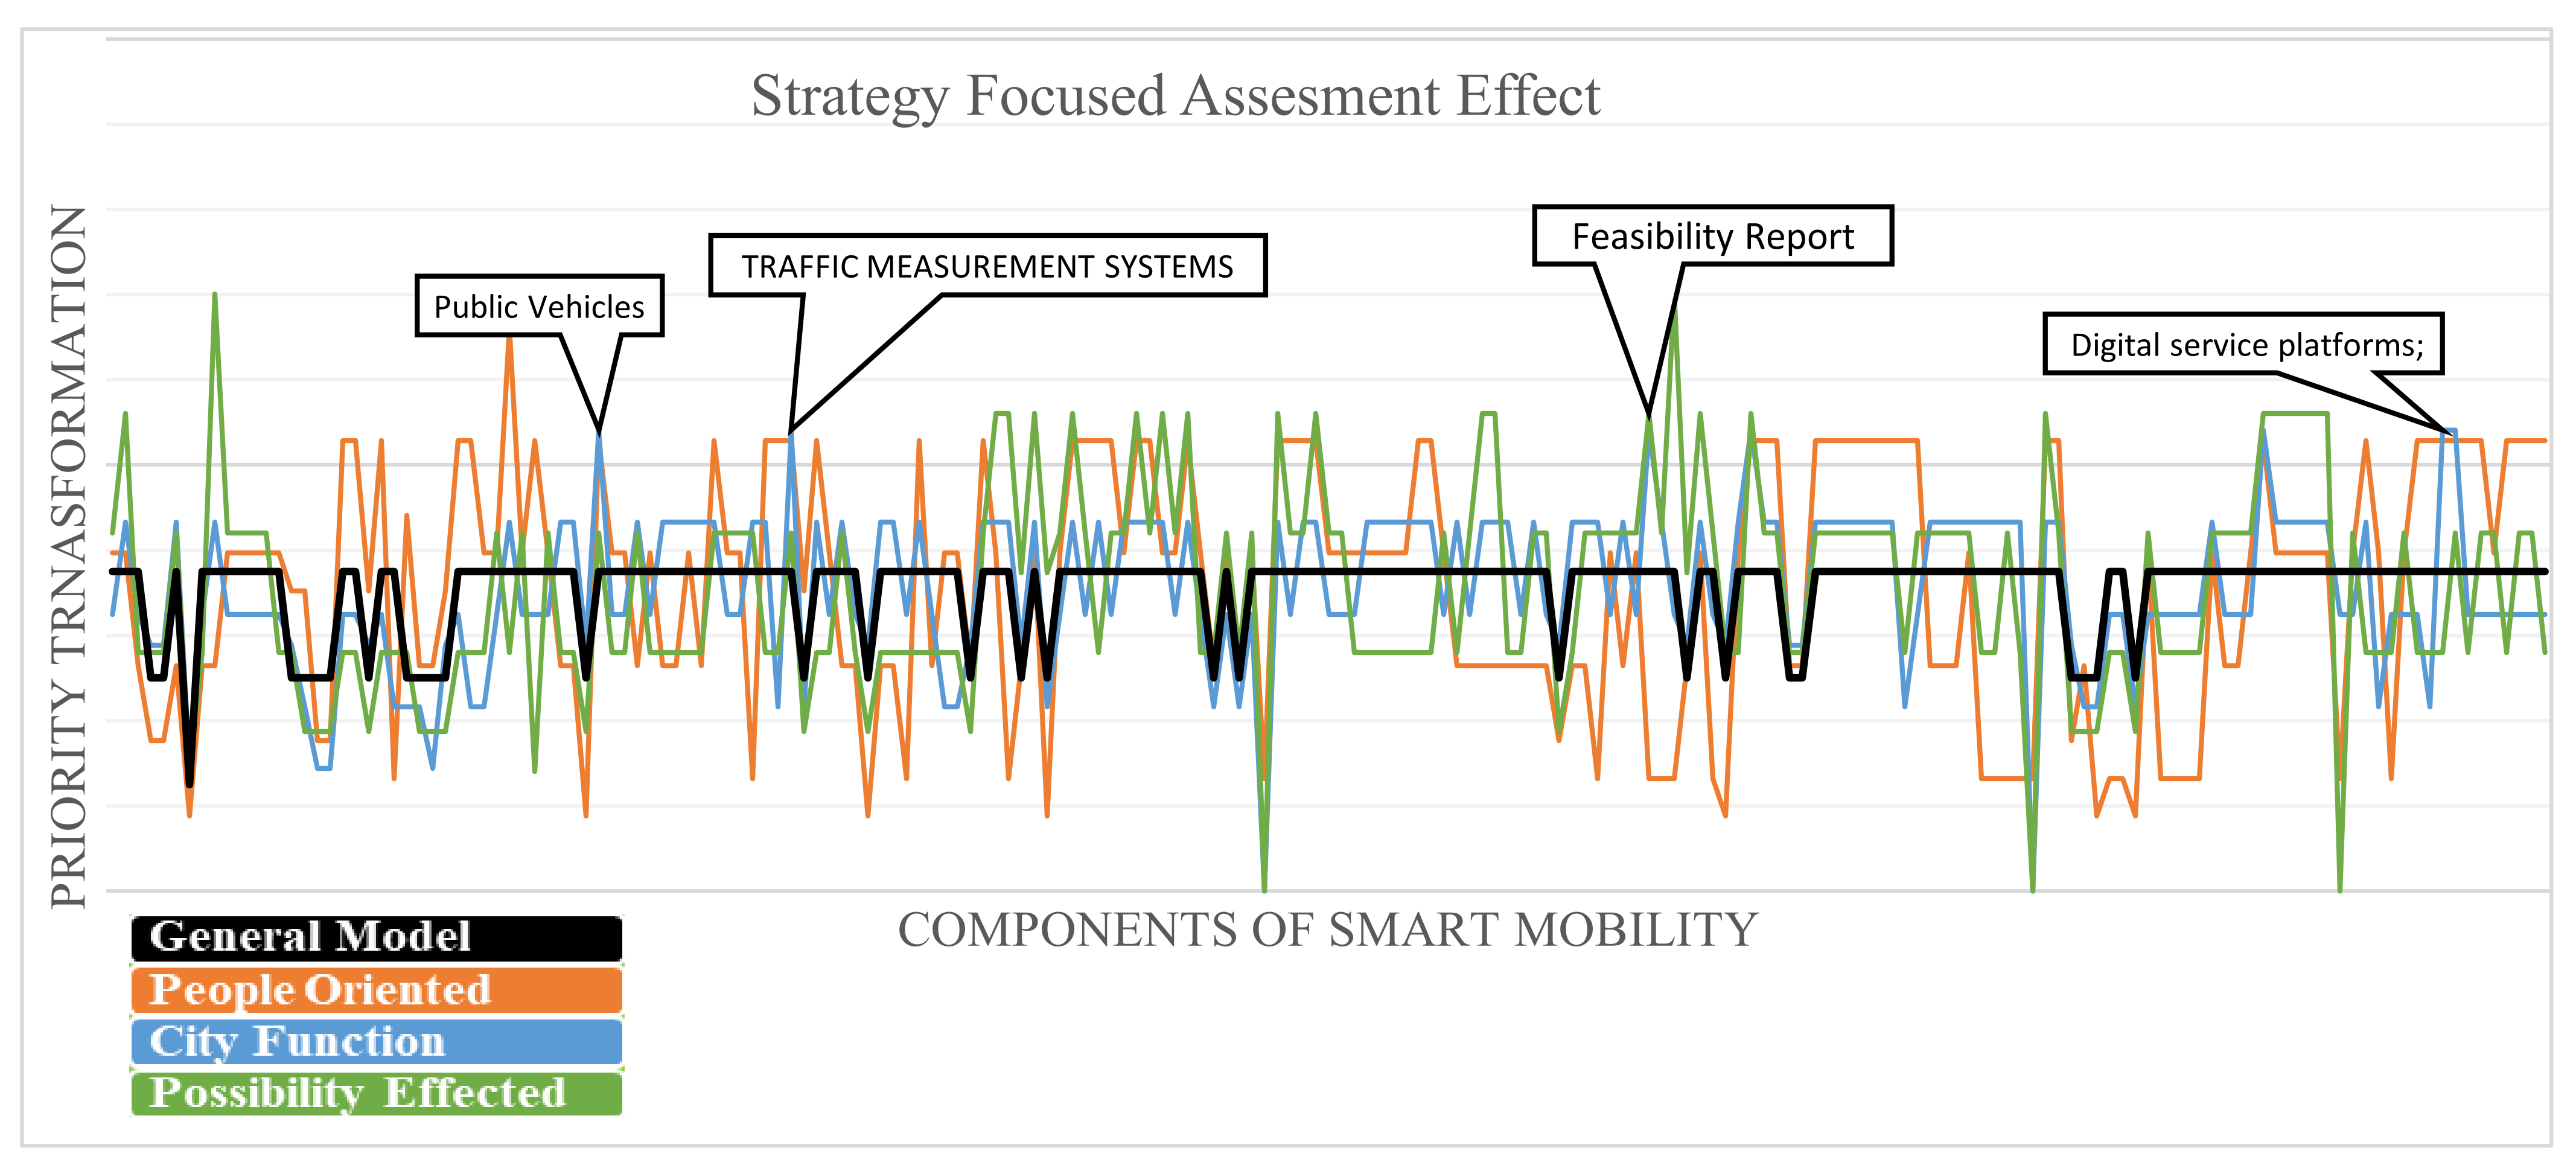
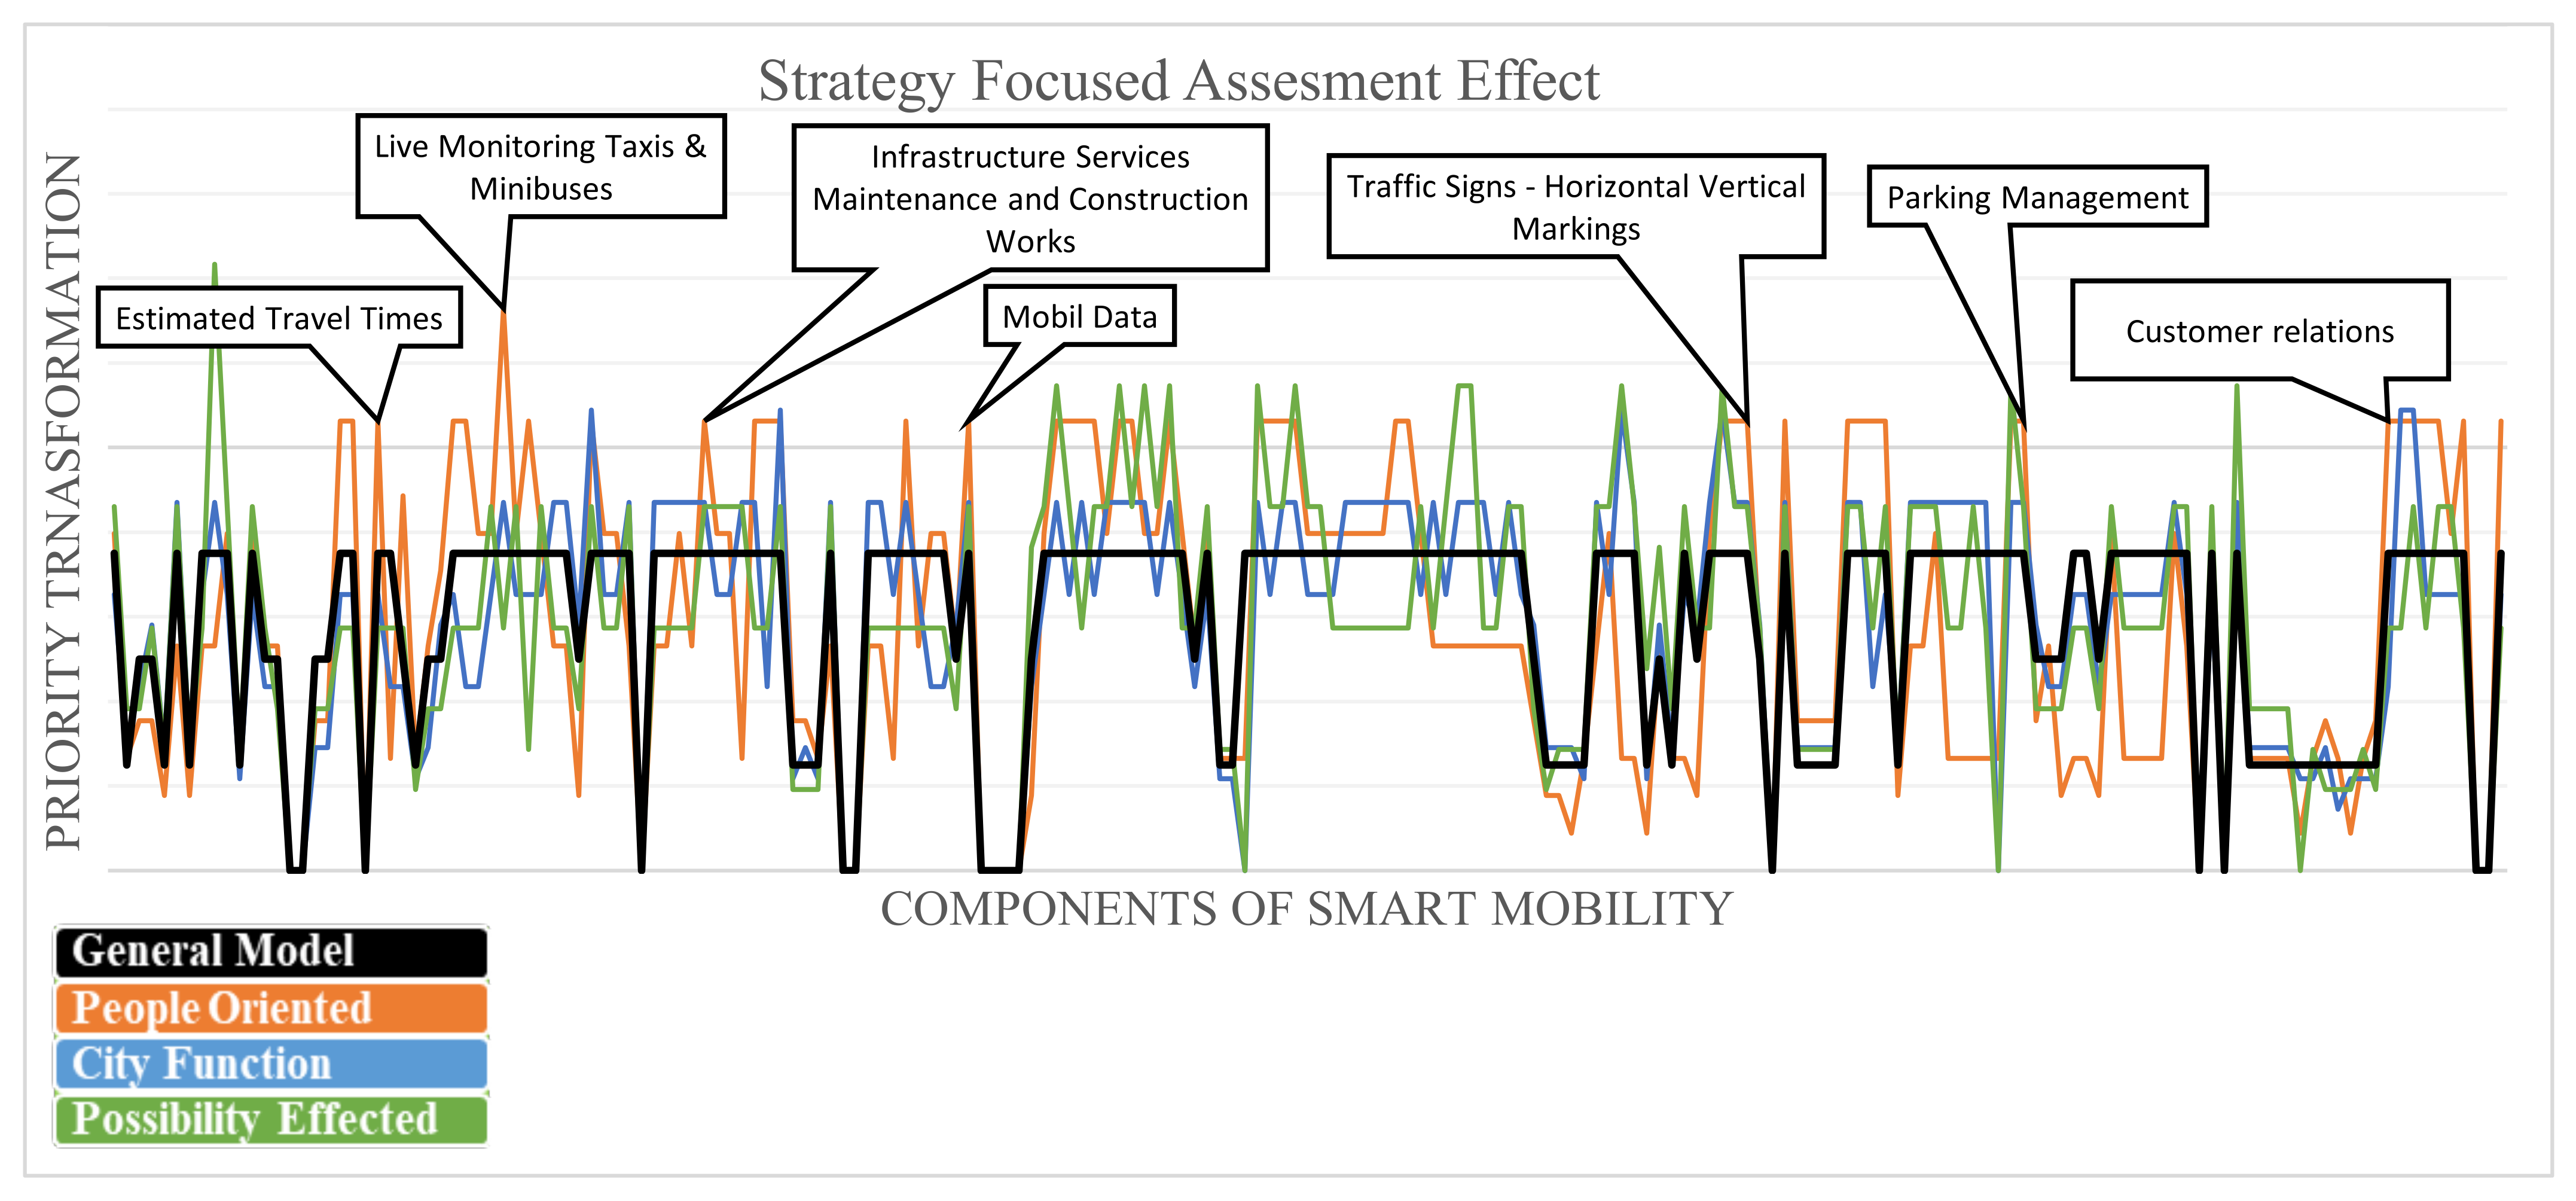
On the other hand, the strategy focused assessment tool allows dynamic prioritisation on the model. When this assessment is examined, it is seen that the “General Model” approach offers a general implementation plan that does not take into account priorities among components. The “People Oriented” and “Possibility Effected” strategies aggressively make a significant distinction between primary transformation components. If the decision maker chooses these guidelines, he or she will have strong evidence for a priority assessment study. Moreover, the “City Function” offers a consistent digital transformation priority that is compatible with the “general model” approach but takes all stakeholders into account.
The scenarios determined as case studies were also evaluated by selecting different strategic focuses. When the strategic focused assessment of the “City Function” in the first scenario is examined, it is suggested that the model should prioritise the digital transformation of transportation components related to public transport, traffic measurement systems, and feasibility reports for investment decisions and digital service platforms. Figure 4 shows the suggested strategic priorities for the first decision maker.
The strategic focus of the second scenario has been determined as “People Oriented”. The model for this scenario was provided digital transformation priorities to data sharing and management components. As priority transformation component, mobile data, travel times, maintenance information in infrastructure services, and priority digitalisation in urban parking areas services have been suggested to the decision maker. The London priority digitalisation transportation components proposed to the second decision maker are presented in Figure 5.
With this case study, flexible digitalisation goals and the strategy-oriented dynamic evaluation approach suggested by the model were examined. It is known that the transformation expectations of the cities that will make digital transformation assessment are different from each other. Decision makers expect the model to propose different digitalisation priorities for different strategies. The decision maker wants to know the transportation components decided to be digitalised and their digitalisation priorities. The proposed model provided decision support for digitalisation.
5. Discussion
The proposed framework has been implemented in the case studies with no difficulty as most of the information about London was readily available on their internet sites. When running the proposed framework for assessing the digital transformation of transportation systems the following conclusions are drawn. Note that the study focused not only the selection of indices and their relations with each other, but rather on representing the model in mathematical form. It is well proven that it is possible to devise a mathematical model that can represent transformation processes and enable measuring the effectiveness of the process as well as pointing out the improvement areas. However, during the implementation:
- The selection of the number and type of indicators used for evaluating digital transformation was found to be important.
- It does not seem to be easy to measure the correlation between the indices due to the novelty, complexity and uncertainty of digital transformation. The proposed mathematical framework can be a starting baseline for continuing the study along this way.
- It was naturally found that different results can be obtained with different index groups for different cities. This indicates the adaptation capability of the model to the realities of the transportation systems running as every city has a unique transportation system with its own priorities.
- The framework implemented for generating the mathematical model enables decision makers to feel comfortable with their requirements and choose respective evaluation criteria, even from the list of possible indicators. This capability will allow policy makers to adopt and partially customize the overall model.
- In addition, presenting alternative proposals while determining investment priorities allows the decision makers to determine a suitable strategy and a road map for the city in question.
In the case study, the level of smartness to be practiced in a city is assessed using a set of city related indexes characterising seven main services with respective sub components of Mobility 4.0 in terms of 4 different strategies aligned with the priority of the city in question. The relative weight of importance in the decision making process has been evaluated in linguistic terms such as very low, low, medium, high and very high. This increases understandability of the proposed framework. The implementation of the proposed model also revealed that the strategic approaches are essential in determining investment priorities of the cities. While budget is the most important factor, city-specific solutions may be necessary to ensure a sustainable infrastructure. Since these analyses are mainly done by the expert, expert view is an essential requirement of the proposed model.
The success of the proposed reference model, including mathematical components and the respective assessment based on this would be made more beneficial with the introduction of more ICT to the transportation services. For example, numerous methods of data collection and big data analysis are used in the digitalisation of transportation. During the utilisation smart transportation systems for performing integrated governance systems, some information, including corporate data; Bluetooth sensors, radar sensor, image processing, sensors, vehicle tracking and mobile application user data (probe data), signalling, camera, detector, semi-dynamic and dynamic message systems, fleet data of public transportation vehicles and digital ticket requiring extensive set of data are to be collected and analysed.
Additionally, analysis and processing of citizen data is important for real-time transportation management system as well. ICT technology enables easy management of these devices and data-related systems. Being able to handle these different types of information would definitely improve the performance of not only the smart systems but also the capability of the assessment.
Furthermore, artificial intelligence (AI) methods are also recommended to be utilised in sustaining smart solutions for complex systems that cannot be managed with traditional methods. For instance, with the support of highway traffic sensors and algorithms, automatically detect accidents and predict future traffic conditions [58]. AI in transport services has a wide variety of applications such as traffic management, road safety, public transport and urban mobility. Moreover, transport authorities are willing to use AI-powered systems to create a rapid improvement in congestion reduction, making travel time more reliable for passengers and improving the economy and productivity of their essential assets.
Similarly, IoT technology provides means to collect transportation data to automatically calculate values of some of the parameters, such as counting passenger and vehicles, influencing public transportation. This could also have an effect on the performance of the smart systems. The data collected over the smart systems can also be turned into meaningful information for the policy makers to make better decisions. Business intelligence is proven to be well implemented for this purpose [59]. It would be possible to perform existing situation and assess the results of application and report in respective managerial levels. It may also make some analysis on the available data and make some predictions about the progress of the systems for the future. Vehicle routing and scheduling analysis reports, maintenance planning and road safety assessment, ongoing construction progress reports, risk analysis and occupational safety reports etc. can be generated for the sake of effective transportation management.
Moreover, the use of end-to-end integrated payment systems in transportation services is widely shared as a future vision. A new concept of Mobility as a Service (MaaS) is introduced [60], as common and fair payment system, which is implemented between transportation operators and regardless of number of passengers. Ensuring the security of personal passenger information and commercial passenger data owned by operators in the construction of this system is proven to be possible with the infrastructure of blockchain technology as well [61]. In addition to money transfer, reducing paperwork, increasing the transparency and traceability capabilities of the systems, eliminating possible risk etc. would benefit from this technology.
Although, there are many other opportunities that ICT systems can provide to transportation management, these are considered to be sufficient in supporting the idea of generating and utilising both reference and assessment models.
6. Conclusions
The paper presented the following contributions in assessing the transformation of transportation systems:
- It provides a mean to handle city priorities and expectations of the city management held to account by providing a generic architecture to be adapted to city capabilities.
- A mathematical model is generated in order to assess the level of smartness not only for the overall system, but also with the component level. This capability enables a flexible and adaptive structure to be effectively executed.
- It may not only assess the smartness of the city transportation. It also provides means to simulate various types of strategies with respective components and see possible effect on smartness. This also generates valuable information for city and investment planning.
- It enables easy generation of action plans to improve city transportation services and promote their digitalisation.
The following explanations justifies these above contributions. Digitalisation is an innovative workspace that requires knowledge, operational expertise, investment and time. For a sustainable ecosystem, it is essential to reduce the use of private vehicle transportation and offer comfortable and high capacity public transportation. For the effective management of limited transportation resources, it is necessary to develop accessible, comfortable, transparent and cost-effective transportation services that increase mobility, and prevent noise and air pollution. In order for the digital transformation of transportation to be successful, investment priorities must be determined objectives and all transportation service components should be evaluated together with the integrated management approach.
Every city needs a smartness digitisation at a different level depending upon the capabilities and resources available. A transformation plan is therefore to be issued in sustaining effective transformation process aligned to city needs. To make this capability better understood and manageable, the proposed model naturally requires an integrated management approach for the operation of all transportation services as the integrated systems are the main components of digital continuity. Of note, the integrated approach makes joint use of infrastructure and capacity possible. This approach helps determine the realistic goal of digital efficiency and effectiveness. The proposed assessment model provides policy makers with three outcomes related to digitalise transportation services, namely, overall degree of smartness in transportation system as a whole, level of smartness of a particular component and respective priority. The “city-specific strategic choice” used in the model, prioritises the digitisation processes in accordance with city needs.
Above all, the reference model given in this article with its mathematical details proposes city-specific, measurable goals expressed by the level of digital transformation smartness, instead of comparing the current digitalisation level of cities with various criteria. It is important to note that the proposed model is flexible and adaptable enough to comply with city needs against available resources as the respective parameters can be assigned by decision makers or experts, being familiar with city capabilities and capacities. That means the policy and decision makers can choose respective city-specific indices. A mathematical model can then be run to perform the assessment. Using the proposed assessment model, the future smartness of a city’s transport system can also be determined through indicating the gap of smartness in certain areas. This information is then utilised for generating a road map for improvements and defining new strategies. Besides, the architecture of the reference model enables the expansion of components in accordance with new requirements. This increases the applicability of the model and sustains the capability to follow the change.
The case study is proof that the model can be applied to cities with no difficulty. Plus, it was concluded that different results can be obtained in an evaluation carried out with different index groups for a specific city. The choice of first decision maker yield to 85% smartness whereas the same for the second is 65% due to a different set of parameters, strategies and priorities implemented. The system generates the respective recommendation in light of the choices of decision or policy makers. Note that the model does not judge, validate or verify the strategic objectives or priorities; it is the decision of the policy maker. It rather highlights the effect of implementing those over the transportation systems. This provides a change to the policy makers to perform analysis of various strategies and compare them before implementation in real life.
In the case study, it was concluded that different results can be obtained in an evaluation made with different index groups for a specific city. Every city is unique and its priorities are different. In a digital transformation general model proposal, decision makers should be given the opportunity to choose among the evaluation criteria. This feature will allow policy makers to adopt and partially customize the overall model. In addition, presenting alternative proposals while determining investment priorities allows decision makers to determine a suitable strategy and a road map for their cities.
The literature review on the other hand confirms how difficult it is to define the transformation situation of smart cities with a universal system. Priorities, targets and visions identified for cities play a crucial role in this process. This study has been developed by evaluating certain indicators that can highlight the capability of digital transformation of transportation services. However, being able to succeed in implementing this model will certainly urge the respective research on generating assessment models for other areas of smart cities such as health, environment, energy and social services. It would always be possible to extend the capability of the model proposed. Utilising fuzzy logic to assess the capabilities of the components for each strategy could be a good motivation of the future work. The authors are planning to continue along this line in further research.
Author Contributions
Supervision, E.O.; Writing—original draft, H.I.; Writing—review & editing, H.I. and E.O. All authors have read and agreed to the published version of the manuscript.
Funding
The Scientific and Technological Research Council of Turkey (TÜBİTAK) Science Fellowship and Grant Programmes Department supported this study, which produce from PhD Study of Hakan INAC (Application Number: 1059B141900373).
Institutional Review Board Statement
The study did not require any ethical approval.
Informed Consent Statement
The study did not involve humans.
Data Availability Statement
The study did not report any data.
Conflicts of Interest
The authors declare no conflict of interest.
References
- Redman, L.; Friman, M.; Gärling, T.; Hartig, T. Quality attributes of public transport that attract car users: A research review. Transp. Policy 2013, 25, 119–127. [Google Scholar] [CrossRef]
- Mugion, R.G.; Toni, M.; Raharjo, H.; Di Pietro, L.; Sebathu, S.P. Does the service quality of urban public transport enhance sustainable mobility? J. Clean. Prod. 2018, 174, 1566–1587. [Google Scholar] [CrossRef]
- Ojo, A.; Curry, E.; Janowski, T.; Dzhusupova, Z. Designing next generation smart city initiatives: The SCID framework. In Transforming City Governments for Successful Smart Cities; Springer: Cham, Switzerland, 2015; pp. 43–67. [Google Scholar]
- Moşteanu, N.R. Challenges for Organizational Structure and design as a result of digitalization and cybersecurity. Bus. Manag. Rev. 2020, 11, 278–286. [Google Scholar] [CrossRef]
- Monaghan, S.; Tippmann, E.; Coviello, N. Born digitals: Thoughts on their internationalization and a research agenda. J. Int. Bus. Stud. 2020, 51, 11–22. [Google Scholar] [CrossRef]
- Song, H.; Srinivasan, R.; Sookoor, T.; Jeschke, S. Smart Cities: Foundations, Principles, and Applications; John Wiley & Sons: Hoboken, NJ, USA, 2017. [Google Scholar]
- Sharifi, A. A typology of smart city assessment tools and indicator sets. Sustain. Cities Soc. 2020, 53, 101936. [Google Scholar] [CrossRef]
- Oztemel, E.; Gursev, S. A literature review on industry 4.0 and beyond. J. Intell. Manuf. 2020, 31, 127–182. [Google Scholar] [CrossRef]
- Rodrigues, M.R.; Rodrigues de Jesus, M.C.; Rodrigues da Silva, A.N. Impacts of Mobility 4.0 on Sustainable Urban Mobility. In Proceedings of the 17th International Conference on Computational Urban Planning and Urban Management—CUPUM, Helsinki, Finland, 9–11 June 2021. [Google Scholar]
- Crainic, T.G.; Ricciardi, N.; Storchi, G. Models for evaluating and planning city logistics systems. Transp. Sci. 2009, 43, 432–454. [Google Scholar] [CrossRef] [Green Version]
- Bello, J.P.; Silva, C.; Nov, O.; Dubois, R.L.; Arora, A.; Salamon, J.; Mydlarz, C.; Doraiswamy, H. Sonyc: A system for monitoring, analyzing, and mitigating urban noise pollution. Commun. ACM 2019, 62, 68–77. [Google Scholar] [CrossRef]
- Davidsson, P.; Hajinasab, B.; Holmgren, J.; Jevinger, Å.; Persson, J.A. The fourth wave of digitalization and public transport: Opportunities and challenges. Sustainability 2016, 8, 1248. [Google Scholar] [CrossRef] [Green Version]
- Hajduk, S. The concept of a smart city in urban management. Bus. Manag. Educ. 2016, 14, 34–49. [Google Scholar] [CrossRef]
- Stawiarska, E.; Sobczak, P. The impact of Intelligent Transportation System implementations on the sustainable growth of passenger transport in EU regions. Sustainability 2018, 10, 1318. [Google Scholar] [CrossRef] [Green Version]
- Lee, L. The Future of Transportation—A System of Systems Perspective on the Future of the Car; Next-Curve, White Paper. 2021. Available online: https://www.5gamericas.org/the-future-of-transportation-a-system-of-systems-perspective-on-the-future-of-the-car/ (accessed on 25 October 2021).
- Mayangsari, L.; Novani, S. Multi-stakeholder co-creation analysis in smart city management: An experience from Bandung, Indonesia. Proc. Manuf. 2015, 4, 315–321. [Google Scholar] [CrossRef] [Green Version]
- Stone, M.; Knapper, J.; Evans, G.; Aravopoulou, E. Information management in the smart city. Bottom Line 2018, 31, 234–249. [Google Scholar] [CrossRef]
- Westraadt, L.; Calitz, A. A modelling framework for integrated smart city planning and management. Sustain. Cities Soc. 2020, 63, 102444. [Google Scholar] [CrossRef]
- Li, D.; Deng, L.; Cai, Z. Intelligent vehicle network system and smart city management based on genetic algorithms and image perception. Mech. Syst. Signal Processing 2020, 141, 106623. [Google Scholar] [CrossRef]
- Gures, E.; Shayea, I.; Alhammadi, A.; Ergen, M.; Mohamad, H. A comprehensive survey on mobility management in 5g heterogeneous networks: Architectures, challenges and solutions. IEEE Access 2020, 8, 195883–195913. [Google Scholar] [CrossRef]
- D’Apuzzo, M.; Evangelisti, A.; Santilli, D.; Buzzi, S.; Mazzei, M.; Bietoni, V. New Smart Mobility Applications: Preliminary Findings on a Pilot Study in the Municipality of Artena, Proceedings of the International Conference on Computational Science and Its Applications, Cagliari, Italy, 13–16 September 2021; Springer: Cham, Switzerland, 2021; pp. 21–36. [Google Scholar]
- Vojdani, A. Smart integration. IEEE Power Energy Mag. 2008, 6, 71–79. [Google Scholar] [CrossRef]
- Lee, I.; Lee, K. The Internet of Things (IoT): Applications, investments, and challenges for enterprises. Bus. Horiz. 2015, 58, 431–440. [Google Scholar] [CrossRef]
- Tuominen, A.; Ahlqvist, T. Is the transport system becoming ubiquitous? Socio-technical road mapping as a tool for integrating the development of transport policies and intelligent transport systems and services in Finland. Technol. Forecast. Soc. Chang. 2010, 77, 120–134. [Google Scholar] [CrossRef]
- Kaparias, I.; Bell, M.; Tomassini, M. Key performance indicators for traffic management and intelligent transport systems. ISIS CONDUITS Consort. 2011, 14, 19–68. [Google Scholar]
- Lee, J.H.; Phaal, R.; Lee, S.-H. An integrated service-device-technology roadmap for smart city development. Technol. Forecast. Soc. Chang. 2013, 80, 286–306. [Google Scholar] [CrossRef]
- El Mokaddem, Y.; Jawab, F.; Saâd, L.E. Intelligent Transportations Systems: Review of Current Challenges and Success Factors: The Case of Developing Countries. In Proceedings of the 2019 International Colloquium on Logistics and Supply Chain Management (LOGISTIQUA), Paris, France, 12–14 June 2019; ISSN 2166-7373. [Google Scholar]
- Mohsin, B.S.; Ali, H.; AlKaabi, R. Smart city: A review of maturity models. In Proceedings of the 2nd Smart Cities Symposium (SCS 2019), Bahrain, Bahrain, 24–26 March 2019. [Google Scholar]
- Ahvenniemi, H.; Huovila, A.; Pinto-Seppä, I.; Airaksinen, M. What are the differences between sustainable and smart cities? Cities 2017, 60, 234–245. [Google Scholar] [CrossRef]
- Garau, C.; Pavan, V.M. Evaluating urban quality: Indicators and assessment tools for smart sustainable cities. Sustainability 2018, 10, 575. [Google Scholar] [CrossRef] [Green Version]
- Le, L.T.; Nguyen, H.; Dou, J.; Zhou, J. A comparative study of PSO-ANN, GA-ANN, ICA-ANN, and ABC-ANN in estimating the heating load of buildings’ energy efficiency for smart city planning. Appl. Sci. 2019, 9, 2630. [Google Scholar] [CrossRef] [Green Version]
- Huovila, A.; Bosch, P.; Airaksinen, M. Comparative analysis of standardized indicators for Smart sustainable cities: What indicators and standards to use and when? Cities 2019, 89, 141–153. [Google Scholar] [CrossRef]
- Caird, S.P.; Hallett, S.H. Towards evaluation design for smart city development. J. Urban Des. 2019, 24, 188–209. [Google Scholar] [CrossRef]
- Dameri, R.P.; Benevolo, C.; Veglianti, E.; Li, Y. Understanding smart cities as a glocal strategy: A comparison between Italy and China. Technol. Forecast. Soc. Chang. 2019, 142, 26–41. [Google Scholar] [CrossRef]
- Mapar, M.; Jafari, M.J.; Mansouri, N.; Arjmandi, R.; Azizinezhad, R.; Ramos, T.B. 8 A composite index for sustainability assessment of health, safety and environmental performance in municipalities of megacities. Sustain. Cities Soc. 2020, 60, 102164. [Google Scholar] [CrossRef]
- Kamyab, H.; Klemeš, J.J.; Van Fan, Y.; Lee, C.T. Transition to sustainable energy system for smart cities and industries. Energy 2020, 207, 118104. [Google Scholar] [CrossRef]
- Lytras, M.D.; Visvizi, A.; Chopdar, P.K.; Sarirete, A.; Alhalabi, W. Information Management in Smart Cities: Turning end users’ views into multi-item scale development, validation, and policy-making recommendations. Int. J. Inf. Manag. 2021, 56, 102146. [Google Scholar] [CrossRef]
- Warnecke, D.; Wittstock, R.; Teuteberg, F. Benchmarking of European smart cities—A maturity model and web-based self-assessment tool. Sustain. Account. Manag. Policy J. 2019, 10, 654–684. [Google Scholar] [CrossRef]
- Ding, X.; Zhong, W.; Shearmur, R.G.; Zhang, X.; Huisingh, D. An inclusive model for assessing the sustainability of cities in developing countries–Trinity of Cities’ Sustainability from Spatial, Logical and Time Dimensions (TCS-SLTD). J. Clean. Prod. 2015, 109, 62–75. [Google Scholar] [CrossRef] [Green Version]
- Yigitcanlar, T.; Kamruzzaman, M.; Teriman, S. Neighborhood sustainability assessment: Evaluating residential development sustainability in a developing country context. Sustainability 2015, 7, 2570–2602. [Google Scholar] [CrossRef] [Green Version]
- Suganthi, L. Multi expert and multi criteria evaluation of sectoral investments for sustainable development: An integrated fuzzy AHP, VIKOR/DEA methodology. Sustain. Cities Soc. 2018, 43, 144–156. [Google Scholar] [CrossRef]
- Mateusz, P.; Danuta, M.; Małgorzata, Ł.; Mariusz, B.; Kesra, N. TOPSIS and VIKOR methods in study of sustainable development in the EU countries. Procedia Comput. Sci. 2018, 126, 1683–1692. [Google Scholar] [CrossRef]
- Kaklauskas, A.; Zavadskas, E.K.; Radzeviciene, A.; Ubarte, I.; Podviezko, A.; Podvezko, V. Bucinskas, Quality of city life multiple criteria analysis. Cities 2018, 72, 82–93. [Google Scholar] [CrossRef]
- Liu, H.; Zhou, G.; Wennersten, R.; Frostell, B. Analysis of sustainable urban development approaches in China. Habitat Int. 2014, 41, 24–32. [Google Scholar] [CrossRef]
- Díaz-Díaz, R.; Muñoz, L.; Pérez-González, D. The business model evaluation tool for smart cities: Application to SmartSantander use cases. Energies 2017, 10, 262. [Google Scholar] [CrossRef] [Green Version]
- Aletà, N.B.; Alonso, C.M.; Ruiz, R.M.A. Smart mobility and smart environment in the Spanish cities. Transp. Res. Proc. 2017, 24, 163–170. [Google Scholar] [CrossRef]
- Firmanyah, H.S.; Supangkat, S.H.; Arman, A.A.; Adhitya, R. Searching smart city in Indonesia through maturity model analysis:(Case study in 10 cities). In Proceedings of the 2017 International Conference on ICT For Smart Society (ICISS), Tangerang, Indonesia, 18–19 September 2017. [Google Scholar]
- Phillis, Y.A.; Kouikoglou, V.S.; Verdugo, C. Urban sustainability assessment and ranking of cities. Comput. Environ. Urban Syst. 2017, 64, 254–265. [Google Scholar] [CrossRef]
- Rana, N.P.; Luthra, S.; Mangla, S.K.; Islam, R.; Roderick, S.; Dwivedi, Y.K. Barriers to the development of smart cities in Indian context. Inf. Syst. Front. 2018, 21, 503–525. [Google Scholar] [CrossRef] [Green Version]
- Torrinha, P.; Machado, R.J. Assessment of maturity models for smart cities supported by maturity model design principles. In Proceedings of the 2017 IEEE International Conference on Smart Grid and Smart Cities (ICSGSC), Singapore, 23–26 July 2017. [Google Scholar]
- Afonso, R.A.; dos Santos Brito, K.; do Nascimento, C.H.; Garcia, V.C.; Álvaro, A. Brazilian smart cities: Using a maturity model to measure and compare inequality in cities. In Proceedings of the 16th Annual International Conference on Digital Government Research, Phoenix, AZ, USA, 27–30 May 2015. [Google Scholar]
- Orłowski, C.; Ziółkowski, A.; Orłowski, A.; Kapłański, P.; Sitek, T.; Pokrzywnicki, W. Smart cities system design method based on case based reasoning. In Transactions on Computational Collective Intelligence XXV; Springer: Berlin/Heidelberg, Germany, 2016; pp. 43–58. [Google Scholar]
- Lim, C.; Kim, K.-J.; Maglio, P.P. Smart cities with big data: Reference models, challenges, and considerations. Cities 2018, 82, 86–99. [Google Scholar] [CrossRef]
- De Guimarães, J.C.F.; Severo, E.A.; Júnior, L.A.F.; Da Costa, W.P.L.B.; Salmoria, F. Governance and quality of life in smart cities: Towards sustainable development goals. J. Clean. Prod. 2020, 253, 119926. [Google Scholar] [CrossRef]
- Shafiq, M.; Tian, Z.; Bashir, A.K.; Jolfaei, A.; Yu, X. Data mining and machine learning methods for sustainable smart cities traffic classification: A survey. Sustain. Cities Soc. 2020, 60, 102177. [Google Scholar] [CrossRef]
- Inac, H.; Oztemel, E.; Aydın, M.E. Smartness and Strategic Priority Assessment in Transition to Mobility 4.0 for Smart Cities. J. Intell. Syst. Theory Appl. 2021, 4, 113–126. [Google Scholar] [CrossRef]
- Kumar, H.; Singh, M.K.; Gupta, M.; Madaan, J. Moving towards smart cities: Solutions that lead to the smart city transformation framework. Technol. Forecast. Soc. Chang. 2020, 153, 119281. [Google Scholar] [CrossRef]
- Abduljabbar, R.; Dia, H.; Liyanage, S.; Bagloee, S.A. Applications of artificial intelligence in transport: An overview. Sustainability 2019, 11, 189–213. [Google Scholar] [CrossRef] [Green Version]
- Petrini, M.; Pozzebon, M. Managing sustainability with the support of business intelligence: Integrating socio-environmental indicators and organisational context. J. Strateg. Inf. Syst. 2009, 18, 178–191. [Google Scholar] [CrossRef]
- Cruz, C.O.; Sarmento, J.M. “Mobility as a service” platforms: A critical path towards increasing the sustainability of transportation systems. Sustainability 2020, 12, 6368. [Google Scholar] [CrossRef]
- Maesa, D.D.F.; Mori, P. Blockchain 3.0 applications survey. J. Parallel Distrib. Comput. 2020, 138, 99–114. [Google Scholar] [CrossRef]
Figure 1.
Component of the proposed reference model.

Figure 2.
Main sub components of Mobility 4.0 for assessment.

Figure 3.
Different digitalisation goals for different scenarios for London.

Figure 4.
Priority digitalisation components proposed to first decision maker for London.

Figure 5.
Priority digitalisation components proposed to second decision maker for London.


Table 1.
General form of nominal group technique to define smartness level requirements.
| q1 | …………………………………………………… | qN | ||||
| Components of Transportation Management Tools | X1 | αt11 | αt12 | ………………………………………… | αt1N | KPI1 |
| αd11 | αd12 | ………………………………………… | αd1N | |||
| αi11 | αi12 | ………………………………………… | αi1N | |||
| X2 | αt21 | αt22 | ………………………………………… | αt2N | KPI2 | |
| αd21 | αd22 | ………………………………………… | αd2N | |||
| αi21 | αi22 | ………………………………………… | αi2N | |||
| ⋮ | ⋮ | ⋮ | ………………………………………… | ⋮ | ⋮ | |
| ⋮ | ⋮ | ⋮ | ………………………………………… | ⋮ | ⋮ | |
| ⋮ | ⋮ | ⋮ | ………………………………………… | ⋮ | ⋮ | |
| XJ | αtJ1 | αtJ2 | ………………………………………… | αtJN | KPIJ | |
| αdJ1 | αdJ2 | ………………………………………… | αdJN | |||
| αiJ1 | αiJ2 | ………………………………………… | αiJN | |||
Table 2.
General form of multi-criteria assessment approach of proposed model.
| q1 | ……………………………………………………… | qN | ||||
| Components of Transportation Management Tools | X1 | P(αt11) | P(αt12) | ………………………………………… | P(αt1N) | g(X1) |
| P(αd11) | P(αd12) | ………………………………………… | P(αd1N) | |||
| P(αi11) | P(αi12) | ………………………………………… | P(αi1N) | |||
| X2 | P(αt21) | P(αt22) | ………………………………………… | P(αt2N) | g(X2) | |
| P(αd21) | P(αd22) | ………………………………………… | P(αd2N) | |||
| P(αi21) | P(αi22) | ………………………………………… | P(αi2N) | |||
| ⋮ | ⋮ | ⋮ | ………………………………………… | ⋮ | ⋮ | |
| ⋮ | ⋮ | ⋮ | ………………………………………… | ⋮ | ⋮ | |
| ⋮ | ⋮ | ⋮ | ………………………………………… | ⋮ | ⋮ | |
| XJ | P(αtJ1) | P(αtJ2) | ………………………………………… | P(αtJN) | g(XJ) | |
| P(αdJ1) | P(αdJ2) | ………………………………………… | P(αdJN) | |||
| P(αiJ1) | P(αiJ2) | ………………………………………… | P(αiJN) | |||
Table 3.
Smart City General Indicators.
| ID of Indicators and Detail | Value Range and Meaning | ||||
|---|---|---|---|---|---|
| 1 | 2 | 3 | 4 | 5 | |
| City Size Urban Population (UP * Million) size of the City | Small UP < 0.5 | Medium UP = 0.5–1 | Large UP = 1–5 | Super UP = 5–10 | Mega UP > 10 |
| Economic Power of City Gross Domestıc Product (GDP) PER Capita | Very Low GPD PC < GBP 1 k | Low GPD PC = GBP 1 k–5 k | Moderate GPD PC = GBP 5 k–10 k | High GPD PC = GBP 10 k–20 k | Very High GPD PC ≥ GBP 20 k |
| Technological Infrastructure of City ICT Development Index (IDI) | Very Low IDI ≤ 25% | Low IDI = 25–50% | Moderate IDI = 50–75% | High IDI = 75–90% | Very High IDI ≥ 90% |
| Safety Crime index (CI) safety walking alone during daylight and night | Very Low CI ≤ 25% | Low CI = 25–50% | Moderate CI = 50–75% | High CI = 75–90% | Very High CI ≥ 90% |
Table 4.
Mobility Special Indicators.
| ID of Indicators and Detail | Value Range and Meaning | ||||
|---|---|---|---|---|---|
| 1 | 2 | 3 | 4 | 5 | |
| Traffic Index Traffic Congestion Index Level (TCI) | Very Low TCI ≤ 5% | Low TCI = 5–15% | Moderate TCI = 15–25% | High TCI = 25–50% | Very High TCI ≥ 50% |
| Travel Time Management Commute time by public transport (Minute—Measurement by Moovit Index) (CT) | Very Low CT ≤ 20 min. | Low CT = 20–30 min. | Moderate CT = 30–45 min. | High CT = 45–60 min | Very High CT > 60 min. |
| Freight Vehicle Traffic Rate Percentage of freight vehicles in total traffic (FVP) | Very Low FVP ≤ 5% | Low FVP = 5–15% | Moderate FVP = 15–20% | High FVP = 20–30% | Very High FVP ≥ 30% |
| Incident Management (Negative Impact) Road Safety ETSC Road Safety Performance Index (PIN) (Road deaths per million inhabitants) (People) | Very Low PIN ≤ 20 p. | Low PIN = 20–30 p. | Moderate PIN = 30–45 p. | High PIN = 45–60 p. | Very High PIN > 60 p. |
| Pollution Reduction Active Trips Rate (ATR) (Non-motorized (Walking & Cycling)/All trips) | Very Low ATR ≤ 5% | Low ATR = 5–10% | Moderate ATR = 10–15% | High ATR = 15–20% | Very High ATR > 20% |
| Urban Mobility Urban Mobility Index Rate (UM) | Very Low UM ≤ 10% | Low UM = 10–25% | Moderate UM = 25–40% | High UM = 40–60% | Very High UM ≥ 60% |
| Climate Whether climate conditions have an impact on transportation | Not Effective | Effective | --------------------- | ||
| Topology Whether topology conditions affect transportation | Not Effective | Effective | --------------------- | ||
Table 5.
Current Transportation Capacity.
| ID of Indicators and Detail | Value Range and Meaning | ||||
|---|---|---|---|---|---|
| 1 | 2 | 3 | 4 | 5 | |
| Bus Operated number of vehicles (OVS) | OVS < 100 | 100–500 OVS | 500–1 k OVS | 1 k–5 k OVS | OVS > 5 k |
| Private Vehicle Hiring (PVH) (Taxi, Club Car, Private Online Advance Booking) Operated number of vehicles (OVS) | OVS < 500 | 500–1.000 OVS | 1 k–5 k OVS | 5 k–10 k OVS | OVS > 10 k |
| Tram Operated total Km (OTK) | OTK = 0 | OTK = 1–50 | OTK = 50–100 | OTK = 100–200 | OTK > 200 |
| Metro Operated total Km (OTK) | OTK = 0 | OTK = 1–100 | OTK = 100–500 | OTK = 500–1 k | OTK > 1 k |
| Sea routes Operated number of Ferries (ONF) | ONF < 10 | 10–25 ONF | 25–50 ONF | 50–100 ONF | ONF > 100 |
| Train (Intercity) Is there or not | Not Effective | Effective | --------------------- | ||
| Airway Is there or not | Not Effective | Effective | --------------------- | ||
| Highway Network Is there or not | Not Effective | Effective | --------------------- | ||
Publisher’s Note: MDPI stays neutral with regard to jurisdictional claims in published maps and institutional affiliations. |
© 2021 by the authors. Licensee MDPI, Basel, Switzerland. This article is an open access article distributed under the terms and conditions of the Creative Commons Attribution (CC BY) license (https://creativecommons.org/licenses/by/4.0/).
Share and Cite
MDPI and ACS Style
Inac, H.; Oztemel, E. An Assessment Framework for the Transformation of Mobility 4.0 in Smart Cities. Systems 2022, 10, 1. https://0-doi-org.brum.beds.ac.uk/10.3390/systems10010001
AMA Style
Inac H, Oztemel E. An Assessment Framework for the Transformation of Mobility 4.0 in Smart Cities. Systems. 2022; 10(1):1. https://0-doi-org.brum.beds.ac.uk/10.3390/systems10010001
Chicago/Turabian StyleInac, Hakan, and Ercan Oztemel. 2022. "An Assessment Framework for the Transformation of Mobility 4.0 in Smart Cities" Systems 10, no. 1: 1. https://0-doi-org.brum.beds.ac.uk/10.3390/systems10010001
Note that from the first issue of 2016, this journal uses article numbers instead of page numbers. See further details here.