
Prioritization of Environmental Uncertainty and Manufacturing Flexibility for Labor-Intensive Industry: A Case Study on Ready-Made Garment Industries in Bangladesh

 , and
, and 
Abstract
:1. Introduction
2. Literature Review
2.1. Environmental Uncertainty (EU)
- Gerwin (1993) classified basic EU into seven types: (1) kind of product acceptance in the market, (2) product life cycle duration, (3) specific product specifications, (4) aggregate demand of the product, (5) machine downtime, (6) specifications of material, and (7) changes in the above six types [12].
- Ansoff et al. (2018) uncovered environmental challenges in broader aspects, namely, a shifting product market, developing nations, inadequate management capabilities, external sociopolitical issues, and disruptive technology [22].
- Ruchi Mishra (2021) focused on five types of environmental uncertainties: demand uncertainty (DU), supplier uncertainty (SU), competitor uncertainty (CU), technological uncertainty (TU), macro-environmental uncertainty (MEU) [23].
- In the context of the supply chain, Das and Abdel-Malek (2003) focused on four types of supply chain uncertainty, such as product mix, sales quantities, order delivery time, and design changes [24].
- Vaart et al. (2004) showed that volume, product mix, and lead time are the types of uncertainty for the integration of buyers and suppliers [25].
2.2. Manufacturing Flexibility (MF)
- Browne (1984) classified eight types of flexibility under three levels (basic, system, and aggregate levels) [46];
- Dooner (1991) classified five types within the production, design, and base levels [49];
- Koste (1999) classified ten types of flexibility belonging to the individual resource, shop floor, plant, functional, and strategic business levels [50];
- Narashiman (1999) classified 11 types within the basic, tactical, and strategic levels [51];
- Sawhney (2006) classified 11 types within the input, process, and output levels [52].
- From a strategic perspective:
- D’Souza (2000) classified MF as externally driven flexibility types (volume and variety) and internally driven flexibility types (process and material handling flexibility) [53];
- Oke (2005) classified MF as first-order (new product, mix, volume, and delivery flexibility) and lower-order (routing, component, material, and machine flexibility) [54];
- Javid (2019) classified MF as basic flexibility (operation, material handling, and machine), potential flexibility (product, process, volume, expansion, and routing), and actual flexibility (market, production, and program) [7];
- Jain (2013) classified MF as action-oriented: adaptive, proactive, or a combination [9];
- Zhang, Vonderembse, and Lim (2003) classified MF as manufacturing competencies (machine, labor, material handling, and routing flexibilities), and manufacturing capabilities (volume flexibility, and mix flexibility) [55].
2.3. Prioritization of EU and MF
3. Overview of RMG Industry of Bangladesh
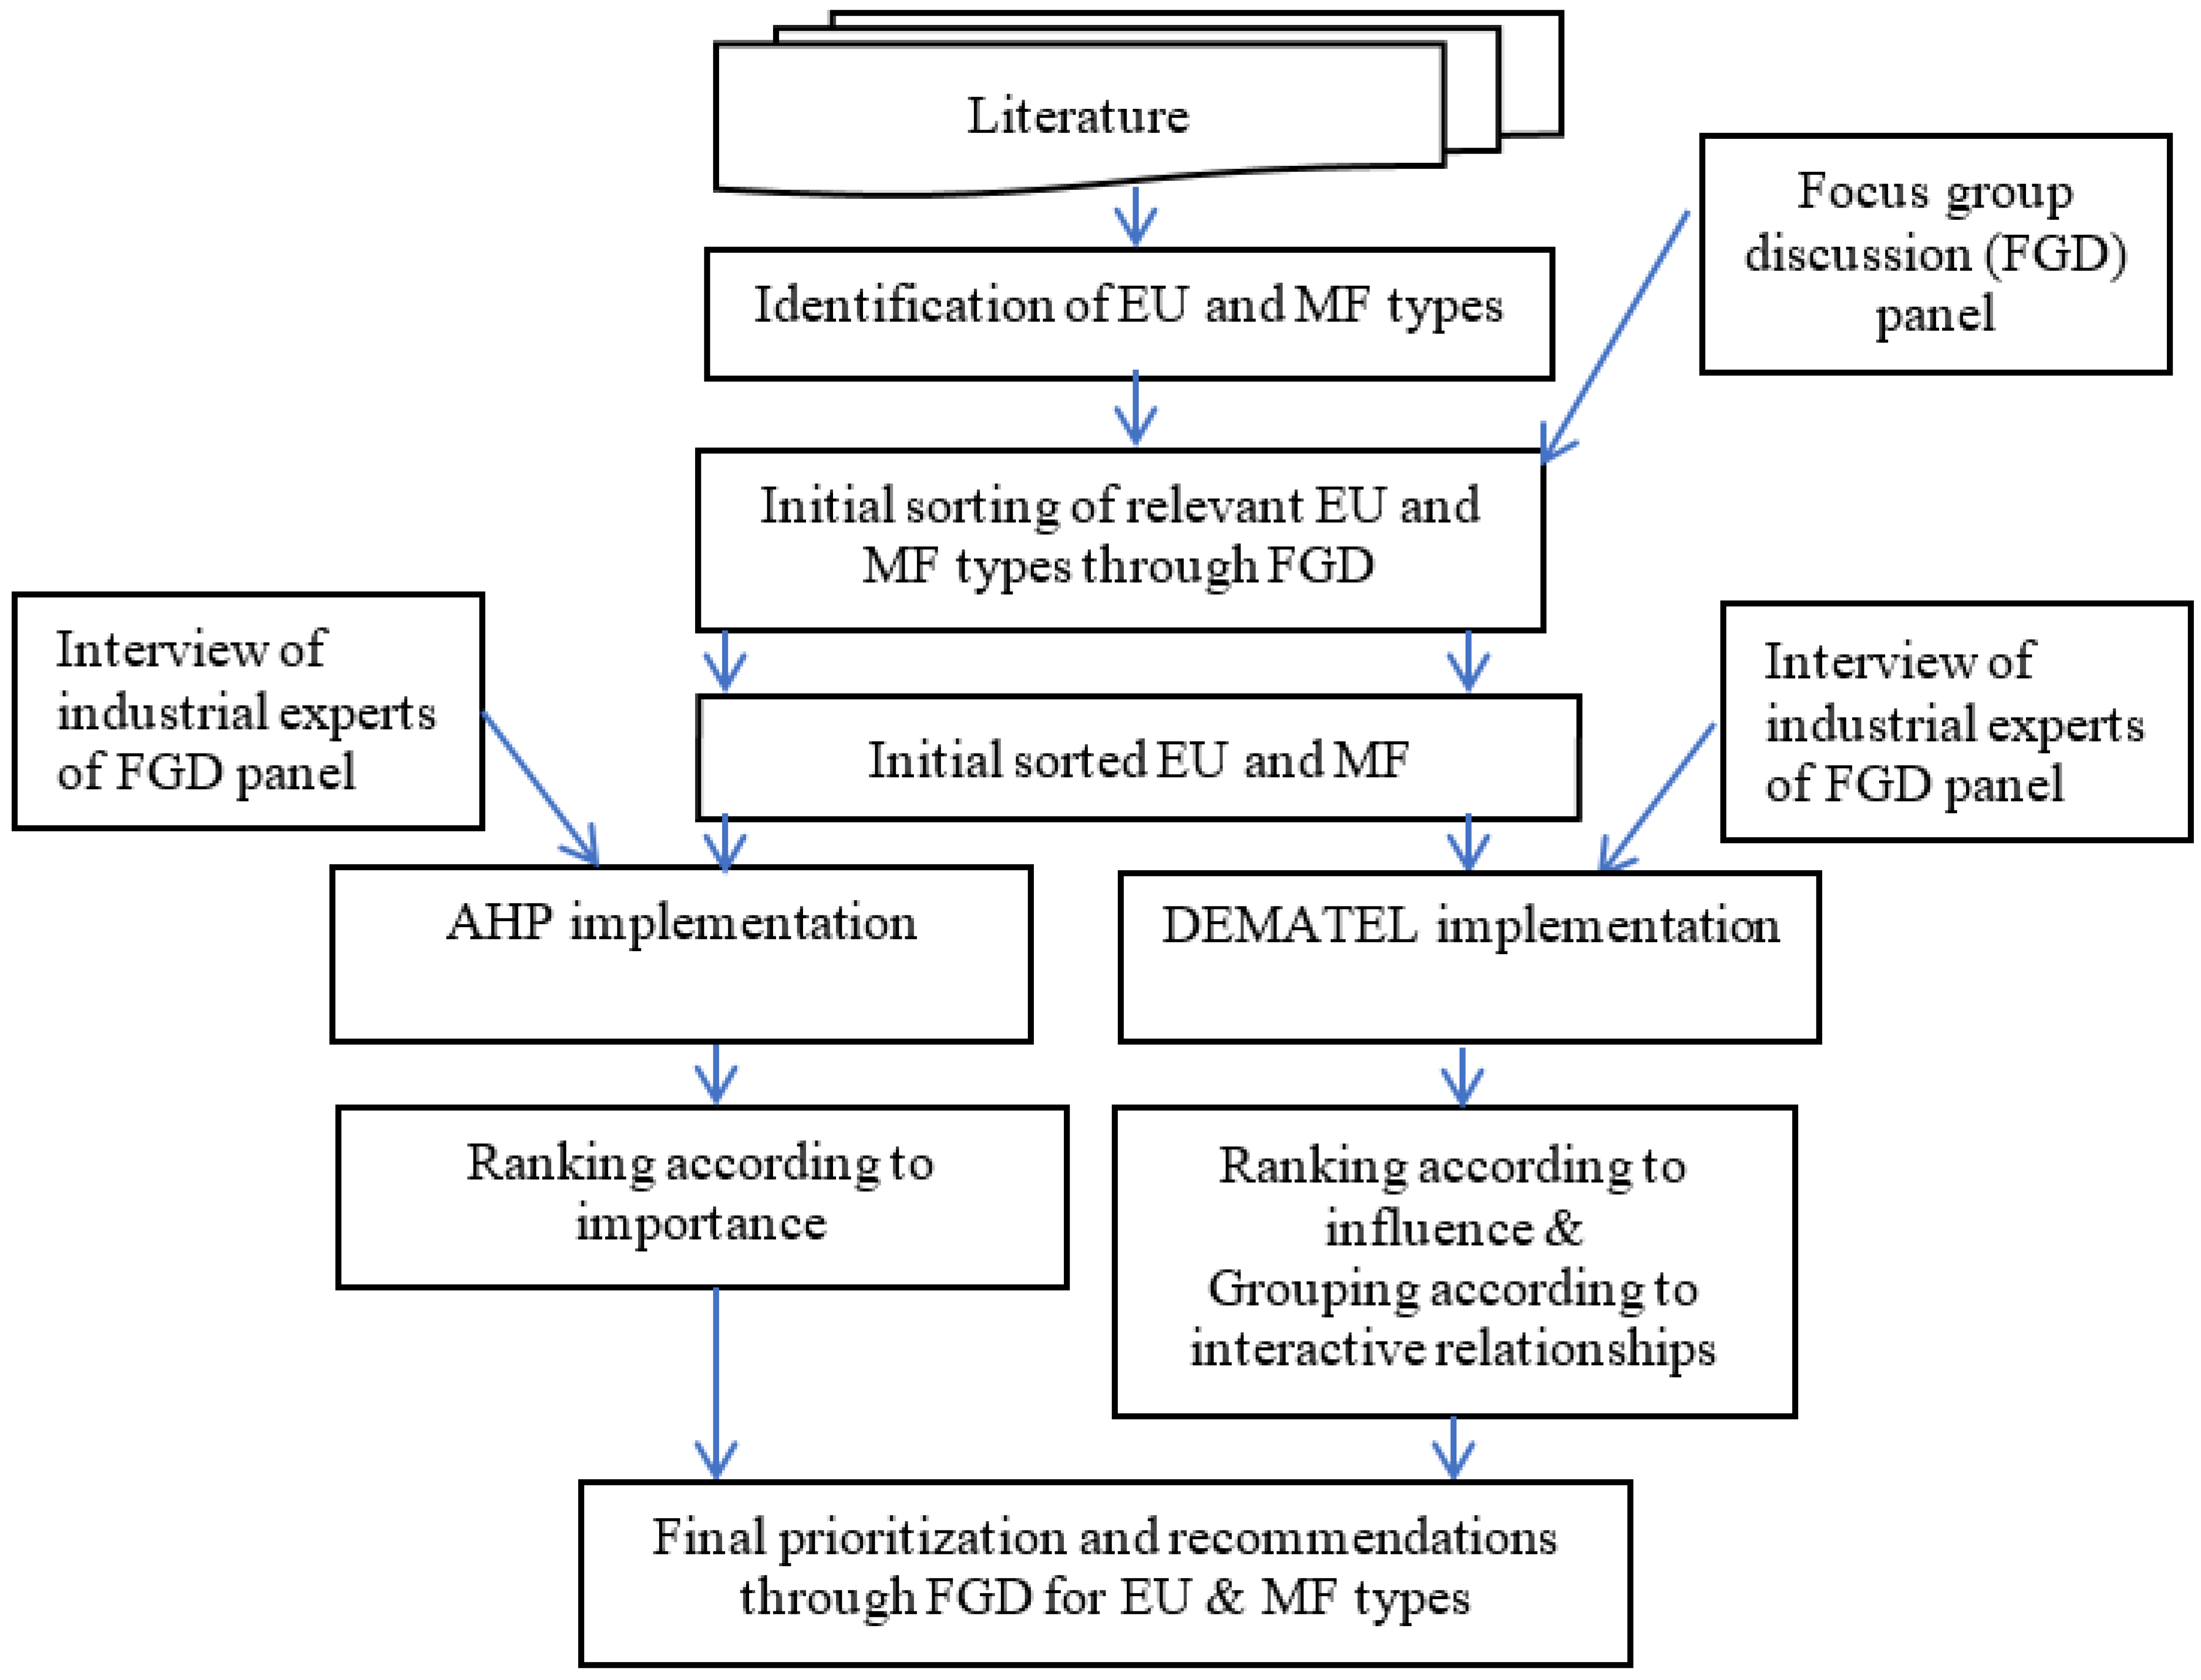
4. Methodology
- Gerwin’s (1993) conceptual framework (shown in Figure 2) on EU, MF, and firm performance.
- Scenarios and requirements of the RMG industry according to their experience.
5. Data Analysis
5.1. AHP Implementation for Prioritizing
5.1.1. EU Types
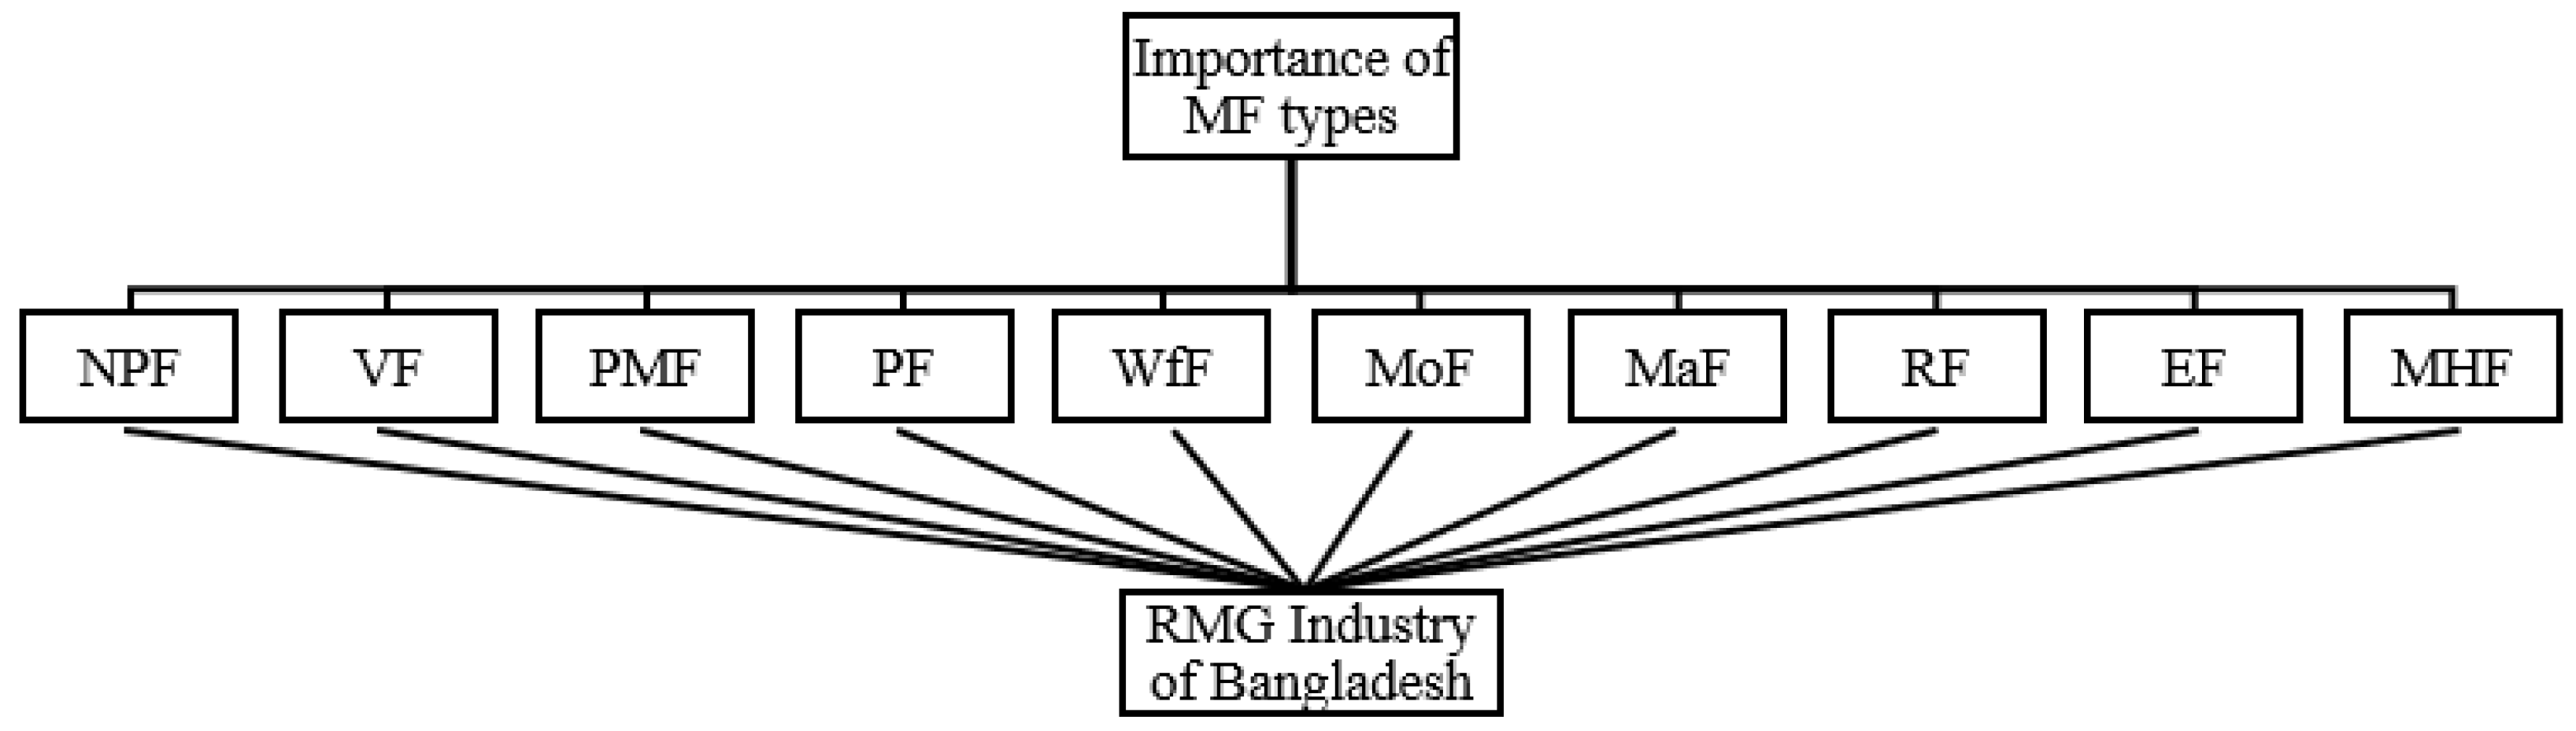
5.1.2. MF Types
5.2. DEMATEL Implementation for Prioritizing
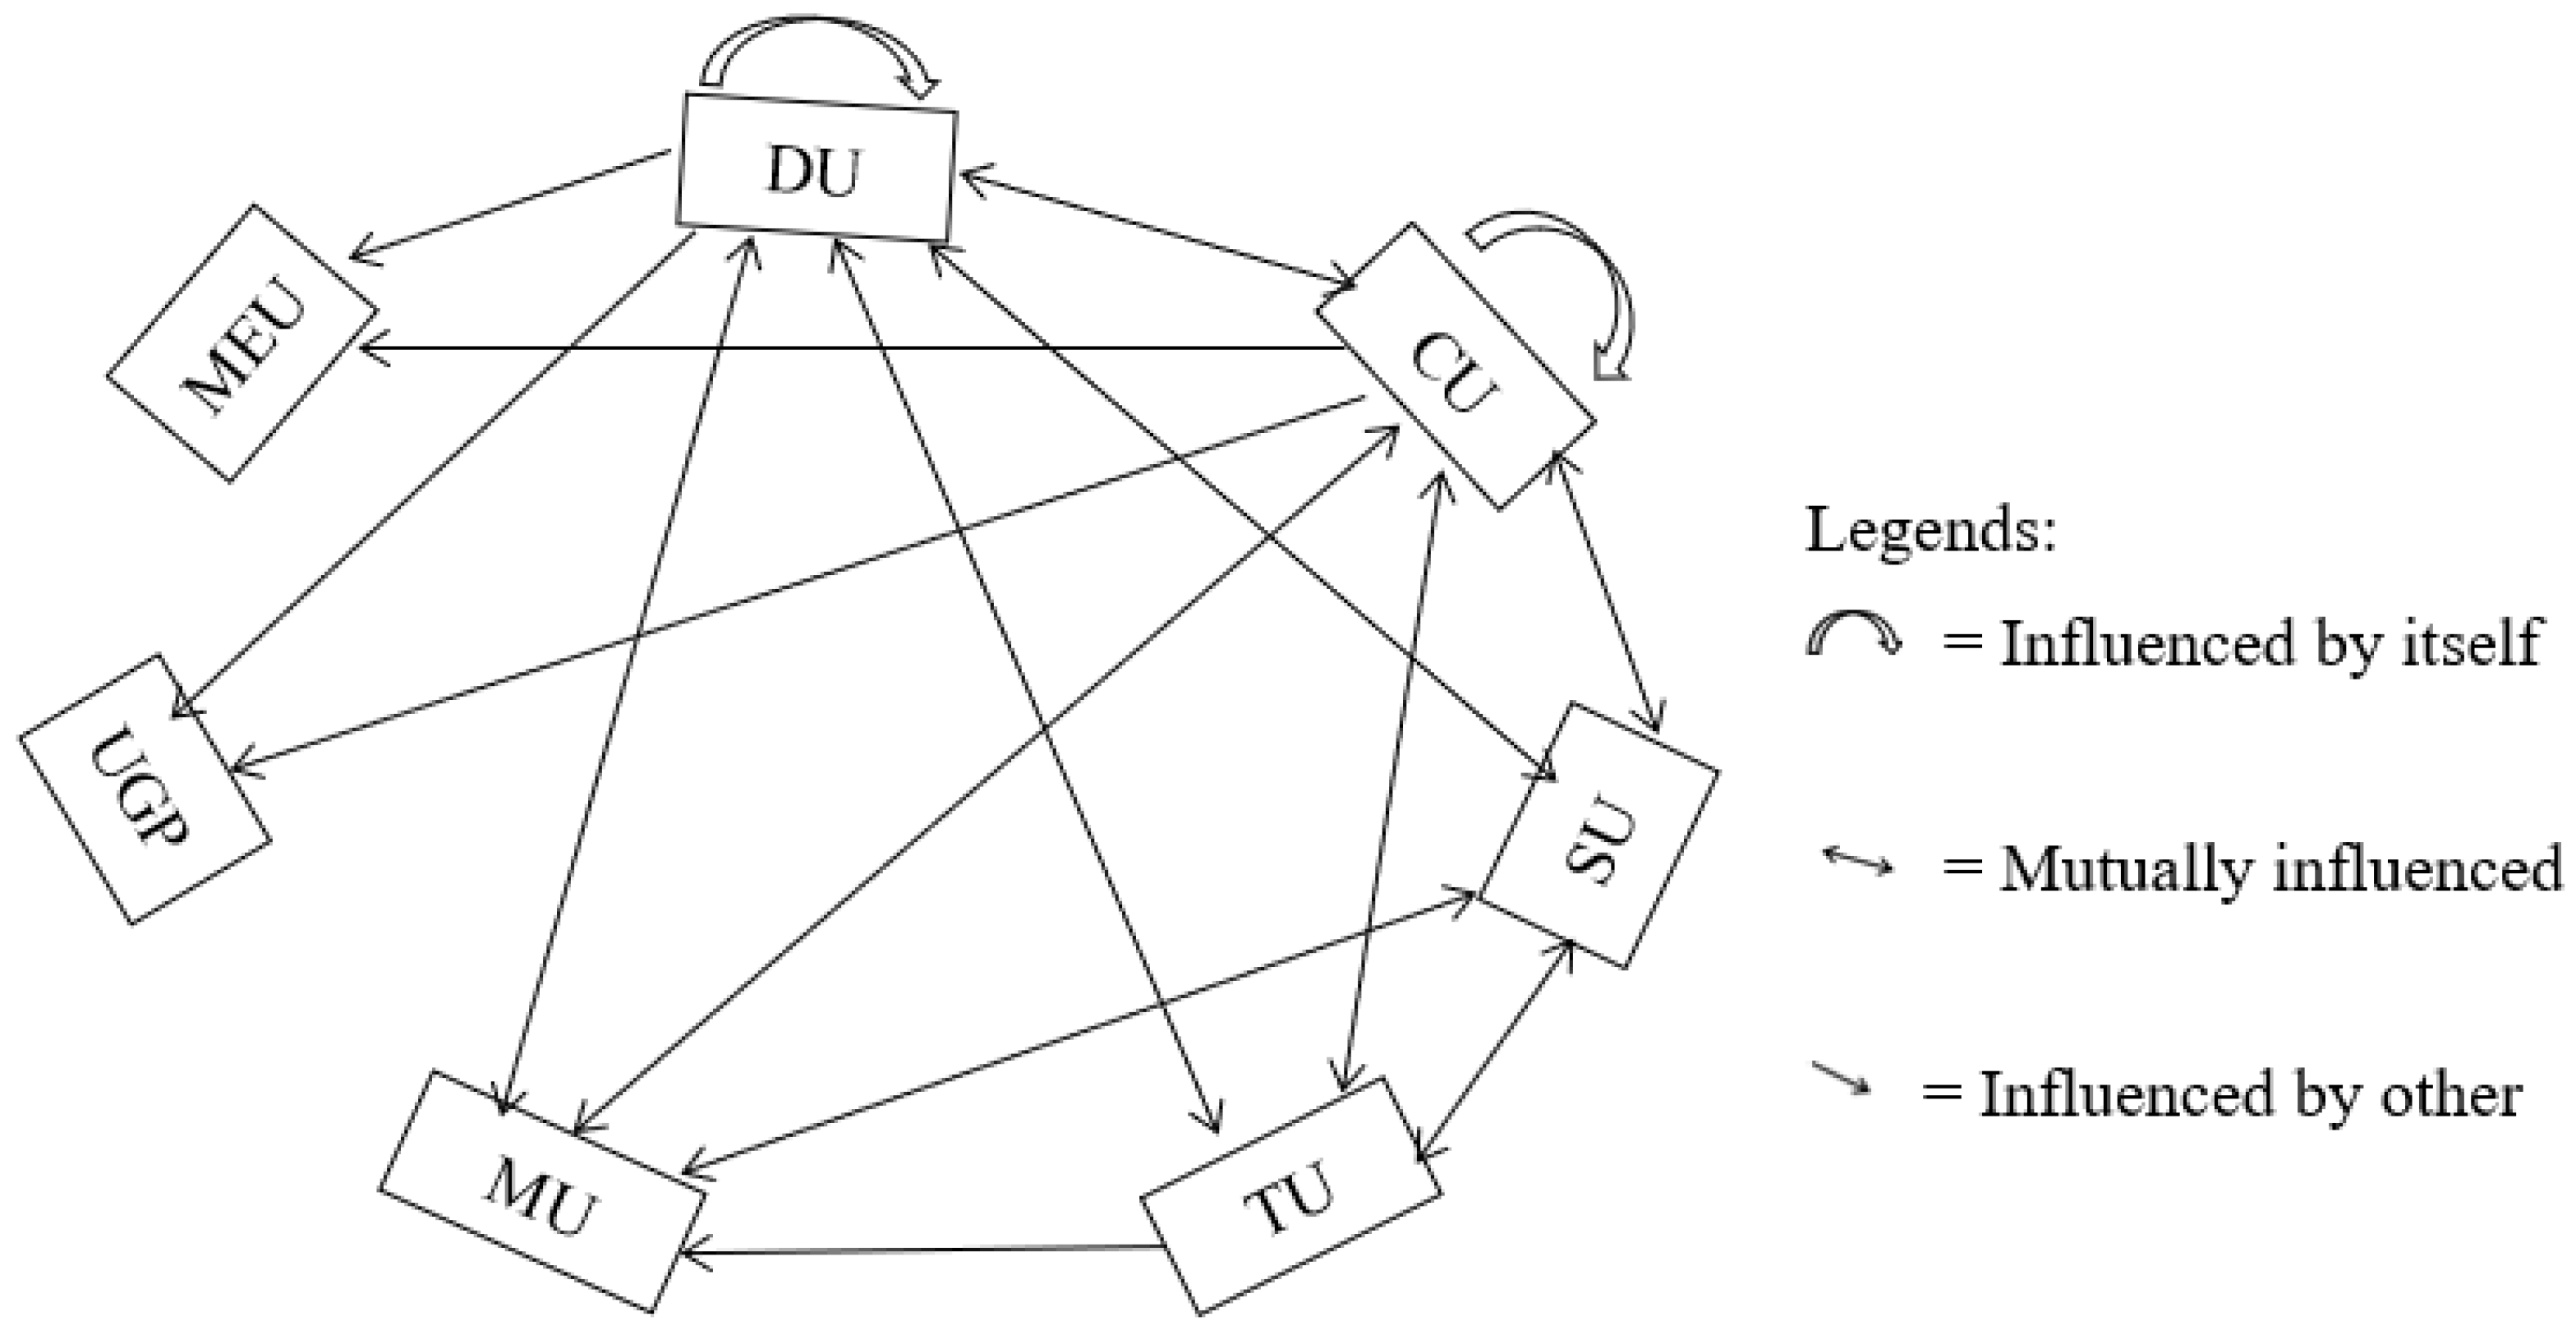
5.2.1. EU Types
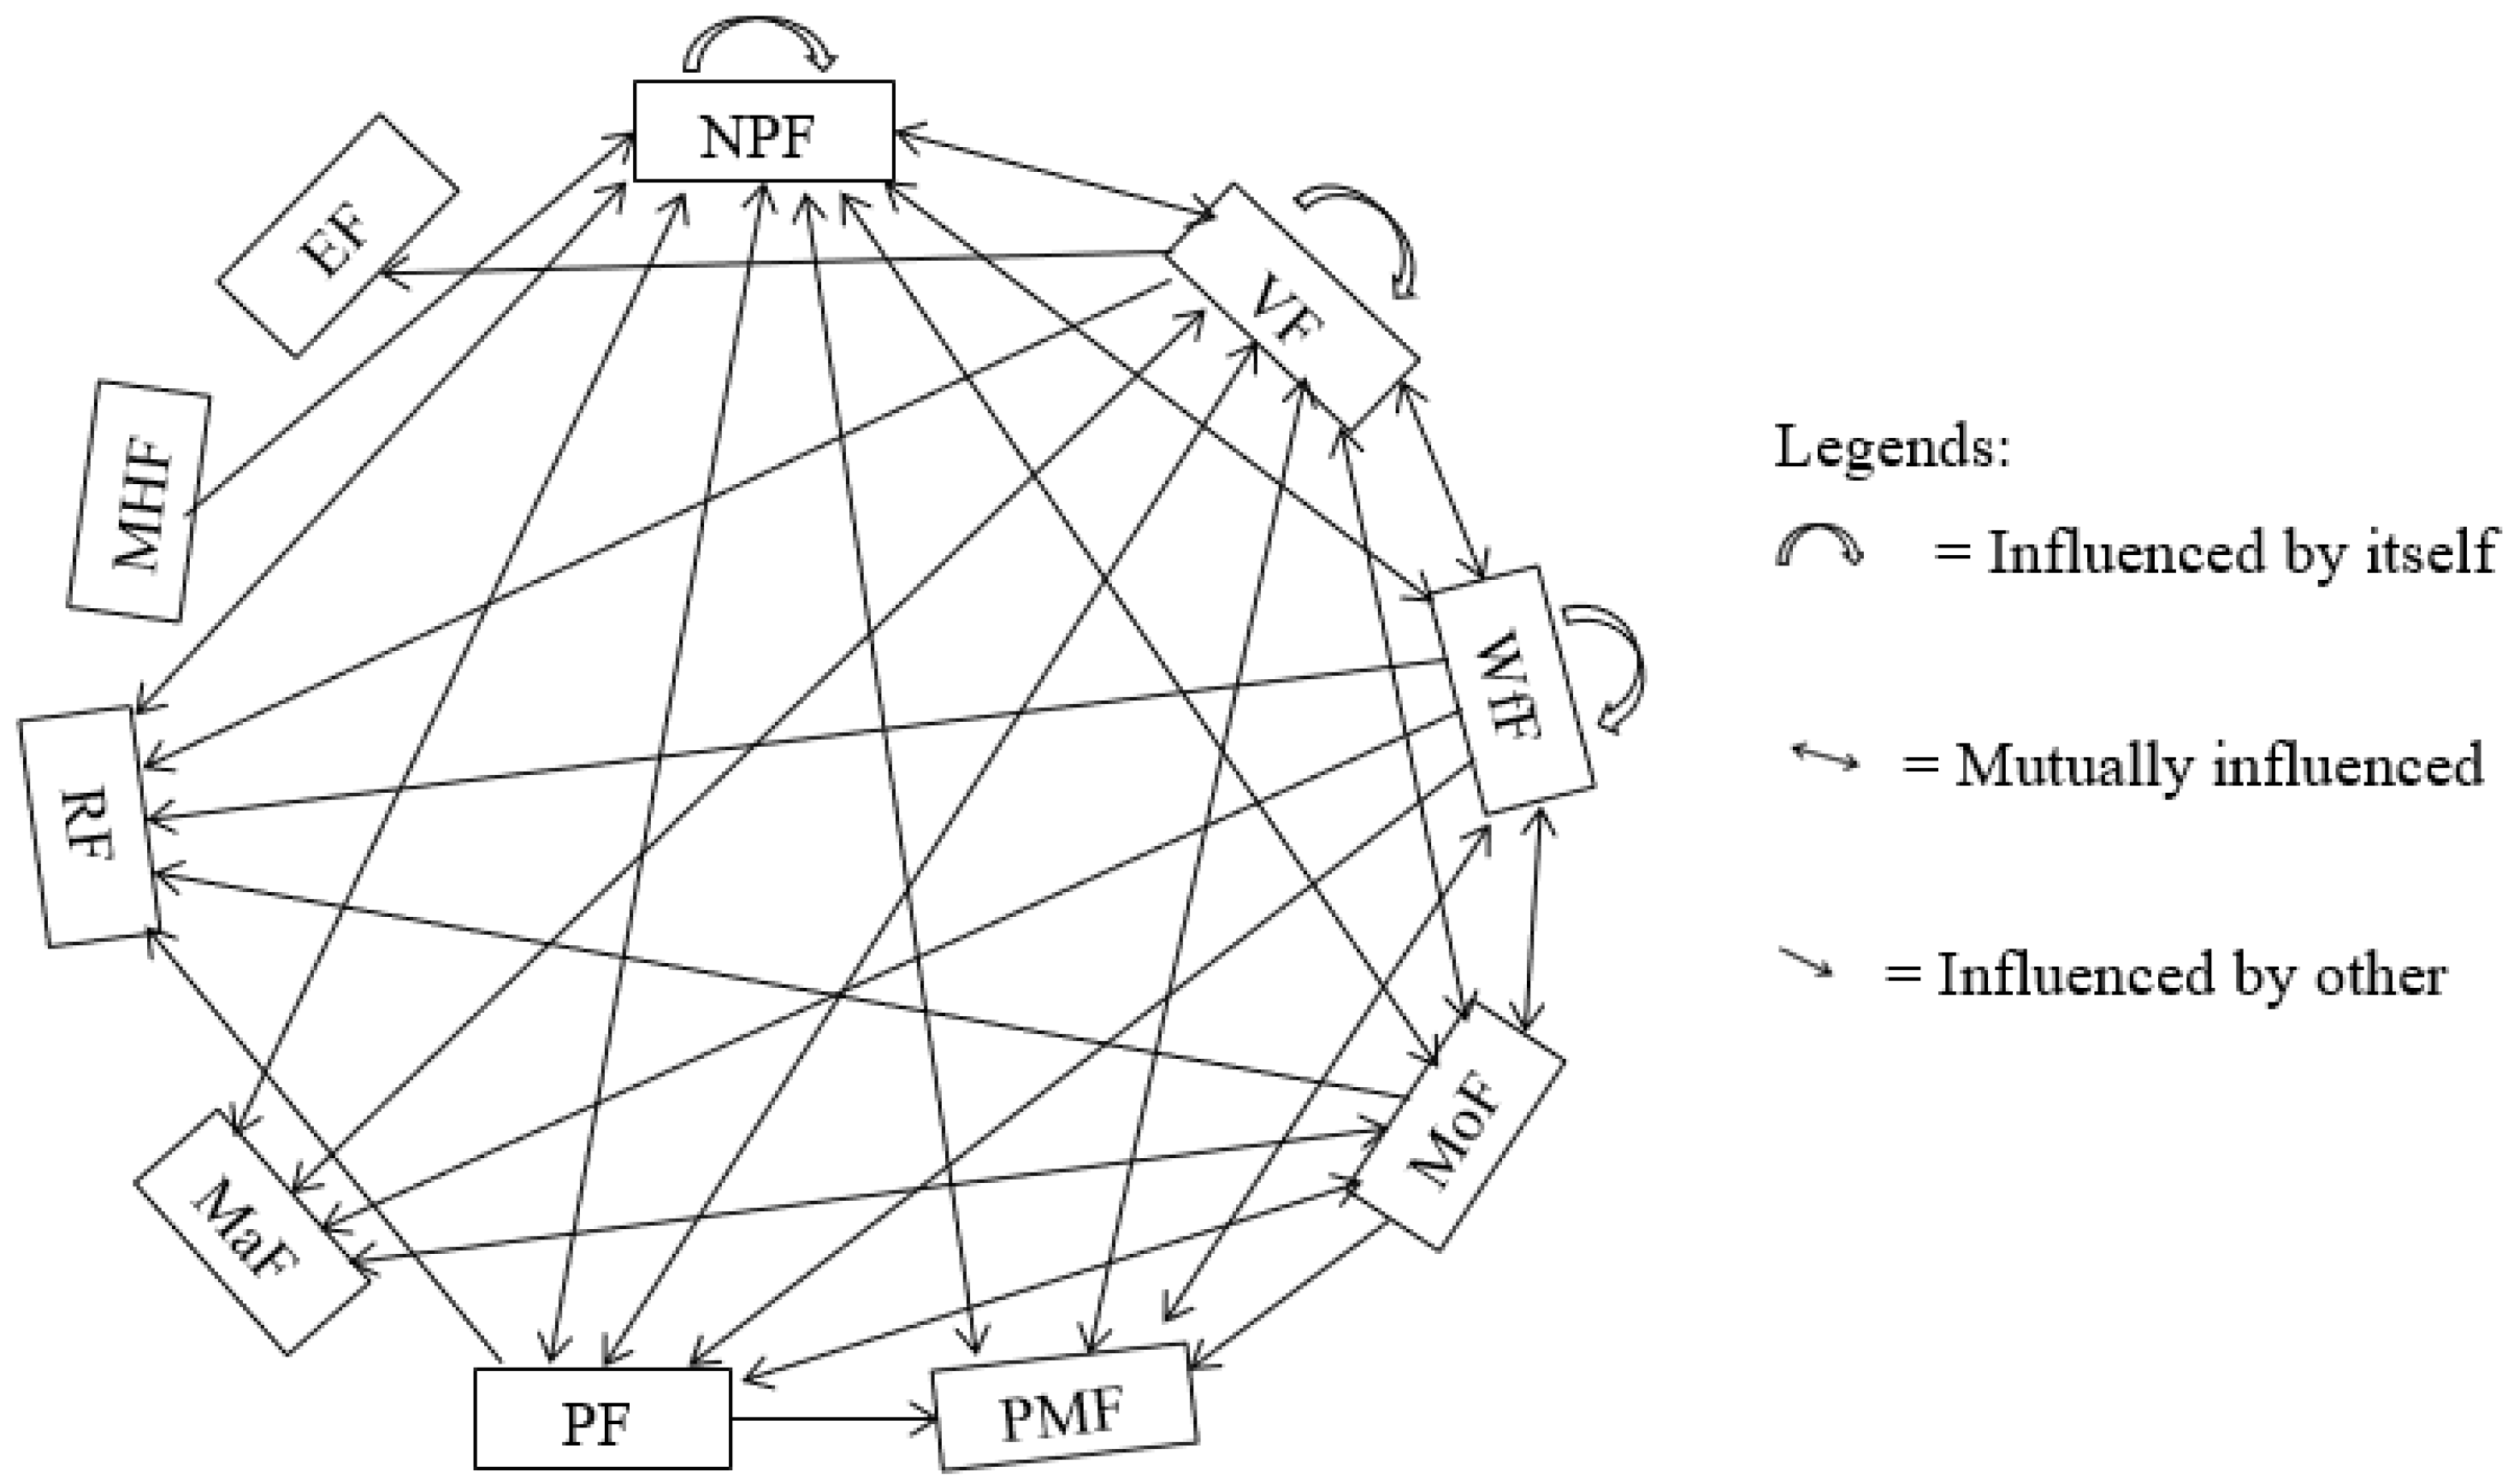
5.2.2. MF Types
5.3. Final Prioritization and Recommendations through FGD for EU and MF Types
6. Discussion
7. Conclusions
Author Contributions
Funding
Informed Consent Statement
Data Availability Statement
Acknowledgments
Conflicts of Interest
Nomenclature
| AHP | Analytical hierarchy process |
| CI | Consistency index |
| CR | Consistency ratio |
| CU | Competitor uncertainty |
| DEMATEL | Decision making trial and evaluation laboratory |
| DU | Demand uncertainty |
| EF | Expansion flexibility |
| EU | Environmental uncertainty |
| FGD | Focus group discussion |
| FMS | Flexible manufacturing system |
| GRA | Grey relational analysis |
| MaF | Machine flexibility |
| MCDM | Multi-criteria decision making |
| MEU | Macro-environmental uncertainty |
| MF | Manufacturing flexibility |
| MHF | Material handling flexibility |
| MoF | Modification flexibility |
| MU | Manufacturing uncertainty |
| NPF | New product flexibility |
| PF | Process flexibility |
| PMF | Product mix flexibility |
| QFD | Quality function deployment |
| RF | Routing flexibility |
| RI | Random consistency index |
| RMG | Ready-made garment |
| SU | Supplier uncertainty |
| TOPSIS | Technique for Order Preference by Similarity to Ideal Solution |
| TU | Technological uncertainty |
| UGP | Uncertainty from government and public view |
| VF | Volume flexibility |
| WfF | Workforce flexibility |
Appendix A
| Uncertainty | Definitions adopted by authors |
| Environmental uncertainty | Environmental uncertainty arises when conditions are constantly changing within a business environment. |
| Demand uncertainty | Uncertainty arises due to changes from consumer/contract ends such as changes in product specification, volume, and lead time. |
| Competitor uncertainty | Uncertainty arises due to changes in the activities of competitors such as a new product launch, promotions, and discounts. |
| Technological uncertainty | Uncertainty arises due to changes in the technology such as new technology and obsolete current technology. |
| Supplier uncertainty | Uncertainty arises due to changes from supplier ends such as changes in product quality, volume, and lead time. |
| Manufacturing uncertainty | Uncertainty arises due to unexpected breakdown and shutdown of partial or full manufacturing operations. |
| Uncertainty from government and public view | Uncertainty arises due to changes in public views and government regulations such as green products and tax. |
| Macro-environmental uncertainty | Uncertainty arises due to changes in the growth rate of the industry and the environmental consciousness of people. |
| Flexibility | Definitions adopted by authors |
| Manufacturing flexibility | Manufacturing flexibility is referred to as the ability of a manufacturing system to successfully address the changes in environmental conditions. |
| New product flexibility | The ability of a manufacturing system to produce a new product with new specifications from the existing ones with minimum loss/penalty. |
| Volume flexibility | The ability to operate profitably at different product output levels. |
| Product mix flexibility | The ability to handle a range of products or variants with existing setups with minimum loss/penalty. |
| Process flexibility | The ability to complete several different tasks in the system using a variety of machines with minimum loss/penalty. |
| Labor flexibility | The ability to change the number of workers, tasks performed by workers, and responsibilities with minimum loss/penalty. |
| Modification flexibility | The ability of a manufacturing process to implement minor design changes in a given product with minimum loss/penalty. |
| Machine flexibility | The ability of the machine to switch operation without requiring major effort. |
| Routing flexibility | The ability to produce a part by alternative routes with minimum loss/penalty. |
| Material handling flexibility | The ability to move different materials efficiently for proper processing and positioning through the manufacturing facilities. |
| Expansion flexibility | The ability of a manufacturing system to increase its capacity and capability when needed. |
References
- ElMaraghy, H.A.; Kuzgunkaya, O.; Urbanic, R.J. Manufacturing Systems Configuration Complexity. CIRP Ann. 2005, 54, 445–450. [Google Scholar] [CrossRef]
- Boyle, T.A.; Scherrer-Rathje, M. An empirical examination of the best practices to ensure manufacturing flexibility. J. Manuf. Technol. Manag. 2009, 20, 348–366. [Google Scholar] [CrossRef]
- Swamidass, P.M. Manufacturing Flexibility. In Innovations in Competitive Manufacturing; Springer: Boston, MA, USA, 2000; pp. 117–136. [Google Scholar]
- Nawanir, G.; Lim, K.T.; Ramayah, T.; Mahmud, F.; Lee, K.L.; Maarof, M.G. Synergistic effect of lean practices on lead time reduction: Mediating role of manufacturing flexibility. Benchmarking Int. J. 2020, 27, 1815–1842. [Google Scholar] [CrossRef]
- Thomé, A.M.T.; Scavarda, L.F.; Pires, S.R.I.; Ceryno, P.; Klingebiel, K. A multi-tier study on supply chain flexibility in the automotive industry. Int. J. Prod. Econ. 2014, 158, 91–105. [Google Scholar] [CrossRef]
- Avittathur, B.; Swamidass, P. Matching plant flexibility and supplier flexibility: Lessons from small suppliers of U.S. manufacturing plants in India. J. Oper. Manag. 2007, 25, 717–735. [Google Scholar] [CrossRef]
- Javid, N.; Khalili-Damghani, K.; Makui, A.; Abdi, F. Multi-dimensional flexibility-complexity trade-off modeling in man-ufacturing systems: Structural equation modeling approach. Kybernetes 2019, 48, 1757–1781. [Google Scholar] [CrossRef]
- Mendes, L.; Machado, J. Employees’ skills, manufacturing flexibility and performance: A structural equation modelling applied to the automotive industry. Int. J. Prod. Res. 2015, 53, 4087–4101. [Google Scholar] [CrossRef]
- Jain, A.; Jain, P.K.; Chan, F.T.S.; Singh, S. A review on manufacturing flexibility. Int. J. Prod. Res. 2013, 51, 5946–5970. [Google Scholar] [CrossRef]
- Slack, N. Flexibility as a Manufacturing Objective. Int. J. Oper. Prod. Manag. 1983, 3, 4–13. [Google Scholar] [CrossRef]
- Gupta, Y.P.; Goyal, S. Flexibility of manufacturing systems: Concepts and measurements. Eur. J. Oper. Res. 1989, 43, 119–135. [Google Scholar] [CrossRef]
- Gerwin, D. Manufacturing Flexibility: A Strategic Perspective. Manag. Sci. 1993, 39, 395–410. [Google Scholar] [CrossRef]
- Upton, D.M. The Management of Manufacturing Flexibility. Calif. Manag. Rev. 1994, 36, 72–89. [Google Scholar] [CrossRef]
- Patel, P.C. Role of manufacturing flexibility in managing duality of formalization and environmental uncertainty in emerging firms. J. Oper. Manag. 2011, 29, 143–162. [Google Scholar] [CrossRef]
- Luo, B.N.; Yu, K. Fits and misfits of supply chain flexibility to environmental uncertainty: Two types of asymmetric effects on performance. Int. J. Logist. Manag. 2016, 27, 862–885. [Google Scholar] [CrossRef]
- Nguyen, H.; Onofrei, G.; Harrison, N.; Truong, D. The influence of cultural compatibility and product complexity on manufacturing flexibility and financial performance. Oper. Manag. Res. 2020, 13, 171–184. [Google Scholar] [CrossRef]
- Chang, S.-C.; Lin, N.-P.; Sheu, C. Aligning manufacturing flexibility with environmental uncertainty: Evidence from high-technology component manufacturers in Taiwan. Int. J. Prod. Res. 2002, 40, 4765–4780. [Google Scholar] [CrossRef]
- Chen, Z.; Sarker, B.R. Aggregate production planning with learning effect and uncertain demand: A case based study. J. Model. Manag. 2015, 10, 296–324. [Google Scholar] [CrossRef]
- Pagell, M.; Krause, D.R. Re-exploring the relationship between flexibility and the external environment. J. Oper. Manag. 2003, 21, 629–649. [Google Scholar] [CrossRef]
- Lysonski, S.; Levas, M.; Lavenka, N. Environmental uncertainty and organizational structure: A product management perspective. J. Prod. Brand Manag. 1995, 4, 7–18. [Google Scholar] [CrossRef]
- Chang, A.-Y. Prioritising the types of manufacturing flexibility in an uncertain environment. Int. J. Prod. Res. 2012, 50, 2133–2149. [Google Scholar] [CrossRef]
- Ansoff, H.I.; Kipley, D.; Lewis, A.O.; Helm-Stevens, R.; Ansoff, R. Implanting Strategic Management, 3rd ed.; Springer: Basel, Switzerland, 2018. [Google Scholar]
- Mishra, R. A hybrid multi-criteria decision-making approach to assess the enablers of manufacturing flexibility under fuzzy environment. Int. J. Qual. Reliab. Manag. 2021, 38, 955–985. [Google Scholar] [CrossRef]
- Das, S.K.; Abdel-Malek, L. Modeling the flexibility of order quantities and lead-times in supply chains. Int. J. Prod. Econ. 2003, 85, 171–181. [Google Scholar] [CrossRef]
- Van der Vaart, T.; van Donk, D.P. Buyer focus: Evaluation of a new concept for supply chain integration. Int. J. Prod. Econ. 2004, 92, 21–30. [Google Scholar] [CrossRef]
- Mishra, R.; Pundir, A.K.; Ganapathy, L. Manufacturing Flexibility Research: A Review of Literature and Agenda for Future Research. Glob. J. Flex. Syst. Manag. 2014, 15, 101–112. [Google Scholar] [CrossRef]
- Bhatnagar, R.; Sohal, A.S. Supply chain competitiveness: Measuring the impact of location factors, uncertainty and manufacturing practices. Technovation 2005, 25, 443–456. [Google Scholar] [CrossRef]
- Saghiri, S.S.; Barnes, S.J. Supplier flexibility and postponement implementation: An empirical analysis. Int. J. Prod. Econ. 2016, 173, 170–183. [Google Scholar] [CrossRef] [Green Version]
- Mishra, R.; Pundir, A.K.; Ganapathy, L. Evaluation and prioritisation of manufacturing flexibility alternatives using integrated AHP and TOPSIS method: Evidence from a fashion apparel firm. Benchmarking Int. J. 2017, 24, 1437–1465. [Google Scholar] [CrossRef]
- Dey, S.; Sharma, R.R.K.; Pandey, B.K. Relationship of Manufacturing Flexibility with Organizational Strategy. Glob. J. Flex. Syst. Manag. 2019, 20, 237–256. [Google Scholar] [CrossRef]
- Fisch, J.H.; Ross, J.-M. Timing Product Replacements under Uncertainty-The Importance of Material-Price Fluctuations for the Success of Products That Are Based on New Materials. J. Prod. Innov. Manag. 2014, 31, 1076–1088. [Google Scholar] [CrossRef] [Green Version]
- Tachizawa, E.M.; Thomsen, C.G. Drivers and sources of supply flexibility: An exploratory study. Int. J. Oper. Prod. Manag. 2007, 27, 1115–1136. [Google Scholar] [CrossRef] [Green Version]
- Hallavo, V. Superior performance through supply chain fit: A synthesis. Supply Chain Manag. Int. J. 2015, 20, 71–82. [Google Scholar] [CrossRef]
- Ding, H.-S.; He, P.; Wu, F.-X.; Sun, Y.-H. The impact of cooperation and competition on the performance of flexible decentralized manufacturing networks. Int. J. Comput. Intell. Syst. 2013, 6, 174–185. [Google Scholar] [CrossRef] [Green Version]
- Srivastava, S.K.; Bansal, S. Measuring and comparing volume flexibility across Indian firms. Int. J. Bus. Perform. Manag. 2013, 14, 38. [Google Scholar] [CrossRef]
- Patel, P.C.; Terjesen, S.; Li, D. Enhancing effects of manufacturing flexibility through operational absorptive capacity and operational ambidexterity. J. Oper. Manag. 2012, 30, 201–220. [Google Scholar] [CrossRef]
- Gupta, D.; Gerchak, Y.; Buzacott, J.A. The optimal mix of flexible and dedicated manufacturing capacities: Hedging against demand uncertainty. Int. J. Prod. Econ. 1992, 28, 309–319. [Google Scholar] [CrossRef]
- Raudberget, D.S.; Levandowski, C.; André, S.; Isaksson, O.; Elgh, F.; Müller, J.; Johansson, J.; Stolt, R. Supporting design platforms by identifying flexible modules. In DS 87-3 Proceedings of the 21st In-ternational Conference on Engineering Design (ICED 17) Vol 3: Product, Services and Systems Design, Vancouver, BC, Canada, 21–25 August 2017; pp. 191–200. [Google Scholar]
- Aprile, D.; Garavelli, A.C.; Giannoccaro, I. Operations planning and flexibility in a supply chain. Prod. Plan. Control 2005, 16, 21–31. [Google Scholar] [CrossRef]
- Taplin, I.M. Flexible Production, Rigid Jobs: Lessons from the Clothing Industry. Work Occup. 1995, 22, 412–438. [Google Scholar] [CrossRef]
- Lloréns, F.J.; Molina, L.M.; Verdú, A.J. Flexibility of manufacturing systems, strategic change and performance. Int. J. Prod. Econ. 2005, 98, 273–289. [Google Scholar] [CrossRef]
- Fry, T.D.; Kher, H.V.; Malhotra, M.K. Managing worker flexibility and attrition in dual resource constrained job shops. Int. J. Prod. Res. 1995, 33, 2163–2179. [Google Scholar] [CrossRef]
- Klingebiel, R.; Rammer, C. Resource Allocation Flexibility for Innovation Performance: The Effects of Breadth, Uncertainty, and Selectiveness. ZEW Discussion Papers. 2011. Available online: http://hdl.handle.net/10419/54965 (accessed on 20 January 2022).
- Callahan, C.M.; Stuebs, M.T. Uncertainty of Future Performance: The Impact of Labor Investment and Labor Flexibility (2 November 2007). AAA 2008 MAS Meeting Paper. Available online: https://ssrn.com/abstract=1004206 or http://0-dx-doi-org.brum.beds.ac.uk/10.2139/ssrn.1004206 (accessed on 20 January 2022).
- Ruiz, M.C.; Cazorla, D.; Cuartero, F.; Macia, H. Improving performance in flexible manufacturing systems. J. Log. Algebraic Program. 2009, 78, 260–273. [Google Scholar] [CrossRef] [Green Version]
- Browne, J.; Dubois, D.; Rathmill, K.; Stecke, K. Classification of Flexible Manufacturing Systems. FMS Mag. 1984, 2, 114–117. Available online: https://papers.ssrn.com/sol3/papers.cfm?abstract_id=3599105 (accessed on 22 January 2022).
- Slack, N. The Flexibility of Manufacturing Systems. Int. J. Oper. Prod. Manag. 1987, 7, 35–45. [Google Scholar] [CrossRef]
- Slack, N. Manufacturing systems flexibility—An assessment procedure. Comput. Integr. Manuf. Syst. 1988, 1, 25–31. [Google Scholar] [CrossRef]
- Dooner, M. Conceptual modelling of manufacturing flexibility. Int. J. Comput. Integr. Manuf. 1991, 4, 135–144. [Google Scholar] [CrossRef]
- Koste, L.L.; Malhotra, M.K. A theoretical framework for analyzing the dimensions of manufacturing flexibility. J. Oper. Manag. 1999, 18, 75–93. [Google Scholar] [CrossRef]
- Narasimhan, R.; Das, A. An Empirical Investigation of the Contribution of Strategic Sourcing to Manufacturing Flexibilities and Performance. Decis. Sci. 1999, 30, 683–718. [Google Scholar] [CrossRef]
- Sawhney, R. Interplay between uncertainty and flexibility across the value-chain: Towards a transformation model of manufacturing flexibility. J. Oper. Manag. 2005, 24, 476–493. [Google Scholar] [CrossRef]
- D’Souza, D.E.; Williams, F.P. Toward a taxonomy of manufacturing flexibility dimensions. J. Oper. Manag. 2000, 18, 577–593. [Google Scholar] [CrossRef]
- Oke, A. A framework for analysing manufacturing flexibility. Int. J. Oper. Prod. Manag. 2005, 25, 973–996. [Google Scholar] [CrossRef]
- Zhang, Q.; Vonderembse, M.A.; Lim, J.-S. Manufacturing flexibility: Defining and analyzing relationships among competence, capability, and customer satisfaction. J. Oper. Manag. 2002, 21, 173–191. [Google Scholar] [CrossRef]
- Shewchuk, J.P.; Moodie, C.L. Definition and Classification of Manufacturing Flexibility Types and Measures. Int. J. Flex. Manuf. Syst. 1998, 10, 325–349. [Google Scholar] [CrossRef]
- Sethi, A.K.; Sethi, S.P. Flexibility in manufacturing: A survey. Int. J. Flex. Manuf. Syst. 1990, 2, 289–328. [Google Scholar] [CrossRef]
- Rogers, P.P. An Empirical Investigation of Manufacturing Flexibility and Organizational Performance as Moderated by Strategic Integration and Organizational Infrastructure. Univ. N. Tex. 2009. Available online: https://0-www-proquest-com.brum.beds.ac.uk/openview/9c2ec3835c8b6008a352108b7f5b9414/1?pq-origsite=gscholar&=18750 (accessed on 25 January 2022).
- Alamro, A.S.; Awwad, A.S.; Anouze, A.L.M. The integrated impact of new product and market flexibilities on opera-tional performance: The case of the Jordanian manufacturing sector. J. Manuf. Technol. Manag. 2018, 29, 1163–1187. [Google Scholar] [CrossRef]
- Lucas, M.T.; Kirillova, O.M. Reconciling the resource-based and competitive positioning perspectives on manufacturing flexibility. J. Manuf. Technol. Manag. 2011, 22, 189–203. [Google Scholar] [CrossRef]
- Pagell, M.; Krause, D.R. A multiple-method study of environmental uncertainty and manufacturing flexibility. J. Oper. Manag. 1999, 17, 307–325. [Google Scholar] [CrossRef]
- Thomke, S.H. The role of flexibility in the development of new products: An empirical study. Res. Policy 1997, 26, 105–119. [Google Scholar] [CrossRef]
- Fung, R.Y.K.; Chong, P.Y. An active styling platform for designing and developing product families. J. Intell. Manuf. 2007, 18, 47–58. [Google Scholar] [CrossRef]
- Menor, L.J.; Kristal, M.M.; Rosenzweig, E.D. Examining the Influence of Operational Intellectual Capital on Capabilities and Performance. Manuf. Serv. Oper. Manag. 2007, 9, 559–578. [Google Scholar] [CrossRef]
- Fung, R.Y.K.; Chong, S.P.Y.; Wang, Y. A Framework of Product Styling Platform Approach: Styling as Intangible Modules. Concurr. Eng. 2004, 12, 89–103. [Google Scholar] [CrossRef]
- Chirra, S.; Kumar, D. Evaluation of Supply Chain Flexibility in Automobile Industry with Fuzzy DEMATEL Approach. Glob. J. Flex. Syst. Manag. 2018, 19, 305–319. [Google Scholar] [CrossRef]
- Wang, E.T.; Tai, J.C.; Grover, V. Examining the Relational Benefits of Improved Interfirm Information Processing Capability in Buyer-Supplier Dyads. MIS Q. 2013, 37, 149–173. [Google Scholar] [CrossRef] [Green Version]
- Palominos, P.; Quezada, L.E.; Gonzalez, M.A. Incorporating the voice of the client in establishing the flexibility requirement in a production system. Int. J. Prod. Econ. 2019, 211, 34–43. [Google Scholar] [CrossRef]
- Kýlýnç, N.; Ýþler, M.; Þener, T. Relation between Contract Manufacturing Positions and Flexibility Levels of Ready Wear Enterprises. Glob. J. Flex. Syst. Manag. 2010, 11, 35–40. [Google Scholar] [CrossRef]
- Bai, C.; Sarkis, J. Improving green flexibility through advanced manufacturing technology investment: Modeling the de-cision process. Int. J. Prod. Econ. 2017, 188, 86–104. [Google Scholar] [CrossRef]
- Ma, L.-C.; Dominguez, B.C.; Kazantzis, N.K.; Ma, Y.H. Economic performance evaluation of process system design flexibility options under uncertainty: The case of hydrogen production plants with integrated membrane technology and CO2 capture. Comput. Chem. Eng. 2017, 99, 214–229. [Google Scholar] [CrossRef] [Green Version]
- Singh, R.K.; Modgil, S.; Acharya, P. Assessment of Supply Chain Flexibility Using System Dynamics Modeling. Glob. J. Flex. Syst. Manag. 2019, 20, 39–63. [Google Scholar] [CrossRef]
- Bai, X.G.; Zhang, X. A Study on the Flexibility of Apparel Manufacturing System. Adv. Mater. Res. 2011, 175, 1011–1015. [Google Scholar] [CrossRef]
- Merschmann, U.; Thonemann, U.W. Supply chain flexibility, uncertainty and firm performance: An empirical analysis of German manufacturing firms. Int. J. Prod. Econ. 2011, 130, 43–53. [Google Scholar] [CrossRef]
- Saglam, Y.C.; Çankaya, S.Y.; Sezen, B. Proactive risk mitigation strategies and supply chain risk management performance: An empirical analysis for manufacturing firms in Turkey. J. Manuf. Technol. Manag. 2020, 32, 1224–1244. [Google Scholar] [CrossRef]
- Umam, R.; Sommanawat, K. Strategic Flexibility, Manufacturing Flexibility, and Firm Performance Under the Presence of an Agile Supply Chain: A Case of Strategic Management in Fashion Industry. Pol. J. Manag. Stud. 2019, 19, 407–418. [Google Scholar] [CrossRef]
- Sreedevi, R.; Saranga, H. Uncertainty and supply chain risk: The moderating role of supply chain flexibility in risk mitigation. Int. J. Prod. Econ. 2017, 193, 332–342. [Google Scholar] [CrossRef]
- Chan, A.T.L.; Ngai, E.W.T.; Moon, K.K.L. The effects of strategic and manufacturing flexibilities and supply chain agility on firm performance in the fashion industry. Eur. J. Oper. Res. 2017, 259, 486–499. [Google Scholar] [CrossRef]
- Lin, Y.; Zhao, S.; Li, Y. A study of network-building HR practices for TMT, strategic flexibility and firm performance: The moderating role of environmental uncertainty. Nankai Bus. Rev. Int. 2014, 5, 95–114. [Google Scholar] [CrossRef]
- Saeed, M.A.; Tabassum, H.; Zahid, M.M.; Jiao, Y.; Nauman, S. Organizational Flexibility and Project Portfolio Performance: The Roles of Environmental Uncertainty and Innovation Capability. Eng. Manag. J. 2021, 1–16. [Google Scholar] [CrossRef]
- Haripersad, Y. Labour Market Flexibility, Wages and Livelihoods in the Clothing Value Chain: A Study of Clothing Manufacturing and Clothing Retail Workers in Durban’s Surrounding Areas; University of KwaZulu-Natal: Durban, South Africa, 2012. [Google Scholar]
- Asikhia, O.U.; Arokodare, M.A. Planning flexibility, environmental uncertainty and organizational performance of selected oil and gas service firms in Lagos and Rivers States, Nigeria. Open J. Econ. Commer. 2019, 2, 49–57. [Google Scholar] [CrossRef]
- Rothstein, F.A. Flexibility for Whom? Small-Scale Garment Manufacturing in Rural Mexico. Petty Capital. Glob. Flex. Entrep. Econ. Dev. 2005, 1, 67–81. [Google Scholar]
- Beach, R.; Muhlemann, A.; Price, D.; Paterson, A.; Sharp, J. A review of manufacturing flexibility. Eur. J. Oper. Res. 2000, 122, 41–57. [Google Scholar] [CrossRef]
- Xu, X.-G.; Han, W.-M.; Ye, T.-F. Flexibility of service-oriented manufacturing: A literature review. Afr. J. Bus. Manag. 2011, 5, 13534–13540. [Google Scholar]
- Shi, D.; Daniels, R.L. A survey of manufacturing flexibility: Implications for e-business flexibility. IBM Syst. J. 2003, 42, 414–427. [Google Scholar] [CrossRef]
- He, Y.; Lai, K.K.; Sun, H.; Chen, Y. The impact of supplier integration on customer integration and new product performance: The mediating role of manufacturing flexibility under trust theory. Int. J. Prod. Econ. 2014, 147, 260–270. [Google Scholar] [CrossRef]
- Kumar, S.; Goyal, A.; Singhal, A. Manufacturing Flexibility and its Effect on System Performance. Jordan J. Mech. Ind. Eng. 2017, 11, 105–112. [Google Scholar]
- Saaty, T.L. How to make a decision: The analytic hierarchy process. Eur. J. Oper. Res. 1990, 48, 9–26. [Google Scholar] [CrossRef]
- Gabus, A.; Fontela, E. World Problems, an Invitation to Further thought within the Framework of DEMATEL; Battelle Geneva Research Center: Geneva, Switzerland, 1972; pp. 1–8. [Google Scholar]
- Park-Poaps, H.; Bari, S.; Sarker, Z.W. Bangladeshi clothing manufacturers’ technology adoption in the global free trade environment. J. Fash. Mark. Manag. Int. J. 2021, 25, 354–370. [Google Scholar] [CrossRef]
- Alam, S.; Natsuda, K. The competitive factors of the Bangladeshi garment industry in the post-MFA era. Can. J. Dev. Stud. 2016, 37, 316–336. [Google Scholar] [CrossRef]
- Akter, A. Bangladesh’s Apparel Export Trend of 2018. Text. Today 2019, 26. Available online: https://www.textiletoday.com.bd/bangladeshs-apparel-export-trend-2018 (accessed on 10 January 2022).
- BGMEA. Why Bangladesh a Preferred Destination of Apparel Sourcing Long-Term Growth. 2020. Available online: www.bgmea.com.bd/blog/story/2 (accessed on 10 January 2022).
- BTMA. Global Updates & Events. China Tops the Apparel Export Market then Who’s Next? Bangladesh or Vietnam? News-Letter March 2020. Available online: https://www.btmadhaka.com/newsletter-march-2020/ (accessed on 10 January 2022).
- Lu, S. World Textiles and Apparel Trade in 2019. Available online: https://shenglufashion.com/2020/08/03/wto-reports-world-textiles-and-apparel-trade-in-2019/ (accessed on 12 January 2022).
- Amed, I.; Balchandani, A.; Beltrami, M.A.; Berg, S.; Hedrich, R.F. The State of Fashion 2019: A year of awakening. Eur. US Asia 2019. Available online: https://www.mckinsey.de/industries/retail/our-insights/state-of-fashion/ (accessed on 12 January 2022).
- Moin, C.J.; Sarwar, F.; Doulah, A.B.M.S. Investigation of a Hybrid Production System for Mass-Customization Apparel Manufacturing. J. Text. Appar. Technol. Manag. 2013, 8, 1–10. Available online: https://ojs.cnr.ncsu.edu/index.php/JTATM/article/view/4580/2539 (accessed on 12 January 2022).
- Tomastik, R.; Luh, P.; Liu, G. Scheduling flexible manufacturing systems for apparel production. IEEE Trans. Robot. Autom. 1996, 12, 789–799. [Google Scholar] [CrossRef]
- Taqi, H.M.M.; Ahmed, H.N.; Paul, S.; Garshasbi, M.; Ali, S.M.; Kabir, G.; Paul, S.K. Strategies to Manage the Impacts of the COVID-19 Pandemic in the Supply Chain: Implications for Improving Economic and Social Sustainability. Sustainability 2020, 12, 9483. [Google Scholar] [CrossRef]


| SL | Environmental Uncertainty | Source | Similar Term and Source | Frequency of Study |
|---|---|---|---|---|
| 1 | Supplier uncertainty | [17,26,27,28,29,30] | Material price uncertainty [31] Supply volume uncertainty [28,32] Supply mix uncertainty [28,32] Supply delivery uncertainty [32] Supply new product design uncertainty [28] Supply product modification uncertainty [28] | 6 + 8 = 14 |
| 2 | Demand uncertainty | [17,27,33,34,35,36,37] | Uncertainties such as fluctuating requirements [38] Demand variability pattern (volume, mix) [39] | 7 + 2 = 9 |
| 3 | Technological uncertainty | [26,29,33,35,36,40] | Future technical development [38] Product technology uncertainty [17] | 6 + 2 = 8 |
| 4 | Internal uncertainty | [26] | Machine downtime [26] Departmental coordination problem [26] Resource acquisition and distributor problems [26] Workforce factor [26] Process uncertainty [27] | 1 + 5 = 6 |
| 5 | Competitor uncertainty | [17,26,29,36] | 4 | |
| 6 | Customer uncertainty | [26,29] | 2 | |
| 7 | Financial resource endeavor | [41] | Resource-constrained [42] | 1 + 1 = 2 |
| 8 | Sourcing uncertainty | [30] | 1 | |
| 9 | Government regulations | [26] | 1 | |
| 10 | Macroeconomic fluctuation | [26] | 1 | |
| 11 | Macro-environment uncertainty | [29] | 1 | |
| 12 | Delivery uncertainty | [26] | 1 | |
| 13 | Commercial uncertainty | [43] | 1 | |
| 14 | Earnings uncertainty | [44] | 1 |
| SL | Manufacturing Flexibility | Source | Similar Term and Source | Frequency of Study |
|---|---|---|---|---|
| 1 | New product flexibility | [17,29,30,31,36,59,60,61] | Flexibility in design platforms [38] Design flexibility [62] MF in product styling [63] Product innovation [64] Pleasure-oriented product development with manufacturing flexibility [65] | 8 + 5 = 13 |
| 2 | Volume flexibility | [17,19,26,30,41,60,66,67,68,69] | 10 | |
| 3 | Labor flexibility | [26,30,36,40,44,60,66,70] | Worker flexibility [42] | 8 + 1 = 9 |
| 4 | Process flexibility | [26,30,39,41,64,67,68,69] | Process system design flexibility [71] | 8 + 1 = 9 |
| 5 | Product mix flexibility | [26,29,61] | Mix flexibility [17,19,36,37,60,67] | 3 + 6 = 9 |
| 6 | Product flexibility | [26,30,41,68,69,72,73] | 7 | |
| 7 | Machine flexibility | [26,30,36,60,68,69,70] | 7 | |
| 8 | Supply chain flexibility | [60,74,75,76] | Supply chain responsiveness [33] Product-dominant supply chain flexibility [15] Service-dominant supply chain flexibility [15] | 4 + 3 = 7 |
| 9 | Logistics flexibility | [39,60] | Distribution flexibility [39] Physical distribution flexibility [72] Alternative logistics flexibility [66] Distribution/logistics flexibility [77] | 2 + 4 = 6 |
| 10 | Routing flexibility | [26,30,41,60,68,70] | 6 | |
| 11 | Modification flexibility | [19,60,61,67,70] | 5 | |
| 12 | Supplier flexibility | [30,32,39,66,77] | 5 | |
| 13 | Material handling flexibility | [26,30,60,70] | 4 | |
| 14 | Strategic flexibility | [76,78,79,80] | 4 | |
| 15 | Delivery flexibility | [19,26,29,30] | 4 | |
| 16 | Operations flexibility | [30,60,70] | Operational flexibility [80] | 1 + 3 = 4 |
| 17 | Expansion flexibility | [30,41,60] | 3 | |
| 18 | Sourcing flexibility | [30,66] | 2 | |
| 19 | Marketing flexibility | [26,59] | 2 | |
| 20 | Trans-shipment flexibility | [20,66] | 2 | |
| 21 | Subcontracting flexibility | [66] | 1 | |
| 22 | Storage flexibility | [66] | 1 | |
| 23 | Flexible information system | [66] | 1 | |
| 24 | Flexible information visibility | [66] | 1 | |
| 25 | Supplier collaboration flexibility | [66] | 1 | |
| 26 | Inter-organizational relationship flexibility | [66] | 1 | |
| 27 | Organizational environment flexibility | [66] | 1 | |
| 28 | Meta flexibility | [41] | 1 | |
| 29 | Assembler flexibility | [39] | 1 | |
| 30 | Access flexibility | [30] | 1 | |
| 31 | Investment flexibility | [34] | 1 | |
| 32 | Procurement flexibility | [39] | 1 | |
| 33 | Continuous improvement flexibility | [30] | 1 | |
| 34 | Throughput time reduction flexibility | [30] | 1 | |
| 35 | Ramp-up time reduction flexibility | [30] | 1 | |
| 36 | Decoupling point flexibility | [30] | 1 | |
| 37 | Postponement flexibility | [30] | 1 | |
| 38 | Demand flexibility | [26] | 1 | |
| 39 | Demand management flexibility | [72] | 1 | |
| 40 | Labor market flexibility | [81] | Employment or numerical, work process or functional, and wage flexibility [81] | 1 |
| 41 | Flexibility in resource allocation | [43] | 1 | |
| 42 | Structural flexibility in production | [80] | 1 | |
| 43 | Planning flexibility | [82] | 1 | |
| 44 | Customer-oriented flexibility | [74] | 1 | |
| 45 | Green product flexibility | [70] | 1 | |
| 46 | Energy flexibility | [70] | 1 | |
| 47 | Pollution flexibility | [70] | 1 | |
| 48 | Recycling flexibility | [70] | 1 | |
| 49 | Biodegradability flexibility | [70] | 1 | |
| 50 | Changeover flexibility | [19] | 1 | |
| 51 | Material flexibility | [69] | 1 |
| Identity | Experience Range | Highest Education | Designation | |
|---|---|---|---|---|
| 1 | AA | More than 20 years | Ph.D | Professor |
| 2 | AB | More than 20 years | Ph.D | Professor |
| 3 | AC | More than 20 years | Ph.D | Professor |
| 4 | AD | 10–20 years | Ph.D | Associate Professor |
| 5 | AE | 10–20 years | M.Sc. | Associate Professor |
| 6 | IA | More than 20 years | B.Sc. | Top management |
| 7 | IB | More than 20 years | B.Sc. | Top management |
| 8 | IC | 10–20 years | M.Sc. | Top management |
| 9 | ID | 10–20 years | MBA | Top management |
| 10 | IE | 10–20 years | B.Sc. | Top management |
| 11 | IF | 10–20 years | B.Sc. | Top management |
| 12 | IG | 10–20 years | B.Sc. | Top management |
| 13 | IH | 5–10 years | B.Sc. | Mid management |
| 14 | II | 5–10 years | B.Sc. | Mid management |
| 15 | IJ | 5–10 years | B.Sc. | Mid management |
| SL | Environmental Uncertainty | Remarks | Abbreviation |
|---|---|---|---|
| 1 | Demand uncertainty | -- | DU |
| 2 | Competitor uncertainty | -- | CU |
| 3 | Technological uncertainty | -- | TU |
| 4 | Supplier uncertainty | -- | SU |
| 5 | Manufacturing uncertainty | Renamed from internal uncertainty from Table 1 | MU |
| 6 | Uncertainty from government and public view | Renamed from government regulations | UGP |
| 7 | Macro-environment uncertainty | Merged from macroeconomic fluctuation and macro-environment uncertainty | MEU |
| SL | Manufacturing Flexibility | Remarks | Abbreviation |
|---|---|---|---|
| 1 | New product flexibility | -- | NPF |
| 2 | Modification flexibility | -- | MoF |
| 3 | Volume flexibility | -- | VF |
| 4 | Product mix flexibility | Merged from product mix flexibility and product flexibility | PMF |
| 5 | Process flexibility | -- | PF |
| 6 | Workforce flexibility | Renamed from labor flexibility | WfF |
| 7 | Machine flexibility | -- | MaF |
| 8 | Routing flexibility | -- | RF |
| 9 | Material handling flexibility | -- | MHF |
| 10 | Expansion flexibility | -- | EF |
| Scale | Pairwise Comparison Matrix | ||||
|---|---|---|---|---|---|
| Equal importance = 1 | X | Y | Z | W | |
| Moderate importance = 3 | X | 1 | 9 | 1/5 | |
| Strong importance = 5 | Y | 1/9 | 1 | ||
| Very strong importance = 7 | Z | 1 | |||
| Extreme importance = 9 | W | 5 | 1 | ||
| For a compromise between the above values = 2, 4, 6, and 8. | |||||
| Scale | Pairwise Comparison Matrix | |||||||||||
|---|---|---|---|---|---|---|---|---|---|---|---|---|
| Intensity of Influence | Letter Grade | Integer Value | ||||||||||
| No influence | N | 0 | X | Y | Z | W | X | Y | Z | W | ||
| Low influence | L | 1 | X | N | M | VH | X | 0 | 2 | 4 | ||
| Medium influence | M | 2 | Y | N | Y | 0 | ||||||
| High influence | H | 3 | Z | N | Z | 0 | ||||||
| Very high influence | VH | 4 | W | L | N | W | 1 | 0 | ||||
| EU Types | Pairwise Comparison Matrix | EU Types | Normalized Matrix | Weight Matrix | Rank | ||||||||||||
|---|---|---|---|---|---|---|---|---|---|---|---|---|---|---|---|---|---|
| DU | CU | TU | SU | MU | UGP | MEU | DU | CU | TU | SU | MU | UGP | MEU | ||||
| DU | 1.00 | 4.00 | 6.00 | 4.00 | 3.00 | 8.00 | 7.00 | DU | 0.44 | 0.66 | 0.40 | 0.36 | 0.26 | 0.24 | 0.24 | 0.37 | 1 |
| CU | 0.25 | 1.00 | 4.00 | 5.00 | 3.00 | 7.00 | 7.00 | CU | 0.11 | 0.16 | 0.27 | 0.45 | 0.26 | 0.21 | 0.24 | 0.24 | 2 |
| TU | 0.17 | 0.25 | 1.00 | 0.33 | 2.00 | 6.00 | 5.00 | TU | 0.07 | 0.04 | 0.07 | 0.03 | 0.17 | 0.18 | 0.17 | 0.105 | 4 |
| SU | 0.25 | 0.20 | 3.00 | 1.00 | 2.00 | 6.00 | 5.00 | SU | 0.11 | 0.03 | 0.20 | 0.09 | 0.17 | 0.18 | 0.17 | 0.14 | 3 |
| MU | 0.33 | 0.33 | 0.50 | 0.50 | 1.00 | 5.00 | 3.00 | MU | 0.15 | 0.05 | 0.03 | 0.04 | 0.09 | 0.15 | 0.10 | 0.09 | 5 |
| UGP | 0.13 | 0.14 | 0.17 | 0.17 | 0.20 | 1.00 | 1.00 | UGP | 0.06 | 0.02 | 0.01 | 0.01 | 0.02 | 0.03 | 0.03 | 0.03 | 7 |
| MEU | 0.14 | 0.14 | 0.20 | 0.20 | 0.33 | 1.00 | 1.00 | MEU | 0.06 | 0.02 | 0.01 | 0.02 | 0.03 | 0.03 | 0.03 | 0.03 | 6 |
| DU | CU | TU | SU | MU | UGP | MEU | Weighted Sum Value | Weight | Weighted Sum Value/Weight | Consistency Check | ||
|---|---|---|---|---|---|---|---|---|---|---|---|---|
| DU | 0.37 | 0.97 | 0.63 | 0.55 | 0.26 | 0.21 | 0.21 | 3.20 | 0.37 | 8.64 | λmax | 7.77 |
| CU | 0.09 | 0.24 | 0.42 | 0.68 | 0.26 | 0.19 | 0.21 | 2.10 | 0.24 | 8.65 | CI | 0.13 |
| TU | 0.06 | 0.06 | 0.10 | 0.05 | 0.18 | 0.16 | 0.15 | 0.76 | 0.10 | 7.24 | RI | 1.32 |
| SU | 0.09 | 0.05 | 0.31 | 0.14 | 0.18 | 0.16 | 0.15 | 1.08 | 0.14 | 7.89 | CR | 0.097 |
| MU | 0.12 | 0.08 | 0.05 | 0.07 | 0.09 | 0.13 | 0.09 | 0.64 | 0.09 | 7.22 | Consistent Matrix | |
| UGP | 0.05 | 0.03 | 0.02 | 0.02 | 0.02 | 0.03 | 0.03 | 0.20 | 0.03 | 7.36 | ||
| MEU | 0.05 | 0.03 | 0.02 | 0.03 | 0.03 | 0.03 | 0.03 | 0.22 | 0.03 | 7.38 | ||
| EU Type | Weight of EU Types by Ten Industry Experts | Average Weight | Rank | |||||||||
|---|---|---|---|---|---|---|---|---|---|---|---|---|
| IA | IB | IC | ID | IE | IF | IG | IH | II | IJ | |||
| DU | 0.37 | 0.39 | 0.41 | 0.36 | 0.40 | 0.37 | 0.39 | 0.31 | 0.12 | 0.10 | 0.322 | 1 |
| CU | 0.24 | 0.13 | 0.22 | 0.20 | 0.20 | 0.21 | 0.26 | 0.22 | 0.19 | 0.21 | 0.208 | 2 |
| TU | 0.10 | 0.12 | 0.16 | 0.16 | 0.13 | 0.13 | 0.10 | 0.17 | 0.09 | 0.07 | 0.123 | 4 |
| SU | 0.14 | 0.22 | 0.10 | 0.13 | 0.15 | 0.10 | 0.12 | 0.12 | 0.22 | 0.30 | 0.16 | 3 |
| MU | 0.09 | 0.08 | 0.05 | 0.08 | 0.08 | 0.12 | 0.09 | 0.07 | 0.31 | 0.25 | 0.122 | 5 |
| UGP | 0.03 | 0.03 | 0.04 | 0.03 | 0.03 | 0.04 | 0.03 | 0.06 | 0.04 | 0.04 | 0.037 | 6 |
| MEU | 0.03 | 0.03 | 0.02 | 0.02 | 0.02 | 0.02 | 0.02 | 0.05 | 0.03 | 0.03 | 0.027 | 7 |
| CR | 0.097 | 0.098 | 0.093 | 0.094 | 0.091 | 0.084 | 0.098 | 0.09996 | 0.078 | 0.074 | ||
| MF Types | Weight of MF Types by Ten Industry Experts | |||||||||
|---|---|---|---|---|---|---|---|---|---|---|
| IA | IB | IC | ID | IE | IF | IG | IH | II | IJ | |
| NPF | 0.29 | 0.16 | 0.32 | 0.28 | 0.27 | 0.24 | 0.09 | 0.22 | 0.11 | 0.16 |
| VF | 0.17 | 0.28 | 0.21 | 0.19 | 0.14 | 0.18 | 0.10 | 0.15 | 0.17 | 0.12 |
| PMF | 0.08 | 0.10 | 0.12 | 0.14 | 0.13 | 0.18 | 0.12 | 0.13 | 0.11 | 0.15 |
| PF | 0.09 | 0.08 | 0.12 | 0.09 | 0.13 | 0.11 | 0.16 | 0.12 | 0.07 | 0.07 |
| WfF | 0.11 | 0.20 | 0.08 | 0.08 | 0.11 | 0.11 | 0.23 | 0.10 | 0.18 | 0.11 |
| MoF | 0.10 | 0.07 | 0.06 | 0.08 | 0.11 | 0.10 | 0.18 | 0.09 | 0.24 | 0.25 |
| MaF | 0.08 | 0.05 | 0.03 | 0.05 | 0.05 | 0.02 | 0.07 | 0.07 | 0.03 | 0.05 |
| RF | 0.03 | 0.03 | 0.03 | 0.04 | 0.03 | 0.02 | 0.03 | 0.05 | 0.03 | 0.03 |
| EF | 0.02 | 0.01 | 0.02 | 0.03 | 0.02 | 0.02 | 0.02 | 0.04 | 0.02 | 0.02 |
| MHF | 0.04 | 0.03 | 0.02 | 0.02 | 0.01 | 0.02 | 0.02 | 0.03 | 0.03 | 0.03 |
| CR | 0.095 | 0.097 | 0.084 | 0.099 | 0.084 | 0.064 | 0.096 | 0.099 | 0.087 | 0.090 |
| MF Types | Average Weight | Rank |
|---|---|---|
| NPF | 0.214 | 1 |
| VF | 0.171 | 2 |
| WfF | 0.131 | 3 |
| MoF | 0.128 | 4 |
| PMF | 0.126 | 5 |
| PF | 0.104 | 6 |
| MaF | 0.050 | 7 |
| RF | 0.032 | 8 |
| MHF | 0.025 | 9 |
| EF | 0.022 | 10 |
| EU Types | Pairwise Comparison Matrix with Letter Grade | EU Types | Pairwise Comparison Matrix with Integer Value | ||||||||||||
|---|---|---|---|---|---|---|---|---|---|---|---|---|---|---|---|
| DU | CU | SU | TU | MU | UGP | MEU | DU | CU | SU | TU | MU | UGP | MEU | ||
| DU | N | VH | VH | VH | VH | L | H | DU | 0 | 4 | 4 | 4 | 4 | 1 | 3 |
| CU | VH | N | VH | VH | VH | L | H | CU | 4 | 0 | 4 | 4 | 4 | 1 | 3 |
| SU | L | H | N | H | H | H | L | SU | 1 | 3 | 0 | 3 | 3 | 3 | 1 |
| TU | M | H | H | N | M | L | L | TU | 2 | 3 | 3 | 0 | 2 | 1 | 1 |
| MU | L | L | L | M | N | L | L | MU | 1 | 1 | 1 | 2 | 0 | 1 | 1 |
| UGP | M | L | L | L | L | N | L | UGP | 2 | 1 | 1 | 1 | 1 | 0 | 1 |
| MEU | L | M | L | L | L | L | N | MEU | 1 | 2 | 1 | 1 | 1 | 1 | 0 |
| EU Types | Initial Direct Relation Matrix, A | EU Types | Normalized Direct Relation Matrix, Y | ||||||||||||
|---|---|---|---|---|---|---|---|---|---|---|---|---|---|---|---|
| DU | CU | SU | TU | MU | UGP | MEU | DU | CU | SU | TU | MU | UGP | MEU | ||
| DU | 0 | 3.64 | 3.45 | 3.27 | 2.64 | 1.45 | 2.27 | DU | 0 | 0.22 | 0.21 | 0.20 | 0.16 | 0.09 | 0.14 |
| CU | 3.27 | 0 | 3.36 | 2.09 | 1.91 | 1.82 | 2.27 | CU | 0.20 | 0 | 0.20 | 0.13 | 0.11 | 0.11 | 0.14 |
| SU | 2.27 | 2.73 | 0 | 1.82 | 2.73 | 1.91 | 1.18 | SU | 0.14 | 0.16 | 0 | 0.11 | 0.16 | 0.11 | 0.07 |
| TU | 2.18 | 2.36 | 2.09 | 0 | 1.64 | 1.27 | 1.55 | TU | 0.13 | 0.14 | 0.13 | 0 | 0.10 | 0.08 | 0.09 |
| MU | 2.18 | 2.09 | 1.55 | 1.45 | 0 | 1.55 | 1.45 | MU | 0.13 | 0.13 | 0.09 | 0.09 | 0 | 0.09 | 0.09 |
| UGP | 1.09 | 1.27 | 1.45 | 1.36 | 1.36 | 0 | 1.36 | UGP | 0.07 | 0.08 | 0.09 | 0.08 | 0.08 | 0 | 0.08 |
| MEU | 1.36 | 1.36 | 1.27 | 1.45 | 1.36 | 0.91 | 0 | MEU | 0.08 | 0.08 | 0.08 | 0.09 | 0.08 | 0.05 | 0 |
| EU Types | (I-Y) Matrix | ||||||
|---|---|---|---|---|---|---|---|
| DU | CU | SU | TU | MU | UGP | MEU | |
| DU | 1.00 | −0.22 | −0.21 | −0.20 | −0.16 | −0.09 | −0.14 |
| CU | −0.20 | 1.00 | −0.20 | −0.13 | −0.11 | −0.11 | −0.14 |
| SU | −0.14 | −0.16 | 1.00 | −0.11 | −0.16 | −0.11 | −0.07 |
| TU | −0.13 | −0.14 | −0.13 | 1.00 | −0.10 | −0.08 | −0.09 |
| MU | −0.13 | −0.13 | −0.09 | −0.09 | 1.00 | −0.09 | −0.09 |
| UGP | −0.07 | −0.08 | −0.09 | −0.08 | −0.08 | 1.00 | −0.08 |
| MEU | −0.08 | −0.08 | −0.08 | −0.09 | −0.08 | −0.05 | 1.00 |
| Inverse of (I-Y) | Total Relation Matrix, T= Y × (Inverse of (I-Y)) | ||||||||||||||
|---|---|---|---|---|---|---|---|---|---|---|---|---|---|---|---|
| EU Types | DU | CU | SU | TU | MU | UGP | MEU | EU Types | DU | CU | SU | TU | MU | UGP | MEU |
| DU | 1.39 | 0.59 | 0.58 | 0.52 | 0.50 | 0.36 | 0.43 | DU | 0.39 | 0.59 | 0.58 | 0.52 | 0.50 | 0.36 | 0.43 |
| CU | 0.51 | 1.37 | 0.53 | 0.43 | 0.43 | 0.35 | 0.40 | CU | 0.51 | 0.37 | 0.53 | 0.43 | 0.43 | 0.35 | 0.40 |
| SU | 0.42 | 0.46 | 1.32 | 0.37 | 0.42 | 0.32 | 0.31 | SU | 0.42 | 0.46 | 0.32 | 0.37 | 0.42 | 0.32 | 0.31 |
| TU | 0.38 | 0.41 | 0.40 | 1.25 | 0.34 | 0.27 | 0.30 | TU | 0.38 | 0.41 | 0.40 | 0.25 | 0.34 | 0.27 | 0.30 |
| MU | 0.36 | 0.38 | 0.35 | 0.31 | 1.23 | 0.26 | 0.28 | MU | 0.36 | 0.38 | 0.35 | 0.31 | 0.23 | 0.26 | 0.28 |
| UGP | 0.25 | 0.27 | 0.28 | 0.25 | 0.25 | 1.14 | 0.23 | UGP | 0.25 | 0.27 | 0.28 | 0.25 | 0.25 | 0.14 | 0.23 |
| MEU | 0.26 | 0.28 | 0.27 | 0.25 | 0.25 | 0.19 | 1.15 | MEU | 0.26 | 0.28 | 0.27 | 0.25 | 0.25 | 0.19 | 0.15 |
| EU Types | r (Row Sum Vector of Matrix T) | c (Column Sum Vector of Matrix T) | (Influence) | Rank | (Relation) | Group |
|---|---|---|---|---|---|---|
| DU | 3.36 | 2.57 | 5.93 | 1 | 0.80 | Cause |
| CU | 3.01 | 2.76 | 5.77 | 2 | 0.25 | Cause |
| SU | 2.62 | 2.72 | 5.33 | 3 | −0.10 | Effect |
| TU | 2.34 | 2.37 | 4.72 | 4 | −0.03 | Effect |
| MU | 2.17 | 2.41 | 4.59 | 5 | −0.24 | Effect |
| UGP | 1.65 | 1.88 | 3.53 | 7 | −0.23 | Effect |
| MEU | 1.65 | 2.10 | 3.75 | 6 | −0.45 | Effect |
| MF Types | (Influence) | Rank | (Relation) | Group |
|---|---|---|---|---|
| NPF | 7.87 | 1 | 0.26 | Cause |
| VF | 7.45 | 2 | 0.43 | Cause |
| PMF | 6.31 | 5 | −0.65 | Effect |
| PF | 5.97 | 6 | −0.13 | Effect |
| WfF | 7.03 | 3 | 0.70 | Cause |
| MoF | 6.79 | 4 | 0.17 | Cause |
| MaF | 5.72 | 7 | −0.17 | Effect |
| RF | 5.69 | 8 | −0.61 | Effect |
| MHF | 4.64 | 9 | 0.09 | Cause |
| EF | 4.28 | 10 | −0.11 | Effect |
| MF | NPF | VF | PMF | PF | WfF | MoF | MaF | RF | MHF | EF |
| NPF | 0.39 | 0.47 | 0.48 | 0.44 | 0.46 | 0.41 | 0.40 | 0.44 | 0.29 | 0.29 |
| VF | 0.51 | 0.35 | 0.48 | 0.38 | 0.40 | 0.45 | 0.39 | 0.38 | 0.29 | 0.31 |
| PMF | 0.36 | 0.34 | 0.25 | 0.29 | 0.31 | 0.30 | 0.27 | 0.28 | 0.22 | 0.22 |
| PF | 0.37 | 0.35 | 0.33 | 0.22 | 0.30 | 0.32 | 0.28 | 0.32 | 0.21 | 0.21 |
| WfF | 0.50 | 0.44 | 0.43 | 0.40 | 0.31 | 0.44 | 0.38 | 0.40 | 0.28 | 0.27 |
| MoF | 0.44 | 0.41 | 0.40 | 0.34 | 0.37 | 0.29 | 0.34 | 0.37 | 0.27 | 0.23 |
| MaF | 0.35 | 0.33 | 0.30 | 0.29 | 0.29 | 0.31 | 0.21 | 0.29 | 0.21 | 0.19 |
| RF | 0.33 | 0.30 | 0.29 | 0.24 | 0.26 | 0.30 | 0.24 | 0.20 | 0.20 | 0.18 |
| MHF | 0.31 | 0.26 | 0.26 | 0.25 | 0.24 | 0.27 | 0.22 | 0.25 | 0.14 | 0.18 |
| EF | 0.24 | 0.26 | 0.25 | 0.20 | 0.22 | 0.22 | 0.20 | 0.22 | 0.16 | 0.12 |
| SL | EU Types | FGD Priorities and Recommendations | FGD Opinions on Prioritization for RMG Industry |
|---|---|---|---|
| 1 | DU | First-line choice for both short- and long-term strategies | High priority and factor of the cause group. Unanticipated market demand and competition. |
| 2 | CU | ||
| 3 | SU | Second-line choice for both short- and long-term strategies | All raw materials are sourced from national and international suppliers. |
| 4 | TU | Third-line choice for long-term strategies | The processes and products are neither high-technology-dependent nor oriented. |
| 5 | MU | Simple machines, processes, and material handling systems. | |
| 6 | UGP | Fourth-line choice for long-term strategies | Very low importance and long-term issue. |
| 7 | MEU |
| SL | MF Types | FGD Priorities and Recommendations | FGD Opinions on Prioritization for RMG Industry |
|---|---|---|---|
| 1 | NPF | First-line choice for both short- and long-term strategies | High priority and factor of the cause group. Requires a wide variety of products. |
| 2 | VF | High priority and factor of the cause group. Requires a wide variety and a low volume of products. | |
| 3 | WfF | High priority and factor of the cause group. RMG industry is highly workforce-intensive. | |
| 4 | MoF | High priority and factor of the cause group. Requires a wide variety of products. | |
| 5 | PMF | Second-line choice for long-term strategies | Low importance and alternatively made up of the insights from NPF, VF, and MoF. |
| 6 | PF | Low importance, and RMG industry is simple- and repetitive-process-oriented. | |
| 7 | MaF | Third-line choice for long-term strategies | Very low importance, and machines of RMG industry carry out simple tasks. |
| 8 | RF | Very low importance, and RMG industry follows repetitive processes. | |
| 9 | MHF | Very low importance, and RMG industry follows simple material handling processes that are not automated. | |
| 10 | EF | Fourth-line choice for long-term strategies | Low importance and long-term issue. |
Publisher’s Note: MDPI stays neutral with regard to jurisdictional claims in published maps and institutional affiliations. |
© 2022 by the authors. Licensee MDPI, Basel, Switzerland. This article is an open access article distributed under the terms and conditions of the Creative Commons Attribution (CC BY) license (https://creativecommons.org/licenses/by/4.0/).
Share and Cite
Moin, C.J.; Iqbal, M.; Malek, A.B.M.A.; Khan, M.M.A.; Haque, R. Prioritization of Environmental Uncertainty and Manufacturing Flexibility for Labor-Intensive Industry: A Case Study on Ready-Made Garment Industries in Bangladesh. Systems 2022, 10, 67. https://0-doi-org.brum.beds.ac.uk/10.3390/systems10030067
Moin CJ, Iqbal M, Malek ABMA, Khan MMA, Haque R. Prioritization of Environmental Uncertainty and Manufacturing Flexibility for Labor-Intensive Industry: A Case Study on Ready-Made Garment Industries in Bangladesh. Systems. 2022; 10(3):67. https://0-doi-org.brum.beds.ac.uk/10.3390/systems10030067
Chicago/Turabian StyleMoin, Chowdhury Jony, Mohammad Iqbal, A. B. M. Abdul Malek, Mohammad Muhshin Aziz Khan, and Rezwanul Haque. 2022. "Prioritization of Environmental Uncertainty and Manufacturing Flexibility for Labor-Intensive Industry: A Case Study on Ready-Made Garment Industries in Bangladesh" Systems 10, no. 3: 67. https://0-doi-org.brum.beds.ac.uk/10.3390/systems10030067