Strategic Decision Facilitation: Supporting Critical Assumptions of the Human in Empirical Modeling of Pairwise Value Comparisons


1
Department of Systems Engineering and Management, Air Force Institute of Technology, 2950 Hobson Way, Wright-Patterson AFB, OH 45433, USA
2
Department of Operational Sciences, Air Force Institute of Technology, 2950 Hobson Way, Wright-Patterson AFB, OH 45433, USA
*
Author to whom correspondence should be addressed.
Systems 2020, 8(3), 30; https://0-doi-org.brum.beds.ac.uk/10.3390/systems8030030
Submission received: 10 April 2020
/
Revised: 27 August 2020
/
Accepted: 2 September 2020
/
Published: 9 September 2020
(This article belongs to the Special Issue Human Factors in Systems Engineering)
Abstract
:Modeling human decision-making is difficult. Decision-makers are typically primed with unique biases that widen the confidence interval of judgment. Therefore, it is important that the human process in the system being modeled is designed to alleviate damaging biases and assumptions in an effort to increase process consistency between decision-makers. In this experiment, it is hypothesized that coupling specific decision-facilitation methods with a specific scale range will affect the consistency between decision-makers. This article presents a multiphase experiment that examines a varying presentation mode as well as scale range to determine how value is determined in subsequent pairwise comparisons of alternatives against specific requirements. When considering subject value ratings of the expected rank order of alternative subgroups (indicating strong criteria independence), results show that subjects used consistent comparison ratios regardless of the scale range. Furthermore, when comparing the subgroups of expected rank order responses to the subgroups of biased responses, although ratios were different, the same general trend of comparison existed within subgroups. Providing evidence that careful selection of the presentation mode can facilitate more consistent value comparisons between compatible decision-makers allows for the identification of and adjustment of disparities due to bias and potential lack of incremental scaling detail. Furthermore, by creating decision processes that render more consistent cognitive behavior between decision-makers, tighter confidence intervals can be obtained, and critical assumptions can be validated.
1. Introduction
Assumptions are a necessary evil in any system model. While they allow us to simplify and control outside factors, they are prone to inaccurate generalizations of key system components—especially the human agent acting as the decision-maker. This is especially relevant in empirical, heuristic-based models. Human decision-making is a component that can possess wide variability predicated on a multitude of factors. Yet agent-based modeling (ABM) possesses a fundamental philosophy of methodological individualism and warns that aggregation of individuals can lead to misleading results [1]. Therefore, it is difficult to build accurate, generalized decision-making models based on small empirical data sets. Furthermore, understanding how decisions are made, the factors that lead to specific decisions, and how we can use or improve upon specific decision processes is difficult. Multicriteria decision-making (MCDM) and multicriteria group decision-making (GDM) processes have been widely used as decision support tools to navigate the intertwined dimensions that are decision-makers, alternatives, criteria, and attributes. However, it seems that the paths taken through this extremely complex space thus far have done little to prove or satisfy a key assumption: attributes for one criterion are judged independently of attributes for a different criterion. This can lead to wide variability between decision-makers and possibly false assumptions of the human distribution in ABM. Furthermore, adding assumptions to the human element only amplifies the delta between a model response and a potentially biased human response in reality.
When reconciling judgments from multiple decision-makers in a group decision, consistency in the rank order of judgments between evaluators is critical. It fosters confidence in unified consensus and provides stronger justification for MCDM assumptions and weight determinations. Significant variations in judgment values and the rank order of alternatives between decision-makers indicates potential issues with various heuristics that result in bias and violations of criteria independence. Modeling these types of decision processes to represent larger populations requires wider confidence intervals and thus, reduced confidence. Therefore, it is important to design decision processes that invoke higher consistencies between multiple human agents acting as decision-makers, which produce tighter confidence intervals and thus, enhanced confidence. To achieve this, we must first characterize and understand how decision-makers behave within specific facilitation modes. Ideally, a decision-maker will judge attributes of one criterion independently of attributes of a different criterion. Comparing decision-makers that exhibit these desirable behaviors is essential to characterizing appropriate, beneficial decision processes that include modes of alternative and criteria presentation.
1.1. Background
In the dissertation research conducted by Kristbaum [2], subjects evaluated a minivan and SUV against specific third-party criteria requirements. Both vehicles either met or failed to meet criteria requirements equally; therefore, in this setting, the ideal response from a subject is a zero delta between alternative scores. Any positive or negative delta between alternative scores is consistent with a preference bias towards a type of vehicle. Results of the study revealed that by facilitating a decision through a specific information presentation mode (joint evaluation), preference bias could be significantly reduced regardless of the level of alternative evaluability [3,4]. Joint evaluation, as opposed to separate evaluation, promoted more appropriate intracriteria value deltas between alternatives. Additionally, the criteria rank order (determined by the values assigned) from this mode was more consistent across decision-makers. These results were consistent with semantic priming [5,6,7,8,9,10,11,12,13,14] and selective accessibility [10,11,12,14,15] in criteria requirements and intracriteria numerical anchoring [16,17,18,19] across alternatives. Further analysis showed that alternative scores were significantly affected by the sequencing of criteria evaluation. These results were consistent with intercriteria numerical anchoring effects, which indicates a cross-criteria dependence in values.
The distinction between decision-maker consistency in the intracriteria anchoring across alternatives and the intercriteria anchoring within alternatives is important. Consistency across decision-makers is beneficial since this is a sign of consensus. On the other hand, intercriteria dependency is not ideal since this may signal biases, especially those unique to each decision-maker. In MCDM, pairwise comparisons of alternatives are natural, and criteria independence is assumed [20]. Therefore, anchoring across alternatives is natural, yielding more accurate, independent values. On the other hand, anchoring across criteria creates issues in a decision process. This, in turn, leads to inaccurate weight distributions. Table 1 depicts the MCDM matrix with the different dimensional anchoring.
Kristbaum [2] has shown that a carefully (strategically) chosen presentation mode can effectively reduce preference bias and foster beneficial cross-alternative anchoring (intercriteria). This article is focused on addressing the next piece of the puzzle, intercriteria dependency, by experimenting with a mode mixture as described in Table 2.
Additionally, in the following analysis, subgroups of compatible subjects are compared across different rating scale ranges to characterize the decision process and how scale impacts judgment. A properly facilitated decision to include appropriate rating scales may allow for natural pairwise comparisons of criteria across alternatives while still maintaining criteria independence.
1.2. Rating vs. Ranking
In multicriteria group decision-making (GDM), both rank and value are important in the comparisons of alternatives. If the rank order of criteria values within alternatives and the rank order of alternatives within criteria values are consistent across decision-makers, consensus is generally implicit. Additionally, if criteria values are independent, specific rating scale ranges may allow for more consistent, predictable differences in criteria values across alternatives while still maintaining sufficient value disparity. For example, a rating scale range of 10 in the evaluation of three alternatives may contain an excessive gray area and may not render consistent differences between alternatives. By contrast, a rating scale range of five may allow for clear, sufficient value disparity and render consistent differences in value between alternatives. When values and differences in values become more predictable and consistent, forecasting and optimization techniques can be used as effective decision support tools.
The differences between the common numerical scale ranges have been studied extensively. Value rating conversions have shown that value does not transfer from scale to scale [21]. Data characteristics such as means, dispersions, and shape have been found to show significant differences based on scale range [22,23,24,25,26]. While data characteristics vary significantly considering the full range of the scale, Frederick and Mochon [27] have shown that the response scale changes based on how a decision-maker anchors judgments. Their scale distortion theory provides evidence that value cannot be determined considering the full range of the scale; the decision-maker determines the range of the scale. Although data characteristics differ according to the full scale range, what is missing from the literature is an understanding of the effects of scale range variation on value disparity in the pairwise comparison of alternatives, considering that scales may be distorted and each decision-maker uses the scale differently. Additionally, there is a lack of understanding on how the scale range in combination with a specific information presentation affects value comparisons.
There are distinct advantages and disadvantages in each of the common situational judgment test (SJT) response formats. Rating is considered to be the easiest type of SJT to administer. However, research has shown that if the items being evaluated are thought to have value, ratings tend to be end-piled due to the inherent positive nature of value [28]. Additionally, rating SJT models are most susceptible to response distortion [29]. Response distortion is the result of alternative anchoring. Ranking offers better measurement properties to differentiate between alternatives; however, ranking may force distinctions between values when none exist [28,30,31,32,33]. Finally, rank-then-rate SJT formats attempt to reduce end-piling while allowing for differentiation between values [34,35]. It is the most difficult to administer and the most laborious of SJT formats. Additionally, research has shown that value ratings tend to be anchored to rank [28].
A strategically facilitated decision may be able to leverage the benefits of each SJT response format. Through the strategic presentation of alternative information, decision-makers may be induced to rank-while-rating in pairwise comparisons of alternatives and still achieve criteria independence and a consistent rank order of values. Through strategic scaling, value assignments may become more consistent and therefore, predictable across a larger populace while maintaining sufficient value disparities between alternatives.
2. Experiment—Phase 1
To quantitatively assess the effect of bias on criteria independence, we examine differences in overall scores between alternatives and different categories of subjects. Define as the average score assigned by subjects in criteria category m using a mixed presentation mode to score alternative n. The magnitude and sign of difference can be used to assess how scoring varied across alternatives 1 and 2 for subjects in criteria category m when using a mixed mode in the evaluation process. For alternatives that equally meet the requirements, this difference should ideally be 0 when no biases across alternatives (or equal biases) are present. A positive difference could indicate biases favoring alternative 1; a negative difference could indicate biases favoring alternative 2. We follow this approach in Phase 1 in the following experiment.
2.1. Method—Phase 1
Phase 1 of this experiment presented subjects with two alternatives and a set of specific third-party client requirements. The scenario was derived from the scenario used in Kristbaum [2], where subjects compared a minivan and an SUV to specific third-party requirements. Both alternatives either met or did not meet client criteria requirements equally. This allows differences observed in the analysis of results to be associated with the presence of preference bias. It is believed a mixed mode presentation and evaluation (joint intracriteria across alternatives, separate intercriteria across alternatives) reduces preference bias between alternatives as well as creates stronger criteria independence.
In Phase 1, a survey was administered to 208 subjects using Amazon’s Mechanical Turk workforce. The survey collected responses to qualifying questions pertaining to the subject’s experience with each type of vehicle. If subjects had prior experience with a type of vehicle in question, they were said to have high evaluability of that type of vehicle. If subjects had no prior experience with a type of vehicle in question, they were said to have low evaluability of that type of vehicle in comparison. No anchoring stimuli pertaining to the scenario or types of vehicles to be evaluated were provided prior to the qualifying questions.
Once the subjects answered the qualifying questions, they were presented with the “purchase for a client” scenario and given the following criteria requirements:
- You have a budget of $500/month.
- The vehicle must seat five people.
- The vehicle must have an average fuel economy of 19 mpg.
- The vehicle must have onboard entertainment (DVD, satellite radio, Bluetooth, etc.).
- The vehicle must have front-wheel drive and traction control or 4WD.
- The vehicle must have a 2500 lb. towing capacity.
- You would like to have the vehicle within the next two weeks.
- It would be nice if the vehicle was blue.
- It would be nice if the vehicle had heated seats.
- It would be nice if the vehicle had a back-up assist camera.
- The vehicle must be new.
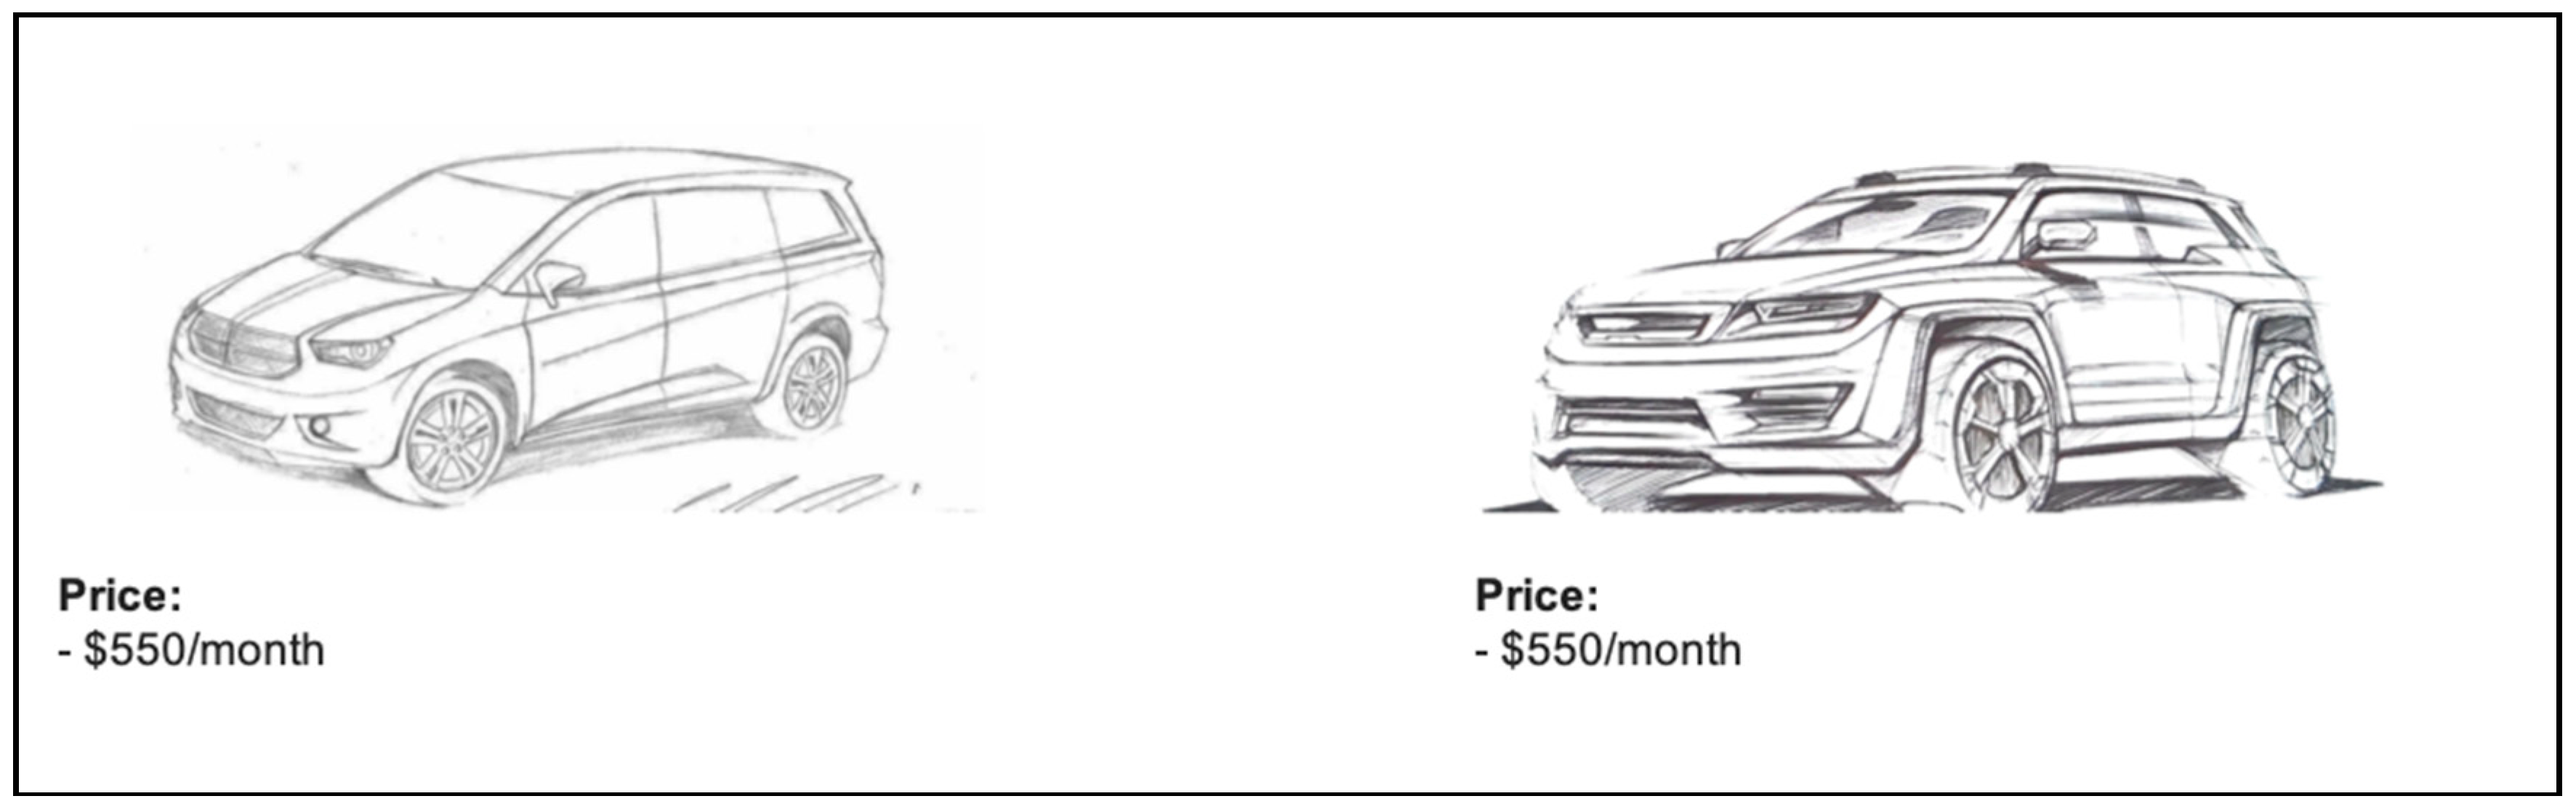
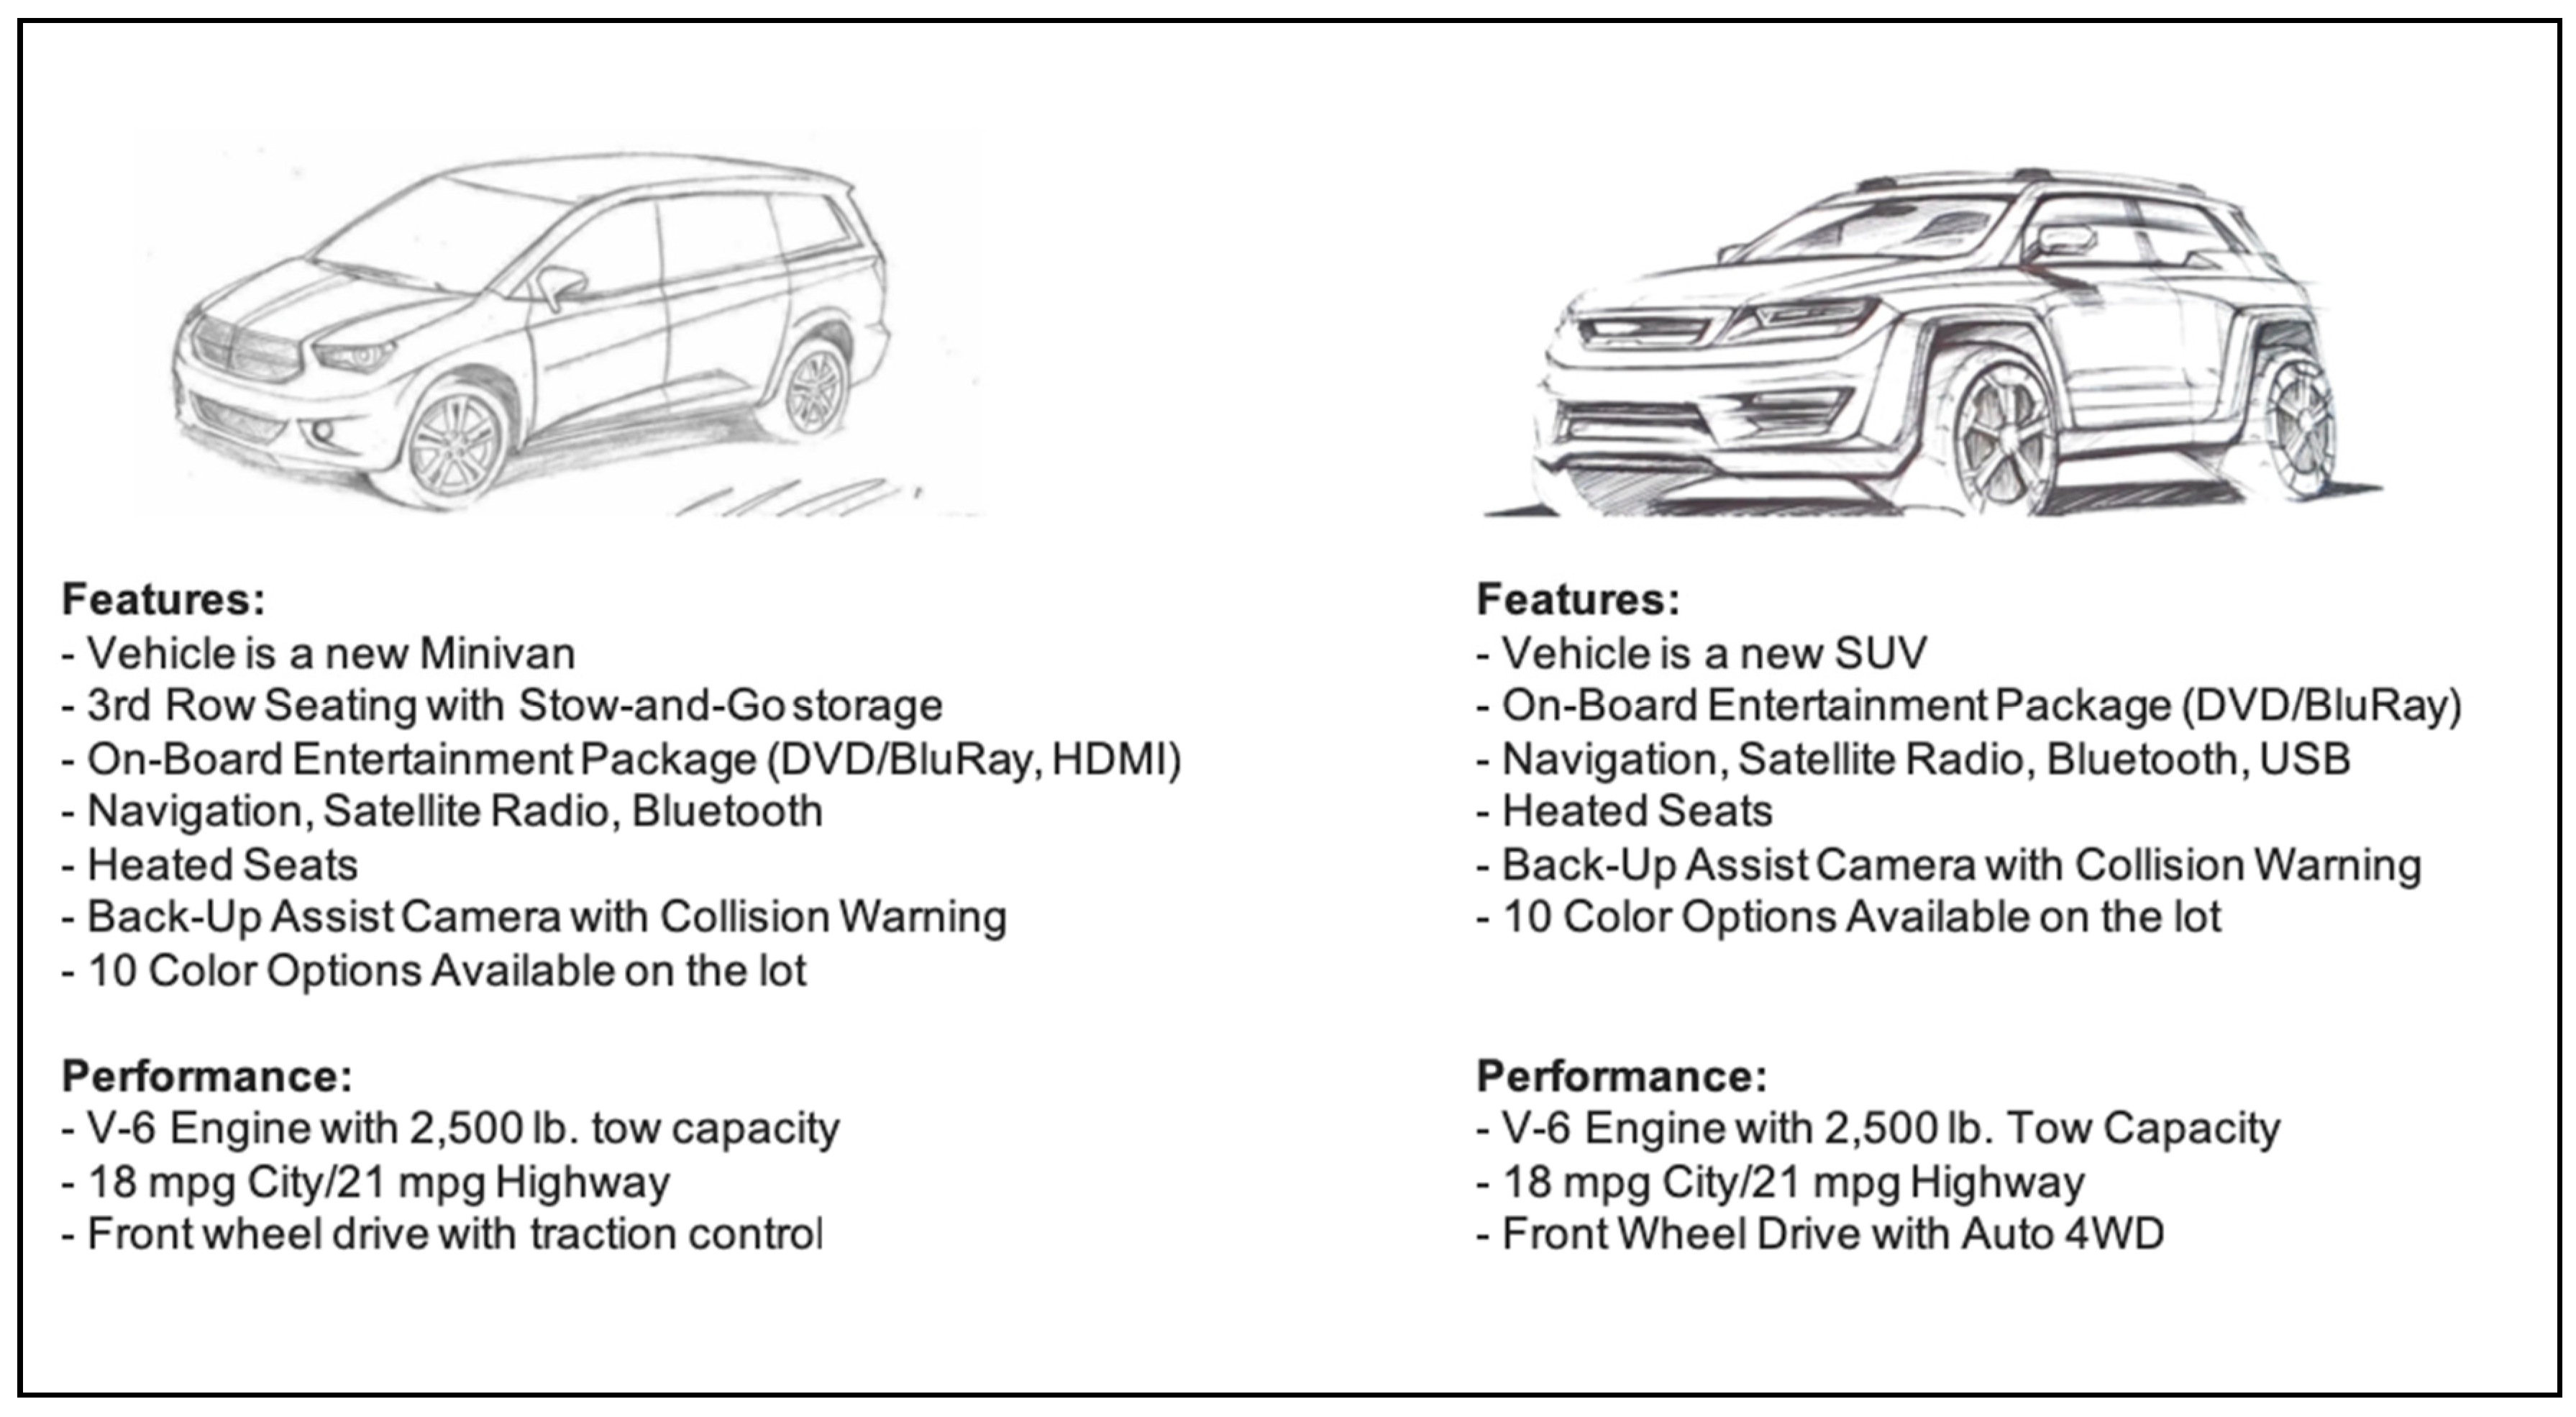
Subjects were then presented sequentially and in random order the two slides shown in Figure 1 and Figure 2. These allow for the comparison of alternatives’ prices side-by-side and performance/features side-by-side. While viewing each slide, subjects were asked to rate the presented criterion for each vehicle on a scale of 1–10 based on how it met the client’s requirements.
2.2. Results—Phase 1
Multiple analyses of variance (ANOVAs) were conducted in Phase 1 of this experiment. The factor combinations of interest in both ANOVAs included the subject evaluability of the minivan (+/−), subject evaluability of the SUV (+/−), and procedure (1/2). Procedure represents the order of slides presented to the subject (i.e., procedure 1 indicates the price slide was presented first, and procedure 2 indicates the performance/features slide was presented first). Subjects were grouped according the survey procedure presented; 105 subjects were presented with procedure 1, and 103 were presented with procedure 2. The responses in the first series of ANOVAs were the value deltas, , within criteria m (price, performance) across alternatives. First and foremost, it was important to establish that there were no significant differences detected for average criteria values between alternatives in the mixed mode presentation and evaluation. This would indicate that preference bias towards either alternative was not significant in determining the values assigned to the criteria. Results reveal there was no significant value delta between average alternative ratings of price and no significant value delta between average alternative ratings of performance/features. Therefore, there was not sufficient evidence to reject the hypothesis that a mixed mode presentation and evaluation reduces preference bias for this data set. These conclusions were supported by p-values of 0.3979 and 0.7658, respectively.
The responses in the second series of ANOVAs were the value ratings of the criteria within alternatives. By establishing that there was no significant difference in criteria values within alternatives across procedures, (comparing for each alternative n (minivan, SUV) across procedures l), we can make conclusions about criteria independence and lack of cross-criteria anchoring in mixed modes. Recall, in previous studies of joint vs. separate modes conducted by Kristbaum [2], the sequencing of the criteria evaluation order (procedure) created significant anchoring effects between criteria. The connecting letters reports and associated p-values shown in Table 3, Table 4, Table 5 and Table 6 reveal that there was no significant difference in value ratings of criteria within alternatives across procedures in the mixed mode.
The supporting ANOVAs from Phase 1 did not indicate there was a significant anchoring effect across criteria. This reveals the potential for using a mixed mode presentation to reduce preference bias between alternatives by fostering natural anchoring in pairwise comparisons between alternatives within criteria. Additionally, a mixed mode promotes stronger criteria independence, which supports critical assumptions in MCDM. Therefore, there was not sufficient evidence to reject the null hypothesis of strong criteria independence for this data set. However, when criteria between alternatives are conflicting, it is possible that other strong heuristics influence how value is assessed.
3. Experiment—Phase 2
To quantitatively assess the effect of varying scales, we examine the ratios between overall scores of alternatives within criteria. Define as the average score assigned by subjects in criteria category m using presentation scale l to score alternative n. The relative score ratio can be used to assess how scoring varied across alternatives and for subjects in criteria category m when using scale l in the evaluation process. We follow this approach in Phase 2 in the following experiment.
3.1. Method—Phase 2
Phase 2 of this experiment presented subjects with three alternatives with conflicting attributes and a set of specific third-party client criteria. Subjects were presented with three different minivans in a mixed mode presentation and asked to rate the criteria. Additionally, the rating scale used to rate the alternatives was randomized between three different ranges (1–5, 1–7, and 1–10). It is believed a mixed mode presentation renders consistent rank order values across alternatives within criteria as they compare to the requirements. Furthermore, it is believed that the scale range affects the alternative value ratios of compatible decision-makers.
In Phase 2, surveys were administered to 210 subjects using Amazon’s Mechanical Turk workforce. Again, the surveys were based on a “purchase for a client” scenario. This time, the client was looking for a used minivan that met the following requirements:
- The budget must not exceed $300/month.
- The vehicle must have an average fuel economy of 18 mpg.
- The vehicle must have less than 50,000 miles.
Once subjects were given the client’s requirements, they were presented with three minivan alternatives in a mixed mode and asked to rate the criteria on one of three scales (randomly assigned to subjects). Alternatives were presented in bullet format on separate slides as follows:
- Slide 1: Price
- -
- Alternative 1: $275/month
- -
- Alternative 2: $300/month
- -
- Alternative 3: $230/monthRequirement: price must not exceed $300/month
- Slide 2: Performance
- -
- Alternative 1:
- ○
- Fuel Economy: 19 mpg
- ○
- 45,000 miles
- -
- Alternative 2:
- ○
- Fuel Economy: 19 mpg
- ○
- 30,000 miles
- -
- Alternative 3:
- ○
- Fuel Economy: 19 mpg
- ○
- 35,000 miles
Requirements:- ○
- Vehicle must have average fuel economy of 18 mpg
- ○
- Vehicle must have less than 50,000 miles
3.2. Results—Phase 2
In order to compare and characterize the decision process of compatible subjects, data were grouped into subgroups based on the rank order of alternative values in each criterion. If subjects were rating criteria independently based on requirements, the rank order of alternative value assignments from highest to lowest should have been 3-1-2 for price and 2-3-1 for performance. Subject data with alternatives rated equally within criteria were also considered. Table 7 displays the conversion into subgroups.
Our analysis showed that rank order consistency was not achieved through the mixed mode presentation. In fact, only 21% of all subjects across all scale ranges correctly rated alternative 3 highest and alternative 2 lowest for price, and 45% correctly rated alternative 2 highest and alternative 1 lowest for performance. Seven percent were converted to the expected subgroup due to all alternatives being rated equal for price and 8% for performance. Therefore, we reject the hypothesis that a mixed mode presentation renders a consistent rank order for this data set. Note that price was always presented first. This indicates subjects assumed or considered irrelevant information to the criteria in question. For example, it is possible subjects assumed an alternative was priced lower because it was less desirable or did not meet the performance requirements. Therefore, strategic facilitation through the mode alone is not enough to achieve strong criteria independence when criteria between alternatives are conflicting.
A closer look at how a varying scale range affected the subset of subjects who demonstrated stronger criteria independence (i.e., a rank order of values consistent with expectations) revealed interesting results. In this subgroup, regardless of which rating scale range was used, ratios between alternative values were consistent. Therefore, we reject the hypothesis that the scale range affects the alternative value ratios for this data set. This is consistent with anchoring and adjustment between alternatives on distorted scales and the use of a ratio value comparison. The ratios analyzed for each criterion were the ratios from the outside (highest-ranked, lowest-ranked) alternatives to the middle alternative for the expected rank order. For example, ratios A2/A1 and A3/A1 were analyzed for price ( and ) because the expected rank order was 3-1-2. Similarly, ratios A2/A3 and A1/A3 were analyzed for performance ( and ) because the expected rank order was 2-3-1. Table 8, Table 9, Table 10 and Table 11 show the connecting letters reports and associated p-values from the ANOVAs on the ratios between alternative values.
Additional ANOVAs were conducted to compare the results of the ratios when all three alternatives were consistent with the expected rank order of values to when only two of three alternatives were consistent. For example, the subset of subjects who rated all three alternatives for price in the expected rank order (3-1-2) was compared to the subset of subjects who only rated alternatives in the rank orders 1-2-3 and 1-3-2 for ratio A2/A1. This is an interesting comparison because alternative 1 was valued higher than alternative 2 in all three subgroups, although only subgroup 3-1-2 completely matched the expected rank order. The purpose of this analysis was to identify if the instances of biased comparison in these subgroups (a rank order of value not consistent with the expected order) had any effect on the ratio observed in the unbiased comparison (a rank order of value consistent with the expected order) in the same subgroup. Furthermore, if the biased alternative value affected the ratios of the other two, how did the scale ranges differ, if at all? Results for price are shown in the connecting letters reports in Table 12 and Table 13.
In comparison ratio A2/A1 for price (), when alternative 1 and alternative 2 values were ranked in a 1-2 order without alternative 3 in between (1-2-3 and 3-1-2), comparison ratios were not significantly different across rating scale ranges. However, when alternative 3 was rated between alternatives 1 and 2 for price (1-3-2), the ratio was significantly lower than that of the other rank order groups within the scale range and across scale ranges. This suggests that the bias was restricted to the pairwise comparisons of alternative 3 to alternatives 1 and 2 in these subgroups of subjects. Results for ratio A3/A1 for price () were similar when considering alternative 1 and alternative 3 value ranking. When alternative 3 and alternative 1 values were ranked 3-1 for price without alternative 2 in between (2-3-1 and 3-1-2), ratios were not significantly different within the scale range and across scale ranges.
Trends in ratings of performance were similar. Ratios of the expected rank order were not significantly different, with the exception of in the analysis of ratio A1/A3. Because the expected rank order of alternatives for performance was 2-3-1, the ratios analyzed were A1/A3 and A2/A3 (, ). Results from the ANOVAs are shown in the connecting letters reports in Table 14 and Table 15.
4. Discussion
These findings were consistent with compatible decision-makers using anchoring and adjustment and comparable criteria value ratios between alternatives. Because results were consistent across different subgroups, this data set provides evidence that it can be expected that decision-makers who are compatible with certain subgroups (biased or unbiased) would value alternatives similarly. That is to say, using a mixed mode, decision-makers who rate criteria values independently do so using significantly similar rating procedures to other like-minded decision-makers. Similarly, decision-makers who rate criteria using a mixed mode dependently (biased responses) do so using significantly similar rating procedures to other like-minded decision-makers. These findings help support the use of modeling to replicate human decision-making. If decision processes are designed to increase consistency in reality, tighter confidence intervals of human assumptions can be validated.
This study supports the use of different scale ranges for different criteria, if necessary, without concern of skewed value comparisons. These findings are also beneficial to modeling human decision processes throughout a system by alleviating assumptions that a human agent acting as a decision-maker uses significantly similar cognitive processes regardless of the value scale. Furthermore, providing evidence that decision-makers use ratio comparisons supports the use of optimization to adjust disparities between decision-makers when value rankings or value comparisons are inconsistent. For example, if in a group decision, the majority of the group share a consistent rank structure of alternatives, the distance (difference) from the average ratio can be minimized. Group constraints can be established using the minimum and maximum ratios, and individual scores would be adjusted from an established baseline alternative score. Using this method, it may be possible to model group consensus decision-making processes, such as the Delphi method. In situations when requirements command a specific rank order of criteria values, constraints can be formulated around decision-makers who exhibit expected behavior to guide the adjustment of distorted scales and/or biased responses to reveal consensus in value comparisons. If it is possible to weight and adjust the individual decision-maker based on these findings to achieve stronger criteria independence, the critical assumptions of MCDM can be better satisfied.
5. Conclusions and Future Research
The experiments presented in this article and in previous work by Kristbaum [2] show that it is possible to manage preference bias through a specific, strategic information presentation mode. A mixed mode performed well in reducing preference bias and promoting stronger criteria independence when comparing alternatives whose criteria were equal in all categories. However, when criteria were conflicting, subjects appeared to access nonrelevant information to the criteria in question, and a consistent value rank order and strong criteria independence were not observed—even in the context of specific criteria requirements. However, when comparing alternative value ratios of subjects within rank order subgroups, subjects tended to make comparisons using consistent ratios across scale ranges. This not only further supports the theory of scale distortion but also reduces the importance of the rating scale (limited to the scale ranges in this experiment) in the comparison of alternatives. It is possible that a mixed mode of presentation facilitated beneficial distorted scales through anchoring and adjustment and the use of consistent comparison ratios. Further research is required to test different modes against varying scale ranges to test this hypothesis. Scales were limited to ranges of 5, 7, and 10 in this experiment; therefore, further research would need to be conducted to characterize trends on scales with less incremental detail (1–3) and those with more incremental detail (1–100) and to compare numerical scales to other types of scales, such as Likert-type scales under the same circumstances. In any case, the results garnered in this experiment through a mixed mode open the door for future research on strategically facilitated decision contexts and more robust decision support designs in ABM.
In GDM or aggregated individual decision-maker contexts with a presiding facilitator or manager, such as organizational contract sourcing or resource allocation estimation vs. expectation, it may be possible to reconcile differences between decision-makers by constraining to facilitator expectations of the rank order of values or setting boundaries using maximum and minimum ratio values across the group. For example, there is evidence to support the use of similar value comparison ratios amongst compatible decision-makers. Therefore, in the case of a source selection, wherein source selection members use processes such as the Delphi method to reach consensus, if the majority of the decision-makers in the group rate the alternatives in an identical rank order, optimization constraints can be set using the maximum and minimum allowable ratios. Furthermore, scores can be adjusted to reduce the value distortion between compatible and noncompatible decision-makers within alternatives. Decision-makers disagreeing on the ranking of alternatives within criteria when specific requirements are established is an indication of issues with criteria independence. If through the mode, we can leverage scale distortion and the use of comparison ratios, it may be possible to quickly and accurately identify and adjust criteria dependence (bias) of individual decision-maker value assignments within criteria using optimization in the modeling of the group consensus process.
6. Disclosures
This research was funded by the Department of Biomedical, Industrial, and Human Factors Engineering, Wright State University. The authors declare that they have no conflict of interest.
Author Contributions
Conceptualization, J.P.K. and F.W.C.; Methodology, J.P.K. and F.W.C.; Software, J.P.K. and F.W.C.; Validation, J.P.K. and F.W.C.; Formal Analysis, J.P.K. and F.W.C.; Investigation, J.P.K.; Resources, F.W.C.; Data Curation, J.P.K.; Writing—Original Draft Preparation, J.P.K.; Writing—Review & Editing, J.P.K. and F.W.C.; Visualization, J.P.K. and F.W.C.; Supervision, J.P.K. and F.W.C.; Project Administration, J.P.K. and F.W.C.; Funding Acquisition, F.W.C. All authors have read and agreed to the published version of the manuscript.
Funding
This research received no external funding.
Conflicts of Interest
The authors declare no conflict of interest.
References
- An, L. Modeling human decisions in coupled human and natural systems: Review of agent-based models. Ecol. Model. 2012, 229, 25–36. [Google Scholar] [CrossRef]
- Kristbaum, J. Strategic Decision Facilitation: An Exploration of Alternative Anchoring and Scale Distortion Optimization of Multi-Attribute Group Decision Making. Ph.D. Thesis, Wright State University, Dayton, OH, USA, 2019. [Google Scholar]
- Hsee, C.K. The evaluability hypothesis: An explanation for preference reversals between joint and separate evaluations of alternative. Organ. Behav. Hum. Decis. Process 1996, 67, 247–257. [Google Scholar] [CrossRef]
- Hsee, C.K.; Zhang, J. General evaluability theory. Perspect. Psychol. Sci. 2010, 5, 343–355. [Google Scholar] [CrossRef]
- Bahnik, S.; Strack, F. Overlap of accessible information undermines the anchoring effect. Judgm. Decis. Mak. 2016, 11, 92–98. [Google Scholar]
- Chapman, G.B.; Johnson, E.J. Anchoring, activation, and the construction of values. Organ. Behav. Hum. Decis. Process 1999, 79, 115–153. [Google Scholar] [CrossRef] [PubMed] [Green Version]
- Englich, B.; Soder, K. Moody experts—How mood and expertise influence judgmental anchoring. Judgm. Decis. Mak. 2009, 4, 41–50. [Google Scholar]
- Ma, Q.; Li, D.; Shen, Q.; Qiu, W. Anchors as semantic primes in value construction: An EEG study of the anchoring effect. PLoS ONE 2015, 10, e0139954. [Google Scholar] [CrossRef]
- Mussweiler, T. Comparison processes in social judgment: Mechanisms and consequences. Psychol. Rev. 2003, 110, 472–489. [Google Scholar] [CrossRef] [Green Version]
- Mussweiler, T.; Strack, F. Hypothesis-consistent testing and semantic priming in the anchoring paradigm: A selective accessibility model. J. Exp. Soc. Psychol. 1999, 35, 136–164. [Google Scholar] [CrossRef] [Green Version]
- Mussweiler, T.; Strack, F. The use of category and exemplar knowledge in the solution of anchoring tasks. J. Pers. Soc. Psychol. 2000, 78, 1038–1052. [Google Scholar] [CrossRef]
- Mussweiler, T.; Strack, F. Numeric judgment under uncertainty: The role of knowledge in anchoring. J. Exp. Soc. Psychol. 2000, 36, 495–518. [Google Scholar] [CrossRef] [Green Version]
- Neely, J.H. Semantic priming and retrieval from lexical memory: Roles of inhibitionless spreading of activation and limited-capacity attention. J. Exp. Psychol. Gen. 1977, 3, 226–254. [Google Scholar] [CrossRef]
- Strack, F.; Mussweiler, T. Explaining the enigmatic anchoring effect: Mechanisms of selective accessibility. J. Personal. Soc. Psychol. 1997, 73, 437–446. [Google Scholar] [CrossRef]
- Mussweiler, T.; Strack, F. The semantics of anchoring. Organ. Behav. Hum. Decis. Process 2001, 86, 234–255. [Google Scholar] [CrossRef] [Green Version]
- Strack, F.; Bahnik, S.; Mussweiler, T. Anchoring: Accessibility as a cause of judgmental assimilation. Curr. Opin. Psychol. 2016, 12, 67–70. [Google Scholar] [CrossRef]
- Tversky, A.; Kahneman, D. Judgment under uncertainty: Heuristics and biases. Science 1974, 185, 1124–1131. [Google Scholar] [CrossRef]
- Wilson, T.D.; Houston, C.; Etling, K.M.; Brekke, N. A new look at anchoring effects: Basic anchoring and its antecedents. J. Exp. Psychol. Gen. 1996, 4, 387–402. [Google Scholar] [CrossRef]
- Wong, K.F.E.; Kwong, J.Y.Y. Is 7300 m equal to 7.3 km? Same semantics but different anchoring effects. Organ. Behav. Hum. Decis. Process 2000, 82, 314–333. [Google Scholar] [CrossRef]
- Carlsson, C.; Fullér, R. Multiple criteria decision making: The case for interdependence. Comput. Oper. Res. 1995, 22, 251–260. [Google Scholar] [CrossRef]
- Preston, C.C.; Colman, A. Optimal number of response categories in rating scales: Reliability, validity, discriminating power, and respondent preferences. Acta Psychol. 2000, 104, 1–15. [Google Scholar] [CrossRef] [Green Version]
- Dawes, J. Do data characteristics change according to the number of scale points used? An experiment using 5-point, 7-point and 10-point scales. Int. J. Mark. Res. 2008, 50, 61–77. [Google Scholar] [CrossRef]
- Dawes, J. Five point vs. eleven point scales: Does it make a difference to data characteristics? Aus. J. Mark. Res. 2002, 10, 39–47. [Google Scholar]
- Peterson, R.A.; Wilson, W. Measuring customer satisfaction: Fact and artifact. J. Acad. Mark. Sci. 1992, 20, 61–71. [Google Scholar] [CrossRef]
- Johnson, S.M.; Smith, P.; Tucker, S. Response format of the job descriptive index: Assessment of reliability and validity by the multitrait-multimethod matrix. J. Appl. Psychol. 1982, 67, 500–505. [Google Scholar] [CrossRef]
- Finn, R.H. Effects of some variations in rating scale characteristics on the means and reliabilities of ratings. Educ. Psychol. Meas. 1972, 32, 255–265. [Google Scholar] [CrossRef]
- Frederick, S.W.; Mochon, D. A scale distortion theory of anchoring. J. Exp. Psychol. Gen. 2012, 141, 124–133. [Google Scholar] [CrossRef] [PubMed]
- McCarty, J.; Shrum, L.J. The measurement of personal values in survey research: A test of alternative rating procedures. Public Opin. Q. 2000, 64, 271–298. [Google Scholar] [CrossRef] [PubMed]
- Arthur, W., Jr.; Glaze, R.M.; Jarrett, S.M.; White, C.D.; Schurig, I.; Taylor, J.E. Comparative evaluation of three situational judgment test response formats in terms of construct-related validity, subgroup differences, and susceptibility to response distortion. J. Appl. Psychol. 2014, 99, 535–545. [Google Scholar] [CrossRef] [Green Version]
- Alwin, F.D.; Krosnick, A.J. The measurement of values in surveys: A comparison of ratings and rankings. Public Opin. Q. 1985, 49, 535–552. [Google Scholar] [CrossRef]
- Krosnick, J.A.; Schuman, H. Attitude intensity, importance, and certainty and susceptibility to response effects. J. Pers. Soc. Psychol. 1988, 54, 940–952. [Google Scholar] [CrossRef]
- Miethe, T.D. The validity and reliability of value measurements. J. Psychol. 1985, 119, 441–453. [Google Scholar] [CrossRef]
- Reynolds, T.J.; Jolly, J.P. Measuring personal values: An evaluation of alternative methods. J. Mark. Res. 1980, 17, 531–536. [Google Scholar] [CrossRef]
- Crosby, L.A.; Evans, K.R.; Cowles, D. Relationship quality in services selling: An interpersonal influence perspective. J. Mark. 1990, 54, 68–81. [Google Scholar] [CrossRef]
- Munson, C.E. Stress among graduate social work students: An empirical study. J. Educ. Soc. Work 1984, 20, 20–29. [Google Scholar]
Figure 1.
Joint presentation slide of vehicle price.

Figure 2.
Joint presentation slide of vehicle features/performance.


Table 1.
Cross-dimensional anchoring.

Table 2.
Mode descriptions.
| Mode | Description |
|---|---|
| Joint | Alternatives and criteria are presented and judged side-by-side |
| Separate | Alternatives and criteria are presented and judged separately (sequentially) |
| Mixed | Alternatives are presented and judged side-by-side within the criterion. Different criteria are presented and judged separately (sequentially) |
Table 3.
Connecting letters report for price of minivan.
| Price of Minivan (p-Value: 0.8661) | ||
|---|---|---|
| Procedure | Connecting Letter | Least Square Mean |
| 2 | A | 5.3028 |
| 1 | A | 5.2113 |
Factor combinations not connected by the same letter are significantly different.
Table 4.
Connecting letters report for price of SUV.
| Price of SUV (p-Value: 0.8141) | ||
|---|---|---|
| Procedure | Connecting Letter | Least Square Mean |
| 1 | A | 5.3890 |
| 2 | A | 5.2601 |
Factor combinations not connected by the same letter are significantly different.
Table 5.
Connecting letters report for performance/features of minivan.
| Performance/Features of Minivan (p-Value: 0.4907) | ||
|---|---|---|
| Procedure | Connecting Letter | Least Square Mean |
| 2 | A | 6.1542 |
| 1 | A | 5.7747 |
Factor combinations not connected by the same letter are significantly different.
Table 6.
Connecting letters report for performance/features of SUV.
| Performance/Features of SUV (p-Value: 0.2996) | ||
|---|---|---|
| Procedure | Connecting Letter | Least Square Mean |
| 2 | A | 6.7899 |
| 1 | A | 6.2532 |
Factor combinations not connected by the same letter are significantly different.
Table 7.
Subgroup conversion table.
| Case | Subgroup Conversion * |
|---|---|
| A1 = A2 = A3 | 3-1-2 ** |
| A1 = A2 = A3 | 2-3-1 *** |
| A2 = A3 > A1 | 2-3-1 |
| A1 = A3 > A2 | 3-1-2 |
| A1 = A2 > A3 | 1-2-3 |
| A1 > A2 = A3 | 1-2-3 |
| A2 > A1 = A3 | 2-3-1 |
| A3 > A1 = A2 | 3-1-2 |
* Each subject is identified in two subgroups (price and performance). ** Price subgroup only. *** Performance subgroup only.
Table 8.
Alternative 2/alternative 1 price value ratio.
| Ratios Between Price Ratings (Alternative 2/Alternative 1) (p-Value: 0.5924) | |||
|---|---|---|---|
| Scale | Subgroup Subjects | Connecting Letter | Least Square Mean |
| 7 | 13 | A | 0.8176 |
| 10 | 26 | A | 0.8029 |
| 5 | 18 | A | 0.7549 |
Table 9.
Alternative 3/alternative 1 price value ratio.
| Ratios Between Price Ratings (Alternative 3/Alternative 1) (p-Value: 0.8286) | |||
|---|---|---|---|
| Scale | Subgroup Subjects | Connecting Letter | Least Square Mean |
| 5 | 18 | A | 1.2284 |
| 10 | 26 | A | 1.2181 |
| 7 | 13 | A | 1.1520 |
Table 10.
Alternative 2/alternative 3 performance value ratio.
| Ratios Between Performance Ratings (Alternative 2/Alternative 3) (p-Value: 0.9156) | |||
|---|---|---|---|
| Scale | Subgroup Subjects | Connecting Letter | Least Square Mean |
| 7 | 33 | A | 1.1781 |
| 5 | 34 | A | 1.1715 |
| 10 | 45 | A | 1.1626 |
Table 11.
Alternative 1/alternative 3 performance value ratio.
| Ratios Between Performance Ratings (Alternative 1/Alternative 3) (p-Value: 0.8021) | |||
|---|---|---|---|
| Scale | Subgroup Subjects | Connecting Letter | Least Square Mean |
| 5 | 34 | A | 0.7713 |
| 7 | 33 | A | 0.7519 |
| 10 | 45 | A | 0.7408 |
Table 12.
A2/A1 price ratio comparing expected vs. biased rank orders.
| Comparison of Ratio A2/A1 Price (3-1-2 vs. 1-2-3 and 1-3-2 Rank Orders) | |||||
|---|---|---|---|---|---|
| Scale | Rank Order Subgroup | Subgroup Subjects | Connecting Letter | Least Square Mean | |
| 5 | 1-2-3 | 5 | A | 0.8533 | |
| 10 | 1-2-3 | 7 | A | 0.8314 | |
| 7 | 3-1-2 | 13 | A | 0.8261 | |
| 7 | 1-2-3 | 4 | A | 0.8250 | |
| 10 | 3-1-2 | 26 | A | 0.8029 | |
| 5 | 3-1-2 | 18 | A | 0.7549 | |
| 5 | 1-3-2 | 2 | A | B | 0.6000 |
| 7 | 1-3-2 | 4 | B | 0.4167 | |
| 10 | 1-3-2 | 6 | B | 0.3730 | |
Table 13.
A3/A1 price ratio comparing expected vs. biased rank orders.
| Comparison of Ratio A3/A1 Price (3-1-2 vs. 3-2-1 and 2-3-1 Rank Orders) | |||||||
|---|---|---|---|---|---|---|---|
| Scale | Rank Order Subgroup | Subgroup Subjects | Connecting Letter | Least Square Mean | |||
| 5 | 3-2-1 | 8 | A | 2.7917 | |||
| 10 | 3-2-1 | 2 | A | B | 2.7500 | ||
| 7 | 3-2-1 | 7 | B | 2.3071 | |||
| 10 | 2-3-1 | 7 | C | 1.6571 | |||
| 5 | 2-3-1 | 4 | C | D | 1.5833 | ||
| 5 | 3-1-2 | 18 | D | 1.2284 | |||
| 10 | 3-1-2 | 26 | D | 1.2181 | |||
| 7 | 3-1-2 | 13 | D | 1.1647 | |||
| 7 | 2-3-1 | 7 | D | 1.0952 | |||
Table 14.
A1/A3 performance ratio comparing expected vs. biased rank orders.
| Comparison of Ratio A1/A3 Performance (2-3-1 vs. 3-1-2 and 3-2-1 Rank Orders) | ||||||
|---|---|---|---|---|---|---|
| Scale | Rank Order Subgroup | Subgroup Subjects | Connecting Letter | Least Square Mean | ||
| 7 | 3-2-1 | 5 | A | 0.8492 | ||
| 5 | 3-2-1 | 6 | A | 0.8333 | ||
| 10 | 3-2-1 | 7 | A | 0.7857 | ||
| 10 | 2-3-1 | 45 | A | 0.7713 | ||
| 7 | 2-3-1 | 33 | A | 0.7519 | ||
| 5 | 3-1-2 | 2 | A | 0.7408 | ||
| 10 | 3-1-2 | 2 | A | B | 0.6556 | |
| 7 | 3-1-2 | 3 | B | C | 0.4238 | |
| 5 | 2-3-1 | 34 | C | 0.4167 | ||
Table 15.
A2/A3 performance ratio comparing expected vs. biased rank orders.
| Comparison of Ratio A2/A3 Performance (2-3-1 vs. 1-2-3 and 2-1-3 Rank Orders) | ||||||
|---|---|---|---|---|---|---|
| Scale | Rank Order Subgroup | Subgroup Subjects | Connecting Letter | Least Square Mean | ||
| 5 | 2-1-3 | 4 | A | 2.5833 | ||
| 10 | 2-1-3 | 8 | A | 2.1990 | ||
| 5 | 1-2-3 | 6 | A | 2.1389 | ||
| 7 | 1-2-3 | 9 | B | 1.6296 | ||
| 7 | 2-1-3 | 5 | B | 1.6100 | ||
| 10 | 1-2-3 | 11 | B | C | 1.3213 | |
| 10 | 2-3-1 | 45 | C | 1.1781 | ||
| 7 | 2-3-1 | 33 | C | 1.1715 | ||
| 5 | 2-3-1 | 34 | C | 1.1626 | ||
© 2020 by the authors. Licensee MDPI, Basel, Switzerland. This article is an open access article distributed under the terms and conditions of the Creative Commons Attribution (CC BY) license (http://creativecommons.org/licenses/by/4.0/).
Share and Cite
MDPI and ACS Style
Kristbaum, J.P.; Ciarallo, F.W. Strategic Decision Facilitation: Supporting Critical Assumptions of the Human in Empirical Modeling of Pairwise Value Comparisons. Systems 2020, 8, 30. https://0-doi-org.brum.beds.ac.uk/10.3390/systems8030030
AMA Style
Kristbaum JP, Ciarallo FW. Strategic Decision Facilitation: Supporting Critical Assumptions of the Human in Empirical Modeling of Pairwise Value Comparisons. Systems. 2020; 8(3):30. https://0-doi-org.brum.beds.ac.uk/10.3390/systems8030030
Chicago/Turabian StyleKristbaum, Joseph P., and Frank W. Ciarallo. 2020. "Strategic Decision Facilitation: Supporting Critical Assumptions of the Human in Empirical Modeling of Pairwise Value Comparisons" Systems 8, no. 3: 30. https://0-doi-org.brum.beds.ac.uk/10.3390/systems8030030
Note that from the first issue of 2016, this journal uses article numbers instead of page numbers. See further details here.