
Delay Risk Assessment Models for Road Projects


Department of Environmental Engineering, International Hellenic University, 57400 Sindos, Greece
Systems 2021, 9(3), 70; https://0-doi-org.brum.beds.ac.uk/10.3390/systems9030070
Submission received: 23 August 2021
/
Revised: 15 September 2021
/
Accepted: 16 September 2021
/
Published: 17 September 2021
(This article belongs to the Special Issue Decision Making in Construction Projects)
Abstract
:Significant universal research regarding causes of delay in road projects has been carried out based on expert opinion. This study classifies and standardizes all road construction delay factors found in the literature by developing a common risk breakdown structure (RBS) to allow for comparison between real project delay factors, and the study also proposes two delay risk assessment models (DRAMs) based on delay information from 120 real projects constructed in a similar environment with akin procurement and contract policies. The first calculates the risk priority number (RPN) and the second applies the Technique for Order Preference by Similarity to Ideal Situation (TOPSIS) multi-criteria decision-making method (MCDM). The results showed that four specific delay factors dominate in Greek road construction for which relevant mitigation proposals are made. The proposed DRAMs, while calibrated for application in Greece, can be adapted to any construction environment for which real project data is available to provide a tool for transferring experience from past projects to future projects and from accomplished to novice public client decision makers.
1. Introduction
It is commonly accepted that delays in construction of infrastructure projects are incessant. Significant delays in road construction have been documented in developing countries. For example, Amoatey and Ankrah [1] noted highway project delays in Ghana of up to nearly 240% of the original duration while, in Zambia, delays have climbed up to 227% [2]. Since road projects, and especially new highway construction projects, can take up a large portion of public investment budgets, it is evident that significant delays may have serious national economic and political effects.
Although public investment in Greece has fluctuated historically at around 4% of gross domestic product (GDP), it peaked at 6% of GDP in 2004, in preparation for the Olympic Games. Afterwards it dropped drastically by 2010 and crashed completely in 2014 due to the fiscal crisis [3]. Nevertheless, the past 3 years have seen an increase in the number and value of public works construction contracts awarded. In fact, in 2019, public works contracts of up to 1.96 billion EURO were awarded out of which 12% was related to road projects (https://ppp.eaadhsy.gr/index.php/el/apeikoniseis/totals, accessed on 20 April 2020).
Despite their significance, the underlying delay factors for road construction persist and, more often than not, lead to economic losses and costly litigation procedures between clients and contractors [4,5]. The first step to preventing litigation is to identify the delay risks as early as practically possible in the course of a project, and then to manage them throughout. Researchers agree that poor risk management is one of the major reasons causing time and budget overruns, thus tarnishing the reputation of contractors and clients alike [6,7]. Without effective risk management, these adverse effects are perpetuated.
Research into delay factors for the construction industry can be found from as early as 1985, with 1 to 3 articles being published yearly until 2006, and 4 to 8 thereafter, with a spike of 18 published in 2017 [7]. In fact, three concurrent studies published in 2020 carried out a meta-analytical review of the relevant literature claiming to determine global causes of delay in the construction industry [8,9,10]. More specifically, 47 research articles, yielding 1057 different causes of delays, were examined by Viles et al. [10]. The impact measures as proposed in each article were standardized and a new impact measure was generated and then studied statistically to produce a list of 35 delay factors that were subsequently ranked. Durdyev and Hosseini [8] examined 123 studies published in 26 scientific journals. From the 97 studies that met their research criteria, a total of 149 delay factors were identified from articles since 1985.
Even though Sanni-Anibire et al. [9] identified 93 related articles, only 11 met their research criteria and were considered in their meta-analysis. In total, 36 global delay causes were identified, and their relative importance indices (RII) were compared. Furthermore, in their analysis, they distinguished research according to geographical areas as well as construction project types. Interestingly, only five articles were found aimed at determining delay factors in Europe, Oceania and South and North America, while 9 research teams have dealt with the issue in Africa and 25 throughout Asia. These results are in agreement with Viles et al. [10], who found that more than 80% of the total studies were carried out in Asia and Africa as well as with Durdyev and Hosseini’s [8] findings that researchers from developing countries have contributed the most to identifying the causes of construction delay factors. This may indicate that planning and delay issues have been solved to an acceptable degree in developed countries and are no longer considered worthy of further study. Nevertheless, as concluded by Sanni-Anibire et al. [9], the causes of delay can be country/location and project specific, thus justifying country-specific research studies.
While substantial literature can be found regarding the determination of construction delay factors in general around the world [8], this is not the case for road projects in particular. Thus, in a topic search in SCOPUS using the following key words—‘construction delays’, ‘delay factors in construction’ or ‘causes of delay’ and ‘highway’ or ‘roads’—from 2000 to 2020, only five studies were found directly related to delay factor analysis in road construction. As shown in Table 1, numerous articles were found in regard to the prediction of actual road construction duration, four that address risk analysis and/or allocation and two that aim to predict expected extensions of time (EoT). Other studies related to construction time for road projects were found, but these dealt with scheduling, control or forensic evaluation techniques and their application to the complexities of specific aspects of road construction such as excavations [11], tunnels [12] or bridges [13].
Kaliba et al. [2] employed a questionnaire survey to rate the impact of delay factors on road projects in Zambia with only 26 respondents and provided calculations for the relative importance index (RII) for 14 factors. Similarly, Mahamid et al. [4] presented the opinions of 34 contractors and 30 consultants from the Palestine’s road construction industry identifying a total of 52 delay factors ranked based on their RII with slight differences between participant groups. Along the same lines, Edwards et al. [14], whose aim was to determine the relationship between financial distress-related factors and project delay in Ghana’s road construction industry, examined 20 factors and obtained 78 responses.
Even Amoatey and Ankrah [1], who presented the resulting time and cost overruns of 48 road projects in Ghana, provided the RII for each of the 23 factors examined based on the opinions of 123 experts. These experts provided the reasons why they believed that the particular projects were delayed without providing information of how this knowledge was obtained.

Table 1.
Research articles related to road construction duration and delays.
| Author | Year | Scope | Data Source | Data Description | Methodology | Country | No DF/IV |
|---|---|---|---|---|---|---|---|
| Wang and Chou [15] | 2003 | RA | other | Opinions of 6 bidders for the same project | Interviews | Taiwan | 19 |
| Molenaar [16] | 2005 | RA | other | group decision effort | Statistical Models | USA | 23 |
| Jiang and Wu [17] | 2007 | ADP | data collection | 1818 road projects | Regression | USA | 4 |
| Zayed et al. [18] | 2008 | RA | both | 4 questionnaires/4 projects | AHP | China | 27 |
| Kaliba et al. [2] | 2009 | DFA | questionnaire | 26 questionnaires | RII | Zambia | 14 |
| Pewdum et al. [19] | 2009 | ADP | data collection | 51 projects from which 1022 observations | ANN | Thailand | |
| Long and Ohsato [13] | 2009 | ST | 1 bridge application example | ||||
| Mahamid [20] | 2011 | RA | questionnaire | 18 questionnaires | Risk Matrix | Palestine | 29 |
| Infran et al. [21] | 2011 | ADP | data collection | Regression | USA | ||
| Mahamid et al. [4] | 2012 | DFA | questionnaire | 64 questionnaires | RII | Palestine | 29 |
| Anastasopoulos et al. [22] | 2012 | PEoT | data collection | 1722 road projects | Statistical Models | USA | |
| Hosseinian & Reinschmidt [12] | 2015 | ADP | data collection | 1 tunnel | Bayesian Inference Models | Iran | |
| Aziz & Abdel-Hakan [23] | 2016 | PEoT | questionnaire | 389 questionnaires | RII | Egypt | |
| Ekanayakea & Perera [24] | 2016 | TPAT | both | 48 projects and 60 questionnaires | RII | Sri Lanka | |
| Vu, et al. [5] | 2017 | DFA | questionnaire | 246 questionnaires | Factor Analysis | Vietnam | 50 |
| Edwards et al. [14] | 2017 | DFA | questionnaire | 60 questionnaires | Factor Analysis | Ghana | 20 |
| Amotaye & Ankrah [1] | 2017 | DFA | both | 48 road projects and 123 questionnaires | RII | Ghana | 11 |
| Glymis et al. [25] | 2017 | ADP | data collection | 37 highway projects | ANN | Greece | 3 |
| Waziri et al. [26] | 2017 | ADP | data collection | 57 highway projects | Regression | Nigeria | |
| Titirla & Aretoulis [27] | 2019 | ADP | data collection | 37 highway projects | ANN | Greece | 6 |
| Mahamid [28] | 2019 | ADP | data collection | 112 road projects | Regression | Palestine |
Note: RA = risk analysis, ADP = actual duration prediction, DFA = delay factor analysis, ST = scheduling techniques, PEoT = prediction of EoT, TPAT = time performance analysis techniques, No DF/IV = number of delay factors/independent variables.
Vu et al. [5] acknowledged that increased highway development in Vietnam provides enormous opportunities for international construction companies. They also recognized that the high risks associated with highway construction projects due to their more complicated characteristics often result in significant delays. As a result, they too defined 50 delay factors classified into 12 categories based on a questionnaire survey, but also went one step further and proposed a specific risk management framework using factor analysis and a structural equation model to help prevent international construction companies from being discouraged from bidding for such projects
The only study found that utilized data from a significant number of real projects was by Anastasopoulos et al. [22]. In their study they used data from 1722 highway projects in Indiana, to study the factors that contribute to the likelihood of encountering a project time delay and develop random-parameter statistical models to estimate its duration. The data used from the actual projects were related to the project characteristics, i.e., project cost (contract bid amount), project type and planned project duration. The only underlying delay factor considered was the likelihood of adverse weather.
As determined by the literature review, establishment of a set of likely underlying construction delay factors and their subsequent ranking in terms of frequency of occurrence or perceived project impact has been confirmed by the majority of researchers as a credible method to pinpoint anticipated delays and provide mitigation advice [1,2,4,5,14]. Furthermore, all five articles focused on the determination of underlying delay factors for road projects were based on questionnaire surveys. Hence, their results are determined by expert opinion and not by actual analysis of historical delay factors occurring in real projects and independent of the project’s characteristics.
Therefore, the question that arises is as follows: Do the multitude of underlying factors causing project delays determined by expert opinion actually occur frequently in real projects? The key word here is frequently. Obviously, all factors quoted in the literature occurred at some point since they were based on an expert’s personal experience. For example, if any professional civil engineer in Greece is asked if they believe that the existence of antiquities found during project excavation is an important underlying delay factor for Greek construction projects, the answer will most definitely be yes and be rated as causing a high impact on project delays. The fact is that, as will be shown in this study, out of 120 road construction contracts in Greece, the final duration of only 2 was affected by archaeological findings.
Different quantitative methods have been used to evaluate the effects of identified road construction delay factors to provide practitioners with decision-making aids for managing the associated risks. These include the Analytical Hierarchy Process (AHP) [18], the RII [1,2,4] and factor analysis [5,14]. Although these quantitative methods are indeed effective in ranking the various delay factors in terms of their perceived frequency of occurrence, they do not take into consideration the magnitude of their effects or the vulnerability that any given road project may have towards each delay factor, and thus do not provide all required knowledge to carry out project-specific delay risk analyses.
Other researchers that focused on delay risk analysis for road projects include Wang and Chou [15], who examined risk allocation and risk handling from the contractor’s perspective, and Zayed et al. [18], who developed a risk assessment model based on the AHP to assist contractors in the Chinese highway construction industry in prioritizing projects to bid for. On the other hand, for the benefit of public clients, Molenaar [16] employed group decision methods to quantify risks for the construction of specific road projects, and Mahamid [20] attempted to estimate the impact and the probability of occurrence of each delay factor by applying the risk matrix technique. In all four cases, the data were also obtained based on professional opinion, interviews and literature reviews and not on actual project data.
Notably, none of these aforementioned studies proposed the use of the most common risk assessment method, i.e., the risk priority number (RPN), which is derived by the multiplication of the probability, severity and vulnerability measurements of each risk factor for the project [29]. Furthermore, multi-criteria decision-making (MCDM) methods, due to their ability to encompass multiple and, in many cases, conflicting criteria to produce rankings of alternatives, have greatly contributed to the development of risk assessment methods. For example, in the construction industry, MCDM methods have been adopted for ranking of health and safety risks [30,31,32], environmental impacts [33] and one for road delay factor ranking [18].
In this study, both the classic RPN risk analysis method and the Technique for Order Preference by Similarity to Ideal Situation (TOPSIS) MCDM were implemented. According to Boran et al. [34], the only applications of TOPSIS for decision-making problems in the construction industry were related to the choice of suppliers and none referred to its use in the field of highway construction. Subsequently, the method has been used for bridge rehabilitation management [35], alternative highway construction contract types [36] and ranking of road alignment blackspots [37].
The novelty of this study is that it proposes quantitative, project-specific, delay risk analysis methods (DRAMs) that exploit both the public client’s project management expertise and historical data from 120 road projects constructed in Greece from 1995 to 2017. Furthermore, previous knowledge regarding international delay factors for road construction projects are built upon by developing a unified delay risk breakdown structure (RBS) that classifies documented delay factors to facilitate comparisons to real project data. This approach aims to benefit public clients by providing them with a tool to mitigate expected delay factors by transferring experience from past projects to future projects and from accomplished to novice public client decision makers.
2. Materials and Methods
2.1. Research Objectives
This study’s methodology follows an ‘action’ research style that defines the questions to be investigated, within the context of a specific situation, and then moves on to collect and analyze the relevant data. From the data analyses the gap between the desired and the actual state is determined and constitutes the basis for the development of proposals to eradicate the difference and improve a practice [38]. Therefore, the current action research aims to investigate the following questions:
- Can a universal list of underlying road construction delay factors be declared?
- How frequently do documented delay factors actually occur in real road projects?
- What are the likely delay factors in Greek road projects?
The data to be analyzed for question 1 are based on the literature review described in Section 1, while actual road project delay factors will provide the data for questions 2 and 3. Furthermore, the objectives of the current study are as follows:
- Development of a unified RBS of road construction delay factors based on international research.
- Identification and ranking of likely delay risk factors for road construction projects based on actual project data and comparison of results to findings in the literature.
- Development and comparison of two DRAMs based on the RPN and the TOPSIS method.
- Comparison of the results and validation of models based on two hypothetical projects with varying vulnerability to the defined likely delay factors.
This approach aims to provide road construction public clients with a decision tool for prioritizing delay risks to enhance adequate contractual and/or management actions for delay prevention. By identifying which delay factors have a greater impact on Greek road construction contracts and proposing quantitative methods to rank them based on project-specific vulnerability, the main purpose of action research is achieved, which is the introduction of a change for the improvement of a practice.
2.2. Data Collection and Description
A detailed study, based on the aforementioned literature review, produced the data of delay factors that were determined globally to affect road construction projects. The articles that provided both a list of delay factors and an estimate of their frequency and/or severity were by Molenaar [16], Zayed et al. [18], Kaliba et al. [2], Mahamid et al. [4], Amotatey and Ankrah [1] and Edwards et al. [14], reflecting delay factors that manifest in the road construction industries of the USA, China, Zambia, Palestine and Ghana, respectively. These were combined to provide a comprehensive list of 97 delay factors. Notably, only 33 delay factors were found in more than one article, echoing the diversity of delay factors around the world.
The real project data were collected from 120 contracts for construction of sections of the Egnatia Odos Highway, its perpendicular axes and local road projects. The scope of work of these contracts included construction of highway sections and smaller local roads, as well as rehabilitation and/or resurfacing works. Specifically, the project files for the 120 construction contracts were examined to determine the actual reasons that led to the delay in their completion. In fact, the reasons for delay for a significant number of the projects were personally witnessed by the author, who has 22 years of professional experience at Egnatia Odos S.A. (EOSA), the client organization responsible for the design, procurement and supervision of the construction of Egnatia Odos Highway and other major and minor road projects in Northern Greece and some of the Greek Islands. Furthermore, EOSA has been a source of data for construction management research in research domains such as actual duration prediction [27], value for money bridge design [39] and construction material consumption and actual cost prediction [40]. Hence, this data collection approach, which is alternative to interviewing or circulating a relevant questionnaire, belongs to a group of methods known as unobtrusive measures [38].
The data collected included contracts of budgets varying from less than EUR 100,000 to EUR 150 million and executed from 1994 to 2017. The information used was the project start date, original duration, actual completion date, number of extensions of time (EoTs) approved, duration of EoTs granted and the actual reasons for delay. In addition, the variables ‘total EoT,’ as well as ‘percent increase in construction duration’ were calculated.
Similarly, to the situation in Greece, Ekanayake and Perera [24] distinguished different types of delays based on the party that is responsible for them and whether or not they are excusable delays or non-excusable delays. Excusable delays and non-excusable delays can be further subdivided in to non-compensable and compensable delays. The Greek public works legislation provides that, for all public works contracts, the contractor is entitled to an EoT only for excusable delays that are proven not to be the responsibility of the contractor, but most are non-compensable as per the contract. In all other cases, if there is a delay and the public client feels that allowing for an EoT is to the benefit of the project, it normally grants it but with a monetary penalty that is defined in the contract.
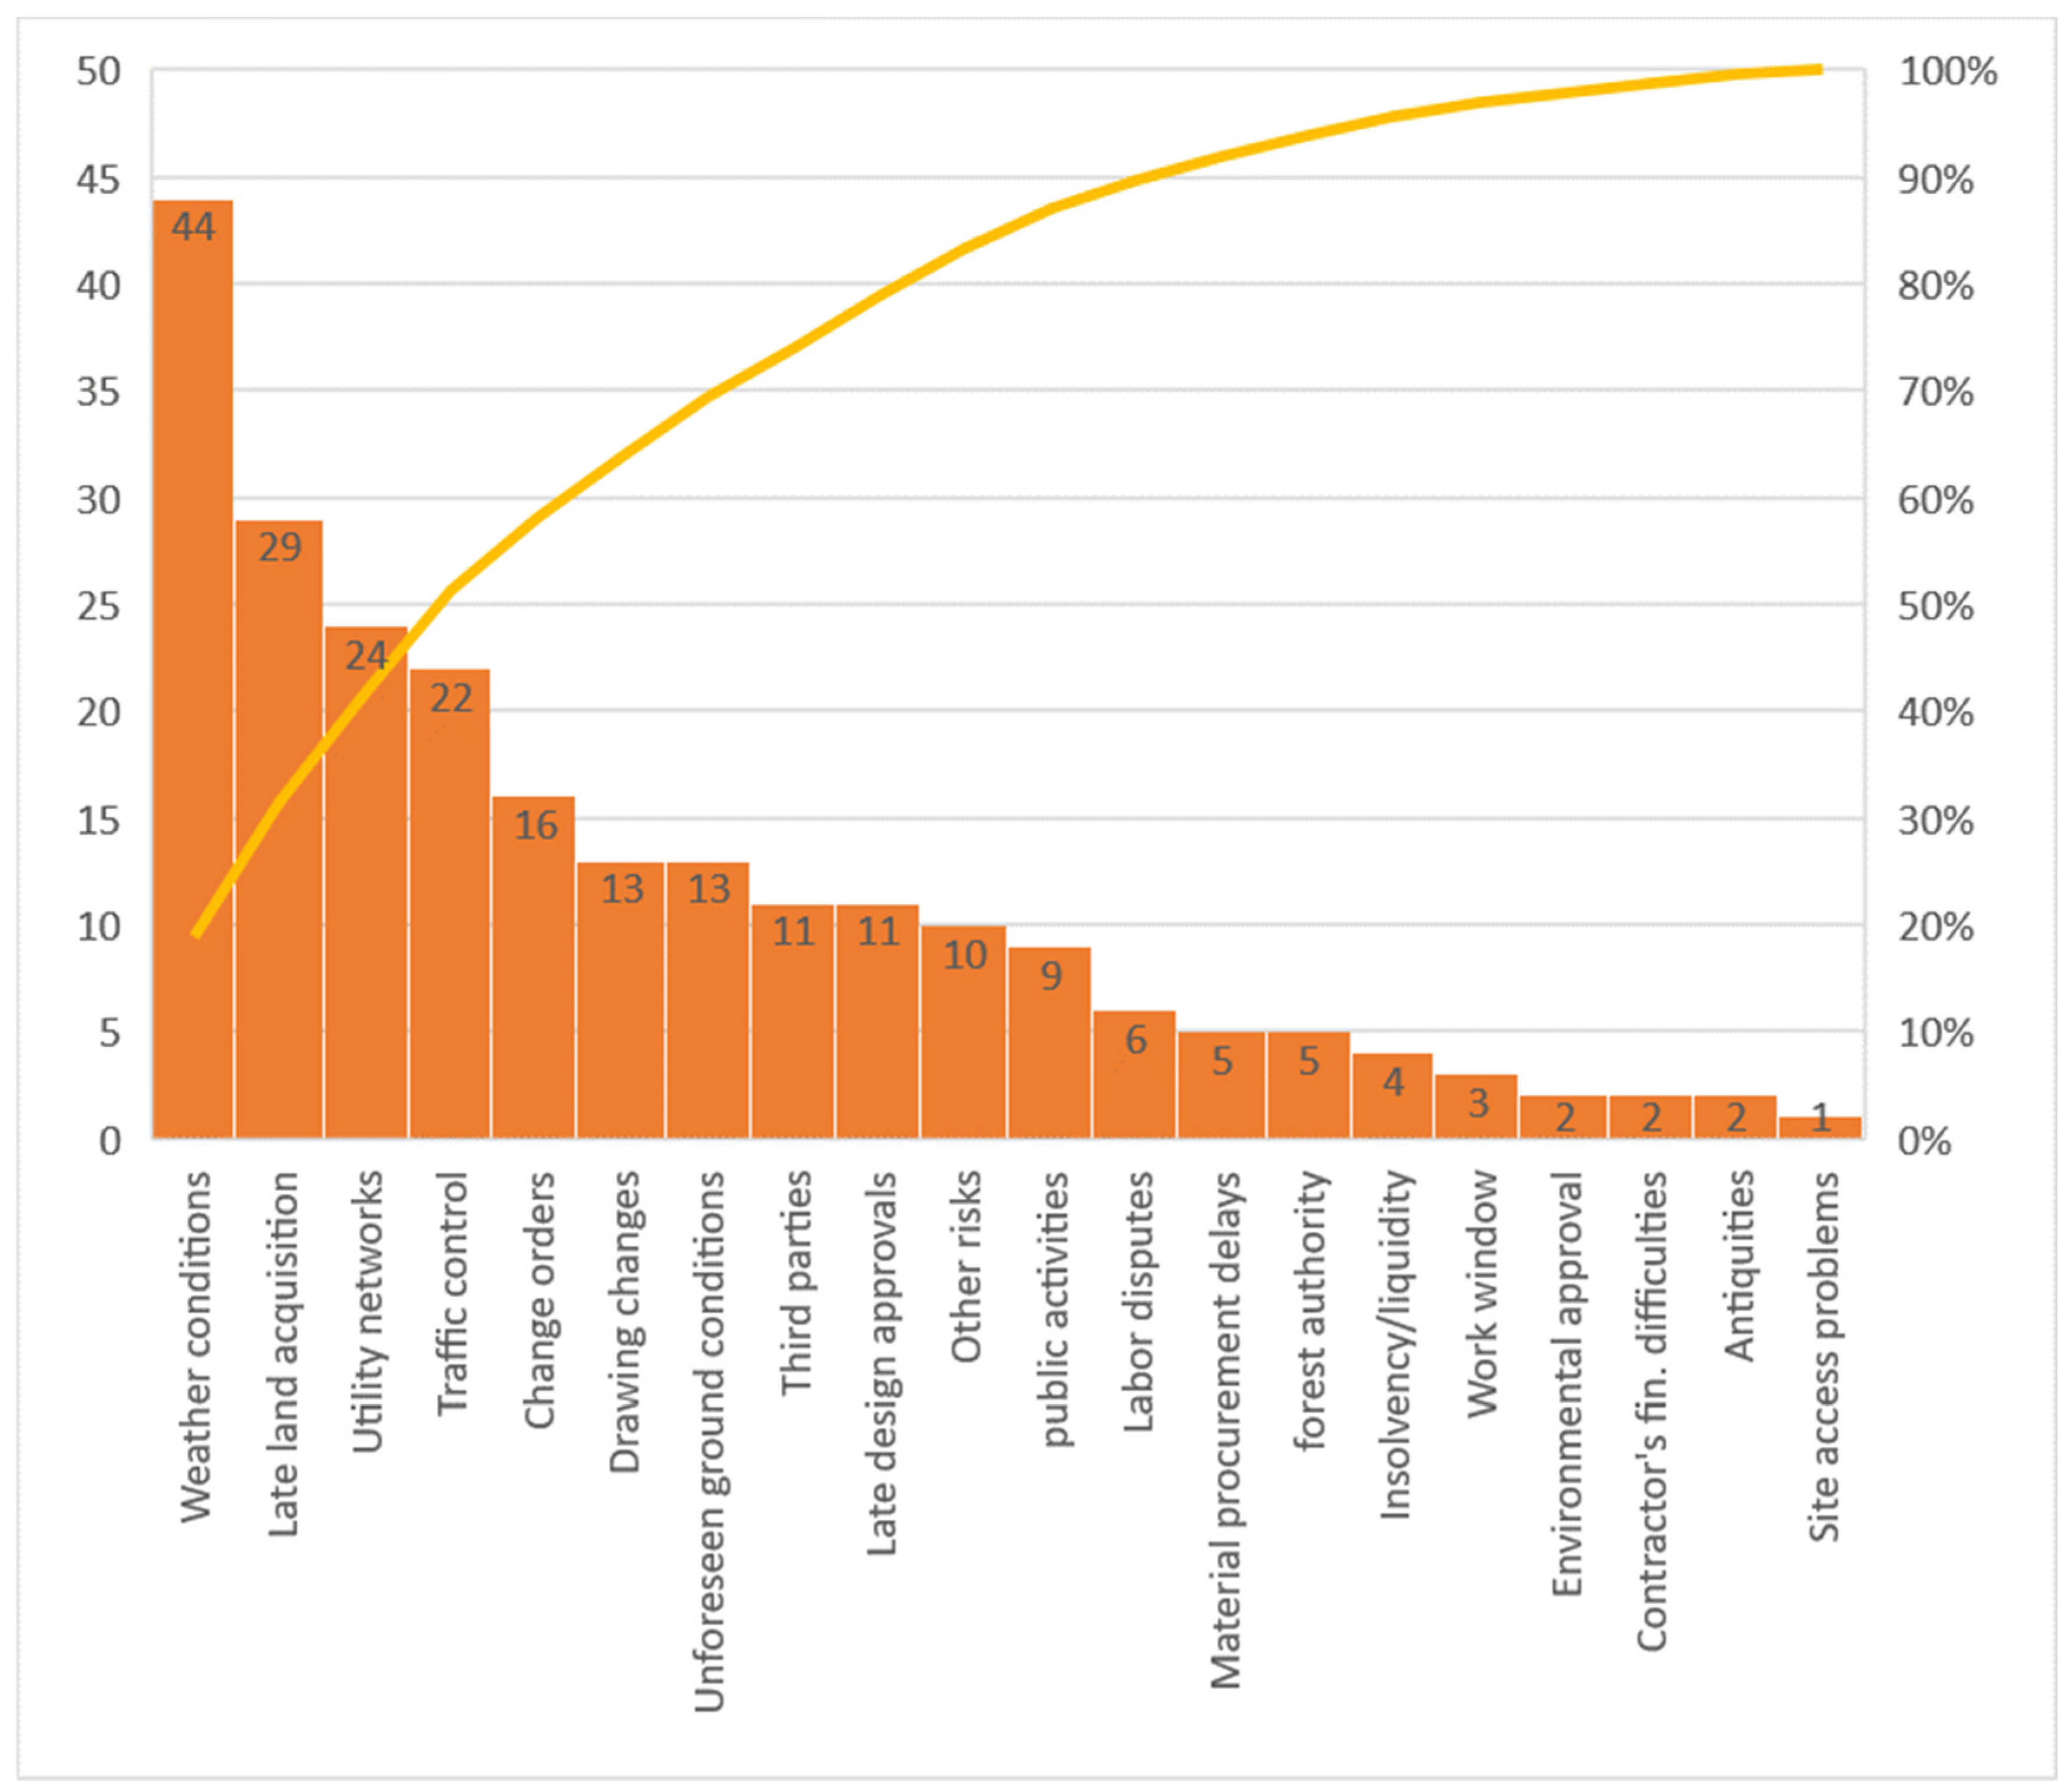
Therefore, the 20 different delay factors that were documented, corresponding to each contract, were all excusable delays that were claimed by the contractors as legal reasons that are allowed for in Greek legislation and that were in fact considered in the public client’s decisions to grant each EoT. From the Pareto diagram in Figure 1, the number of contracts for which the particular delay factor was quoted as a reason for an EoT can be seen, where ‘weather conditions’ is by far the most frequent reason cited for delay in 43 contracts, followed by ‘late land acquisition’, ‘utility networks’ and ‘traffic control’. A Pareto diagram shows the limited number of delay factors that produce a significant overall effect [29]. In this case, Figure 1 shows that nine delay factors occurred in nearly 80% of the construction contracts investigated, i.e., ‘weather conditions’, ‘late land acquisition’, ‘utility networks’, ‘traffic control’, ‘change orders’, ‘unforeseen ground conditions’, ‘changes in drawings’, ‘late design approvals’ and ‘third party conflicts’.
The data were transformed in order to be included in the IBM SPSS Statistics 23 statistical analysis software. Specifically, the 20 reasons for delay were depicted as separate binary categorical variables, with two possible values; 0 if the reason did not occur and 1 if it did. In addition, following examination of the resulting histogram and using the visual binning method provided by IBM SPSS Statistics 23 the variable ‘percent increase in construction duration’ was transformed into a categorical variable with the following four categories: less than 50% increase, between 50% and 100% increase, between 100% and 150% increase and greater than 150% increase. This was done in order to calculate the RII as a measure of the impact (severity) of the delay caused by each specific factor.
2.3. Background to RPN and TOPSIS DRAM Models
Within the context of projects, risk is commonly associated with an uncertain event or condition that, if it occurs, has a positive or a negative effect on the objectives of a project [29]. In this case, the delay factors are risks that, if they occur, will have a negative effect on the objective of completing the project on schedule. In this context, risk is viewed as a multidimensional quantity commonly approximated by a point estimate as the expected value resulting from the multiplication of the probability of the event occurring (P) by the consequence, impact or severity (S) of the event, given that it has occurred. Thus, the risk value (RV) of a particular delay factor i, can be calculated simply by Equation (1).
RVi = Pi * Si,
Taking the issue one step further is the calculation of the risk priority number (RPN). The RPN (Equation (2)) is calculated by multiplying P by S by the vulnerability rating (V). Vulnerability is defined as the intrinsic properties of a system making it susceptible to a risk source that can lead to an event with a consequence [29].
RPNi = Pi * Si * Vi,
The RPN technique was first introduced in 1971 by Fine and Kinney [41] for the estimation of construction safety hazards and provides a simple formula for calculating the quantified risk due to each hazard in an aim to provide a numerical formulation for the urgency for the remedial attention to the hazard. Ayyub [29] defines RPN as a weighted assessment number used for prioritizing the risk factors; the larger the RPN, the greater the risk. The RPNs are sorted and the actions are recommended for the top issues [29].
According to the TOPSIS method, originally proposed in 1981 by Hwang and Yoon [42], alternatives can be ranked in accordance to how far they are from the ideal solution. In particular, the highest-ranking delay factor is the closest one to the ideal solution and the furthest away from the anti-ideal solution [43]. The TOPSIS method is easy to apply and requires the decision maker to input only the subjective weights of each selection criterion depending on the requirements of the problem. Even this subjectivity can be overcome if Shannon’s entropy method is utilized [44]. Detailed mathematical formulations for this method can be found in Ishizaka and Nemery [43] as well in its applications by Antoniou and Aretoulis [36], Jozi et al. [33] and Srdjevic et al. [44]. In summary, the TOPSIS method constitutes of the following 5 computational steps:
Step 1: Normalization. The scores of m alternatives against n criteria are denoted in a mxn decision matrix. In this case, there are 20 alternatives (delay factors) and 3 criteria (P,S,V). These are normalized to allow for the comparison between criteria with different units of measurement. Various methods of normalization exist such as the distributive and ideal normalization methods [36] as well as the additive method [44] which was applied in this study. The additive normalization divides each score with the sum of scores in the column, thus producing the normalized decision matrix containing the normalized values [36].
Step 2: Weights. Next the matrix of weighted normalized scores is formed by multiplying the normalized scores by the weights for each criterion. In this study Shannon's Entropy method is applied to calculate the weights of the three criteria. Shannon’s Entropy method is applied to calculate the weights of the three criteria. Entropy is a measure of uncertainty in the information. By considering the evaluation of each delay factor as specific emitters of information about the importance of each criterion, the entropy approach enables measuring that source and determining the relative weights of the criteria (w1, w2,...,) objectively [33,42].
The information contained in the normalized matrix X’ can be considered as ‘emission power’ of each delay factor and used to compute an entropy value ea, while 1/lnm is a constant term that keeps the value of ea between 0 and 1. The entropy value for each criterion ea is calculated using Equation (3).
The weights w1, w2,…wa are given by Equation (4)
Because the criteria weights are obtained directly from the decision matrix, which means independently of the project manager, this method constitutes an unbiased weight calculation procedure. The weights can also be calculated based on the project manager’s experience and knowledge to reflect a more project-specific importance of each criterion.
Step 3: Ideal and anti-ideal solution. The weighted normalized values are compared in order to define the ideal and anti-ideal scores in each column. If the aim is to maximize the score in each column then the ideal solution is taken as the maximum normalized value and the anti-ideal value is the smallest value in the column. The reverse holds if the aim is to minimize the score in each column. Thus the best and worst performance for each criterion is defined [36].
Step 4: Distance from ideal and anti-ideal solution. The Euclidean distance is used to calculate how far each delay factor is from the ideal (d+) and the anti-ideal solution (d−) per criterion [36].
Step 5: Closeness coefficient. The closeness coefficient Ca, takes values between 0 and 1 (Equation (5)). An alternative that is close to the ideal solution has a Ca value nearer to 1, otherwise, if it is closer to the non-ideal solution, it approaches 0.
3. Results and Discussion
3.1. Analysis of Delay Factors from the Literature and Comparison to Project Data
3.1.1. Literature Delay Factor Analysis
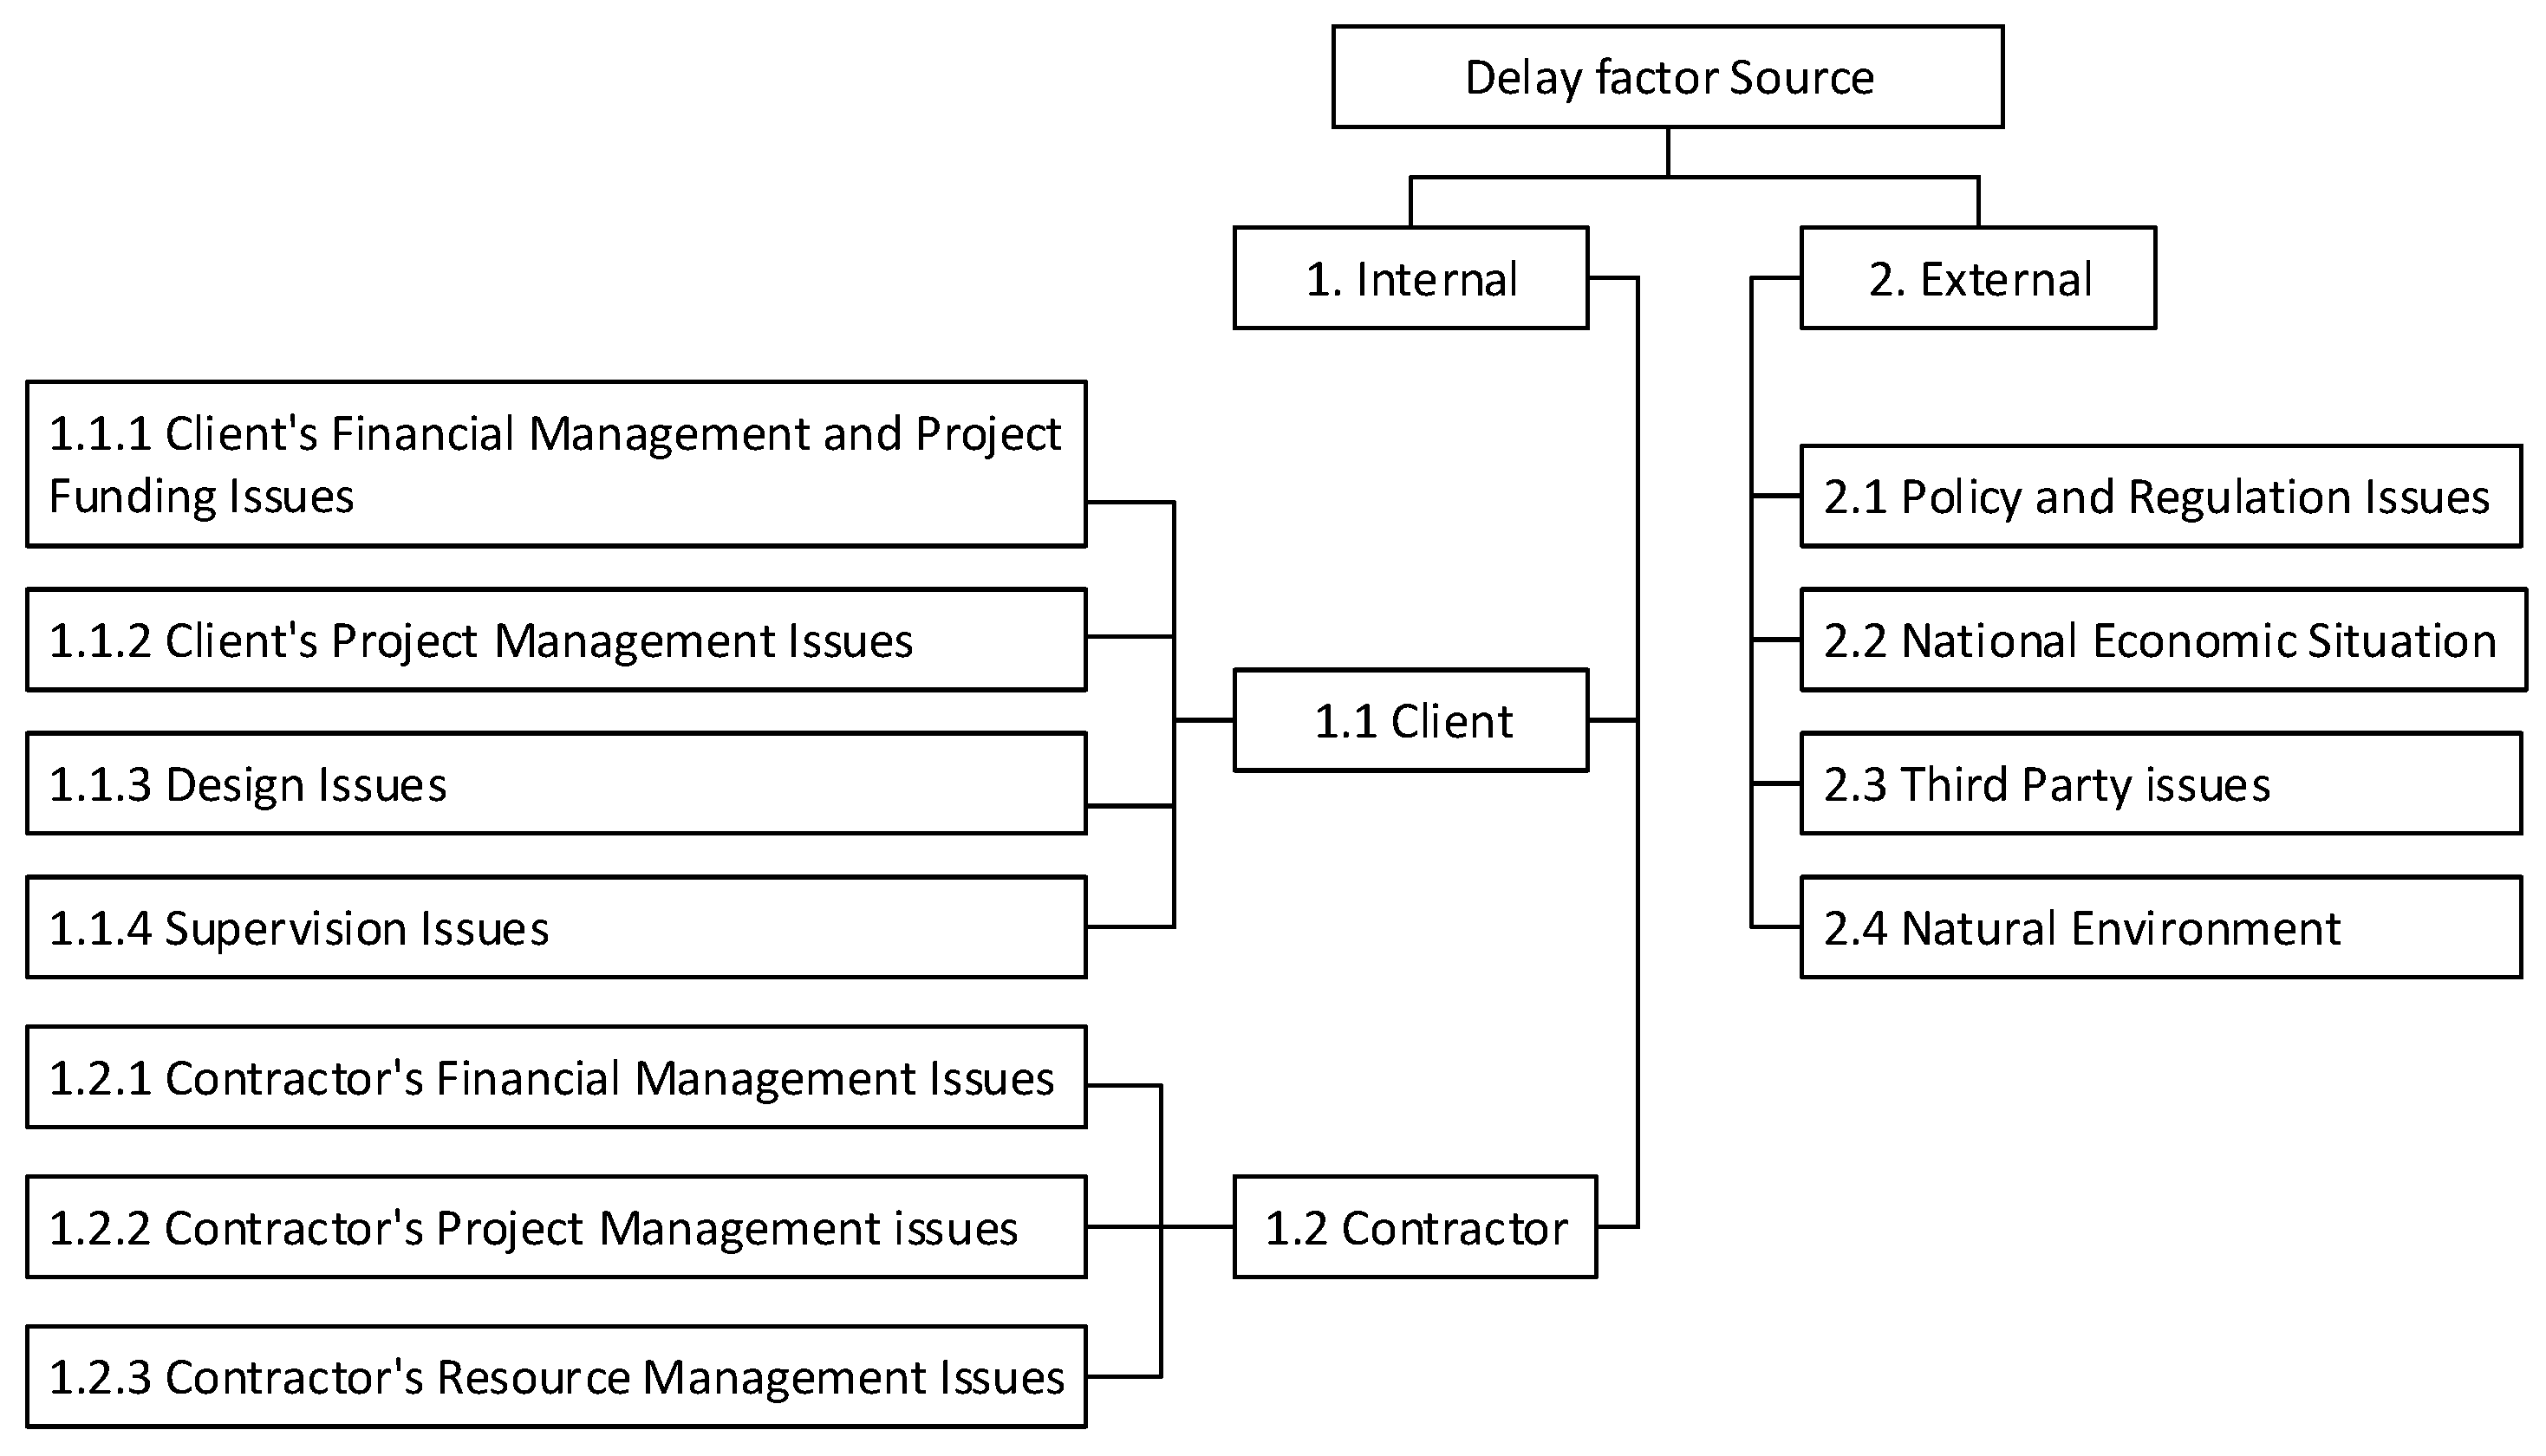
As for all risks, delay risk sources can be organized and structured to provide a standard presentation that can improve understanding, communication and management. Defining risk sources in such a hierarchical structure is referred to as a risk breakdown structure (RBS) [29]. As no road construction delay factor nomenclature has been defined, the factors were categorized based on the source of the delay in a hierarchical structure similar to the categorization employed by Vu et al. [5]. Each descending level represents an increasingly detailed definition of delay risk sources for the project. Figure 2 depicts this categorization and the resulting RBS at the category level.
Internal delay factors are those for which either the client or the contractor are responsible either directly or indirectly. For example, in the traditional design–bid–build procurement system, since the client is responsible for design modifications and approvals, as well as for the supervision of construction, delays due to deficient designs or supervision actions were classified as internal regardless if they were outsourced or not. Therefore, internal delay factors are those caused by the client, the contractor, the supervisor or the designer. External delay factors are those resulting from policy and regulation issues, the general economic situation of the country, conflicts with third parties, such as local authorities, utility companies, transportation networks and the natural environment.
After matching all delay factors rated per author to the common RBS, their ranks were compared. Table 2 provides the full RBS of the 97 delay factors classified according to the RBS categories (Figure 2) and their rankings as per the studies examined, while Table 3 shows the ranking of the top 5 delay factors per article, using the unified delay factor RBS codes and names.
3.1.2. Comparison of Current Research Data to Literature
In this study, the excusable delays were essentially investigated because the data came from the client’s documentation during the procedure for approvals of EoTs. No cases of non-excusable delays were found that led to the imposition of a fine. In any case, the comprehension of those excusable delay factors that lead to EoTs will help public clients define more robust contractual terms that transfer the risk to the contractor and also indicate those likely delay factors to be remedied prior to tender. Table 4 provides a comparison of the ranking of the 20 excusable delay factors found to have occurred in the EOSA projects and their corresponding ranking found in the literature analysis.
3.2. Application and Discussion of Risk Assessment Models
While sophisticated software is easily available on the market for the quantitative analyses of risks, the software programs are usually designed to address a wide range of risk modeling techniques based on many levels of complexity. They can therefore be quite intimidating for use by public clients in Greece, which are generally understaffed and lack the necessary training and are, therefore, expected to be unfamiliar with such software. As a result, it is the intention of this study to develop and compare two easy to apply DRAMs to reduce ambiguity and help public clients forecast expected delay factors early in the contract award procedure that will allow them to take alleviation measures early enough to forestall EoT. Data from 120 road project construction contracts were used to determine both the P and S values. On the other hand, the V value is subjective and varies according to the decision maker’s aversion to risk and the actual conditions for the particular project. The P value of each delay factor was calculated according to Equation (6).
where ni = the number of contracts for which the ith delay factor occurred and N = 120.
Next, the S value was calculated by calculating the RII according to Equation (7). In this case, each of the four categories of the variable “percent increase in construction duration” was given a value of 1 to 4 according to the severity of the increase in construction duration. More specifically “less than 50% increase” was given a value of 1, “between 50% and 100% increase” was given a value of 2, “between 100% and 150% increase” was given a value of 3 and “greater than 150% increase” was given a value of 4. These values were the weights wj in the RII equation [45].
At this point, by using Equation (1), the RV for each delay factor was calculated based only on the proven track record of the 120 completed projects without considering the vulnerability that a specific project may have acquired to each delay factor. Next, as the V value is subjective and varies according to the actual conditions for each project, it was taken as 1 if the vulnerability of the examined project to the particular delay factor was considered as low, 2 for factors considered as medium and 3 for factors considered as high vulnerability. These values were normalized by dividing the given value by 3, the maximum value, allowing for these values to be between 0 and 1 in accordance with the P and S values. The resulting rankings from application of the first DRAM based on the calculation of the RPN (Equation (2)) are shown in Table 4.
For the implementation of the second DRAM that applies TOPSIS for ranking of the delay factors, the probability of occurrence, severity of the delay and vulnerability of the project to each factor were the criteria against which each delay factor was evaluated. This means that the delay factors constituted the alternatives. Each of the factors was rated against each criterion by using the same P, S and V values calculated previously, producing a 20 x 3 decision matrix. Next, the additive normalization method was used to normalize the decision matrix values as the V values were measured on a different scale to the P and S values. All three criteria weights were initially calculated objectively using Shannon’s entropy method [33] based on additive normalization values of the decision matrix [44]. Following steps 3, 4 and 5 of the TOPSIS method, the closeness coefficient of each delay factor was calculated and subsequently ranked in descending order. This TOPSIS DRAM yielded the ranking presented in Table 5.
In order to facilitate comparisons between methods, the first scenario entails that all delay factors were considered as high vulnerability factors equal to 3. Table 5 shows under Scenario 1, the resulting ranking of each delay factor for road projects in Greece according to the RV, the RPN DRAM and the TOPSIS DRAM. The same ranking will result no matter whatever V value is given as long as it is equal for all factors.
These results are not the same if a specific case study is considered. Therefore, Scenario 2 assumed that a specific highway project is to be constructed in a rural area in Southern Greece where delays as a result of obstructions by utility networks, traffic control, conflicts with other projects and where restrictions due to tourism are minimal. Additionally, the weather conditions are generally good, and therefore, delays due to weather conditions are not expected. In addition, it was assumed that the financial situation of the chosen contractor is healthy, and therefore, the risk of bankruptcy and insolvency is also minimal. On the other hand, as the project is in the mountainous area of Greece and the public client is not very confident of the quality of the design studies, the project is considered highly vulnerable to geotechnical problems that may lead to design changes and an increased scope of work that will require change orders according to the encountered conditions. In addition, the mountainous terrain is bound to hamper the construction of access roads to construction fronts. At the same time, the regional authority is notorious for delays in issuing quarry licenses, affecting essential material procurement processes, as well as intervention permits to allow for the cutting of trees in the forest through which part of the project is aligned. Most importantly, as the land acquisition procedures have not been completed for a third of the project, it is most vulnerable to delays caused by this factor. Finally, the project is deemed to have medium vulnerability to the remaining delay factors as shown in Table 4. This case study, while fictional, is a feasible example of road construction projects in Greece. Using these vulnerability ratings for each factor, the calculations for the DRAMs were repeated as a sensitivity analysis.
4. Discussion
This study proposes two equally applicable quantitative DRAMs to rank project-specific expected delay factors calibrated for application in the Greek road construction industry to provide guidance to Greek road authorities for construction delay mitigation. As a quantitative risk assessment will always be limited by the assumptions on which the calculations are based [29], it is considered that this study provides reliable DRAMs, since its calculations are based on past project experience in a similar environment with akin procurement and contract policies.
Initially, a unified delay RBS for road construction was developed including 97 delay factors, which amalgamates international knowledge. As can be seen from Table 3, only the factors ‘delayed payments to contractor’, ‘contractor’s financial difficulties’ and ‘claim management process’ appear more than once in the top five ranking. In fact, even between the two articles focusing on road projects in Ghana, the results are completely different. This supports the view that project delay factors should not be examined purely on expert opinion but should consider past experience from actual projects as well as current project-specific characteristics and situations. As a result, it is concluded that no top 10 universal delay factors for road projects can be declared. Delay factors are unique to each construction industry and depend greatly on procurement policy and procedures as well as project-specific characteristics. Another noteworthy observation from Table 2 and Table 3 is that two additional delay factors arose in the EOSA projects. The first is delays due to the findings of antiquities during excavation, which is a likely risk for construction projects requiring ground excavations. The second is delays due to the Regional Forestry Department’s delay or refusal to provide working permits in forest areas. While it is required to obtain agreement from both the Regional Forestry Department and the Archeological Authorities during the projects’ environmental approval procedure and before the project tender, it is always necessary to request an intervention permit by the Forestry Department and to arrange for the presence of the responsible archeologist when construction commences. If and only if antiquities are found, then serious delays will be incurred. Furthermore, only 20 of the defined 97 unified delay factors were found in the Greek projects, and of these, only 7 were found in more than one of the other studies. Only three or four delay factors were found in common with the African countries. The greatest number of common factors were found with Palestine, but even those were ranked much lower than in Greece. Only two equal ranking delay factors were found, i.e., ‘weather’, which was also ranked number 1 in China, and ‘changes in drawings’ which was ranked number 6 in Zambia.
After the application of the proposed DRAMs on the first scenario project that assumed equal vulnerability to all factors, the results showed that the first six ranking delay factors remain the same regardless of method and subsequently vary slightly (Table 5). These top-ranking factors in descending order are ‘weather conditions’, ‘late land acquisition’, ‘utility networks’, ‘traffic control’, ‘change orders’ and ‘drawing changes.’
On the other hand, the results regarding Scenario 2 show the RPN ranks seem to be more sensitive to the V values, resulting in higher rankings for most of those delay factors with high vulnerability ratings in comparison to the TOPSIS DRAM using Shannon’s entropy weights, which provide an illogical result as the project was thought to be of low vulnerability to three of the top five factors, i.e., ‘weather conditions’, ‘utility networks’ and ‘traffic control’. This indicates that when the weights given to each criterion, regardless of the method, are more or less equal, the results derived will reflect mostly the historical data information, not taking into account the special conditions of each project. By considering a different weight distribution, instead of the Shannon entropy ones, which were nearly equal, it was postulated that different and more realistic results could be obtained. Nevertheless, by considering a weight of 0.25 for both the P and S values and 0.5 for the V values, hence emphasizing the importance of the project-specific conditions, only slightly different ratings were achieved in the top six compared to the first TOPSIS application. Specifically, ‘change orders’ which were given a V value of 3, which switched ranking with ‘traffic control’.
This almost complete agreement in the top six delay factors is explained by the fact that the four delay factors with the highest probability of occurrence also have the greatest severity values, therefore making them the four most significant issues that awarding authorities need to face as efficiently as possible to prevent delays in future road projects in Greece. Moreover, it is noted that the other delay factors that were given a high vulnerability rating for Scenario 2, i.e., V = 3, either retained their ranking or moved up one or two positions. For example, ‘material procurement delays’ and ‘forest authority’ moved from the 12th to 10th position. As a result, the two DRAMs proposed for implementation by Greek road project public clients are the RPN and the TOPSIS with weights equal to 0.25 for both the P and S values and 0.5 for the V values. The proposed DRAMs, while developed based on specific project data in Greece, can be adapted to any construction environment for which real project data is available. The first step for its calibration is to determine which of the 97 unified delay factors are relevant to the particular construction environment from the available project data and to calculate the corresponding P and S values. Next, these easy to apply DRAMs require public clients to rate, on a scale of 1 to 3, the vulnerability of their particular project to each of the likely delay factors, which will then produce the rankings of the delay factors for the project in terms of degree of risk. They can therefore act as a guide for public clients to reduce or eliminate the most urgent risk factors by implementing mitigation measures either prior to construction, with valid contractual clauses and better project preparation, and/or during construction, with the indication of red flags to monitor consistently. They can also be used as a learning tool in order to assist less experienced managers to mitigate expected delay factors early on in construction and may also serve as a framework for transfer of knowledge from past projects to future projects and from experienced project managers in road construction to novice ones.
5. Conclusions
The application of the proposed DRAMs to two hypothetical projects in Greece showed that the delay factors ‘weather conditions,’ ‘late land acquisition’, ‘utility networks’ and ‘traffic control’ are indeed the most probable and severe delay factors that should be dealt with in all cases in new road projects in Greece. The ranking of the remaining 16 delay factors depends on project-specific characteristics and is sensitive to the specific project’s vulnerability to each delay factor.
As a result, public road authorities in Greece should take actions to accelerate the land acquisition procedures prior to tender. In addition, the public client should always take care to support the contractor in all actions required to reduce conflicts with utility networks and local traffic authorities. Regarding the risk of delays due to weather conditions, it is proposed that the contractual duration should allow for an acceptable number of days for EoTs due to bad weather. It is considered feasible and allowable by public works legislation to provide contractual provisions for a reasonable number of non-workdays, as well as specific guidance on the course of action if predictions are inaccurate, as proposed by Apipattanavis et al. [46], which could potentially reduce EoT due to weather conditions. This proposal is considered mandatory because the duration of delays due to weather conditions are difficult to forecast in the design and planning phase; therefore, contractual provisions with an aim to minimize their effects need to be considered.
In summary, the first contribution of this study to the international body of knowledge is the provision of a unified delay RBS for road construction, including 97 delay factors, which amalgamates international knowledge and can form a basis for common future research. Secondly, it advances the study of road construction delay factors as it is the first that bases its risk assessment models on actual underlying delay factors that have appeared in real projects rather than from expert opinion. The DRAMs proposed can be calibrated for use in all construction industries, and if the proposed RBS is used worldwide, significant comparisons and conclusions can be made that will promote best practices in the global road construction industry.
Finally, the proposed approach can be enriched in the future by incorporating additional historical project data from other road projects under the responsibility of different public clients (Ministry of Public Works, Regional and Local Authorities) to investigate the relationship between the client’s organizational culture or managerial style and road construction delays.
Funding
This research received no external funding.
Data Availability Statement
Data are available on request with privacy restrictions. The data are not publicly available due to contractual and GDPR constraints.
Acknowledgments
The work was carried out based on the authors personal experience gained throughout her 22-year career at Egnatia Odos S.A., a large-scale client organization in the areas of engineering, design and construction. The state-of-the-art experience provided and excellent collaboration is gratefully acknowledged. The author also would like to thank all reviewers for their constructive feedback that helped improve the quality of the paper.
Conflicts of Interest
The author declares no conflict of interest.
References
- Amoatey, C.T.; Ankrah, A.N.O. Exploring critical road project delay factors in Ghana. J. Facil. Manag. 2017, 15, 110–127. [Google Scholar] [CrossRef]
- Kaliba, C.; Muya, M.; Mumba, K. Cost escalation and schedule delays in road construction projects in Zambia. Int. J. Proj. Manag. 2009, 27, 522–531. [Google Scholar] [CrossRef]
- Monastiriotis, V.; Psycharis, Y. Between equity, efficiency and redistribution: An analysis of revealed allocation criteria of regional public investment in Greece. Eur. Urban Reg. Stud. 2014, 21, 445–462. [Google Scholar] [CrossRef]
- Mahamid, I.; Bruland, A.; Dmaidi, N. Causes of delay in road construction projects. J. Manag. Eng. 2012, 28, 300–310. [Google Scholar] [CrossRef]
- Vu, H.A.; Cu, V.H.; Min, L.X.; Wang, J.Q. Risk Analysis of schedule delays in international highway projects in Vietnam using a structural equation model. Eng. Const. Arch. Manag. 2017, 24, 1018–1039. [Google Scholar] [CrossRef]
- Xenidis, Y.; Stavrakas, E. Risk Based Budgeting of Infrastructure Projects. Procedia-Social Behav. Sci. 2013, 74, 478–487. [Google Scholar] [CrossRef] [Green Version]
- Derakhshanfar, H.; Ochoa, J.J.; Kirytopoulos, K.; Mayer, W.; Tam, V.W.Y. Construction delay risk taxonomy, associations and regional contexts: A systematic review and meta-analysis. Eng. Constr. Arch. Manag. 2019, 26, 2364–2388. [Google Scholar] [CrossRef]
- Durdyev, S.; Hosseini, M.R. Causes of delays on construction projects: A comprehensive list. Int. J. Manag. Proj. Bus. 2020, 13, 20–46. [Google Scholar] [CrossRef]
- Sanni-Anibire, M.O.; Zin, R.M.; Olatunji, S.O. Causes of delay in the global construction industry: A meta-analytical review. Int. J. Constr. Manag. 2020, 1–13. [Google Scholar] [CrossRef]
- Viles, E.; Rudeli, N.C.; Santilli, A. Causes of delay in construction projects: A quantitative analysis. Eng. Constr. Arch. Manag. 2020, 27, 917–935. [Google Scholar] [CrossRef]
- Hola, B.; Schabowicz, K. Estimation of earthworks execution time cost by means of artificial neural networks. Autom. Constr. 2010, 19, 570–579. [Google Scholar] [CrossRef]
- Hosseinian, S.; Reinschmidt, K.F. Finding best model to forecast construction duration of road tunnels with New Austrian Tunneling Method using Bayesian inference: Case Study of Niayesh highway tunnel in Iran. Transp. Res. Rec. 2015, 2522, 113–120. [Google Scholar] [CrossRef]
- Long, D.L.; Ohsato, A. A genetic algorithm-based method for scheduling repetitive construction projects. Automa. Constr. 2009, 18, 499–511. [Google Scholar] [CrossRef]
- Edwards, D.J.; Owusu-Manu, D.-G.; Baiden, B.; Badu, E.; Love, P.E. Financial distress and highway infrastructure delays. Built Environ. Proj. Asset Manag. 2016, 6, 521–534. [Google Scholar] [CrossRef]
- Wang, M.T.; Chou, H.-Y. Risk allocation and risk handling of highway projects in Taiwan. J. Manag. Eng. 2003, 19, 38–60. [Google Scholar] [CrossRef]
- Molenaar, K.R. Programmatic cost risk analysis for highway megaprojects. J. Constr. Eng. Manag. 2005, 131, 343–353. [Google Scholar] [CrossRef]
- Jiang, Y.; Wu, H. A method for highway agency to estimate highway construction durations and set contract times. Int. J. Constr. Ed. Res. 2007, 3, 199–216. [Google Scholar] [CrossRef]
- Zayed, T.; Amer, M.; Pan, J. Assessing risk and uncertainty inherent in Chinese highway projects using AHP. Int. J. Proj. Manag. 2008, 26, 408–419. [Google Scholar] [CrossRef]
- Pewdum, W.; Rujirayanyong, T.; Sooksatra, V. Forecasting final budget and duration of highway construction projects. Eng. Constr. Arch. Manag. 2009, 16, 544–557. [Google Scholar] [CrossRef]
- Mahamid, I. Risk matrix for factors affecting time delay in road construction projects: Owners’ perspective. Eng. Constr. Arch. Manag. 2011, 18, 609–617. [Google Scholar] [CrossRef]
- Infran, M.; Khurshid, M.B.; Anastasopoulos, P.; Labi, S.; Moavenzadeh, F. Planning-stage estimation of highway project duration on the basis of anticipated project cost, project type, and contract type. Int. J. Proj. Manag. 2011, 29, 78–92. [Google Scholar] [CrossRef]
- Anastasopoulos, P.C.; Labi, S.; Bhargava, A.; Mannering, F.L. Empirical assessment of the likelihood and duration of highway project time delays. J. Constr. Eng. Manag. 2012, 138, 390–398. [Google Scholar] [CrossRef]
- Aziz, R.F.; Abdel-Hakam, A.A. Exploring delay causes of road construction projects in Egypt. Alex. Eng. J. 2016, 55, 1515–1539. [Google Scholar] [CrossRef] [Green Version]
- Ekanayake, E.M.K.; Perera, B.A.K.S. Appropriate delay analysis techniques to analyse delays in road construction projects in Sri Lanka. Built Environ. Proj. Asset Manag. 2016, 6, 521–534. [Google Scholar] [CrossRef]
- Glymis, E.; Kanelakis, A.; Aretoulis, G.; Mastoras, T. Predicting highway projects actual duration using neural net-works. In Proceedings of the Joint Conference on Computing in Construction (JC3), Heraklion, Greece, 4–7 July 2017; LC3 2017 Volume I. pp. 691–697. [Google Scholar]
- Waziri, B.S.; Kadai, B.; Jibrin, A.T. Functional duration models for highway construction projects in Nigeria. Pak. J. Eng. Appl. Sci. 2017, 20, 61–68. [Google Scholar]
- Titirla, M.; Aretoulis, G. Neural network models for actual duration of Greek highway projects. J. Eng. Des. Tech. 2019, 17, 1323–1339. [Google Scholar] [CrossRef]
- Mahamid, I. The development of regression models for preliminary prediction of road construction duration. Int. J. Eng. Inf. Sys. 2019, 3, 14–20. [Google Scholar]
- Ayyub, B.M. Risk Analysis in Engineering and Economics, 2nd ed.; CRC Press, Taylor and Francis Group: Boca Raton, FL, USA, 2014. [Google Scholar]
- Aminbakhsh, S.; Gunduz, M.; Sonmez, R. Safety risk assessment using analytic hierarchy process (AHP) during planning and budgeting of construction projects. J. Saf. Res. 2013, 46, 99–105. [Google Scholar] [CrossRef] [PubMed]
- Ardeshir, A.; Amiri, M.; Ghasemi, Y.; Errington, M. Risk assessment of construction projects for water conveyance tunnels using fuzzy fault tree analysis. Int. J. Civil Eng. 2014, 12, 396–412. [Google Scholar]
- Debnath, J.; Biswas, A.; Sivan, P.; Sen, K.N.; Sahu, S. Fuzzy inference model for assessing occupational risks in construction sites. Int. J. Industr. Ergon. 2016, 55, 114–128. [Google Scholar] [CrossRef]
- Jozi, S.A.; Shafiee, M.; MoradiMajd, N.; Saffarian, S. An integrated Shannon’s Entropy–TOPSIS methodology for environmental risk assessment of Helleh protected area in Iran. Environ. Monit. Assess. 2012, 184, 6913–6922. [Google Scholar] [CrossRef]
- Boran, F.E.; Genç, S.; Kurt, M.; Akay, D. A multi-criteria intuitionistic fuzzy group decision making for supplier selection with TOPSIS method. Expert Sys. Appl. 2009, 36, 11363–11368. [Google Scholar] [CrossRef]
- Yadollahi, M.; Majid, M.Z.A.; Zin, R.M. Post-Pareto optimality approach to enhance budget allocation process for bridge rehabilitation management. Struct. Infrastr. Eng. 2015, 11, 1565–1582. [Google Scholar] [CrossRef]
- Antoniou, F.; Aretoulis, G.N. A multi criteria decision making support system for choice of method of compensation for highway construction contractors in Greece. Int. J. Constr. Manag. 2018, 19, 492–508. [Google Scholar] [CrossRef]
- Liu, Z.; He, J.; Zhang, C.; Xing, L.; Zhou, B. The impact of road alignment characteristics on different types of traffic accidents. J. Transport. Saf. Sec. 2020, 12, 697–726. [Google Scholar] [CrossRef]
- Robson, C.; McCartan, K. Real World Research, 4th ed.; John Wiley and Sons: Chichester, UK, 2016. [Google Scholar]
- Antoniou, F.; Marinelli, M. Proposal for the promotion of standardization of precast beams in highway concrete bridges. Front. Built Environ. 2020, 6, 119. [Google Scholar] [CrossRef]
- Antoniou, F.; Konstantinidis, D.; Aretoulis, G.; Xenidis, Y. Preliminary construction cost estimates for motorway underpass bridges. Int. J. Constr. Manag. 2018, 18, 321–330. [Google Scholar] [CrossRef]
- Fine, W.T.; Kinney, W.D. Mathematical evaluation for controlling hazards. J. Saf. Res. 1971, 3, 157–166. [Google Scholar]
- Hwang, C.L.; Yoon, K. Multiple Attribute Decision Making: Methods and Applications; Springer: New York, NY, USA, 1981. [Google Scholar]
- Ishizaka, A.; Nemery, P. Multi-Criteria Decision Analysis Methods and Software; John Wiley and Sons: West Sussex, UK, 2013. [Google Scholar]
- Srdjevic, B.; Medeiros, Y.D.P.; Faria, A.S. An objective multi-criteria evaluation of water management scenarios. Water Res. Manag. 2004, 18, 35–54. [Google Scholar] [CrossRef]
- Holt, G.D. Asking questions, analysing answers: Relative importance revisited. Constr. Innov. 2014, 14, 2–16. [Google Scholar] [CrossRef]
- Apipattanavis, S.; Sabo, I.K.; Molenaar, K.R.; Rajagopalan, B.; Xi, Y.; Blackard, B.; Patil, S. Integrated framework for quantifying and predicting weather-related highway construction delays. J. Constr. Eng. Manag. 2010, 136, 1160–1168. [Google Scholar] [CrossRef]
Figure 1.
Pareto Diagram: contracts affected by the delay factors.

Figure 2.
Delay factor category risk breakdown structure (RBS).

Table 2.
Unified road construction delay RBS and rankings per article.
| Delay Factor | RBS Code | A | B | C | D | E | F | |
|---|---|---|---|---|---|---|---|---|
| 1 | Client’s financial difficulties | 1.1.1.01 | 3 | 25 | 1 | |||
| 2 | Delayed payments to contractors | 1.1.1.02 | 1 | 4 | 9 | 1 | ||
| 3 | Client’s bureaucratic payment processes | 1.1.1.03 | 16 | |||||
| 4 | Client’s misuse of project funds | 1.1.1.04 | 2 | 5 | ||||
| 5 | Inflexible item funding allocation by funding agencies | 1.1.1.05 | 5 | |||||
| 6 | Delay in the release of funding | 1.1.1.06 | 12 | |||||
| 7 | Withdrawal of funding because of non-compliance with requirements | 1.1.1.07 | 17 | |||||
| 8 | No objection by funding agency requirements | 1.1.1.08 | 22 | |||||
| 9 | Late land acquisition | 1.1.2.01 | 14 | 32 | 4 | |||
| 10 | Ambiguity in scope of work in contractual documents | 1.1.2.02 | 33 | |||||
| 11 | Changes in project specifications demanded by client | 1.1.2.03 | 8 | 23 | ||||
| 12 | Contract change orders demanded by client | 1.1.2.04 | 17 | 21 | 3 | |||
| 13 | Unrealistic contractual duration | 1.1.2.05 | 27 | 21 | ||||
| 14 | Client’s suspension of work | 1.1.2.06 | 16 | 18 | ||||
| 15 | Slow decision making by client or project management organization problems | 1.1.2.07 | 18 | 6 | 9 | |||
| 16 | Client’s claim management process | 1.1.2.08 | 1 | 4 | 10 | 14 | ||
| 17 | Client’s poor communication with contractor | 1.1.2.09 | 9 | |||||
| 18 | Fraudulent practices by client’s employees | 1.1.2.10 | 3 | |||||
| 19 | Client interference | 1.1.2.11 | 13 | |||||
| 20 | Mistakes in design | 1.1.3.01 | 14 | 43 | 16 | |||
| 21 | Drawing changes | 1.1.3.02 | 6 | |||||
| 22 | Technically inadequate designs | 1.1.3.03 | 3 | 50 | ||||
| 23 | Constructability problems of design | 1.1.3.04 | 8 | |||||
| 24 | Quantity calculations mistakes by consultants prior to construction | 1.1.3.05 | 11 | 14 | ||||
| 25 | Delays in providing detail design | 1.1.3.06 | 35 | |||||
| 26 | Late design approvals by client | 1.1.3.07 | 8 | 28 | 19 | |||
| 27 | Inadequate experience of consultant | 1.1.3.08 | 29 | 23 | ||||
| 28 | Poor communication by design consultant with contractor and/or client | 1.1.3.09 | 36 | |||||
| 29 | Delayed approval of materials by supervisor/inspector | 1.1.4.01 | 8 | |||||
| 30 | Late issuing of approval documents by client | 1.1.4.02 | 41 | |||||
| 31 | Poor supervision/inspection on behalf of client | 1.1.4.03 | 16 | 8 | 49 | |||
| 32 | Underqualified supervisor/inspector | 1.1.4.04 | 39 | |||||
| 33 | Contractor’s underestimation of project cost—extremely low bid | 1.2.1.01 | 19 | |||||
| 34 | Low markups/profit margins | 1.2.1.02 | 15 | |||||
| 35 | High overhead expenses | 1.2.1.03 | 12 | |||||
| 36 | Contractor’s financial difficulties | 1.2.1.04 | 5 | 13 | 18 | 6 | ||
| 37 | Insolvency/liquidity | 1.2.1.05 | 20 | |||||
| 38 | Inadequate contractor experience | 1.2.2.01 | 2 | |||||
| 39 | Contractors delay in mobilization | 1.2.2.02 | 22 | 7 | ||||
| 40 | Ineffective construction schedule and/or cost planning | 1.2.2.03 | 19 | 15 | 6 | 20 | ||
| 41 | Contractor’s work overload with many concurrent projects | 1.2.2.04 | 7 | |||||
| 42 | Poor site management by contractor | 1.2.2.05 | 8 | 34 | 15 | |||
| 43 | Inappropriate site logistics | 1.2.2.06 | 19 | |||||
| 44 | Delay in the preparation shop drawings | 1.2.2.07 | 7 | |||||
| 45 | Inefficient construction methods | 1.2.2.08 | 1 | 44 | ||||
| 46 | Rework due to defective materials | 1.2.2.09 | 4 | 8 | ||||
| 47 | Rework due to poor workmanship | 1.2.2.10 | 7 | 20 | 10 | |||
| 48 | On site accidents | 1.2.2.11 | 5 | |||||
| 49 | Poor communication by contractor with other parties | 1.2.2.12 | 11 | |||||
| 50 | Retention of technology advantage | 1.2.2.13 | 9 | |||||
| 51 | Poor resource procurement procedures | 1.2.3.01 | 6 | 31 | ||||
| 52 | Unavailability of necessary equipment or machinery | 1.2.3.02 | 13 | 8 | 5 | |||
| 53 | Inefficient equipment or machinery | 1.2.3.03 | 12 | |||||
| 54 | Material procurement delays | 1.2.3.04 | 15 | |||||
| 55 | Shortage in construction materials | 1.2.3.05 | 37 | |||||
| 56 | Low productivity of workers | 1.2.3.06 | 7 | |||||
| 57 | Unavailability ofskilled equipment or machinery operators | 1.2.3.07 | 14 | |||||
| 58 | Unavailability of sufficiently skilled workers | 1.2.3.08 | 6 | 17 | ||||
| 59 | Poor qualifications of the contractor’s engineers | 1.2.3.09 | 30 | |||||
| 60 | Personal conflicts between laborers and management | 1.2.3.10 | 14 | 40 | ||||
| 61 | Labor disputes and/or strikes | 1.2.3.11 | 18 | 8 | 38 | |||
| 62 | Delays in sub-contractors work | 1.2.3.12 | 11 | |||||
| 63 | Change in national project approval and license procedures | 2.1.01 | 2 | |||||
| 64 | Lengthy project environmental approval procedure | 2.1.02 | 1 | |||||
| 65 | Controversial environmental impacts that block approval procedures | 2.1.03 | 4 | |||||
| 66 | Change in national design codes and specifications | 2.1.04 | 16 | |||||
| 67 | Land acquisition compensation changes | 2.1.05 | 5 | |||||
| 68 | Public works contracts claim settlement procedures | 2.1.06 | 9 | |||||
| 69 | Politics | 2.1.07 | 1 | |||||
| 70 | Unique political situation | 2.1.08 | 2 | |||||
| 71 | Construction contract bidding policy disadvantages | 2.1.09 | 3 | |||||
| 72 | Tax policy changes | 2.1.10 | 2 | |||||
| 73 | Inflation | 2.2.01 | 17 | |||||
| 74 | Changes in exchange rates | 2.2.02 | 26 | |||||
| 75 | Changes in interest rates | 2.2.03 | 48 | 13 | ||||
| 76 | High project insurance costs | 2.2.04 | 8 | |||||
| 77 | Reluctance by banks to provide loans | 2.2.05 | 10 | |||||
| 78 | Construction sector market conditions (e.g., monopoly) | 2.2.06 | 7 | 51 | ||||
| 79 | Capital controls due to national fiscal crisis | 2.2.07 | 3 | |||||
| 80 | Conflicts with utility networks | 2.3.01 | 8 | |||||
| 81 | Conflicts with other transport networks | 2.3.02 | 6 | |||||
| 82 | Delays due to conflicts with third parties (e.g., other contractors in area) | 2.3.03 | 12 | |||||
| 83 | Conflicts with public activities | 2.3.04 | 18 | |||||
| 84 | Demands from local authorities for improvements to local roads, etc. | 2.3.05 | 20 | |||||
| 85 | Inaccurate traffic forecasts during construction | 2.3.06 | 8 | |||||
| 86 | Constraints on work window (tourism, rush hour) | 2.3.07 | 12 | |||||
| 87 | Construction of temporary auxiliary lanes | 2.3.08 | 12 | |||||
| 88 | Inadequate areas for construction access due to increased traffic and/ or delays in work permits issuance by local traffic control division | 2.3.09 | 20 | |||||
| 89 | Delay in forest authority permits | 2.3.10 | ||||||
| 90 | Weather conditions | 2.4.01 | 1 | 42 | ||||
| 91 | Unforeseen ground conditions | 2.4.02 | 20 | 18 | 45 | |||
| 92 | Natural Disasters | 2.4.04 | 15 | 52 | ||||
| 93 | Damage to project | 2.4.05 | 9 | |||||
| 94 | Site access problems | 2.4.06 | 24 | |||||
| 95 | Complicated environmental protection works during construction | 2.4.07 | 17 | |||||
| 96 | Antiquities | 2.4.08 | ||||||
| 97 | Other risks | 2.4.09 | 8 |
Table 3.
Top five delay factors as found in road construction management literature.
| RANK | Molenaar [16] USA | Zayed et al. [18] China | Kaliba et al. [2] Zambia | Mahamid et al. [4] Palestine | Edwards et al. [14] Ghana | Amotaye & Ankrah [1] Ghana |
|---|---|---|---|---|---|---|
| 1 | 2.1.02 Environmental approval procedure | 1.1.2.08 Claim management process | 1.1.1.02 Delayed payments | 2.1.07 Politics | 1.1.1.01 Client’s financial difficulties | 1.1.1.02 Delayed payments |
| 2 | 2.1.01 Change in license procedures | 1.2.2.08 Inefficient construction methods | 1.1.1.04 Misuse of funds | 2.1.08 Unique political situation | 2.1.10 Tax policy changes | 1.2.2.01 Inadequate contractor experience |
| 3 | 1.1.3.03 Inadequate designs | 2.4.01 Weather conditions | 1.1.1.01 Client’s financial difficulties | 2.1.09 Bidding policy | 1.1.2.10 Fraudulent practices | 1.1.2.04 Change orders |
| 4 | 2.1.03 Controversial environmental impacts | 1.2.2.09 Rework due to defective materials | 1.1.2.08 Claim management process | 1.1.1.02 Delayed payments | 2.2.07 Capital controls | 1.1.2.01 Late land acquisition |
| 5 | 2.1.05 Land acquisition compensation changes | 1.2.2.11 On site accidents | 1.2.1.04 Contractor’s financial difficulties | 1.2.3.02 Unavailability of machinery | 1.1.1.04 Misuse of funds | 1.1.1.05 Inflexible item funding allocation agencies |
Table 4.
Ranking of EOSA delay factors according to frequency in comparison to literature.
| Delay Factor | RBS Code | EOSA | A | B | C | D | E | F |
|---|---|---|---|---|---|---|---|---|
| Weather conditions | 2.4.01 | 1 | 1 | 42 | ||||
| Late land acquisition | 1.1.2.01 | 2 | 14 | 32 | 4 | |||
| Utility networks | 2.3.01 | 3 | 8 | |||||
| Traffic control | 2.3.09 | 4 | 20 | |||||
| Change orders | 1.1.2.04 | 5 | 17 | 21 | 3 | |||
| Drawing changes | 1.1.3.02 | 6 | 6 | |||||
| Unforeseen ground conditions | 2.4.02 | 6 | 20 | 18 | 45 | |||
| Late design approvals | 1.1.3.07 | 8 | 8 | 28 | 19 | |||
| Third parties | 2.3.03 | 8 | 12 | |||||
| Other risks | 2.4.09 | 10 | 8 | |||||
| Public activities | 2.3.04 | 11 | 18 | |||||
| Labor disputes | 1.2.3.11 | 12 | 18 | 8 | 38 | |||
| Material procurement delays | 1.2.3.04 | 13 | 15 | |||||
| Forest authority | 2.3.10 | 13 | ||||||
| Insolvency/liquidity | 1.2.1.05 | 15 | 20 | |||||
| Work window | 2.3.07 | 16 | 12 | |||||
| Contractor’s financial difficulties | 1.2.1.04 | 17 | 5 | 13 | 18 | 6 | ||
| Environmental approval procedure | 2.1.02 | 17 | 1 | |||||
| Antiquities | 2.4.08 | 17 | ||||||
| Site access problems | 2.4.06 | 20 | 24 |
Table 5.
Delay factor rankings per risk assessment method and scenario.
| Scenario 1 | Scenario 2 | ||||||||||
|---|---|---|---|---|---|---|---|---|---|---|---|
| Name | RBS Code | (P) | (S) | (V) | RV | RPN | TOPSIS 1 | (V) | RPN | TOPSIS 1 | TOPSIS 2 |
| Weather conditions | 2.4.01 | 0.450 | 0.275 | 3 | 1 | 1 | 1 | 1 | 1 | 1 | 1 |
| Late land acquisition | 1.1.2.01 | 0.242 | 0.165 | 3 | 2 | 2 | 2 | 3 | 2 | 2 | 2 |
| Utility networks | 2.3.01 | 0.200 | 0.131 | 3 | 3 | 3 | 3 | 1 | 5 | 3 | 3 |
| Traffic control | 2.3.09 | 0.183 | 0.123 | 3 | 4 | 4 | 4 | 1 | 6 | 4 | 5 |
| Change orders | 1.1.2.04 | 0.133 | 0.094 | 3 | 5 | 5 | 5 | 3 | 3 | 5 | 4 |
| Drawing changes | 1.1.3.02 | 0.108 | 0.088 | 3 | 6 | 6 | 6 | 3 | 4 | 6 | 6 |
| Third parties | 2.3.03 | 0.108 | 0.063 | 3 | 7 | 7 | 8 | 1 | 7 | 9 | 12 |
| Unforeseen ground conditions | 2.4.02 | 0.092 | 0.073 | 3 | 8 | 8 | 7 | 3 | 9 | 7 | 7 |
| Other risks | 2.4.09 | 0.092 | 0.067 | 3 | 9 | 9 | 9 | 1 | 8 | 10 | 13 |
| Late design approvals | 1.1.3.07 | 0.083 | 0.067 | 3 | 10 | 10 | 10 | 3 | 10 | 8 | 8 |
| Public activities | 2.3.04 | 0.075 | 0.058 | 3 | 11 | 11 | 11 | 1 | 12 | 14 | 15 |
| Labor disputes | 1.2.3.11 | 0.050 | 0.033 | 3 | 12 | 12 | 13 | 2 | 14 | 15 | 14 |
| Material procurement delays | 1.2.3.04 | 0.042 | 0.035 | 3 | 13 | 13 | 14 | 3 | 11 | 12 | 10 |
| Forest authority | 2.3.10 | 0.042 | 0.033 | 3 | 14 | 14 | 15 | 3 | 13 | 13 | 11 |
| Insolvency/liquidity | 1.2.1.05 | 0.033 | 0.025 | 3 | 15 | 15 | 16 | 1 | 15 | 19 | 19 |
| Work window | 2.3.07 | 0.025 | 0.017 | 3 | 16 | 16 | 17 | 1 | 18 | 20 | 20 |
| Environmental approval procedure | 2.1.02 | 0.017 | 0.017 | 3 | 17 | 17 | 18 | 2 | 16 | 16 | 16 |
| Contractor’s financial difficulties | 1.2.1.04 | 0.017 | 0.010 | 3 | 18 | 18 | 19 | 2 | 19 | 17 | 17 |
| Site access problems | 2.4.06 | 0.083 | 0.002 | 3 | 18 | 18 | 12 | 3 | 17 | 11 | 9 |
| Antiquities | 2.4.08 | 0.017 | 0.006 | 3 | 20 | 20 | 20 | 2 | 20 | 18 | 18 |
TOPSIS 1 = (Shannon Entropy weights, wp = ws = 0.34, wv = 0.32), TOPSIS 2 = (wp = ws = 0.25, wv = 0.5).
Publisher’s Note: MDPI stays neutral with regard to jurisdictional claims in published maps and institutional affiliations. |
© 2021 by the author. Licensee MDPI, Basel, Switzerland. This article is an open access article distributed under the terms and conditions of the Creative Commons Attribution (CC BY) license (https://creativecommons.org/licenses/by/4.0/).
Share and Cite
MDPI and ACS Style
Antoniou, F. Delay Risk Assessment Models for Road Projects. Systems 2021, 9, 70. https://0-doi-org.brum.beds.ac.uk/10.3390/systems9030070
AMA Style
Antoniou F. Delay Risk Assessment Models for Road Projects. Systems. 2021; 9(3):70. https://0-doi-org.brum.beds.ac.uk/10.3390/systems9030070
Chicago/Turabian StyleAntoniou, Fani. 2021. "Delay Risk Assessment Models for Road Projects" Systems 9, no. 3: 70. https://0-doi-org.brum.beds.ac.uk/10.3390/systems9030070
Note that from the first issue of 2016, this journal uses article numbers instead of page numbers. See further details here.