Article

Low-Complexity Run-time Management of Concurrent Workloads for Energy-Efficient Multi-Core Systems †

1
School of Engineering, Al-Mustansiriyah University, Baghdad 10052, Iraq
2
School of Engineering, Newcastle University, Newcastle NE1 7RU, UK
3
School of Computing, Newcastle University, Newcastle NE1 7RU, UK
*
Author to whom correspondence should be addressed.
This paper is an extended version of our paper published in PATMOS, A. Aalsaud, A. Rafiev, F. Xia, R. Shafik and A. Yakovlev, “Model-Free Run-time Management of Concurrent Workloads for Energy-Efficient multi-core Heterogeneous Systems.” In Proceedings of the 2018 28th International Symposium on Power and Timing Modeling, Optimization and Simulation (PATMOS), Platja d’Aro, 2018; pp. 206–213, doi:10.1109/PATMOS.2018.8464142.
J. Low Power Electron. Appl. 2020, 10(3), 25; https://0-doi-org.brum.beds.ac.uk/10.3390/jlpea10030025
Submission received: 30 June 2020 / Revised: 30 July 2020 / Accepted: 10 August 2020 / Published: 25 August 2020

Abstract

:
Contemporary embedded systems may execute multiple applications, potentially concurrently on heterogeneous platforms, with different system workloads (CPU- or memory-intensive or both) leading to different power signatures. This makes finding the most energy-efficient system configuration for each type of workload scenario extremely challenging. This paper proposes a novel run-time optimization approach aiming for maximum power normalized performance under such circumstances. Based on experimenting with PARSEC applications on an Odroid XU-3 and Intel Core i7 platforms, we model power normalized performance (in terms of instruction per second (IPS)/Watt) through multivariate linear regression (MLR). We derive run-time control methods to exploit the models in different ways, trading off optimization results with control overheads. We demonstrate low-cost and low-complexity run-time algorithms that continuously adapt system configuration to improve the IPS/Watt by up to 139% compared to existing approaches.

1. Introduction

Modern computing continues to evolve with increasing complexity in both hardware and software. More applications of different types are concurrently executed on platforms featuring an increasing number and type of parallel computing resources (cores) [1,2]. The advantages are clear, as parallel computing can help delay the potential saturation of Moore’s Law and better use the performance and energy efficiency opportunities provided by technology scaling [3,4]. However, managing resources in this complex space for energy efficiency is proving highly challenging, especially when different application scenarios (single or concurrent) need to be taken into account [5,6].
Contemporary processors, such as those from Arm and Intel, feature dynamic voltage frequency scaling (DVFS) as a means of handling the energy and performance trade-off [7,8]. Power governors enable DVFS at the system software level. For instance, Linux includes different power governors that can be activated based on the system requirements. These include powersave for low-power, low-performance mode, ondemand for performance-sensitive DVFS, performance for higher performance, and userspace for user-specified DVFS. These governors attempt to suitably tune the voltage/frequency pairs according to performance and energy requirements and workload variations. The voltage/frequency can be tuned to just satisfy the performance requirements according to the workload, but not more, in order to reduce energy consumption.
Performance requirements continue to increase, making DVFS alone less effective [9]. As a result, DVFS is often coupled with task mapping (TM), which distributes workloads among multiple cores [10]. When satisfying the same performance requirement, using more cores means that each core has a lighter load and aggressive DVFS can be applied to reduce the overall energy consumption. On the other hand, in order to achieve such energy efficiency, it is crucial to understand the synergy between hardware and software [11].
Core allocations to threads (TM) are usually handled by a scheduler, instead of the governor which takes care of DVFS [12]. A typical Linux scheduler does load balancing, i.e., it distributes the overall workload at any time across all available cores to achieve maximum utilization. Although this objective is rational the implementation tends to be crude. For instance, there is usually no discrimination about the type of task or thread being scheduled, such as CPU- or memory-intensive [12]. Given particular performance requirements, different types of threads should be treated differently for performance and energy optimization. Indiscriminate treatment may lead to sub-optimal energy efficiency [13].
A number of approaches have been reported on the research of using DVFS and TM synergistically for energy-efficient multi-core computing [13]. These approaches broadly fit into two types: offline (OL) and run-time (RT). In OL approaches, the system is extensively reasoned to derive energy and performance models [13,14], which lead to run-time decisions based on these models which stay constant. In RT approaches, the models are typically learned using monitored information [15,16]. Since RT modeling is costly in terms of resources, often a combination of OL and RT are used [13].
Section 2 provides a brief review of these approaches. A recurring scheme in these approaches is that the focus is primarily on single-application workloads in isolation. However, the same application can exhibit different energy/performance trade-offs depending on whether it is running alone or concurrently with other different workloads. This is because: (a) a workload application may switch between memory- and CPU-intensive routines, and (b) architectural sharing between applications affect the energy/performance trade-offs (see Section 7.1.2). Table 1 summarizes the features and limitations of existing approaches.
Tackling energy efficiency in concurrent applications considering the workload behavior changes highlighted above is non-trivial. When mapping onto heterogeneous multi-core systems, this becomes more challenging because the state space is large and each application requires different optimization. The hardware state space of a multi-core heterogeneous system includes all possible core allocations and DVFS combinations. Here, we discuss this using the scenario of multiple parallel applications running on one of the example experimental platforms used in this paper, the Odroid XU3 (detailed in Section 4.2), which has two types of CPU cores, A7 and A15, organized into two DFVS domains, as motivational examples. Here, N a p p s is the total number of concurrent applications running on the system; N A 7 is the number of A7 cores used and N A 15 is the number of A15 cores used. Table 2 shows the number of possible core allocations for a total N a p p s number of applications running on the Odroid with N A 7 = 3 and N A 15 = 4. The “brute force” value represents ( N A 7 + 1 ) N a p p s · ( N A 15 + 1 ) N a p p s combinations, not all of which are actually allowed considering the following rules: (1) each application must have at least one thread; and (2) no more than one thread per core is allowed. However, there is no simple algorithm to iterate through only valid core allocations and an explosion of the search state space is inevitable. The number of possible core allocations is then multiplied by the number of DVFS combinations, which is calculated as M A 7 · M A 15 , where M A 7 is the number of DVFS points in the A7 domain, and M A 15 is the number of DVFS points in the A15 domain.
In this work, we addressed these limitations with an adaptive approach, which monitors application scenarios at RT. The aim was to determine the optimal system configuration such that the power normalized performance can be maximized at all times. The approach is based on profiling single and concurrent applications through power and performance measurements. For the first time, our study reveals the impact of parallelism in different types of heterogeneous cores on performance, power consumption, and power efficiency in terms of instruction per second (IPS) per unit power (i.e., IPS/Watt) [20]. In our proposed approach, we make the following specific contributions:
  • using empirical observations and CPU performance counters, derive RT workload classification thresholds;
  • based on the workload classification and multivariate linear regression (MLR) to model power and performance trade-offs expressed as instructions per second (IPS) per Watt (IPS/Watt), propose a low-complexity approach for synergistic controls of DVFS and TM;
  • using synthetic and real-world benchmark applications with different concurrent combinations, investigate the approach’s energy efficiency, measured by power-normalized performance in IPS/Watt, and implement the low-complexity approach as a Linux power governor and validate through extensive experimentation with significant IPS/Watt improvements.
To the best of our knowledge, this is the first RT optimization approach for concurrent applications based on workload classification, refined further with MLR-based modeling, practically implemented and demonstrated on both heterogeneous and homogeneous multi-core systems. The rest of the paper is organized as follows. Section 2 reviews the existing approaches. The proposed system approach is described in Section 3. Section 4 shows the configuration of systems used in the experiments and the applications. Workload classification techniques are described in Section 5, where Section 5.2 details the run-time implementations. Section 6 deals with combining workload classification with multivariant linear regression, with the decision space of the latter significantly reduced by the former. Section 7 discusses the experimental results, and, finally, Section 8 concludes the paper.

2. Related Work

Energy efficiency of multi-core systems has been studied extensively over the years. A power control approach for multi-core processors executing single application has been proposed in Reference [21]. This approach has three layers of design features also shown by other researchers: firstly, adjusting the clock frequency of the chip depending on the power budget; secondly, dynamically group cores to run the same applications (as also shown in Reference [22,23]), and finally, modifying the frequency of each core group (as also shown in Reference [11,24]). Among others, Goraczko et al. [17] and Luo et al. [18] proposed DVFS approaches with software task partitioning and mapping of single applications using a linear programming (LP) based optimization during RT to minimize the power consumption. Goh et al. [25] proposed a similar approach of task mapping and scheduling for single applications described by synthetic task graphs.
Several other works have also shown power minimization approaches using practical implementation of their approaches on heterogeneous platforms. For example, Sheng et al. [19] presented an adaptive power minimization approach using RT linear regression-based modeling of the power and performance trade-offs. Using the model, the task mapping and DVFS are suitably chosen to meet the specified performance requirements. Nabina and Nunez-Yanez [15] presented another DVFS approach for field-programmable gate array (FPGA)-based video motion compensation engines using RT measurements of the underlying hardware.
A number of studies have also shown analytical studies using simulation tools, like gem5, together with McPAT [14,26], for single applications. These works have used DVFS, task mapping, and offline optimization approaches to minimize the power consumption for varying workloads.
Over the years substantial research has been carried out addressing RT energy minimization and/or performance improvement approaches. These approaches have considered a single-metric based optimization: primarily performance-constrained power minimization, or performance improvement within a power budget [27]. For example, Shafik et al. proposed an RT DVFS control approach for power minimization of multiprocessor embedded systems [28]. Their approach uses performance and user experience constraints to derive the lowest possible operating voltage/frequency points through reinforcement learning and transfer principles. Das et al. presented another power minimization approach that models RT workload characterization to continually update the DVFS and core allocations through multinomial logic regression based predictive controls [29].
An RT classification of workloads and corresponding DVFS controls based on similar principles is proposed by Wang and Pedram for performance-constrained power minimization [16]. As far as performance optimization within a power budget is concerned, Chen and Marculescu proposed a distributed reinforcement learning algorithm to model power and performance trade-offs during RT [30]. Using this model, the DVFS and core allocations are adapted dynamically using feedback from the performance counters. Another power-limited performance optimization approach is presented by Cochran et al. showing programming model based power budget annotations and corresponding controls [31]. Based on application requirements, Nabina and Nunez-Yanez [15] presented a DVFS approach for FPGA-based video motion compensation engines. Santanue et al. [32] and Tiago et al. [33] suggested a smart load balancing technique to improve energy efficiency for single applications running on heterogeneous systems. This technique depends on the sense-predict-balance process through the variation of workload and performance/power trade-offs.
Gem5 with McPAT have been used to demonstrate four different core types, where each core operated in a fixed frequency. Petrucci et al. [14] proposed a thread scheduling algorithm called (lucky), which is based on lottary scheduling. This algorithm is implemented by using Linux 2.6.34 kernel with performance monitor to optimize the thread-to-core affinity. Matthew et al. [34] proposed a DVFS approach with different core allocated for controlling concurrent applications exercised on homogeneous systems at RT.
Numerous studies have focused on using classification-based techniques in dynamic power management with DVFS together at run-time [9,31,35,36,37,38,39]. For instance, Gupta et al. [9] proposed a new run-time approach based on workload classification. To build this classifier extensive offline experiments are made on heterogeneous many core platforms and MATLAB is used to determine the classifier parameters offline. Pareto function is used to determine the optimal configuration. However, this classification is heavily based on offline analysis results and assigns an application a fixed type, regardless of its operating context. It also requires the annotation of applications by application programmers through using a special API.
Dey et al. [40] suggested a new management technique for a power and thermal efficiency agent for mobile MPSoC platforms based on reinforcement learning. Fundamental to this approach is the use of software agent to explore the DVFS in mobile CPU and GPU based on user’s interaction behavior. This approach has been validated on Galaxy Note 9 smartphone utilizing Exynos 9810. The experimental results show that this new management technique can increase performance while reducing temperature and power consumption.
A model-free RT workload classification (WLC) approach with corresponding DVFS controls is proposed by Wang and Pedram [16]. This approach employs reinforcement learning, with the action space size a big concern for the authors, even though for only homogeneous systems at much higher granularity than CPU cores. WLC has also been used OL, but this produces a fixed class for each application [13] and cannot deal with workload behavior changes during execution.
For a comprehensive survey on the wider related field of energy management in energy-critical systems, see Reference [41]. This paper is based on our previous work published in PATMOS 2018 [42], with substantial extensions.

3. Proposed Methodology

Our method studies concurrent application workloads being executed on various hardware platforms with parallel processing facilities, and we attempt RT management decision optimization from the results of this analysis.
The RT management (RTM) decisions consist of TM and DVFS, which influence system performance and power dissipation [11]. The RTM takes as input information derived from system monitors, including hardware performance counters and power monitors, available from modern multi-core hardware platforms. Based on this information, the RTM algorithms attempt to increase power normalized performance by tuning the TM and DVFS outputs. The general architecture of this system view is shown in Figure 1. We develop a simple RTM algorithm based on workload classification (WLC), which classifies each workload by its usage of CPU and memory (Section 5). This minimal-cost algorithm may be used on its own or be optionally augmented and refined with an MLR procedure to further optimize the power normalized performance of the execution at an additional cost (Section 6). The WLC procedure significantly reduces the decision space of any additional MLR step making the total overhead much lower than implementing the entire optimization process purely with MLR [6] (Section 7).

4. System Fundamentals

In this section, we describe the platforms, workload applications, and performance counters used in this investigation. We study a homogeneous and a heterogeneous parallel processing platform, which both provide all the performance counters and power monitors we need for the methodology. We chose standard benchmark application workloads, which provide a variety of degrees of concurrency and memory access and CPU usage scenarios. The two hardware platforms, PARSEC workload applications, and performance counters are further detailed below.

4.1. Homogeneous System

The homogeneous experimental platform is a PC based on an Intel Core i7 Sandybridge CPU which contains no on-chip GPU facility. This CPU is chosen because it has a reasonable number of hard (4) and soft (8) cores, has no on-chip GPU to complicate the power consumption and communications, and has a relatively large number of possible operating frequencies and voltages. The operating system is Ubuntu Linux.
Run-time power monitoring is developed for the experimental platform for validation purposes. This is done by inserting a precision shunt resister into the earth side of the power connection to the CPU. As high-precision current meters tend to have a 1A upper limit, which many CPU operations will exceed, the shunt resister allows the inference of current via measuring voltage.
The performance and power utility Likwid [43] is used to obtain the majority of the experimental data. Likwid makes use of on-chip performance counters (sensors) in Intel CPUs to collect performance and power data. For instance, the Running Average Power Limit (RAPL [44]) counters are accessed to infer power dissipation. The form factor of the platform allows the actual measurement of CPU power by way of an inserted shunt resister into the CPU power supply circuit, and readings from these measurements were used in initial experiments to build confidence on the RAPL readings.
Before the main experiments, Likwid was first confirmed to be accurate for the experimental platform through cross-validation with physical power measurements using the shunt resister, described above. The use of performance counters rather than external power measurement in most of the experiments is motivated by the desire of developing an RTM, which, for practicality and wide applicability, can only rely on built-in sensors and not shunt resisters.

4.2. Heterogeneous System

The popularity of heterogeneous architectures, containing two or more types of different CPU cores, continues to grow [45]. These systems offer better performance and power trade-off flexibility; however, it may be more complicated to ensure optimal energy consumption. The Odroid-XU3 board supports techniques, such as DVFS, affinity, and core disabling, commonly used to optimize system operation in terms of performance and energy consumption [46,47].
The Odroid-XU3 board is a small eight-core computing device implemented on energy-efficient hardware. The board can run Ubuntu 14.04 or Android 4.4 operating systems. The main component of Odroid-XU3 is the 28nm System-on-Chip (Soc) Exynos 5422. This SoC is based on the ARM big.LITTLE heterogeneous architecture and consists of a high performance Cortex-A15 quad core processor block, a low power Cortex-A7 quad core block, Mali-T628 MP6 GPU cluster, and 2GB DRAM LPDDR3. The board contains four real time current sensors that give the possibility of power measurement on the four separate power domains: big (A15) CPUs, LITTLE (A7) CPUs, GPU cluster, and DRAM. In addition, there are also four temperature sensors for each of the A15 CPUs and one sensor for the GPU cluster. This work only concerns the CPU blocks, and the other parts of the SoC may be investigated in future work.
On the Odroid-XU3, for each CPU power domain, the supply voltage (Vdd) and clock frequency can be tuned through a number of pre-set pairs of values. The performance-oriented Cortex-A15 block has a range of frequencies between 200 MHz and 2000 MHz with a 100 MHz step, whilst the low-power Cortex-A7 quad core block can scale its frequencies between 200 MHz and 1400 MHz with a 100 MHz step.

4.3. Workload Applications

The PARSEC [48] benchmark suite attempts to represent both current and emerging workloads for multiprocessing hardware. It is a commonly used benchmark suite for evaluating concurrency and parallel processing. We therefore use PARSEC on the Odroid-XU3 platform, in which heterogeneity can be representative of different design choices that can greatly affect workloads. PARSEC applications exhibit different memory behaviors, different data sharing patterns, and different workload partitions from most other benchmark suites in common use. The characteristics of applications, according to Reference [48], which are used in this paper can be seen in Table 3.
Whilst we experimented with all PARSEC applications at various stages of work, six applications from the suite are selected for presentation in the paper to represent CPU-intensive, memory-intensive, and a combination of both. Such a classification reduces the effort of model characterization for combinations of concurrently running applications (Section 5). We found no surprises worth reporting in the accumulated experimental data with regard to the other PARSEC applications.

4.4. Performance Counters

In this work, we use performance counters to monitor system performance events (e.g., cache misses, cycles, instruction retired) and, at the same time, capture the voltage, current, power, and temperature directly from the sensors of Odroid-XU3. For the Intel Core i7, real power measurements with a shunt resister were used to establish confidence in the RAPL power counters initially, whilst the majority of experiments are based on performance counter readings once the confidence has been achieved. The performance counter consists of two modules: kernel module and a user space module.
For the Odroid, the hardware performance counter readings are obtained using the method presented by Walker et al. [49], with similar facilities used through Likwid for the Core i7.
Here, we describe the Odroid case in more detail. In the user space module, the event specification is the means to provide details of how each hardware performance counter should be set up. Table 4 lists notable performance events, some of which are explained as follows:
  • INST_RETIRED is the retired instruction executed and is part of the highly reported instruction per cycles (IPC) metric.
  • Cycles is the number of core clock cycles.
  • MEM_ACCESS is Memory Read or Write operation that causes a cache access to at least the level of data.
  • L1I_CACHE is level 1 instruction cache access.

5. Workload Classification RTM

This section makes use of both heterogeneous and homogeneous systems in its investigations but mainly concentrates on the heterogeneous Odroid XU3 in its discourse, unless otherwise noted. Different types of cores are especially useful for demonstrating the advantages of the approach.

5.1. Workload Classification Taxonomy

The taxonomy of workload classes chosen for this work reflects differentiation between CPU-intensive and memory-intensive workloads, with high- or low-activity. Specifically, workloads are classified into the following four classes:
  • Class 0: low-activity workloads;
  • Class 1: CPU-intensive workloads;
  • Class 2: CPU- and memory-intensive workloads; and
  • Class 3: memory-intensive workloads.
Extensive exploratory experiments are run in this work to investigate the validity of these general concepts.
The experiments are based on our synthetic benchmark, called mthreads [50], which attempts to controllably re-create the effect of memory bottleneck on parallel execution. The tool accomplishes this by repeatedly mixing CPU-intensive and memory-intensive operations, the ratio of each type is controlled by the parameter M. The CPU-intensive operation is a simple integer calculation. The memory-intensive operation is implemented by randomly writing to a 64 MB pre-allocated array. The randomization helps reduce the effect of caching. Parameter M = 0 gives CPU-intensive execution, M = 1 leads to memory-intensive execution; the values in between provide a linear relation to the number of memory accesses per instruction. The execution is split into N identical parallel threads, each pinned to a specific core. Figure 2 presents the flowchart of the tool.
Figure 3 shows the energy efficiency of mthreads running on 2 to 4 A7 cores (one of the A7 cores may have a heavy operating system presence—if C0 is turned off, the operating system stops; hence, this data does not include the single core case, which would be skewed by this system behavior) with M values ranging from 0 to 1. It can be seen that it is better to use fewer cores for memory-intensive tasks (larger M), but it is better to run more cores in parallel for CPU-intensive tasks (smaller M). Characterization results sweeping through the frequency ranges and core combinations with mthreads confirm the validity of the classification taxonomy and establish a TM and DVFS strategy based on relative CPU and memory use rates. The full set of mthreads data, supported by experiments with applications other than mthreads including the entire PARSEC suite, is used to generate our run-time management (RTM) presented in subsequent sections.

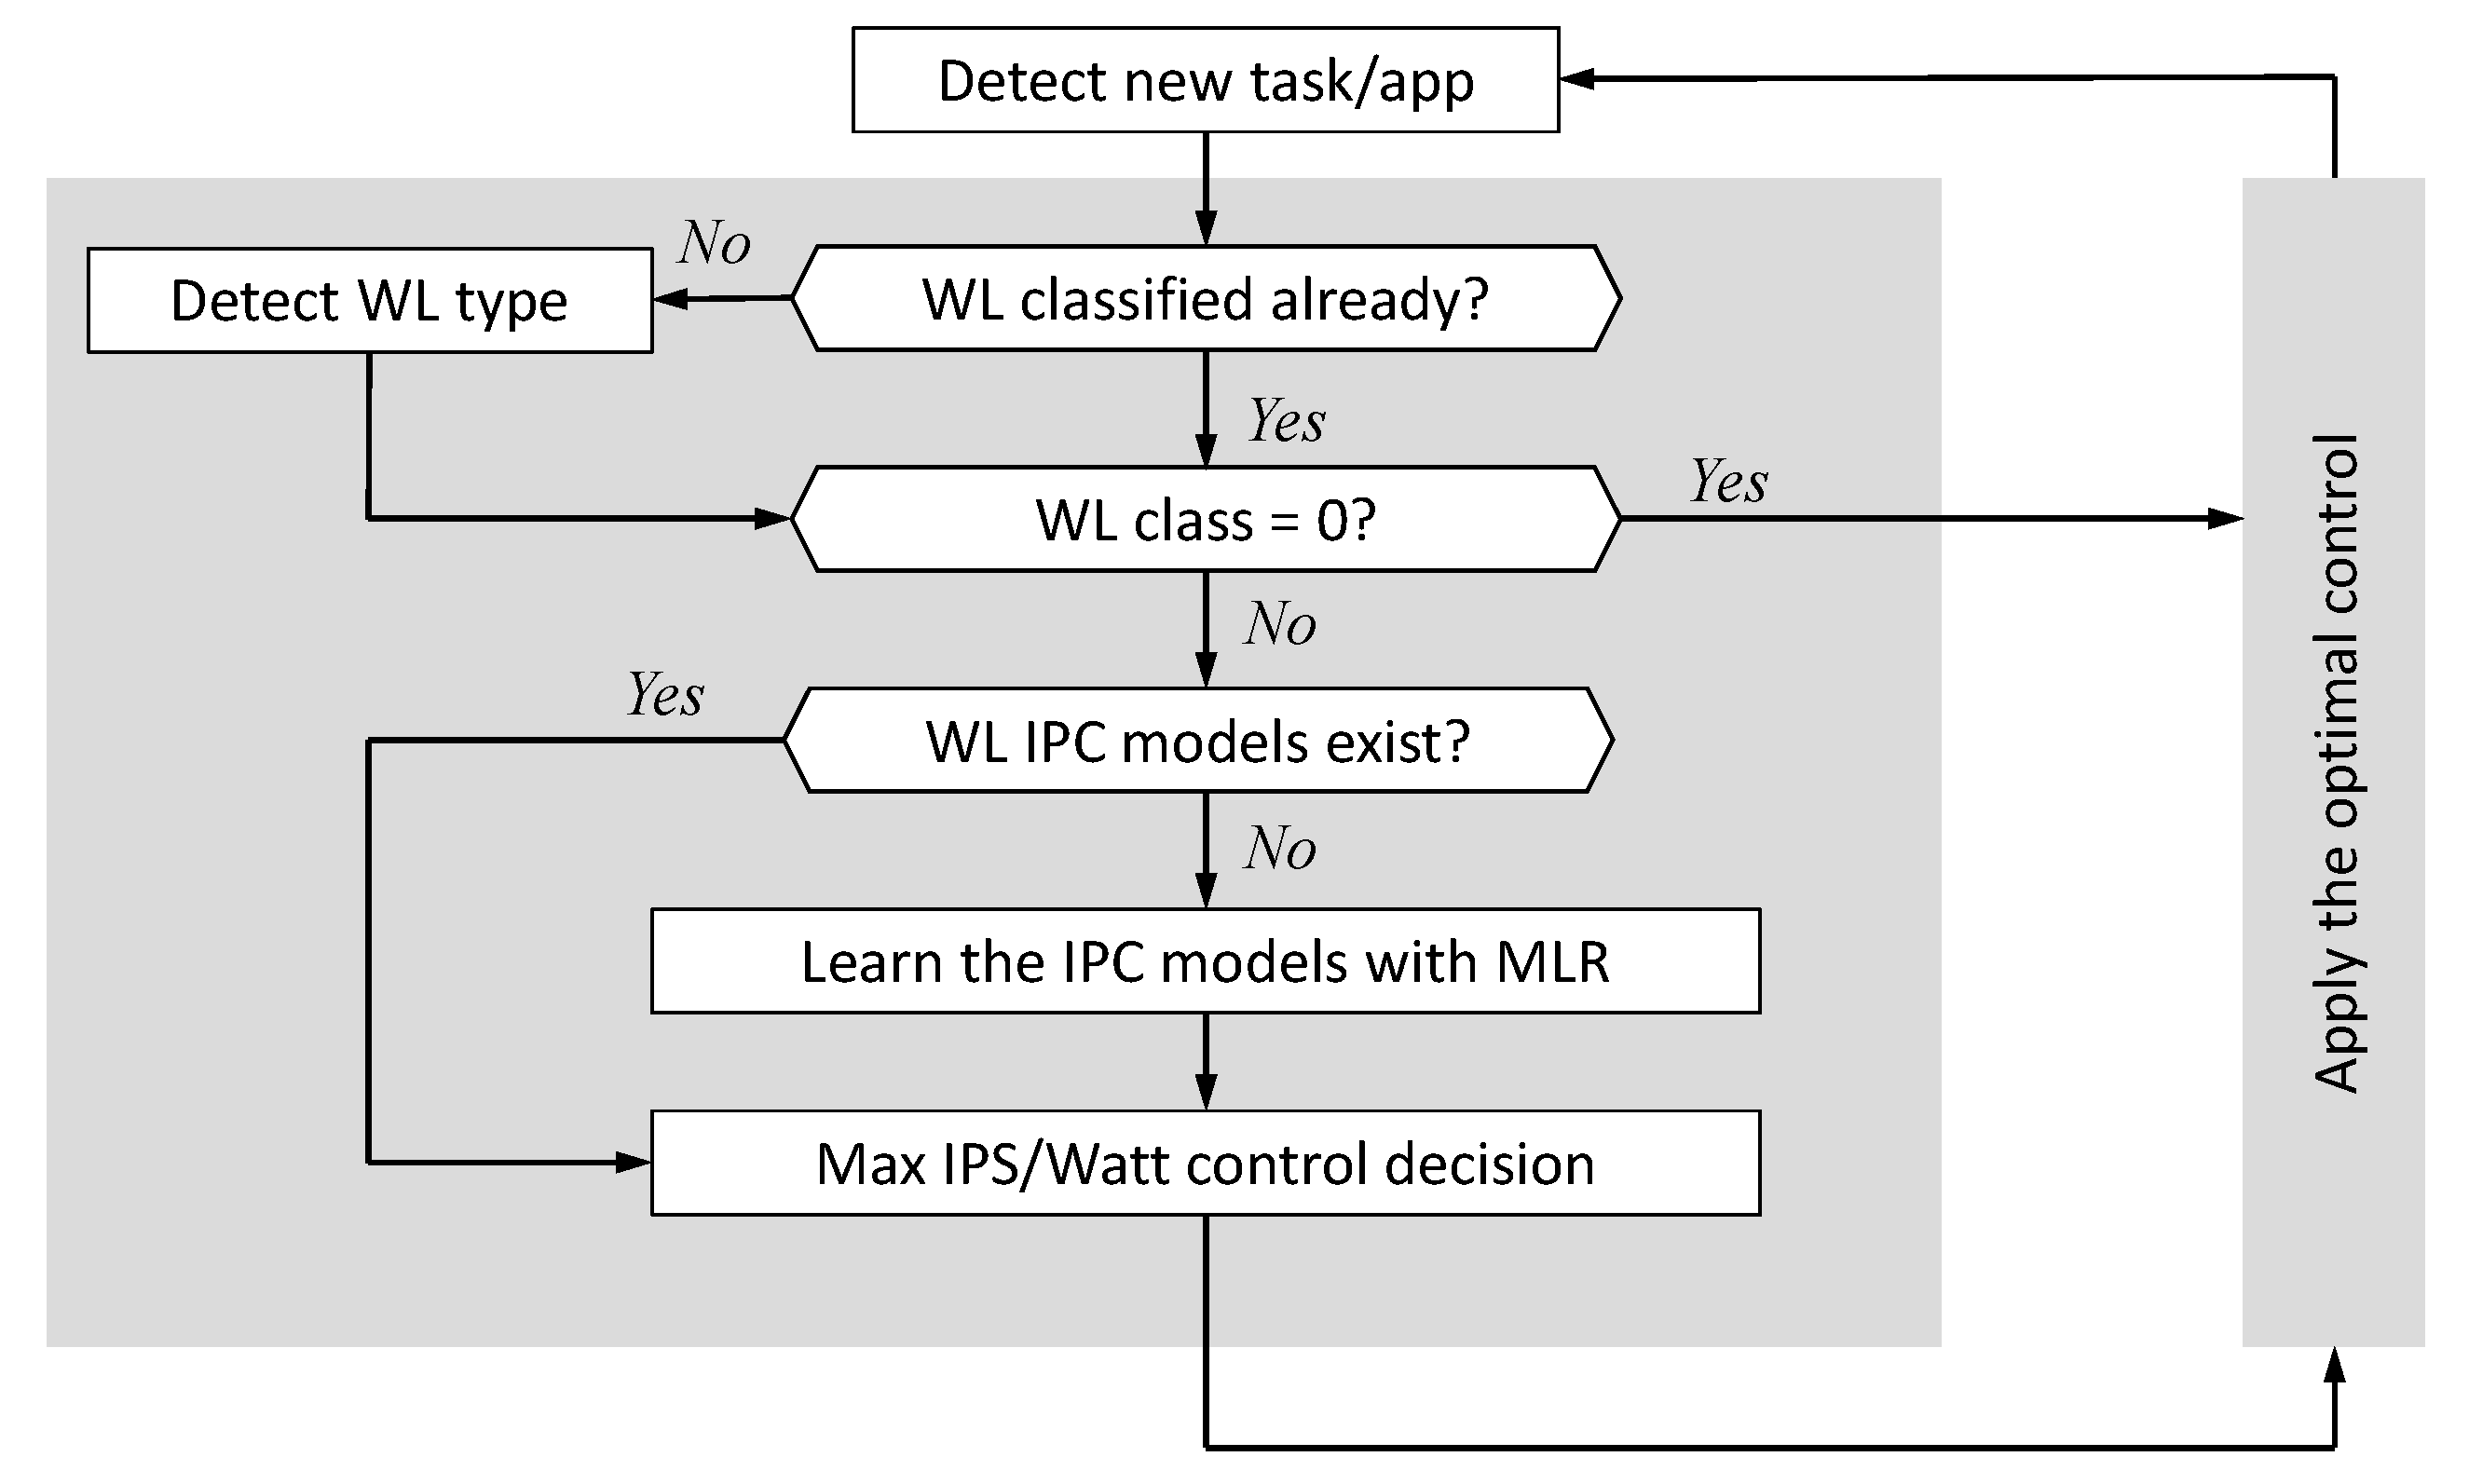
5.2. Run-time Management Based on Workload Classification

Figure 1 presents the general architecture of RTM inside a system. In this section, we explain the central RTM functions—classification and control actions based on performance monitors and actuators (e.g., TM and DVFS). The general approach does not specify the exact form of the taxonomy into which workloads are classified, the monitors and actuators the system need to have, nor the design figure of merit. Our examples classify based on differentiating CPU and memory usages and the execution intensiveness, try to maximize IPS/Watt through core-allocation and DVFS, and get information from system performance counters [42].
The governor implementation is described in Figure 4, which refines Figure 1. At time t i , task i is added to the execution via the system function execvp(). The RTM makes TM and DVFS decisions based on metric classification results, which depends on hardware performance counters and power monitors to directly and indirectly collect all the information needed. This helps avoid instrumenting applications and/or special API’s (unlike, e.g., Reference [51]), providing wider support for existing applications. The TM actuation is carried out indirectly via system functions. For instance, core pinning is done using sched_affinity(pid), where pid is the process ID of a task. DVFS is actuated through the userspace governor as part of cpufreq utilities.

5.3. Workload Classification

Real applications do not have precisely tuneable memory usage rates, unlike mthreads. They may also have phases during which they may appear to be one class or another during their execution; therefore, attempts at classifying each application as a whole offline (as seen in Reference [13]) may be of limited value (see Section 7.1.1 for detailed discussions). In this work, information from performance counters is used to derive the classes of all applications running on the system for each control decision cycle. The assumption is that, during a control decision cycle, the class of an application is unlikely to change. This assumption requires that the length of control cycles is sufficiently short relative to the rate of class change of the applications (according to the Nyquist/Shannon sampling principle). The choice of control cycle length therefore depends on expected application scenarios and what happens when/if Nyquist/Shannon is violated should be carefully considered by the designer. This point will be discussed in detail in Section 7.1.2, with the help of system design case studies.
The classification using performance counter readings is based on calculating a number of metrics from performance counter values recorded at set time intervals and then deriving the classes based on whether these metrics have crossed certain thresholds. Example metrics and how they are calculated are given in Table 5.
Normalized instructions per clock (nipc) measures how intensive the computation is. It is the instructions per unhalted cycle (IPC) of a core, normalized by the maximum IPC ( I P C m a x ). I P C m a x can be obtained from manufacturer literature. Cycles is the unhalted cycles counted. Normalization allows nipc to be used independent of core types and architectures.
Instructions per reference clock (iprc) contributes to determining how active the computation is. ClockRef is the total number of clock cycles given by C l o c k R e f = F r e q / T i m e with Freq and Time from the system software.
Normalized non-memory IPC (nnmipc) discounts memory accesses from nipc, indicating CPU activity. From experiments with our synthetic benchmark, this shows an inverse correlation to the memory use rate.
CPU to memory ratio (cmr) relatively compares CPU to memory activities.
Unhalted clock to reference clock ratio (urr) determines how active an application is.
The general relationship between these metrics and the application (workload) classes are clear, e.g., the higher nnmipc is, the more CPU-intensive a workload will be. A workload can be classified by comparing the values of metrics to thresholds. Decision-making may not require all metrics. The choice of metrics and thresholds can be made by analyzing characterization experiment results for each platform. From studying the relationship between M and the list of metrics from mthreads experiments on the Odroid XU3, we find that nnmpic and cmr show the best spread of values with regard to corresponding to different values of M (see Figure 5). Whichever one of these to use depends on designer preferences on the range of threshold values between different application classes to use. We choose nnmipc to differentiate CPU and memory usage rates and urr to differentiate low and high activity. The thresholds used are determined based on our mthreads characterization database and given in Table 6. We tested this approach by running PARSEC programs and obtaining values of the chosen metrics, with the results shown in Table 7. These confirm that nnmipc can be used to differentiate CPU- and memory-intensive applications. For instance, ferret is regarded as CPU-intensive [52] and its per-core nnmipc value is above 0.35. The other metrics may work better on other platforms and are included here as examples of potential candidates depending on how a mthreads-like characterization program behaves on a platform with regard to the relationships between M values and the metrics.
To confirm our approach, another set of experiments were carried out on the Intel Core i7 platform, as can be seen in Table 8. These results agree with those found from the Odroid XU3. Based on these experiments, we also choose nnmipc to differentiate CPU and memory usage rates and urr for differentiating low and high activity. Threshold values are established from Core i7 characterization experiments and are different from those for Odroid XU3.
In principle, for each hardware platform, based on the available performance counters, the choice of metrics and the classification threshold values should both be based on classification results obtained from that platform.

5.4. Control Decision Making

This section presents an RTM control algorithm that uses application classes to derive its decisions. The behavior is specified in the form of two tables: a threshold table (Table 6), used for determining application classes; and a decision table (Table 5), providing a preferred action model for each application class.
The introduction of new concurrent applications or any other change in the system may cause an application to change its behavior during its execution. It is therefore important to classify and re-classify regularly. The RTM works in a dedicated thread, which performs classification and decision-making action every given time frame. The list of actions performed every RTM cycle is shown in Algorithm 1.
Algorithm 1 Inside the RTM cycle.
1: Collect monitor data
2: for each application do
3:   Compute classification metrics                     ▹ Section 5.3
4:   Use metric and threshold table to determine application class        ▹ Table 5
5:   Use decision table to find core allocation and frequency preferences      ▹ Table 6
6:   Distribute the resources between the applications according to the preferences
7:   Wait for T c o n t r o l                            ▹ Section 5.4
8: end for
9: return
In Algorithm 1, T c o n t r o l is the time between two RTM control cycles. The RTM determines the TM and DVFS of power domains once each control cycle, and these decisions keep constant before the next control cycle. The data from the system monitors (performance counters and power meters) is collected asynchronously. Every core has a dedicated monitor thread, which spends most of its time in a sleep state and wakes every T c o n t r o l to read the performance counter registers. The readings are saved in the RTM memory. This means that the RTM always has the latest data, which is at most T c o n t r o l old. This is mainly done because ARM performance counter registers can be accessed only from code on the same CPU core. In this case, asynchronous monitoring has been empirically shown to be more efficient. In our experiments, we chose T c o n t r o l = 500 ms, which has shown a good balance between RT overhead and energy minimization. The time the RTM takes (i.e., RT overhead) is negligible compared to 500 ms for the size of our system. This interval can be easily reduced with slightly higher overheads or increased with less energy efficiency trade-offs. The flowchart of the entire RTM cycle is shown in Figure 6.
The RTM uses monitor data to calculate the classification metrics discussed in Section 5.2. These metrics form a profile for each application, which is compared against the thresholds (Table 6). Each row of the table represents a class of applications and contains a pre-defined value range for each classification metric. Value ranges may be unbounded. A metric x can be constrained to the range [ c , + ) , equivalent to x c . An application is considered to belong to a class, if its profile satisfies every range in a row. If an application does not satisfy any class, it is marked as “unclassified” and gets a special action from the decision table. An application is also unclassified when it first joins the execution. In that case, it goes to an A15 core for classification.
The decision table (Table 9) contains the following preferences for each application class, related to system actuators (DVFS and core allocation decisions): number of A7 cores, number of A15 cores, and clock frequencies. Number of cores can take one of the following values: none, single, or maximum. Frequency preference can be minimum or maximum. The CPU-intensive application class (Class 1) runs on the maximum number of available A15 cores at the maximum frequency as this has shown to give the best energy efficiency (in terms of power normalized performance) in our previous observations [7].
Table 6 and Table 9 are constructed OL in this work based on large amounts of experimental data, with those involving PARSEC playing only a supporting role. For instance, although ferret is regarded as CPU-intensive, it is so only on average and has non CPU-intensive phases (see Section 7.1.1). Therefore, Table 9 is obtained mainly from analyzing experimental results from our synthetic benchmark mthreads (which has no phases), with PARSEC only used for checking if there are gross disagreements (none was found). Because of the empirical nature of the process, true optimally is not claimed.
In this work, we assume that the RTM does not have to deal with more threads than the number of cores in the system—if there are more threads than cores, some will not get scheduled by the system scheduler, which is outside the domain of the RTM. Our experiments therefore do not feature more concurrent applications than the number of cores in the system. The RTM attempts to satisfy the preferences of all running applications. In the case of conflicts between frequency preferences, the priority is given to the maximum frequency. When multiple applications request cores of the same type, the RTM distributes all available cores of that type as fairly as possible. When these conflicting applications are of different classes, each application is guaranteed at least a single core. Core allocation (TM) is done through the following algorithm.
Algorithm 2 shows the procedure APPLYDECISION for mapping the RTM decisions to the core affinity masks. RTM provides a decision for each app and for each core type d j , i NONE , MIN , MAX , where j A 7 , A 15 is the core type, and 1 i m is the app index, given the total number of apps m. The decisions are arranged in arrays D A 7 = d A 7 , 1 , , d A 7 , m and D A 15 = d A 15 , 1 , , d A 15 , m . Additional constants used by the algorithm are: n A 7 , n A 15 are the total number of little and big cores, respectively, and the IDs of cores by type are listed in the pre-defined C A 7 = c A 7 , 1 , , c A 7 , n A 7 , C A 15 = c A 15 , 1 , , c A 15 , n A 15 . The complexity of the algorithm is linear to m. The result of the algorithm is the set of core IDs C i , which can be used to call the sched_setaffinity function for the respective app i.
Algorithm 2 mapping the RTM decisions to the core affinities
1: procedure ApplyDecision( D A 7 , D A 15 )
2:    r A 7 , 1 , , r A 7 , m R EQ C ORES D A 7 , n A 7   ▹ Get per-app number of little cores
3:    r A 15 , 1 , , r A 15 , m R EQ C ORES D A 15 , n A 15  ▹ Get per-app number of big cores
4:    for 1 i m do
5:     C i , A 7 next r A 7 , i elements from C A 7
6:     C i , A 15 next r A 15 , i elements from C A 15
7:     C i C i , A 7 C i , A 15         ▹ Use C i to set core affinity mask for the app i.
8:    end for
9: end procedure
10: function ReqCores( d 1 , , d m , n )
11:    k MIN count d i = MIN for 1 i m
12:    k MAX count d i = MAX for 1 i m
13:    if k MAX > 0 then
14:     v n k MIN / k MAX             ▹v is the MAX number of cores
15:     w n k MIN mod k MAX               ▹w is the remainder
16:    end if
17:    for 1 i m do
18:     if d i = MAX then
19:         if w > 0 then                 ▹ Distribute the remainder
20:       r i v + 1
21:       w w 1
22:      else
23:       r i v
24:      end if
25:     else if d i = MIN then
26:             r i 1
27:     else
28:             r i 0
29:     end if
30:    end for
31:    return r 1 , , r m
32: end function

6. Low-Complexity Run-time with WLC and MLR

Although an RTM purely based on workload classification is low-cost, its coarse granularity may affect its optimality, and further improvement may be possible with an additional MLR step to refine the control decisions. Figure 7 shows the algorithm with which workload classification may be used to reduce the decision space of the subsequent MLR step to achieve a right balance of complexity reduction and optimization quality.
The first step is to update the application queue—during the preceding interval, new applications may have joined the queue. If so, Algorithm 1 is used to determine the application class of each new interval, as explained in Section 5.1. This may reduce the state space of the subsequent search for optimality. For example, for Class 0, the search of optimal configuration for Odroid XU-3 is reduced from 4 × 13 × 4 × 19 = 4004 different frequency and core configurations (four A7 cores with 13 DVFS points and four A15 with 19 different DVFS points) to one by using C0 (or the first available A7 core) and F = 200 MHz as the optimal configuration. For class 1, the search for optimal configuration is reduced by more than 75% because we used the A15 cores at high frequencies (800–2000 MHz), and the state space is reduced by more than 80% for Class 3 because we used the A7 cores at high frequencies (800–1400 MHz). After this reduction of search space, MLR is used to determine the optimal frequency and core allocations for each class type using the method described in Reference [6].

7. Experimental Results

Extensive experiments have been carried out with a large number of application scenarios running on the XU3 platform, with additional confirmatory explorations on the Intel i7 platform. These experiments include running single applications on their own and a number of concurrent applications. In the concurrent scenarios, multiple copies of the same application and different applications of the same class and different applications of different classes have all been tested.

7.1. Workload Classification-Only Results

7.1.1. A Case Study of Concurrent Applications

An example execution trace with three applications is shown in Figure 8. Parts at the beginning and end of the run contain single and dual application scenarios. The horizontal axis is time, while the vertical axis denotes TM and DVFS decisions. Cores C0–C3 are A7 cores, and C4–C7 are A15 cores. The figure shows application classes and the core(s) on which they run at any time. This is described by numbers, for instance, “2/3” on core C1 means that App 2 is classified as of Class 3 and runs on C1 for a particular time window. “1/u” means that App 1 is being classified. The lower part of the figure shows the corresponding power and IPS traces. Both parameters are clearly dominated by the A15 cores.
As can be seen, initial classifications are carried out on C4, but, when C4 is allocated to an application, C7 is reserved for this purpose. The reservation of dedicated cores for initial classification fits well for architectures where the number of cores is greater than the number of applications, as in the case of modern multi-core systems, such as Odroid XU3.
Re-classification happens for all running applications at every 500 ms control cycle, according to Algorithm 1. Each application is re-classified on the core where it is running. Figure 8 and Figure 9 show the motivation for this. The same application can belong to different classes at different times. This proves that an OL classification method, which gives each application an invariable class, is unusable for efficient energy minimization.
Figure 9 shows example traces of the PARSEC apps ferret and fluid animate being classified whilst running as single applications. It can be seen that the same application can have different CPU/memory behaviors and get classified into different classes. This is not surprising as the same application can have CPU-intensive phases when it does not access memory and memory-intensive phases where there is a lot of memory access. In addition, it is also possible for an application to behave as belonging to different classes when mapped to different numbers of cores. The classification can also be influenced by whether an application is running alone or running in parallel with other applications, if we compare Figure 8 and reftwoapp. These are all strong motivations for RT re-classification. The result of classification affects an application’s IPS and power (see Figure 8).

7.1.2. RTM Stability, Robustness and Control Decision Cycle Selection

Algorithm 1 can oscillate between two different sets of classification and control decisions in alternating cycles. This may indicate the loss of stability of the RTM approach. The reasons for such oscillations have been isolated into the following cases:
  • The control cycle length coincides with an application’s CPU and memory phase changes.
  • An application’s behavior takes it close to particular threshold values, and different instances of evaluation put it on different sides of the thresholds.
  • An application is not very parallelizable. When it is classified on a single core, it behaves as CPU-intensive, but, when it is classified on multiple cores, it behaves as low-activity. This causes it to oscillate between Class 0 and Class 1 in alternating cycles.
We address these issues as follows. Case 1 rarely happens, and, when it happens, it disappears quickly because of the very low probability of an application’s phase cycles holding constant and coinciding with the control cycle length. This can be addressed, in the rare case when it is necessary, by tuning the control cycle length slightly if oscillations persist. In general, if the Nyquist/Shannon sampling frequency requirement is not violated, this is not a worry.
Case 2 also happens rarely. In general, increasing the number of classes and reducing the distances between control decisions of adjacent classes reduce the RTM’s sensitivity to threshold accuracy; hence, Case 2 robustness does not have to be a problem, and thresholds (Table 6) and decisions (Table 9) can be tuned both OL and during RT.
Case 3 is by far the most common. It is dealt with through adaptation. This type of oscillation is very easy to detect. We put in an extra class, “low-parallelizability”, and give it a single big core. This class can only be found after two control cycles, different from the other classes, but this effectively eliminates Case 3 oscillations.
Empirically, the PARSEC applications used in this paper as examples tend to have relatively stable periods during which their classes do not change. These periods can run from hundreds of ms to multiple seconds. We chose a control decision cycle of 500 ms such that it may, on rare occasions, violate the Nyquist/Shannon sampling principle for some applications, in order to expose potential oscillatory behavior and test the effectiveness of our mitigating methods. The experimental results confirm the validity of our methods of dealing with the different cases of oscillatory behavior.

7.1.3. Comparative Evaluation of the WLC-Only RTM

Complexity: Our RTM has a complexity of O( N a p p N c l a s s + N c o r e ), where N a p p is the number of applications (tasks) running, N c l a s s is the number of classes in the taxonomy, and N c o r e is the number of cores. N c l a s s is usually a constant of small value, which can be used to trade robustness and quality with cost. The RTM’s computation complexity is therefore linear to the number of applications running and the number of cores. In addition, the basic algorithm itself is a low-cost, lookup-table approach with the table sizes linear to N c l a s s .
Schemes found in existing work, with, e.g., model-based [6], machine-learning [53], linear programming [18], or regression techniques [6,19], have a decision state space size of O(( N A 7 D V F S N A 15 D V F S ) ( N A 7 N A 15 ) N a p p ) , where N A 7 and N A 15 are the numbers of A7 and A15 cores and N A 7 D V F S and N A 15 D V F S are the numbers of DVFS points of the A7 and A15 power domains, for this type of platform. This NP complexity is sensitive to system heterogeneity, unlike our approach.
Overheads: We compared the time overheads (OH) of our method with the linear-regression (LR) method found in, e.g., Reference [6,19]. For each 500 ms control cycle, our RTM, running at 200 MHz, requires 10 ms to complete for the trace in Figure 8. Over 90% of this time is spent on monitor information gathering. In comparison, LR requires 100 ms to complete the same actions. It needs a much larger set of monitors. The computation, also much more complex, evenly divides its time in model building and decision-making. In addition, a modeling control, such as LR, requires multiple control intervals to settle and the number of control decision cycles needed is combinatorial with N A 7 , N A 15 , N A 7 D V F S , and N A 15 D V F S .
Scalability: Our RTM is scalable to any platform as it is (a) agnostic to the number and type of application running in concurrently and (b) independent of the number or type of cores in the platform, and their power domains. This is because the complexity of the RTM only grows linearly with increased number of concurrent applications and cores. Our experiments on the Intel i7 platform confirm this.

7.2. Comparative Results between Our Three RTM Types

In this section, we compare the IPS/Watt results from MLR-only, workload classification-only, and the combined workload classification plus MLR RTM types.

7.2.1. MLR-Only RTM Results

We previously explored an MLR-only RTM with PARSEC applications on the Odroid XU3 in comparable experimental conditions [6]. This power governor/RTM aims to improve IPS/Watt, the same as the RTM’s developed in this paper. The results from Reference [6] are compared to those obtained from this work in Table 10.

7.2.2. WLC-Only and WLC Combined with MLR RTM Results

In this work, we propose two new power governors (RTMs). The first is the light-weight WLC-only approach described in Section 5. The second is the more sophisticated approach of combining WLC with a further step of MLR-based optimization, described in Section 6.
Figure 10 shows the results obtained from running the WLC-only RTM on the Odroid XU3, comparing the IPS/Watt metric obtained with the performance of the Linux ondemand governor [54]. These results show IPS/Watt improvements of 24 to 127% over the benchmark ondemand governor in the application scenarios included in the figure.
Experiments with the combined WLC+MLR approach demonstrate that it is possible to further improve IPS/Watt by supplementing the WLC method with additional MLR optimization. Figure 11 show the IPS/Watt comparisons between this method and the Linux ondemand governor on the Odroid XU3. It can be seen from these results that further improvements over Figure 10 are evident.
This combined method is also applied to the Intel Core i7 platform and the IPS/Watt results obtained are compared with those from running the Linux ondemand governor in Figure 12. The improvements on IPS/Watt range from 20% to 40%.
In general, it is found that the heterogeneous Odroid XU3 platform demonstrates the methods proposed in this paper better than the Intel Core i7 platform. This is mainly because the latter is not specifically designed for CPU power efficiency, and there is a limited scope for IPS/Watt improvement by tuning TM and DVFS. There is a comparatively high background power dissipation, whatever the TM and DVFS decisions are. On the other hand, the Odroid platform, based on ARM big.LITTLE architecture, has CPU energy efficiency at the core of its hardware design philosophy and provides a much wider scope of IPS/Watt improvements via TM and DVFS decisions.
As a result, we concentrate on comparing the different RTM methods based on data obtained from the Odroid XU3 experiments. Table 10 compares the results of all three RTMs against the ondemand governor on the Odroid XU3 platform.
From Table 10, it can be seen that the improvements in IPS/Watt obtained by the combined WLC with MLR approach is higher than the WLC-only and MLR-only methods.
The main problem with the MLR-only approach is that it does not take changes of application behavior in each control decision cycle into account. An MLR model typically takes multiple control cycles to settle, and, after it settles, it may no longer be optimal.
The WLC-only approach improves on this by re-classifying every control cycle and this improves the optimality of the control decisions and reduces the controller overhead at the same time. However, because of its coarse-grain nature the decisions tend to be sub-optimal leaving further improvements possible.
By combining WLC and MLR modeling, the WLC+MLR method makes use of the WLC technique to provide a coarse-grain pre-decision which is then potentially refined through MLR modeling for further IPS/Watt improvements. This results in quick decisions, vastly reduced MLR learning space and more up to date MLR model results that approximate true optima much better.
By comparing with the ondemand governor, we seek a vehicle for indirect comparisons with a relatively broad range of existing and upcoming research, as this governor is popular target for result comparisons in most related types of work. To demonstrate the efficacy of this approach, we look at the following example. Gupta [9] proposed a run-time approach consisting of a combination of offline characterization and run-time classification. The thesis describes experimental results showing an average increase of 81% in IPS/Watt compared to the ondemand governor for memory intensive applications running alone. Results, such as this, can be compared with our results listed in Table 10. Although the experimental scenarios may not be entirely like-for-like, much can be inferred as to the effectiveness of different methods from this kind of indirect comparison. In this specific case, the Gupta improvement figure of 81% is most appropriately compared with the fluid animate alone figure in Table 10, where our approaches obtain over 120% of improvements.
Data collected from our large number of validation runs shows the RTM out-performing the Linux ondemand governor by considerable margins on IPS/Watt, as shown in Table 10. The method can be generalized to other optimization targets, such as throughput, energy-delay product, and any energy and throughput trade-off metric. It is also possible to switch targets at RT. This will require constructing multiple decision tables and switching between them during RT. This is a subject for future work.

8. Conclusions

An optimization scheme targeting power-normalized performance was developed for controlling concurrent application executions on platforms with multiple cores.
In the first instance, models are obtained off-line from experimental data. Explorations with model simplification are shown to be successful as by and large optimal results are obtained from using these models in RT control algorithms compared with existing Linux governors. In many cases, the improvements obtained are quite significant.
A run-time workload classification management approach is proposed for multiple concurrent applications of diverse workloads running on heterogeneous multi-core platforms. The approach is demonstrated by a governor aimed at improving system energy efficiency (IPS/Watt). This governor classifies workloads according to their CPU and memory signatures and makes decisions on core allocation and DVFS. Due to model-free approach, it leads to low RTM complexity (linear with the number of applications and cores) and cost (lookup tables of limited size). The governor implementation does not require application instrumentation, allowing for easy integration in existing systems. Experiments show the governor provides significant energy efficiency advantage compared to existing approaches. Detection of low-parallelizability improves the stability of the governor. A synthetic benchmark with tunable memory use supports the characterization process.
This method is further improved with tuning the results of workload classification by a learning-based optimization using multivariant linear regression. With the workload classification having drastically reduced the modeling space, the regression-based learning has been shown to work effectively. This RTM is demonstrated on both heterogeneous and homogeneous platforms.
For experimental purposes of homogeneous and heterogeneous systems, we demonstrated a novel RT approach, capable of workload classification and power-aware performance adaptation under sequential and concurrent application scenarios in heterogeneous multi-core systems. The approach is based on power and performance models that can be obtained during RT by multivariate linear regression based on low-complexity hypotheses of power and performance for a given operating frequency. The approach is extensively evaluated using PARSEC-3.0 benchmark suite running on the Odroid-XU3 heterogeneous platform.
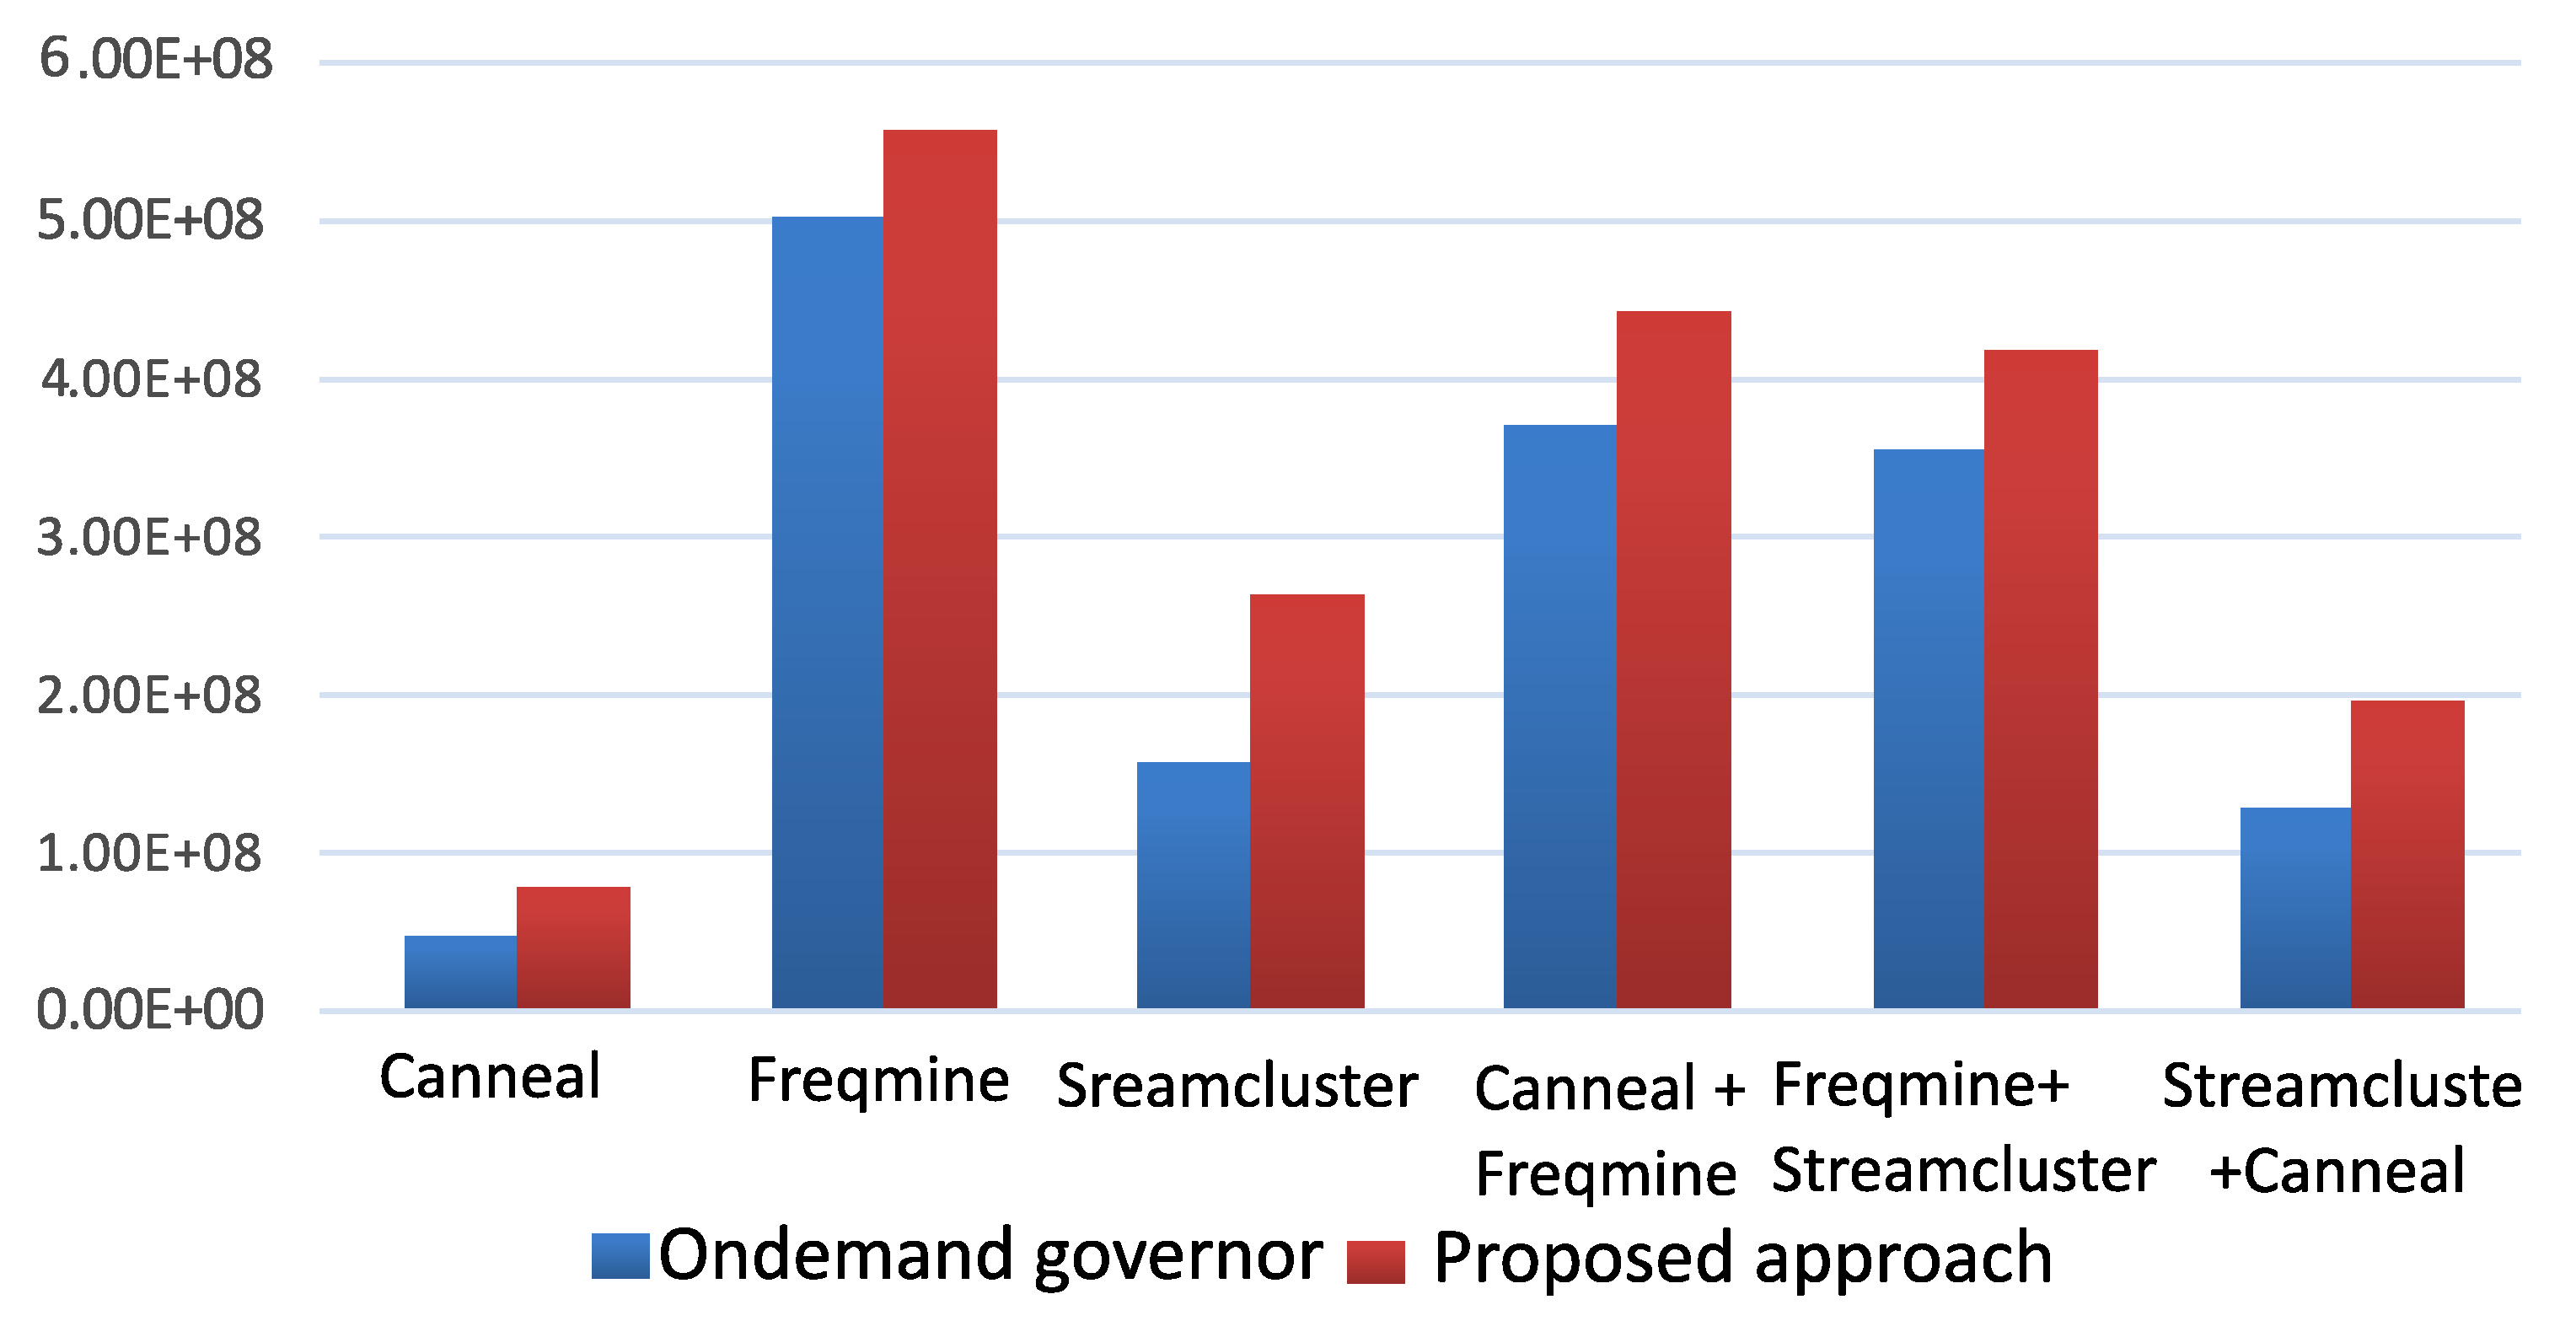
A selection of experimental results was presented to illustrate the kinds of trade-offs in a variety of concurrent application scenarios, core allocations, and DVFS points, highlighting an improvement of power normalized performance which produced IPS/Watt improvements between 26% and 139% for a range of applications. It is expected that modern embedded and high-performance system designers will benefit from the proposed approach in terms of a systematic power-aware performance optimization under variable workload and application scenarios. Our future work will include investigating the scalability of the approach to more complex platforms and higher levels of concurrency.

Author Contributions

Conceptualization, all authors; methodology, all authors; software, A.R. (Ashur Rafiev) and A.A.; validation, A.A., A.R. (Ashur Rafiev) and F.X.; formal analysis, F.X., A.R. (Ashur Rafiev) and A.A.; investigation, A.A., A.R. (Ashur Rafiev) and F.X.; resources, A.Y. and A.R. (Alexander Romanovsky); data curation, A.A.; writing–original draft preparation, A.A., A.R. (Ashur Rafiev) and F.X.; writing–review and editing, F.X. and R.S.; visualization, A.A., F.X. and A.R. (Ashur Rafiev); supervision, A.Y., R.S., A.R. (Alexander Romanovsky) and F.X.; project administration, A.Y., A.R. (Alexander Romanovsky), R.S. and F.X.; funding acquisition, A.Y., A.R. (Alexander Romanovsky) and A.A. All authors have read and agreed to the published version of the manuscript.

Funding

This work is funded by the EPSRC (project PRiME, grant EP/K034448/1 and Project STRATA, grant EP/N023641/1). Aalsaud is also supported by studentship funding from the Ministry of Iraqi Higher Education and Scientific Research.

Conflicts of Interest

The authors declare no conflict of interest.

References

  1. Prakash, A.; Wang, S.; Irimiea, A.E.; Mitra, T. Energy-efficient execution of data-parallel applications on heterogeneous mobile platforms. In Proceedings of the 2015 33rd IEEE International Conference on Computer Design (ICCD), New York, NY, USA, 18–21 October 2015; pp. 208–215. [Google Scholar]
  2. Plyaskin, R.; Masrur, A.; Geier, M.; Chakraborty, S.; Herkersdorf, A. High-level timing analysis of concurrent applications on MPSoC platforms using memory-aware trace-driven simulations. In Proceedings of the 2010 18th IEEE/IFIP International Conference on VLSI and System-on-Chip, Madrid, Spain, 27–29 September 2010; pp. 229–234. [Google Scholar]
  3. Shafik, R.; Yakovlev, A.; Das, S. Real-power computing. IEEE Trans. Comput. 2018, 67, 1445–1461. [Google Scholar] [CrossRef]
  4. Borkar, S. Design challenges of technology scaling. IEEE Micro 1999, 19, 23–29. [Google Scholar] [CrossRef]
  5. Orgerie, A.C.; Assuncao, M.D.D.; Lefevre, L. A survey on techniques for improving the energy efficiency of large-scale distributed systems. ACM Comput. Surv. (CSUR) 2014, 46, 47. [Google Scholar] [CrossRef] [Green Version]
  6. Aalsaud, A.; Shafik, R.; Rafiev, A.; Xia, F.; Yang, S.; Yakovlev, A. Power–aware performance adaptation of concurrent applications in heterogeneous many-core systems. In Proceedings of the 2016 International Symposium on Low Power Electronics and Design, San Francisco, CA, USA, 8–10 August 2016; pp. 368–373. [Google Scholar]
  7. Mittal, S. A survey of techniques for improving energy efficiency in embedded computing systems. Int. J. Comput. Aided Eng. Technol. 2014, 6, 440–459. [Google Scholar] [CrossRef]
  8. Intel Corporation. Timeline of Processors; Intel Corporation: Santa Clara, CA, USA, 2012. [Google Scholar]
  9. Gupta, U. Power-Performance Modeling and Adaptive Management of Heterogeneous Mobile Platforms. Ph.D. Thesis, Arizona State University, Tempe, AZ, USA, 2018. [Google Scholar]
  10. Rafiev, A.; Al-Hayanni, M.; Xia, F.; Shafik, R.; Romanovsky, A.; Yakovlev, A. Speedup and Power Scaling Models for Heterogeneous Many-Core Systems. IEEE Trans. Multi-Scale Comput. Syst. 2018, 4, 436–449. [Google Scholar] [CrossRef] [Green Version]
  11. Shafik, R.A.; Al-Hashimi, B.M.; Kundu, S.; Ejlali, A. Soft Error-Aware Voltage Scaling Technique for Power Minimization in Application-Specific Multiprocessor System-on-Chip. JOLPE 2009, 5, 145–156. [Google Scholar] [CrossRef]
  12. Torrey, A.; Cleman, J.; Miller, P. Comparing interactive scheduling in Linux. Softw. Pract. Exp. 2007, 34, 347–364. [Google Scholar] [CrossRef]
  13. Reddy, B.K.; Singh, A.K.; Biswas, D.; Merrett, G.V.; Al-Hashimi, B.M. Inter-cluster Thread-to-core Mapping and DVFS on Heterogeneous Multi-cores. IEEE Trans. Multi-Scale Comput. Syst. 2018, 4, 369–382. [Google Scholar] [CrossRef]
  14. Petrucci, V.; Loques, O.; Mossé, D. Lucky scheduling for energy-efficient heterogeneous multi-core systems. In Proceedings of the 2012 USENIX conference on Power-Aware Computing and Systems, Hollywood, CA, USA, 7 October 2012; p. 7. [Google Scholar]
  15. Nabina, A.; Nunez-Yanez, J.L. Adaptive voltage scaling in a dynamically reconfigurable FPGA-based platform. ACM Trans. Reconfigurable Technol. Syst. (TRETS) 2012, 5, 20. [Google Scholar] [CrossRef]
  16. Wang, Y.; Pedram, M. Model-Free Reinforcement Learning and Bayesian Classification in System-Level Power Management. IEEE Trans. Comput. 2016, 65, 3713–3726. [Google Scholar] [CrossRef]
  17. Goraczko, M.; Liu, J.; Lymberopoulos, D.; Matic, S.; Priyantha, B.; Zhao, F. Energy-optimal software partitioning in heterogeneous multiprocessor embedded systems. In Proceedings of the 45th Annual Design Automation Conference, Anaheim, CA, USA, 8–13 June 2008; pp. 191–196. [Google Scholar]
  18. Luo, J.; Jha, N.K. Power-efficient scheduling for heterogeneous distributed real-time embedded systems. IEEE Trans. Comput. Aided Des. Integr. Circuits Syst. 2007, 26, 1161–1170. [Google Scholar] [CrossRef]
  19. Yang, S.; Shafik, R.A.; Merrett, G.V.; Stott, E.; Levine, J.M.; Davis, J.; Al-Hashimi, B.M. Adaptive energy minimization of embedded heterogeneous systems using regression-based learning. In Proceedings of the 2015 25th International Workshop on Power and Timing Modeling, Optimization and Simulation (PATMOS), Salvador, Brazil, 1–4 September 2015; pp. 103–110. [Google Scholar]
  20. Wang, A.; Chandrakasan, A. A 180-mV subthreshold FFT processor using a minimum energy design methodology. IEEE J. Solid-State Circuits 2005, 40, 310–319. [Google Scholar] [CrossRef]
  21. Ma, K.; Li, X.; Chen, M.; Wang, X. Scalable power control for many-core architectures running multi-threaded applications. ACM SIGARCH Comput. Archit. News 2011, 39, 449–460. [Google Scholar] [CrossRef]
  22. Xu, Z.; Tu, Y.C.; Wang, X. Exploring power-performance trade-offs in database systems. In Proceedings of the 2010 IEEE 26th International Conference on Data Engineering (ICDE 2010), Long Beach, CA, USA, 1–6 March 2010; pp. 485–496. [Google Scholar]
  23. Rafiev, A.; Iliasov, A.; Romanovsky, A.; Mokhov, A.; Xia, F.; Yakovlev, A. Studying the Interplay of Concurrency, Performance, Energy and Reliability with ArchOn—An Architecture-Open Resource-Driven Cross-Layer Modelling Framework. In Proceedings of the 2014 14th International Conference on Application of Concurrency to System Design, Tunis La Marsa, Tunisia, 23–27 June 2014; pp. 122–131. [Google Scholar]
  24. Wong, H.; Aamodt, T.M. The Performance Potential for Single Application Heterogeneous Systems. In Proceedings of the 8th Workshop on Duplicating, Deconstructing, and Debunking, Austin, TX, USA, 21 June 2009. [Google Scholar]
  25. Goh, L.K.; Veeravalli, B.; Viswanathan, S. Design of fast and efficient energy-aware gradient-based scheduling algorithms heterogeneous embedded multiprocessor systems. IEEE Trans. Parallel Distrib. Syst. 2009, 20, 1–12. [Google Scholar]
  26. Ben Atitallah, R.; Senn, E.; Chillet, D.; Lanoe, M.; Blouin, D. An efficient framework for power-aware design of heterogeneous MPSoC. IEEE Trans. Ind. Inform. 2013, 9, 487–501. [Google Scholar] [CrossRef]
  27. Hankendi, C.; Coskun, A.K. Adaptive power and resource management techniques for multi-threaded workloads. In Proceedings of the 2013 IEEE International Symposium on Parallel & Distributed Processing, Workshops and Phd Forum, Cambridge, MA, USA, 20–24 May 2013; pp. 2302–2305. [Google Scholar]
  28. Shafik, R.A.; Yang, S.; Das, A.; Maeda-Nunez, L.A.; Merrett, G.V.; Al-Hashimi, B.M. Learning transfer-based adaptive energy minimization in embedded systems. IEEE Trans. Comput. Aided Des. Integr. Circuits Syst. 2016, 35, 877–890. [Google Scholar] [CrossRef] [Green Version]
  29. Das, A.; Kumar, A.; Veeravalli, B.; Shafik, R.; Merrett, G.; Al-Hashimi, B. Workload uncertainty characterization and adaptive frequency scaling for energy minimization of embedded systems. In Proceedings of the Design, Automation & Test in Europe Conference & Exhibition (DATE), Grenoble, France, 9–13 March 2015; pp. 43–48. [Google Scholar]
  30. Chen, X.; Zhang, G.; Wang, H.; Wu, R.; Wu, P.; Zhang, L. MRP: Mix real cores and pseudo cores for FPGA-based chip-multiprocessor simulation. In Proceedings of the 2015 Design, Automation & Test in Europe Conference & Exhibition, Grenoble, France, 9–13 March 2015; pp. 211–216. [Google Scholar]
  31. Cochran, R.; Hankendi, C.; Coskun, A.K.; Reda, S. Pack & Cap: Adaptive DVFS and thread packing under power caps. In Proceedings of the 44th Annual IEEE/ACM International Symposium on Microarchitecture, Porto Alegre, Brazil, 3–7 December 2011; pp. 175–185. [Google Scholar]
  32. Sarma, S.; Muck, T.; Bathen, L.A.; Dutt, N.; Nicolau, A. SmartBalance: A sensing-driven linux load balancer for energy efficiency of heterogeneous MPSoCs. In Proceedings of the 2015 52nd ACM/EDAC/IEEE Design Automation Conference (DAC), San Francisco, CA, USA, 8–12 June 2015; pp. 1–6. [Google Scholar]
  33. Mück, T.; Sarma, S.; Dutt, N. Run-DMC: Run-time dynamic heterogeneous multicore performance and power estimation for energy efficiency. In Proceedings of the 10th International Conference on Hardware/Software Codesign and System Synthesis, Amsterdam, The Netherlands, 4–9 October 2015; pp. 173–182. [Google Scholar]
  34. Travers, M.; Shafik, R.; Xia, F. Power-Normalized Performance Optimization of Concurrent Many-Core Applications. In Proceedings of the 2016 16th International Conference on Application of Concurrency to System Design (ACSD), Torun, Poland, 19–24 June 2016; pp. 94–103. [Google Scholar]
  35. Kyrkou, C.; Bouganis, C.S.; Theocharides, T.; Polycarpou, M.M. Embedded hardware-efficient real-time classification with cascade support vector machines. IEEE Trans. Neural Netw. Learn. Syst. 2015, 27, 99–112. [Google Scholar] [CrossRef]
  36. Reddy, B.K.; Merrett, G.V.; Al-Hashimi, B.M.; Singh, A.K. Online concurrent workload classification for multi-core energy management. In Proceedings of the 2018 Design, Automation & Test in Europe Conference & Exhibition (DATE), Dresden, Germany, 19–23 March 2018; pp. 621–624. [Google Scholar]
  37. Bitirgen, R.; Ipek, E.; Martinez, J.F. Coordinated management of multiple interacting resources in chip multiprocessors: A machine learning approach. In Proceedings of the 2008 41st IEEE/ACM International Symposium on Microarchitecture, Lake Como, Italy, 8–12 November 2008; pp. 318–329. [Google Scholar]
  38. Van Craeynest, K.; Jaleel, A.; Eeckhout, L.; Narvaez, P.; Emer, J. Scheduling heterogeneous multi-cores through performance impact estimation (PIE). In Proceedings of the 2012 39th Annual International Symposium on Computer Architecture (ISCA), Portland, OR, USA, 9–13 June 2012; pp. 213–224. [Google Scholar]
  39. Wen, Y.; Wang, Z.; O’boyle, M.F. Smart multi-task scheduling for OpenCL programs on CPU/GPU heterogeneous platforms. In Proceedings of the 2014 21st International Conference on High Performance Computing (HiPC), Dona Paula, India, 17–20 December 2014; pp. 1–10. [Google Scholar]
  40. Dey, S.; Singh, A.; Wang, X.; McDonald-Maier, K. User Interaction Aware Reinforcement Learning for Power and Thermal Efficiency of CPU-GPU Mobile MPSoCs. In Proceedings of the 2020 Design, Automation & Test in Europe Conference & Exhibition (DATE), Grenoble, France, 9–13 March 2020. [Google Scholar]
  41. Pasricha, S.; Ayoub, R.; Kishinevsky, M.; Mandal, S.K.; Ogras, U.Y. A Survey on Energy Management for Mobile and IoT Devices. IEEE Des. Test 2020. [Google Scholar] [CrossRef]
  42. Aalsaud, A.; Rafiev, A.; Xia, F.; Shafik, R.; Yakovlev, A. Model-free run-time management of concurrent workloads for energy-efficient many-core heterogeneous systems. In Proceedings of the 2018 28th International Symposium on Power and Timing Modeling, Optimization and Simulation (PATMOS), Platja d’Aro, Spain, 2–4 July 2018; pp. 206–213. [Google Scholar]
  43. Likwid—Light Weight Performance Tools. Available online: http://github.com/RRZE-HPC/likwid/wiki (accessed on 20 June 2020).
  44. Hähnel, M.; Döbel, B.; Völp, M.; Härtig, H. Measuring energy consumption for short code paths using RAPL. ACM Sigmetrics Perform. Eval. Rev. 2012, 40, 13–17. [Google Scholar] [CrossRef]
  45. Kumar, S.; Djie, M.; van Leuken, R. Low Overhead Message Passing for High Performance Many-Core Processors. In Proceedings of the 2013 First International Symposium on Computing and Networking, Matsuyama, Japan, 4–6 December 2013; pp. 345–351. [Google Scholar] [CrossRef]
  46. Odroid XU3. Available online: https://www.hardkernel.com/shop/odroid-xu3/ (accessed on 11 August 2020).
  47. Skalicky, S.; Lopez, S.; Lukowiak, M.; Schmidt, A.G. A Parallelizing MATLAB Compiler Framework and Run time for Heterogeneous Systems. In Proceedings of the 2015 IEEE 17th International Conference on High Performance Computing and Communications, 2015 IEEE 7th International Symposium on Cyberspace Safety and Security, and 2015 IEEE 12th International Conference on Embedded Software and Systems, New York, NY, USA, 24–26 August 2015; pp. 232–237. [Google Scholar]
  48. Bienia, C.; Li, K. PARSEC 2.0: A New Benchmark Suite for Chip-Multiprocessors. Available online: http://www-mount.ece.umn.edu/~jjyi/MoBS/2009/program/02E-Bienia.pdf (accessed on 20 June 2020).
  49. Walker, M.J.; Diestelhorst, S.; Hansson, A.; Das, A.K.; Yang, S.; Al-Hashimi, B.M.; Merrett, G.V. Accurate and stable run-time power modeling for mobile and embedded cpus. IEEE Trans. Comput. Aided Des. Integr. Circuits Syst. 2017, 36, 106–119. [Google Scholar] [CrossRef] [Green Version]
  50. Mthreads Benchmark. Available online: https://github.com/ashurrafiev/PThreads (accessed on 20 June 2020).
  51. Gupta, U.; Patil, C.A.; Bhat, G.; Mishra, P.; Ogras, U.Y. Dypo: Dynamic pareto-optimal configuration selection for heterogeneous mpsocs. ACM Trans. Embed. Comput. Syst. (TECS) 2017, 16, 1–20. [Google Scholar] [CrossRef]
  52. PARSEC Benchmark Suite. Available online: https://parsec.cs.princeton.edu/ (accessed on 20 June 2020).
  53. Singh, A.K.; Leech, C.; Reddy, B.K.; Al-Hashimi, B.M.; Merrett, G.V. Learning-based run-time power and energy management of multi/many-core systems: Current and future trends. J. Low Power Electron. 2017, 13, 310–325. [Google Scholar] [CrossRef]
  54. Pallipadi, V.; Starikovskiy, A. The ondemand governor. In Proceedings of the Linux Symposium, Ottawa, ON, Canada, 19–22 July 2006; pp. 215–230. [Google Scholar]
Figure 1. Run-time management (RTM) architecture showing two-way interactions between concurrent applications and hardware cores.
Jlpea 10 00025 g001
Figure 2. Flowchart of mthreads synthetic benchmark. M and N are controlled parameters.
Jlpea 10 00025 g002
Figure 3. instruction per second (IPS)/Watt for different memory use rates ( 0 M 1 ).
Jlpea 10 00025 g003
Figure 4. Governor implementation based on RTM.
Jlpea 10 00025 g004
Figure 5. CPU to memory ratio (cmr) and Normalized non-memory IPC (nnmipc) metrics for different memory use rates ( 0 M 1 ).
Jlpea 10 00025 g005
Figure 6. Flowchart of the RTM cycle.
Jlpea 10 00025 g006
Figure 7. Flow chart for multivariate linear regression (MLR) with workload (WL) classification.
Jlpea 10 00025 g007
Figure 8. Execution trace with task mapping (TM) and dynamic voltage frequency scaling (DVFS) decisions and their effects on performance and power.
Jlpea 10 00025 g008
Figure 9. Fluid animate (left) and ferret (right) classification and power traces.
Jlpea 10 00025 g009
Figure 10. IPS/Watt between the proposed WLC-only power governor and the ondemand governor on Odroid XU3.
Jlpea 10 00025 g010
Figure 11. IPS/Watt Comparison between the proposed WLC+MLR and ondemand [54] governors on Odroid XU3.
Jlpea 10 00025 g011
Figure 12. IPS/Watt comparison between the proposed WLC+MLR and ondemand [54] governors on Intel i7, with all cores allocated to the tasks/apps.
Jlpea 10 00025 g012
Table 1. Features and limitations of existing methods when compared with the proposed approach.
ApproachPlatformsWLCValidationAppsControlsSize
[17,18]homo.NosimulationsingleTM+DVFSP
[19]hetero.NosimulationsingleRT, TM+DVFSP
[15]homo.NopracticalsingleRT, DVFSL
[14]hetero.NosimulationsingleOL, TM+DVFSP
[13]hetero.OLpracticalconc.RT, DVFSNP
[16]not CPUs.RTpracticalconc.RT, DVFSNP
This workhetero.RTpracticalconc.RT, TM+DVFSL
Table 2. Number of possible core allocations for different multi-application scenarios.
N-appsBrute ForceValid
12019
2400111
38000309
4 1.6 · 10 5 471
5 3.2 · 10 6 405
6 6.4 · 10 7 185
7 1.28 · 10 9 35
Table 3. Qualitative summary of the inherent key characteristics of PARSEC benchmarks [48].
ProgramApplication DomainTypeParallelization
Model Granularity
Working SetData Usage
Sharing Exchange
bodytrackComputer VisionCPU+memdata-parallelmediummediumhighmedium
ferretSimilarity SearchCPUpipelinemediumunboundedhighhigh
fluidanimateAnimationmemdata-parallelfinelargelowmedium
cannealEngineeringCPUunstructuredmediumunboundedhighhigh
freqmineData MiningCPUdata-parallelfineunboundedhighmedium
streamclusterData Miningmemdata-parallelmediummediumlowmedium
Table 4. Performance counter events.
perf_eventt_nameDescription
INST_RETIREDInstruction architecturally executed.
BUS_CYCLEBus cycle
MEM_ACCESSData memory access.
L1I_CACHEInstruction Cache access.
L1D_CACHE_WBData cache eviction.
L2D_CACHELevel 2 data cache access
L2D_CACHE_WBLevel 2 data cache refill
L2D_CACHE_REFILLLevel 2 data cache write-back.
Table 5. Metrics used to derive classification.
MetricsDefinitions
nipc( I n s t R e t / C y c l e s )( 1 / I P C m a x )
iprc I n s t R e t / C l o c k R e f
nnmipc( I n s t R e t / C y c l e s M e m / C y c l e s )( 1 / I P C m a x )
cmr ( I n s t R e t M e m ) / I n s t R e t
uur C y c l e s / C l o c k R e f
Table 6. Classification details for Odroid XU3.
Metric RangesClass
urr of all cores [0, 0.11]0: low-activity
nnmipc per-core [0.35, 1]1: CPU-intensive
nnmipc per-core [0.25, 0.35)2: CPU+memory
nnmipc per-core [0, 0.25)3: memory-intensive
Table 7. PARSEC applications and their performance counter metrics on XU3.
Applicationsnnmipcnipciprccmrurr
Bodytrack0.3060.4170.5030.7540.603
Ferret0.3840.5600.9780.7391.01
Fluidanimate0.2060.3170.6900.7231.08
Streamcluster0.1660.2860.5700.4650.995
Table 8. PARSEC applications and their performance counter metrics on Intel i7 Processor.
Applicationsiprcnnmipccmr
Bodytrack0.7274499080.5734728730.788333
Caneal0.714420.586420.750138
Fluidanimate0.69499380.505260880.727001
Freqmine0.8670860530.6295533770.726056
Streamcluster0.3701021440.2481350250.67045
Table 9. RTM control decisions.
ClassFrequencyA7A15
0minsinglenone
1maxnonemax
2minmaxmax
3maxmaxnone
unclassifiedminsinglenone
Table 10. Percentage IPS/Watt imporovement of the RTM over the Linux ondemand governor, all with Odroid XU3.
Application ScenariosWorkload Classification (WLC)Multivariate Linear Regression (MLR)MLR + WLC
Fluidanimate alone127%127%139%
Two different class applications68.60%61.74%128.42%
Three different class applications46.60%29.30%61.27%
Two Class 3 applications24.50%19.81%40.33%
Three Class 3 applications44.40%36.40%58.25%
Two Class 1 applications31.00%26.53%41.74%

