1. Introduction
The extensive use of Internet-of-Things (IoT) will be the driver of the ongoing digitization in many application domains, as in smart living and working environments, smart cities, health care industry automation, automotive, and avionics. IoT is a pervasive technology that increasingly captures the attention of researchers, industry, and governments. Computational tasks are mapped on a larger number of distributed IoT nodes, having increased connectivity through device-to-device communication. Operations can be deployed into a sea of devices, their execution time can be reduced and smart behaviors can be established in such distributed systems. Three characteristics turn the IoT paradigm relevant in modern systems:
- (i)
Number of connected devices: it is estimated that by 2021, 28 billion devices will be part of IoT [
1];
- (ii)
Economical impact: by introducing automated and smart processes, the IoT is foreseen to achieve the mark of 11 trillion US Dollars by 2025 [
2]; and
- (iii)
Integration: IoT devices will integrate into a broad spectrum of markets, including different industry and service markets.
Increasingly complex and powerful Systems-on-Chips (SoCs), connected via wireless communication technologies as WLAN, WPAN, Bluetooth, or 5G networks, form the basis of the IoT. Multi-Processors System-on-Chips (MPSoCs) are considered as an increasingly important key enabler technology for the implementation of IoT nodes. They are composed of two main structural types of components:
- (i)
the computation structure, composed of Processing Elements (PEs) such as: processors, hardware accelerators, memories, peripherals, and other Intellectual Property (IP) hardware cores to process and store information; and
- (ii)
the MPSoC internal communication infrastructure, which performs the data exchange among the IP cores.
Networks-on-Chip (NoCs) are the communication structure choice for MPSoCs that integrate a large amount of IP cores. NoCs integrate routers and links to exchange information being wrapped as packets.
NoC-based SoCs allow a very flexible task deployment onto the MPSoC’s computational nodes. This flexibility also enables enhanced dependability concepts [
3,
4], providing fault-tolerance and, with this, a high-level of reliability in case of wear-out of some of the chip’s nano-scaled structures. In order to detect deviations in the system health state, critical resources (as routers) have to be equipped with local health monitoring technology (hardware fault checkers). Since these put a certain linear overhead on the hardware size, the routers should be designed as minimalist as possible. This goes well along with the requirement of energy-efficient and sustainable operation of the MPSoC-based IoT component.
Security is a major requirement for all IoT domains. The configurability and hyper-connectivity of these devices represent a risk to the system. Since these systems are connected to the internet, it is more convenient for the developers to enable them to download software code and firmware updates remotely. However, the downloaded software may be malicious. This can lead to retrieving secret information (secret keys and intellectual property), modifying the system’s operation or disrupting its services. One of the approaches for disrupting the services in NoC-based MPSoCs is by means of Denial of Service (DoS) attacks. Since the NoC is a shared communication medium, any disruption of or obstruction to the efficient computation or communication services will affect other system services. The goal of the attacker is to prevent the completion of a sensitive task (e.g., data encryption, trigger of an alarm), so that users decide to turn off the encryption or to migrate tasks to an alternative infected neighbor device (when tasks are deployed in the IoT infrastructure).
In NoC-based MPSoCs, Denial of Service (DoS) attacks typically originate from infected IP cores, which execute malicious software. The goal of the attacks is to interfere with and degrade the sensitive data communication by injection of malicious traffic, thus communication time-line constraints are missed. The Worldwide Infrastructure Security Report classifies DoS attacks into three categories [
5]:
- (i)
Volumetric: the objective is to cause congestion at a single injection point in order to overwhelm the NoC’s bandwidth;
- (ii)
State-exhaustion: the goal is to try to use up all available NoC connections; and
- (iii)
Connection-based (Application-Layer Attacks): exploitation of priority-based NoCs in order to monopolize the NoC communication.
These three classes can be directly applied in NoC infrastructures, which result in an increase in the end-to-end communication latency of the sensitive packet flows [
6]. Previous published research outlines the possibility of executing DoS attacks in NoCs and propose new router architectures to mitigate them. However, this protection countermeasures usually have a heavy impact on network communication and/or router complexity. Moreover, in order to create effective countermeasures that neutralize threats, as well as to enable dynamic and customized DoS protection methods, the attacker’s location needs to be identified. However, identifying the attacker’s location is a complex task, especially when considering minimalist hardware requirements for NoC routers design.
In this work we analyze the size of the attack suspect search space (i.e., the number of nodes to be checked based on the detection information) using the information about the collision location and the direction of the attacker packets. We show that by knowing not only the collision location, but also the input direction of the malicious packets, the search space can be reduced a maximum of 69%. Later we propose two online monitoring mechanisms able to provide the above mentioned information to the NoC’s system manager. Subsequently, we present an analysis of different attack configurations, showing their effectiveness. The experimental results show the proposed approaches’ efficacy and efficiency to detect the DoS attacks, identify the collision point of malicious and sensitive data, and find the direction from which the malicious packets enter the sensitive path.
The rest of this paper is organized as follows:
Section 2 describes the state of the art in defense against DoS attacks in NoCs.
Section 3 and
Section 4 describe the baseline framework used for analysis and the threat model considered for this work.
Section 5 analyses the benefits of acquiring detailed information about the point of collision during a DoS attack.
Section 6 presents the proposed approaches to acquire such information.
Section 7 presents the experimental results and finally
Section 8 concludes the paper.
2. Literature Review
The concept of DoS in the NoC context was introduced in [
7]. Subsequently, approaches with different mitigation strategies for these kinds of attacks have been proposed [
7,
8,
9,
10,
11,
12,
13,
14,
15,
16,
17,
18]. Such approaches can be categorized in two main classes:
DoS Avoidance and
DoS detection and recovery. The first focuses on providing an infrastructure to avoid such attacks altogether (see
Section 2.1). On the other hand, the second tries to identify the occurrence of such attacks and disabling them (see
Section 2.2). The latter can be divided into two sub groups: works which focus on techniques for detecting the occurrence of the attack, but cannot detect the location of the node which runs malicious code, and works that can also identify the location of the attacker.
2.1. DoS Attack Avoidance
In [
8] a mitigation strategy based on the hybrid switching routing mechanism is proposed. Circuit switching is used for sensitive traffic and packet switching is used otherwise. As a result, predictable latency for sensitive traffic is guaranteed. The works of [
9,
11,
12] mitigate DoS and timing attacks by generation of security zones. Their proposal ensures that only the secure nodes can communicate into a virtual and physical space, respectively. Security zones are built through dynamic routing. In [
13] non-sensitive traffic is deeply inspected in order to access to security zones. The works of [
11,
12] reroute the traffic outside from the security zone. On the other hand, the authors of [
7] propose the use of separate virtual channels for secure and non-secure packets as a countermeasure for bandwidth denial attacks in NoCs. However, this approach suffers from the hardware overhead of additional buffers used for virtual channels.
2.2. DoS Attack Detection and Recovery
In [
14], authors consider that DoS attacks are executed by a rogue third-party NoC architecture. When a suspicious communication delay is detected between two nodes, the firmware tries to identify if the attack is taking place at the source or at the destination by time-stamping the packets and dividing into two communication paths. In [
15], Fiorin et al. provide an overview of the attacks in network on chips. The authors propose the use of buffer occupancy monitors to detect traffic anomaly in the network but provide no details on the technique. Later, in [
10], Fiorin et al. proposed the implementation of denial of service probes in the Network Interface. This approach only covers the DoS attacks from the Processing Elements connected to the network interface by detecting deviations from the average bandwidth usage expected at the design time. This approach does not actively monitor the latency of the sensitive packets in the network. In [
16], Diguet et al. tackle DoS attacks by monitoring live-lock occurrence in the network. However, this approach utilizes source-routing, which imposes considerable overhead to the packet size. In [
17], Grammatikakis et al. target distributed DoS attacks via a firewall in control of configurable access rules in the network interface. The security risk is evaluated by the product of frequency and magnitude of losses (by dropping the packets at the Network Interface). Although such a firewall does not allow the DoS attack to be effective, it was designed to protect the destination PE (i.e., the on-chip memory), thus it does not detect the source of the attach, nor does it kill the attack-related traffic congesting the network. In [
18], Achballah et al. target computation of occupation time of the physical links in number of clock cycles. The occupation time of the physical link is compared to an expected value. In case of the link occupation exceeding this value, the transaction will be stopped and a notification will be sent to the system’s manager. Here the decision is made locally in the router, which may lead to undesirable packet dropping.
The evaluation of the related works shows that the DoS attack avoidance approaches require significant additional hardware effort in the routers and the system. Since scalable NoCs need an overall dependability management [
19], the router size should be as minimal as possible (e.g., no virtual channels).
Our proposed approaches can be classified under DoS Attack Detection and Recovery, since they analyze communication degradation in order to detect DoS attacks. Additionally, once an attack is detected, they proceed to reduce the attack suspects so that the attacker can be located and neutralized.
Even though the works listed in
Section 2.2 seek the same objective as our approaches, they either are limited to parameters defined at design time or to the source routing algorithm. In contrast, the decision parameters of our approaches are controlled by the system manager, and, as explained along the paper, our proposed diagnosis mechanisms can be of use for different routing algorithms, making them more flexible when compared to the other approaches.
Furthermore, we propose an architecture of scalable distributed monitoring solutions for NoC traffic, in order to diagnose DoS attacks and identify attack characteristics, that help to find the source of the attack. These monitors transmit relevant performance information that is analyzed at the endpoint of the communication. We considered two diagnosis mechanisms based on the approaches for search space reduction mentioned above. The first, called Collision Point Router Detection (CPRD), identifies the router where the attacker’s malicious packets collide with the sensitive packets. The second approach, called Collision Point Direction Detection (CPDD), extends the CPRD by not only identifying the point of collision, but also the input port through which the attacker’s flow intercepted the sensitive path. The importance of such an extension is explained in
Section 5, where the two approaches are compared.
3. Router Architecture
Bonfire is an open-source framework for developing dependability mechanisms for NoC-based Systems-on-Chip (SoCs). The target NoC architecture is a 2D mesh topology. Each network tile consists of a wormhole switching router equipped with fault tolerance mechanisms and a Network Interface (NI), which is connected to the local resource. The routers use credit-based flow-control and support any turn-model-based minimal path adaptive routing algorithm [
19,
20].
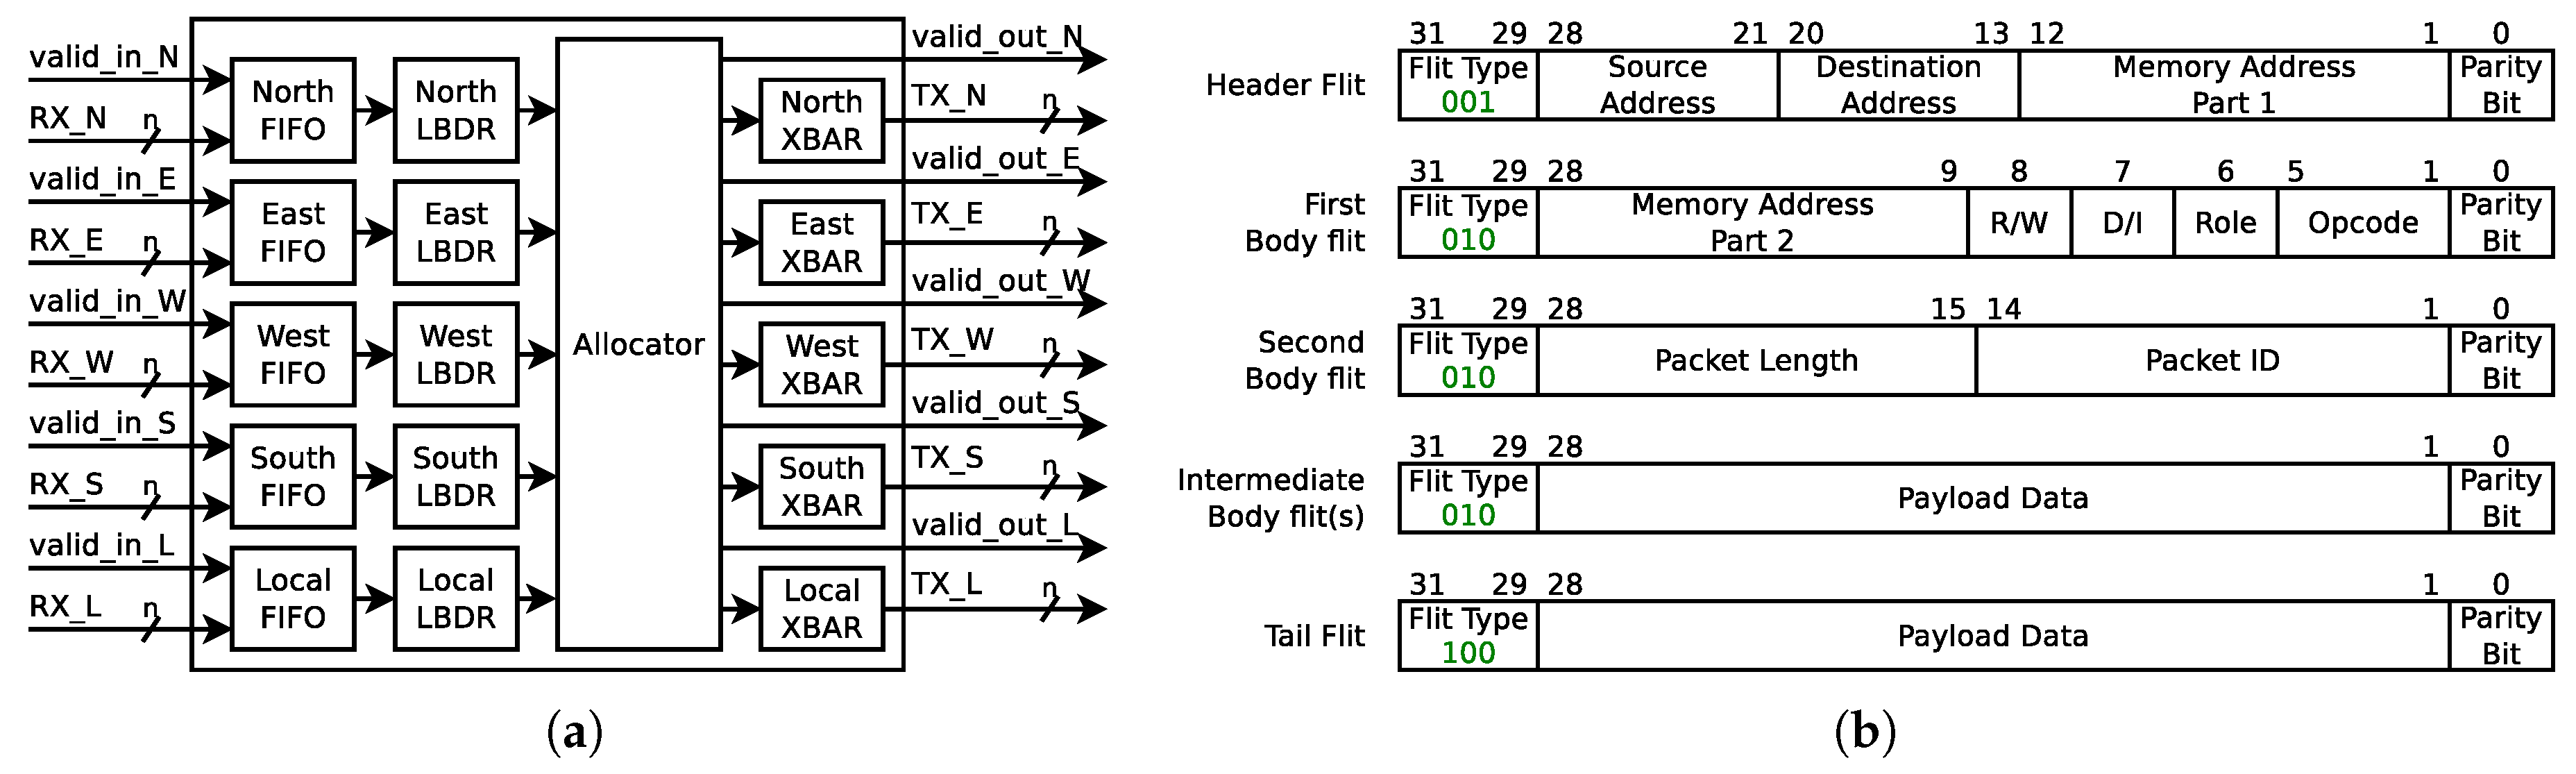
Figure 1a shows a block diagram of the credit-based router used in this work. This router contains input buffers and routing units for each input port, one switch allocator that provides support for any turn-model based adaptive, a minimal path routing algorithm, and a crossbar switch for each output port. In credit-based flow-control, each upstream router keeps track of empty buffers in the downstream router and sends the flits with the assumption that the downstream router can receive them. The FIFO unit utilizes a 4-flit deep circular buffer and is in charge of issuing a credit signal to the upstream router. The routing logic is implemented using a Logic Based Distributed Routing (LBDR) mechanism [
21], which is a lightweight distributed routing mechanism that supports any turn-model based routing algorithm and provides the possibility of an in-system reconfiguration of the routing algorithm.
The allocator unit utilizes a Round Robin arbitration, where each input direction can hold access to an output port for the length of a single packet. This arbitration mechanism has an important impact on the resilience of the network to DoS attacks, since it prevents the starvation of packets entering the router through other input ports.
Figure 1b shows the packet format used by the Secure Bonfire variant of the Bonfire framework. This packet format is designed to be compatible with the Open Core Protocol (OCP) and each body flit carries a payload of 28 bits.
4. Threat Model
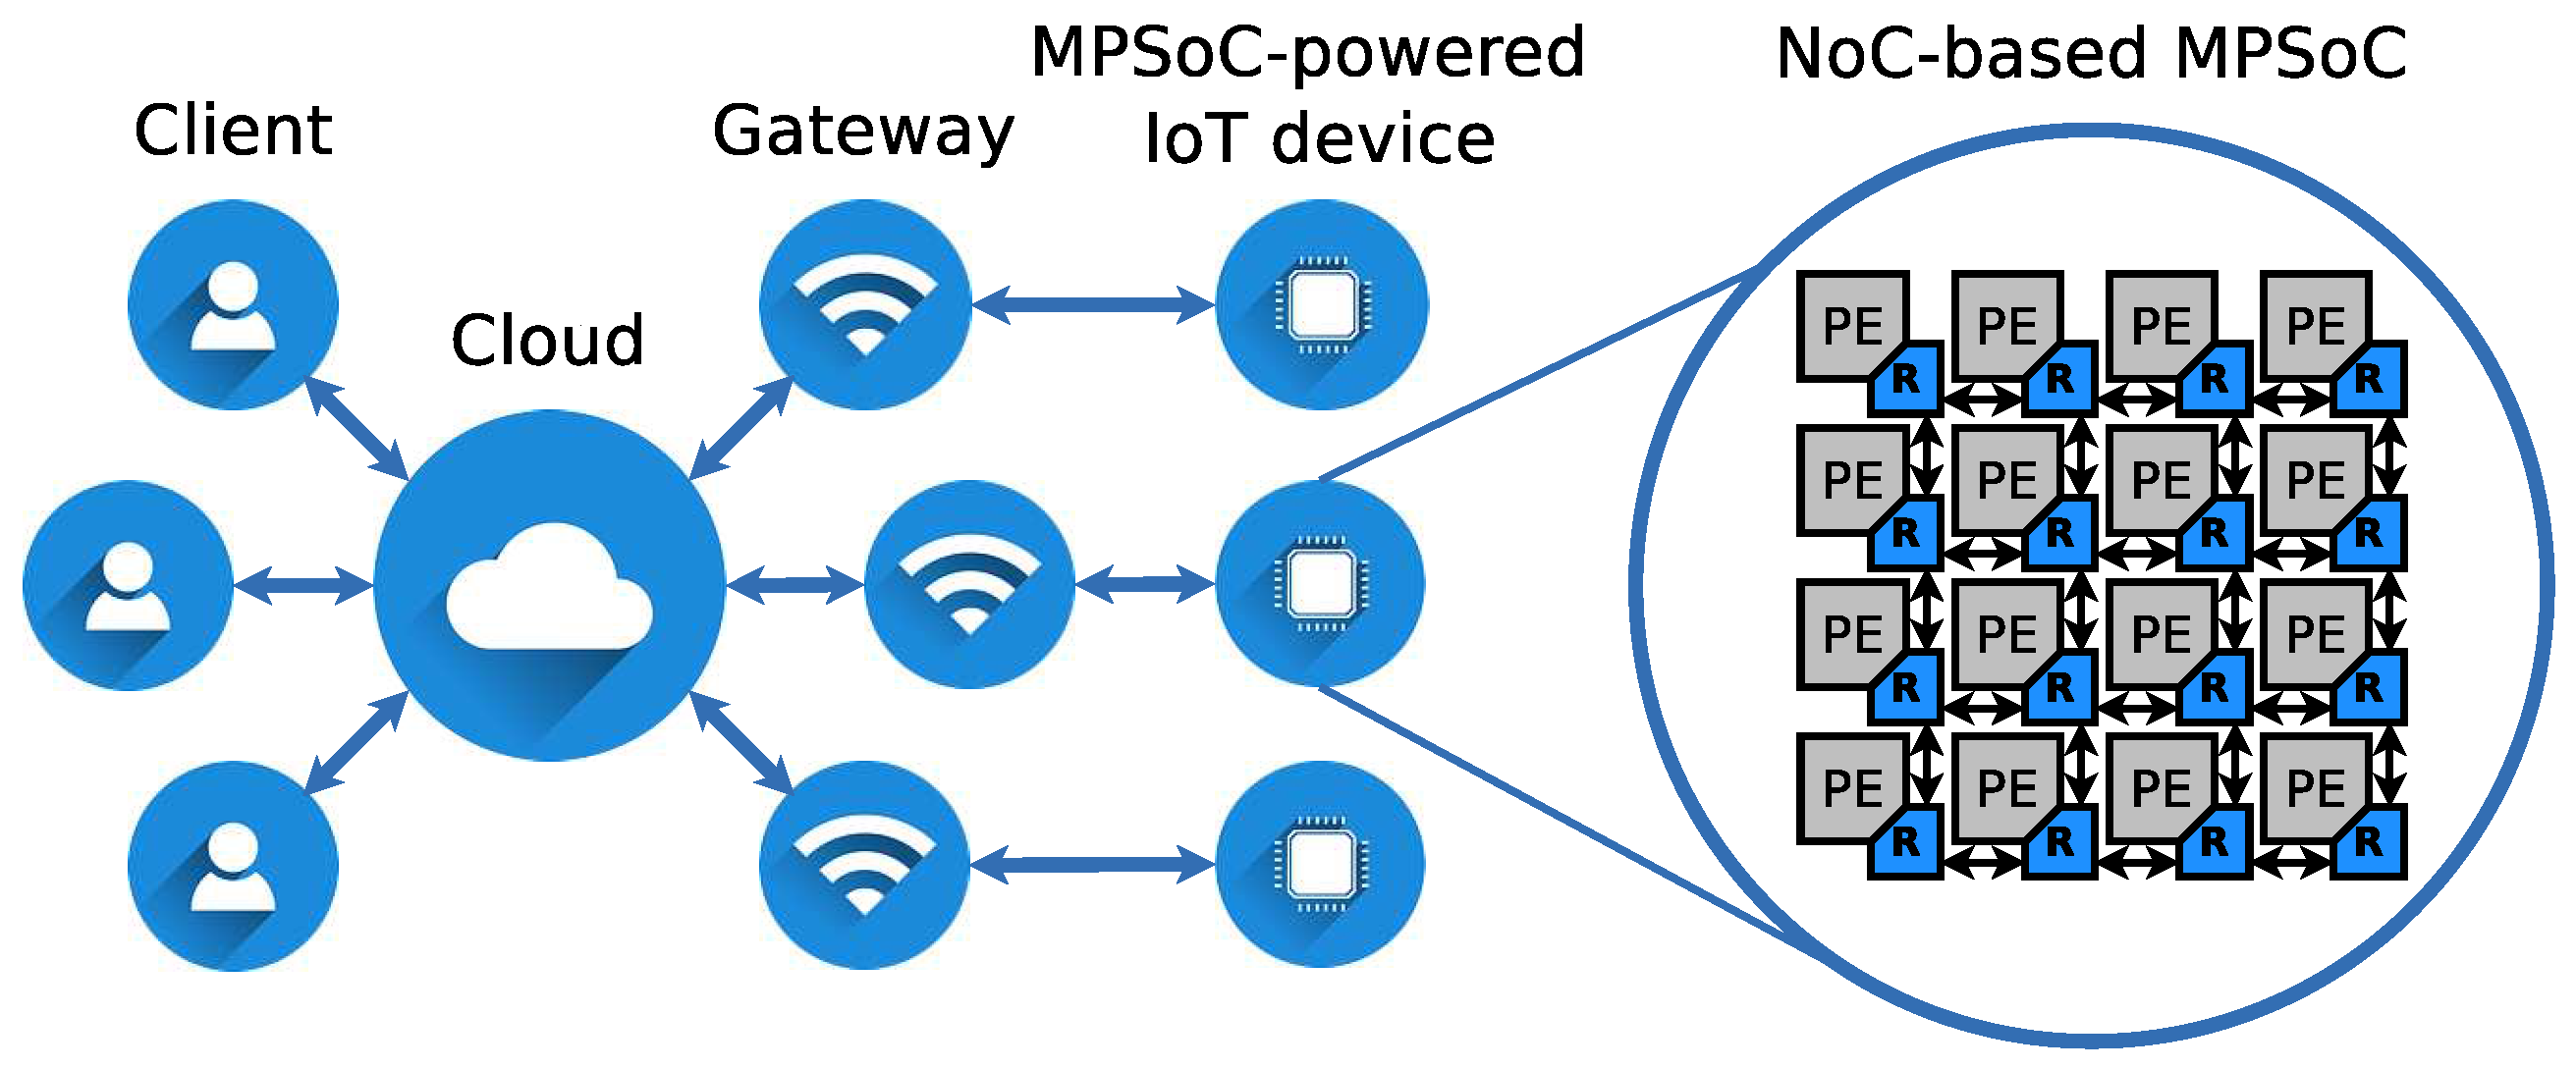
MPSoCs with a heterogeneous array of PEs provide programmability and parallelism, yielding flexibility, processing performance and power efficiency, which can be leveraged for minimizing the latency of communication links of the edge cloud [
22]. An example of such a scenario is depicted in
Figure 2, where IoT devices, equipped with NoC-based MPSoCs, improve the performance of conventional general-purpose computer execution environments by adding application specific circuits. However, this junction brings new security vulnerabilities to the NoC-based MPSoC world, such as susceptibility to DoS attacks, as will be explained in this section.
Attack Scenario: During a DoS attack, an attacker seeks to degrade the performance of a processing/communication environment, which in the scope of this work is represented by a NoC-based MPSoC. In an environment, such as the one illustrated in
Figure 2, users submit their applications for execution on MPSoC-powered IoT devices. Subsequently, a task scheduler in the firmware of the IoT device, during its normal operation, maps the applications to the PEs of the incorporated MPSoC. However, one or more of those applications could have been submitted by a user with the intention of performing a DoS attack to the NoC. Moreover, the most common DoS attack method is network flooding, where a malicious application running on any PE of the MPSoC is able to do by sending packets to another PE in the NoC. These additional packets compete for the crossbars of the routers in their path, and, while successful, block the transmission of other packets. Blocked packets experience an increment of their forwarding delays, which results in an overall additional communication delay that will be unacceptable by time sensitive applications.
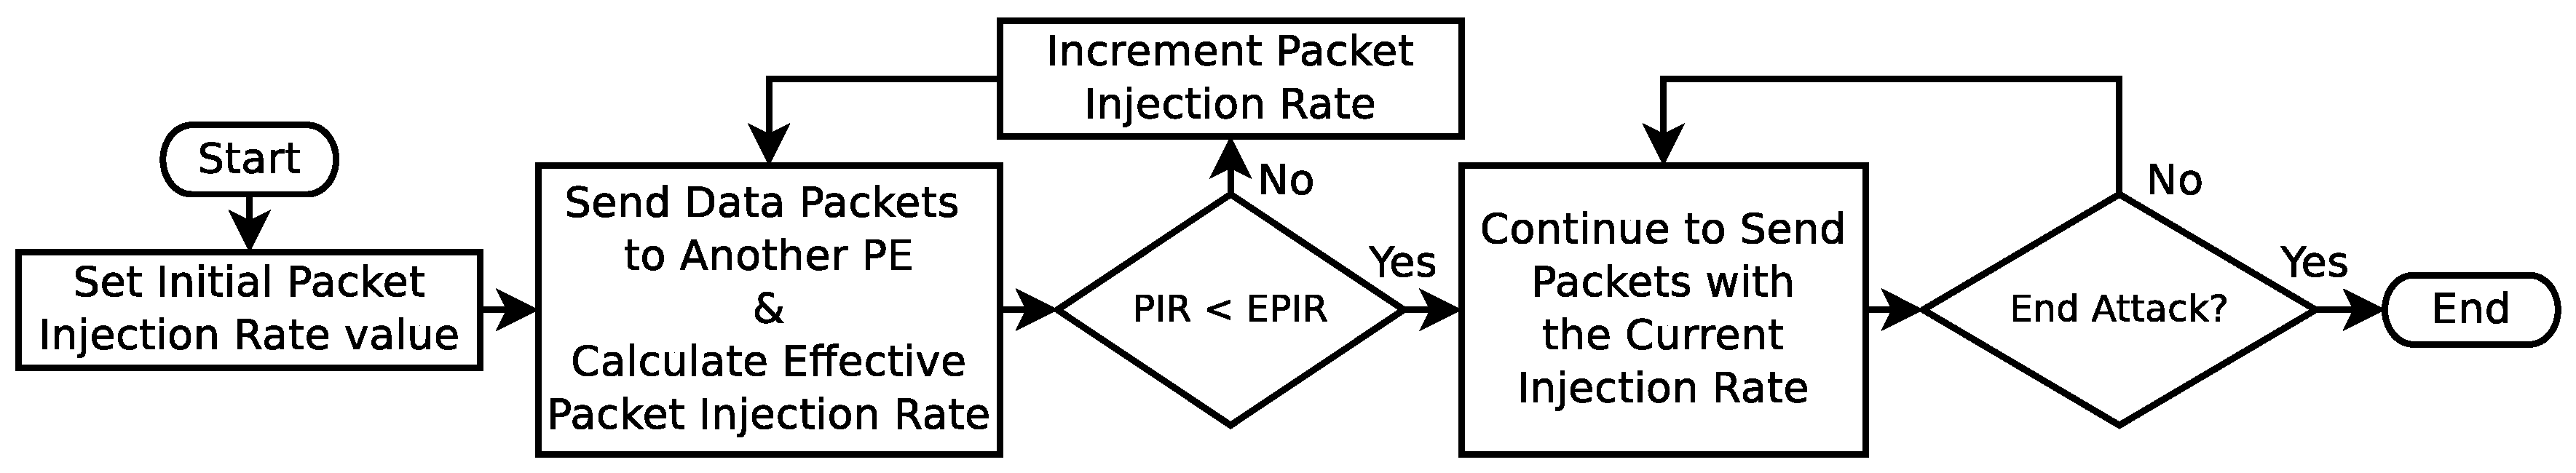
Attack Steps: A malicious user (a.k.a. an attacker), submits his/her application to the execution platform as any other user. Subsequently, a task scheduler maps the application to the PEs of the MPSoC in order to start its execution. A basic procedure being followed by a simple malicious application, whose goal is to attempt a flooding DoS attack on a NoC, is depicted in
Figure 3. First, the malicious application sets its Packet Injection Rate (PIR) to an initial value. Then, packets are transmitted to another PE in the NoC at the defined PIR. As the packets are transmitted, the application calculates the Effective PIR (EPIR) in order to assess the congestion of the NoC, which reflects the effectiveness of the attack [
23]. If the NoC is still not congested (i.e., PIR = EPIR), the application continues to send packets increasing the PIR value. Finally, once the application establishes that its attack is being effective, it continues to send packets maintaining the current PIR until the end of the attack.
Attack Success Conditions: For a successful attack to be launched on a NoC-based MPSoC, the following conditions must be met:
The attacker packets should be able to interfere with the flow of sensitive packets in at least one location. This means that both traffic flows should compete for at least a single router output. Assuming that the attacker might not have prior knowledge of the network segments used by the sensitive traffic, setting long paths for the malicious traffic will increase the probability of colliding with the sensitive traffic.
The attacker can control its own packet injection rate into the network. The attacker then can increase the injection rate and monitor its own throughput. Based on its throughput information, an attacker can infer if its traffic has interfered with other traffic in the network [
23]. Additionally, depending on the router’s arbitration, a burst of packets can hold a crossbar grant, causing the starvation of other packets.
The attacker node should be able to control the length of the packets that it injects into the network. In practice, a single input direction cannot hold an output longer than the duration of a single packet (e.g., Bonfire that uses wormhole switching with round robin arbitration in a per packet basis). Thus, longer packets occupy the crossbar longer and consequently generate a longer inter-router forwarding delay to sensitive packets, which is reflected in the end-to-end communication delay.
5. Analysis of Attack Suspects
In order to mitigate the DoS attacks, it is important that the system manager identifies the physical location of the attacker. However, there is no straightforward approach for acquiring such information. The system manager can only collect indirect or partial information regarding the incident in order to infer the location of the attacker. Without any additional information, excluding the source and destination of the sensitive traffic, the system will have N-2 suspects, where N is the number of nodes in the network. In this section, we assume that the location of the collision and direction of the incoming attacking flow can be recovered during the transmission of a packet. Later we analyze how this information, combined with details of the routing algorithm, can be leveraged towards narrowing down the search space for finding the source of the attack.
This part of the analysis is performed by the use of Routing Graphs [
3]. A Routing Graph,
, is a directed acyclic graph where
V is the set of vertices that represent all network ports (input and output ports of the routers including the local ports) and
E is the set of all edges which represent connections between the input and output ports. The connections in the set
E in
can be of two types: (i) internal; inside a router, between the input and output ports (including turns and other paths inside the router) and (ii) external; the physical link between neighbor routers. By setting the internal connections, it is possible to model any turn-model-based routing algorithm. Moreover, using routing graphs enables the tool to use graph algorithms for finding paths between any source and destination.
Algorithm 1 provides python pseudo code for the steps required for finding all possible attacker suspect nodes, by only considering the location of the router where the malicious and sensitive packets collide. The main idea is to find all the output ports on every path between source and destination, and subsequently to find out how many nodes can send packets to these output ports under minimal path routing.
| Algorithm 1: Attack suspects considering collision location. |
![Jlpea 09 00007 i001]() |
Algorithm 2 provides python pseudo code for the steps required to find all possible attacker suspect nodes by considering the collision router location and the input direction of the malicious packets. The main idea is to find all the output ports on every minimal route path from the source to destination. Subsequently, for each output port, all the possible input ports that can forward packets to this port are checked. Finally, all the local nodes that can send packets to that port via minimal path routing are found, under the current routing algorithm.
In the next subsection, we will describe the process via three examples using the XY routing algorithm for the sake of simplicity. Later we will show the results for adaptive routing as well.
| Algorithm 2: Attack suspects considering collision location and input direction of interference. |
![Jlpea 09 00007 i002]() |
5.1. Example Using XY Routing Algorithm
In this section we explore a simple example based on the XY routing algorithm [
24]. This example is taken due to the simplicity of the routing algorithm. In the next section adaptive routing algorithms will be considered as well.
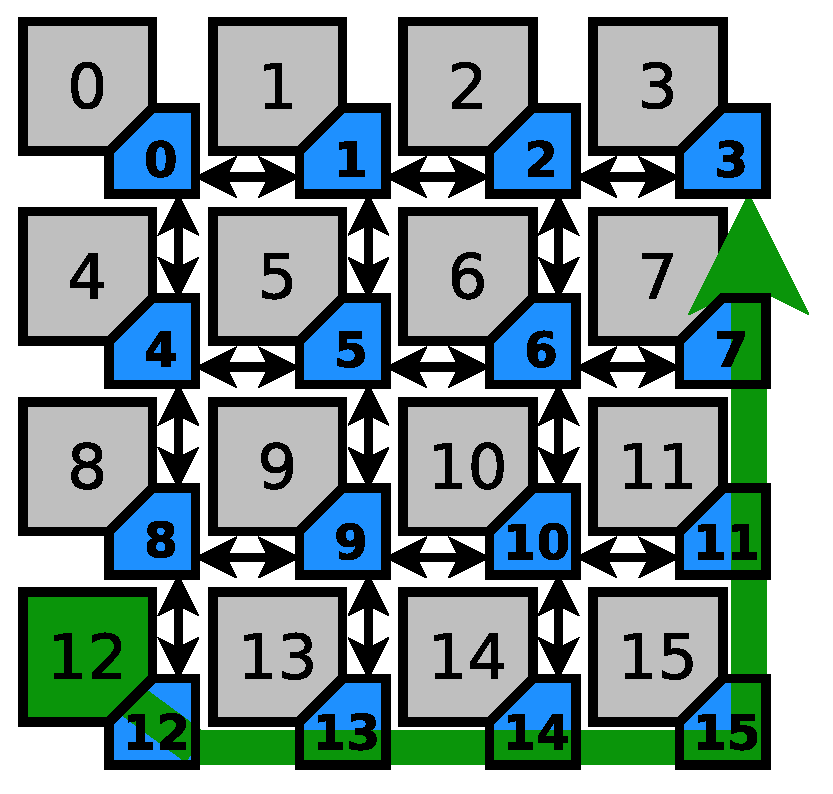
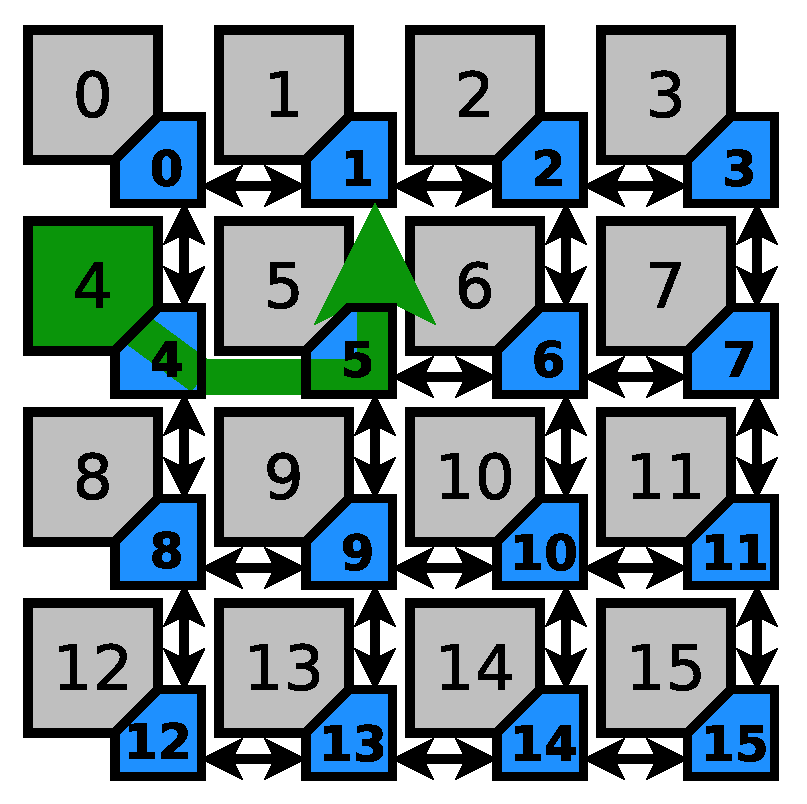
Figure 4 shows the first scenario considered for this exercise. The sensitive path is represented by the green arrow, which begins in router 12 and ends in router 3, going through routers 13, 14, 15, 11, and 7. In case the system manager labels node 13 as the collision point, it has only a single candidate for the attacker, namely node 13, since no other node’s traffic (excluding node 12 as the sensitive source) can request node 13’s east output. However, in more sophisticated cases, the set of candidates is enlarged (as listed in
Table 1). It is important to note that the manager excludes the nodes that have higher chance of collision in their own tile. For example, if the reports label node 14 as the collision point, the manager will not include node 13 as a suspect since it has a better chance of interference on node 13’s east output. This assumption might not hold for coordinated distributed denial of service attacks.
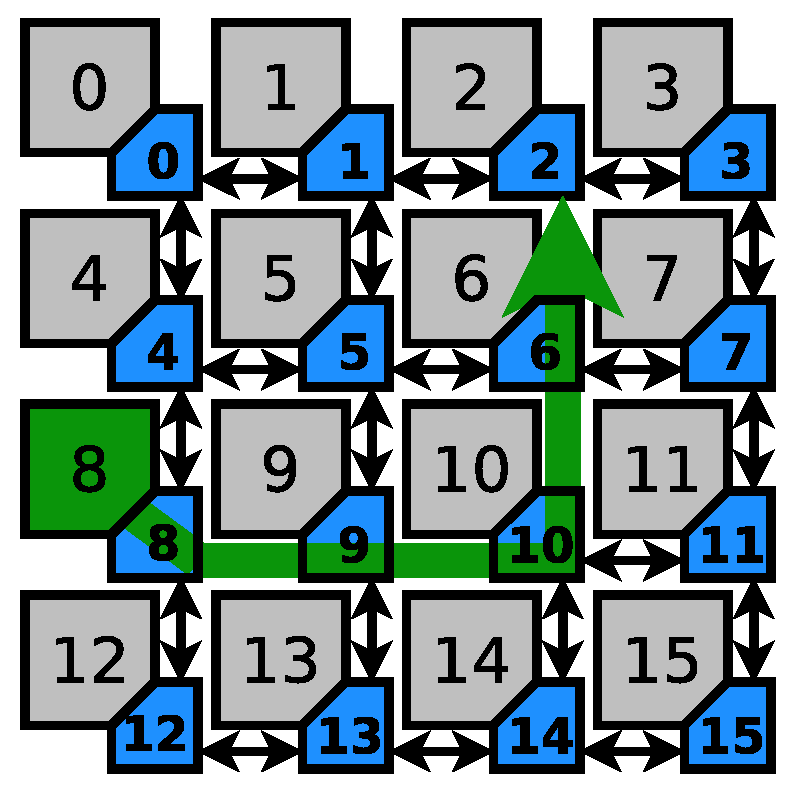
Figure 5 describes a scenario where the source and destinations of the sensitive path are nodes 8 and 2, respectively. This example is different from the previous example in one important aspect: the sensitive path can be interfered with from both sides. This in turn will increase the search space for the possible suspects dramatically. As it can be seen in
Table 2, node 10 is a descriptive example of such a situation. However, knowing the direction of the interference will further decrease the search space (from 6 nodes to worst case number of 4 nodes, and in best case scenario down to a single node).
The scenario depicted in
Figure 6 shows a more extreme case than Scenario 2, where a single node (node 5) has a search space of 11 suspect nodes (refer to
Table 3). Further investigation shows that knowing the direction of interference reduces the number of suspects, in the worst case to 8 nodes and in the best case to 1 node (3.6 nodes on average).
5.2. Discussion
When applying the same method on different routing algorithms, the gain of the proposed mechanisms becomes more clear.
Figure 7,
Figure 8 and
Figure 9 depict the minimum, maximum and average number of attack source suspects to be checked for the three scenarios (i.e., Sensitive paths 1 to 3), for different minimal-path turn-model based routing algorithms. In this analysis the following routing algorithms have been considered: XY [
24], YX [
25], West-First [
26], East-First [
27], North-First [
28], North-Last [
26], Negative First [
26], and South-First [
28]. In this work, the
[
3] framework has been used for modeling the routing graphs for the above mentioned turn models and for evaluating the presented Algorithms 1 and 2 for different scenarios.
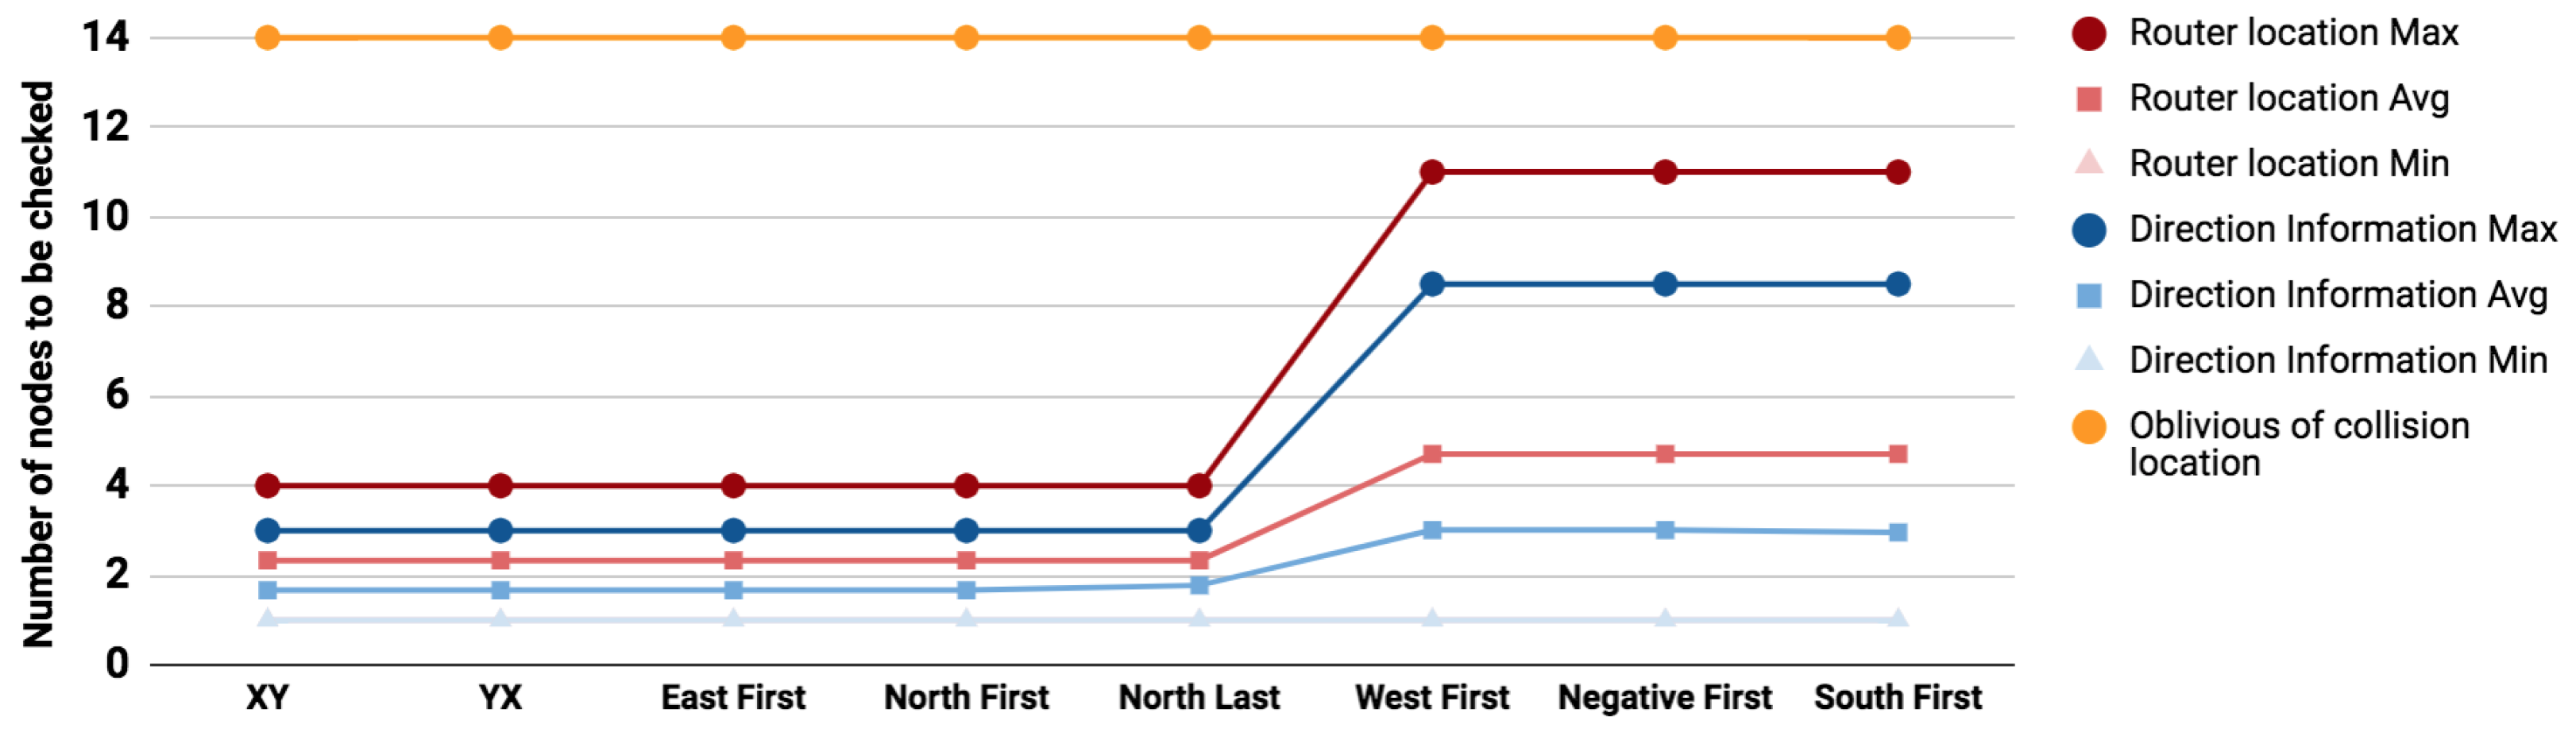
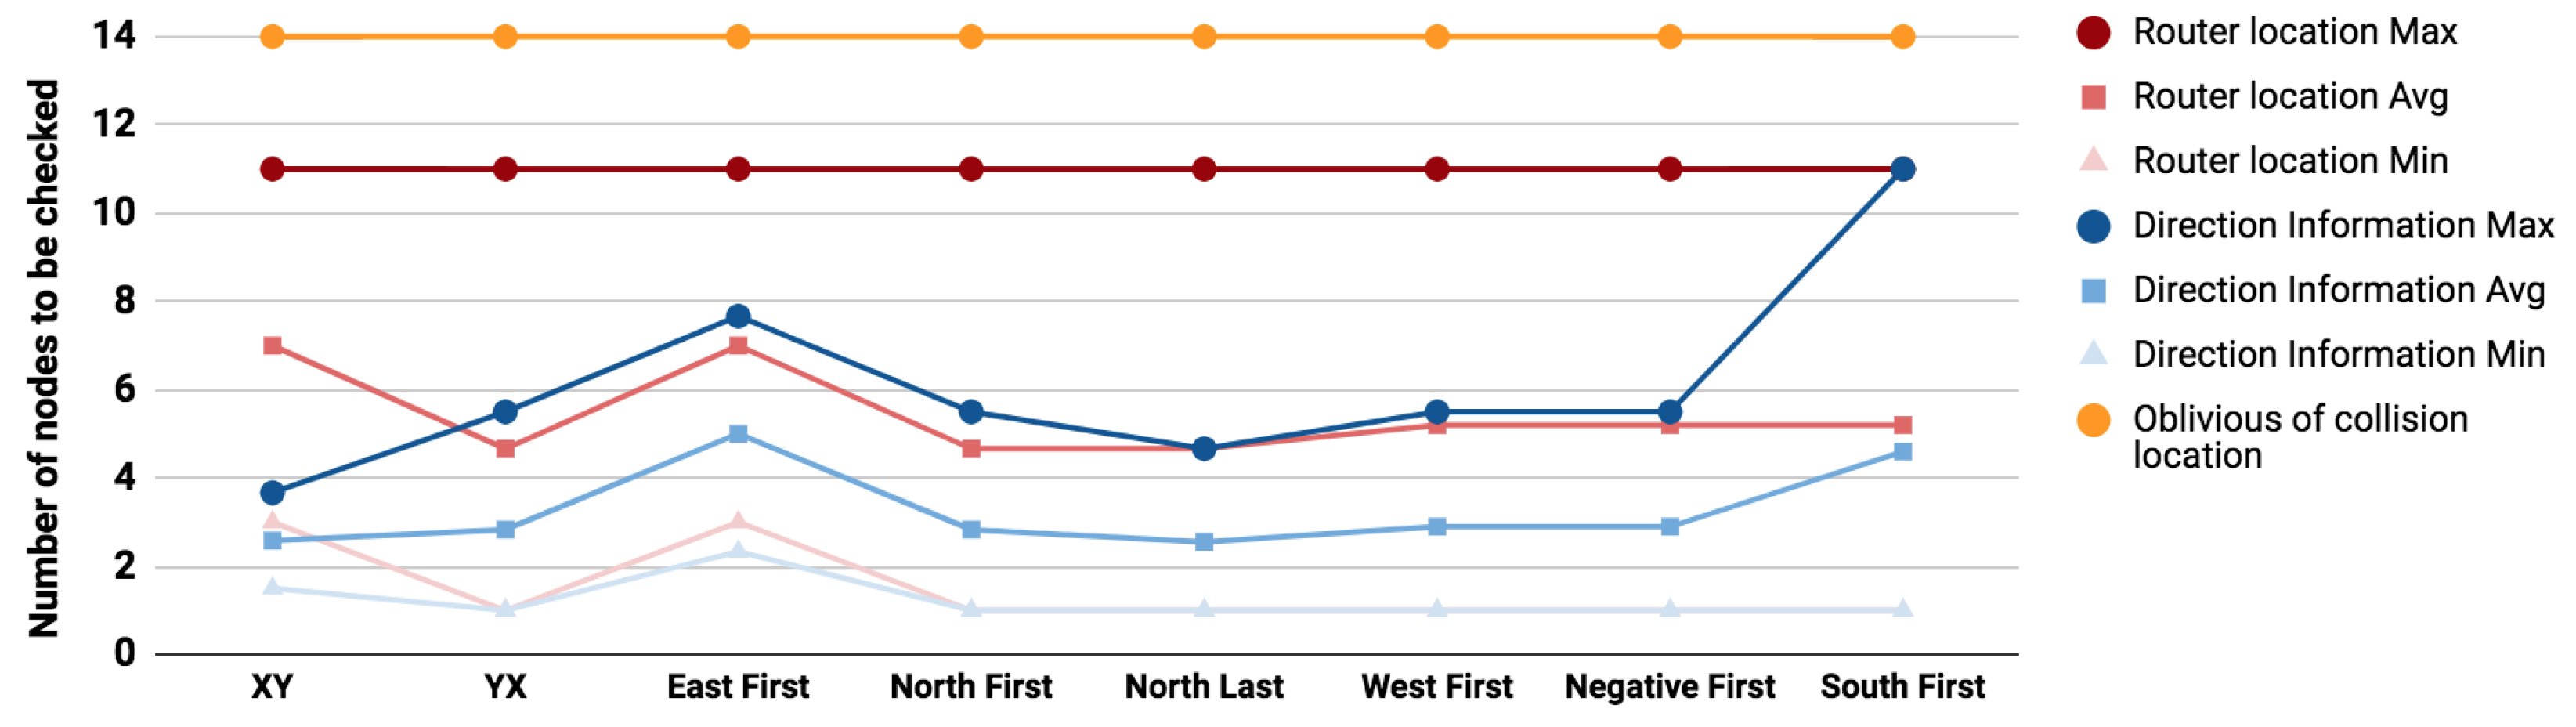
Compared to oblivious search (marked in orange in
Figure 7,
Figure 8 and
Figure 9), the use of router locations will reduce the search space in the worst case effort by 52%, 42%, and 21% for the previously illustrated sensitive paths 1, 2, and 3. Similarly the use of directions will further reduce the worst case effort by 63%, 69%, and 56%. The use of collision direction in locating the attacker source reduces the maximum effort of the location based solution by 24%, 48%, and 44% for paths 1, 2, and 3 respectively and the average effort by 30.6%, 40%, and 39%.
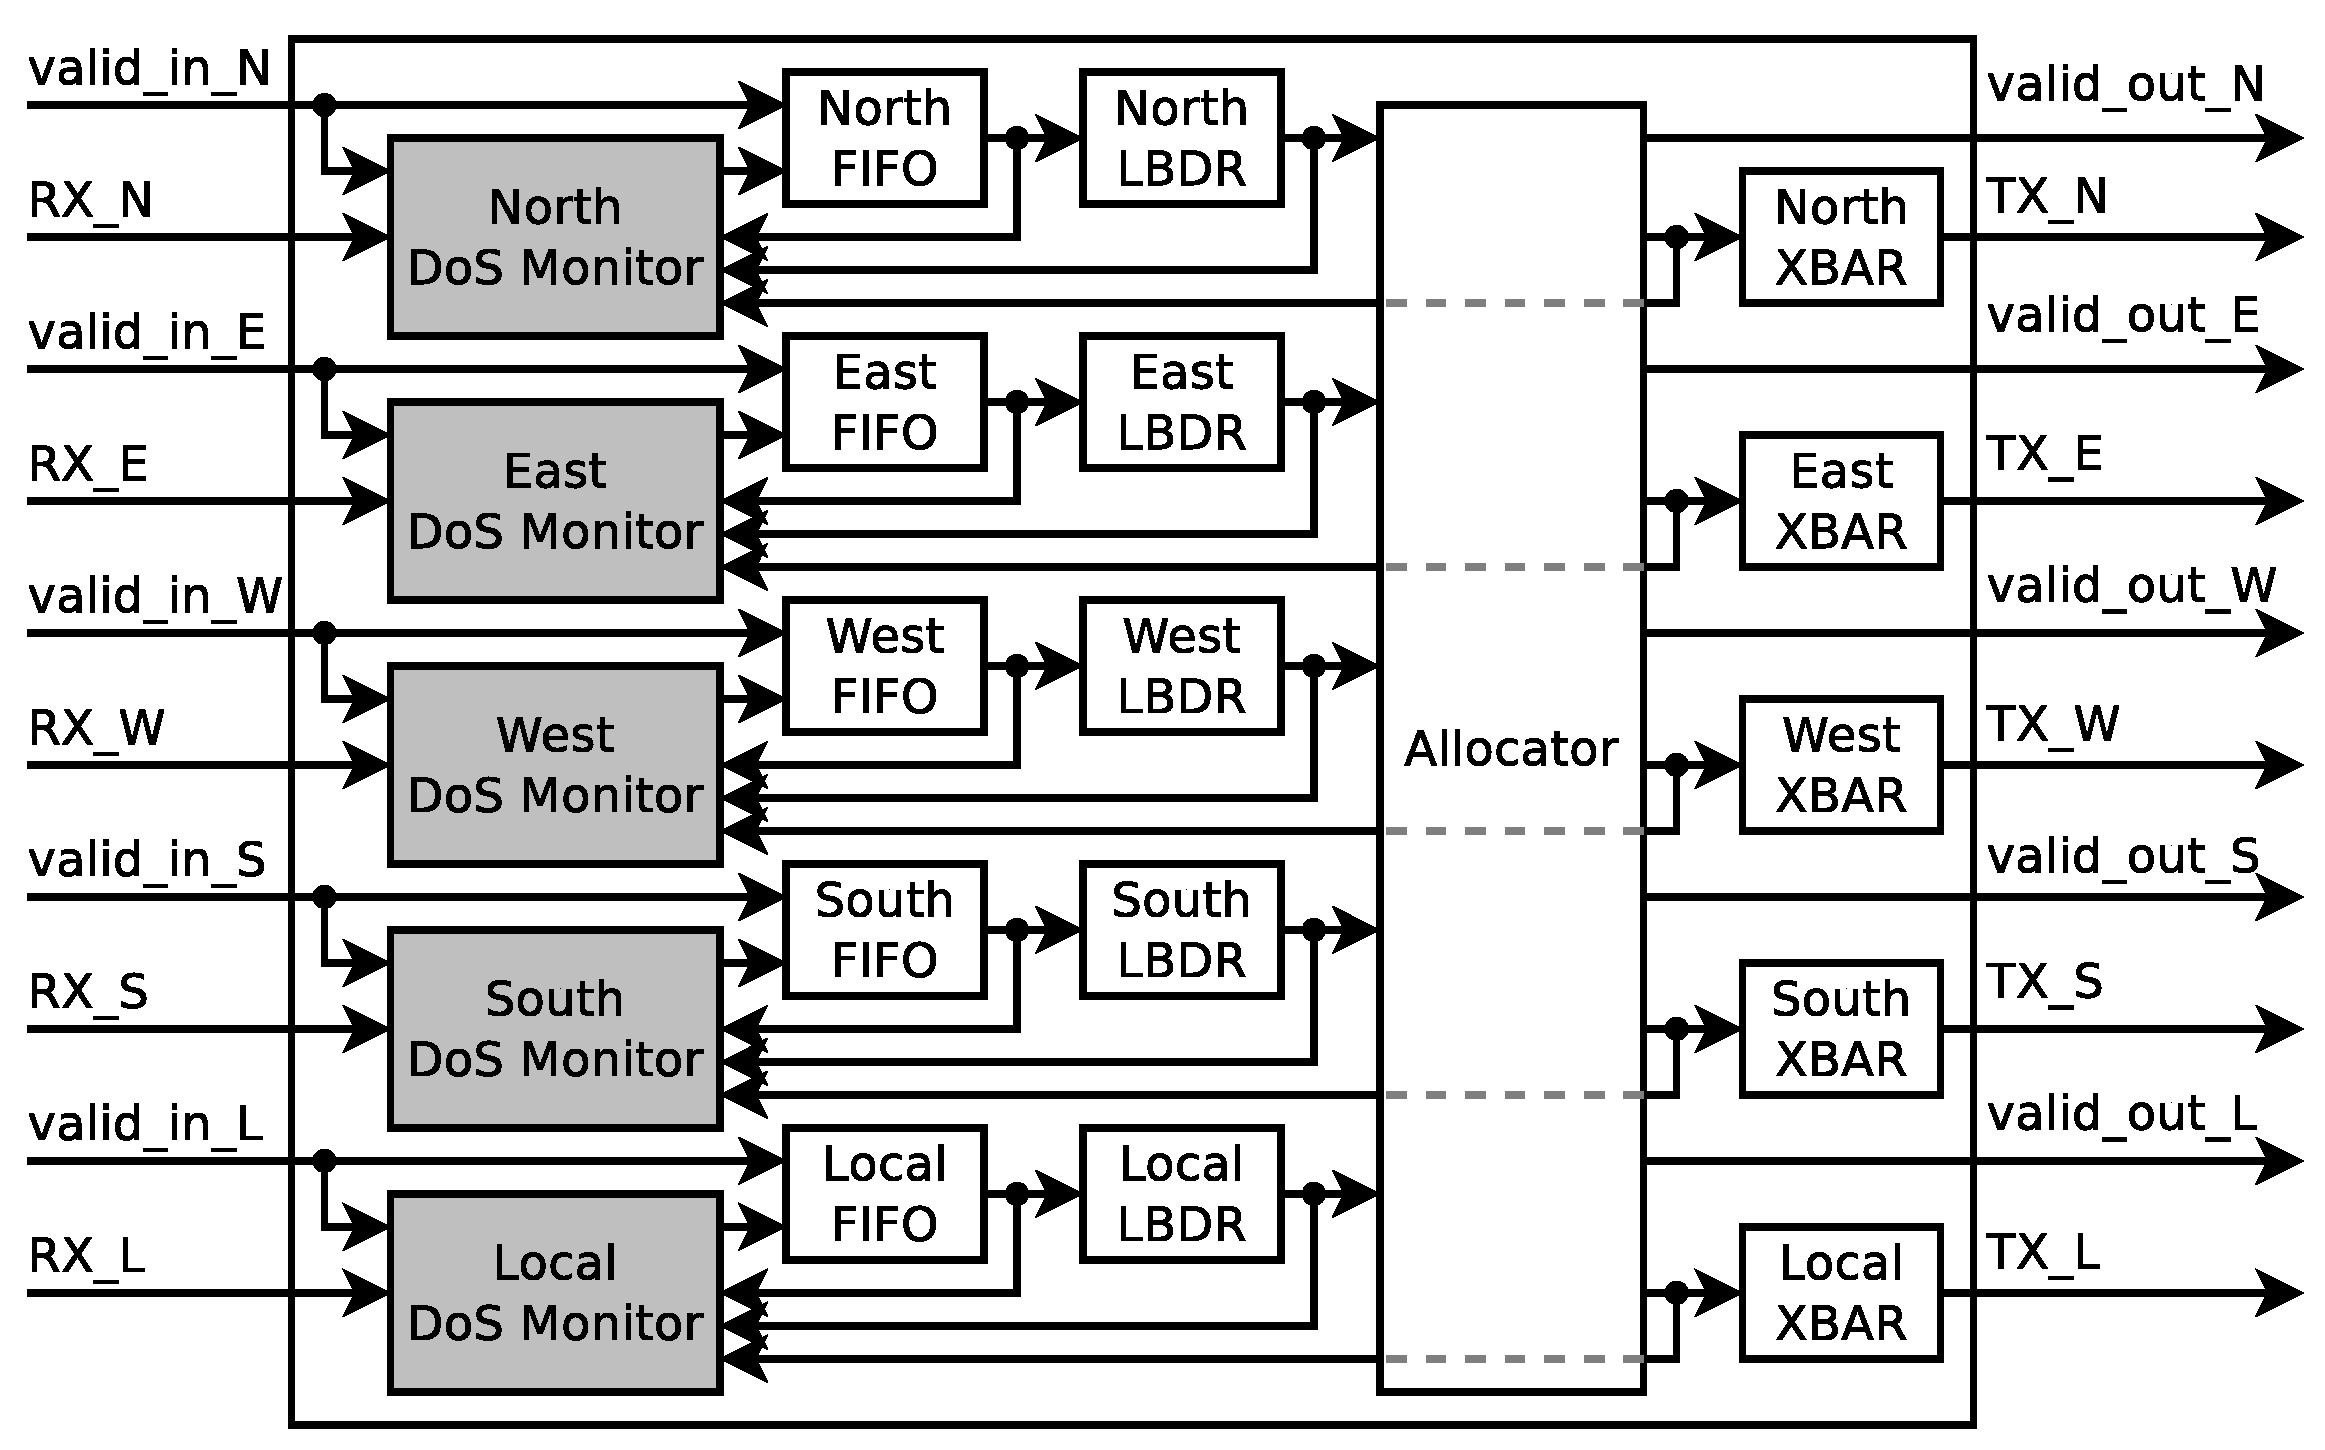
6. Proposed Router Architecture
As explained in the previous section, knowing the location of the router where the malicious packets collide with the sensitive packets and the direction from where they entered the sensitive path drastically narrows down the attacker’s source search space. In this section we introduce the two proposed approaches: One that targets the detection of the collision point router, and another which also targets the detection of the direction from which the colliding packets enter the sensitive path. Furthermore, both approaches are compatible with the same router architecture. The proposed architecture extends the original (presented in Project Bonfire,
Figure 1a), by the addition of
DoS monitors between the input ports and their corresponding FIFOs, as depicted in
Figure 10. Apart from the packets, the DoS monitors also receive information regarding all the output requests and grants, which they process according to the chosen approach. The details of these methods are explained in the following subsections.
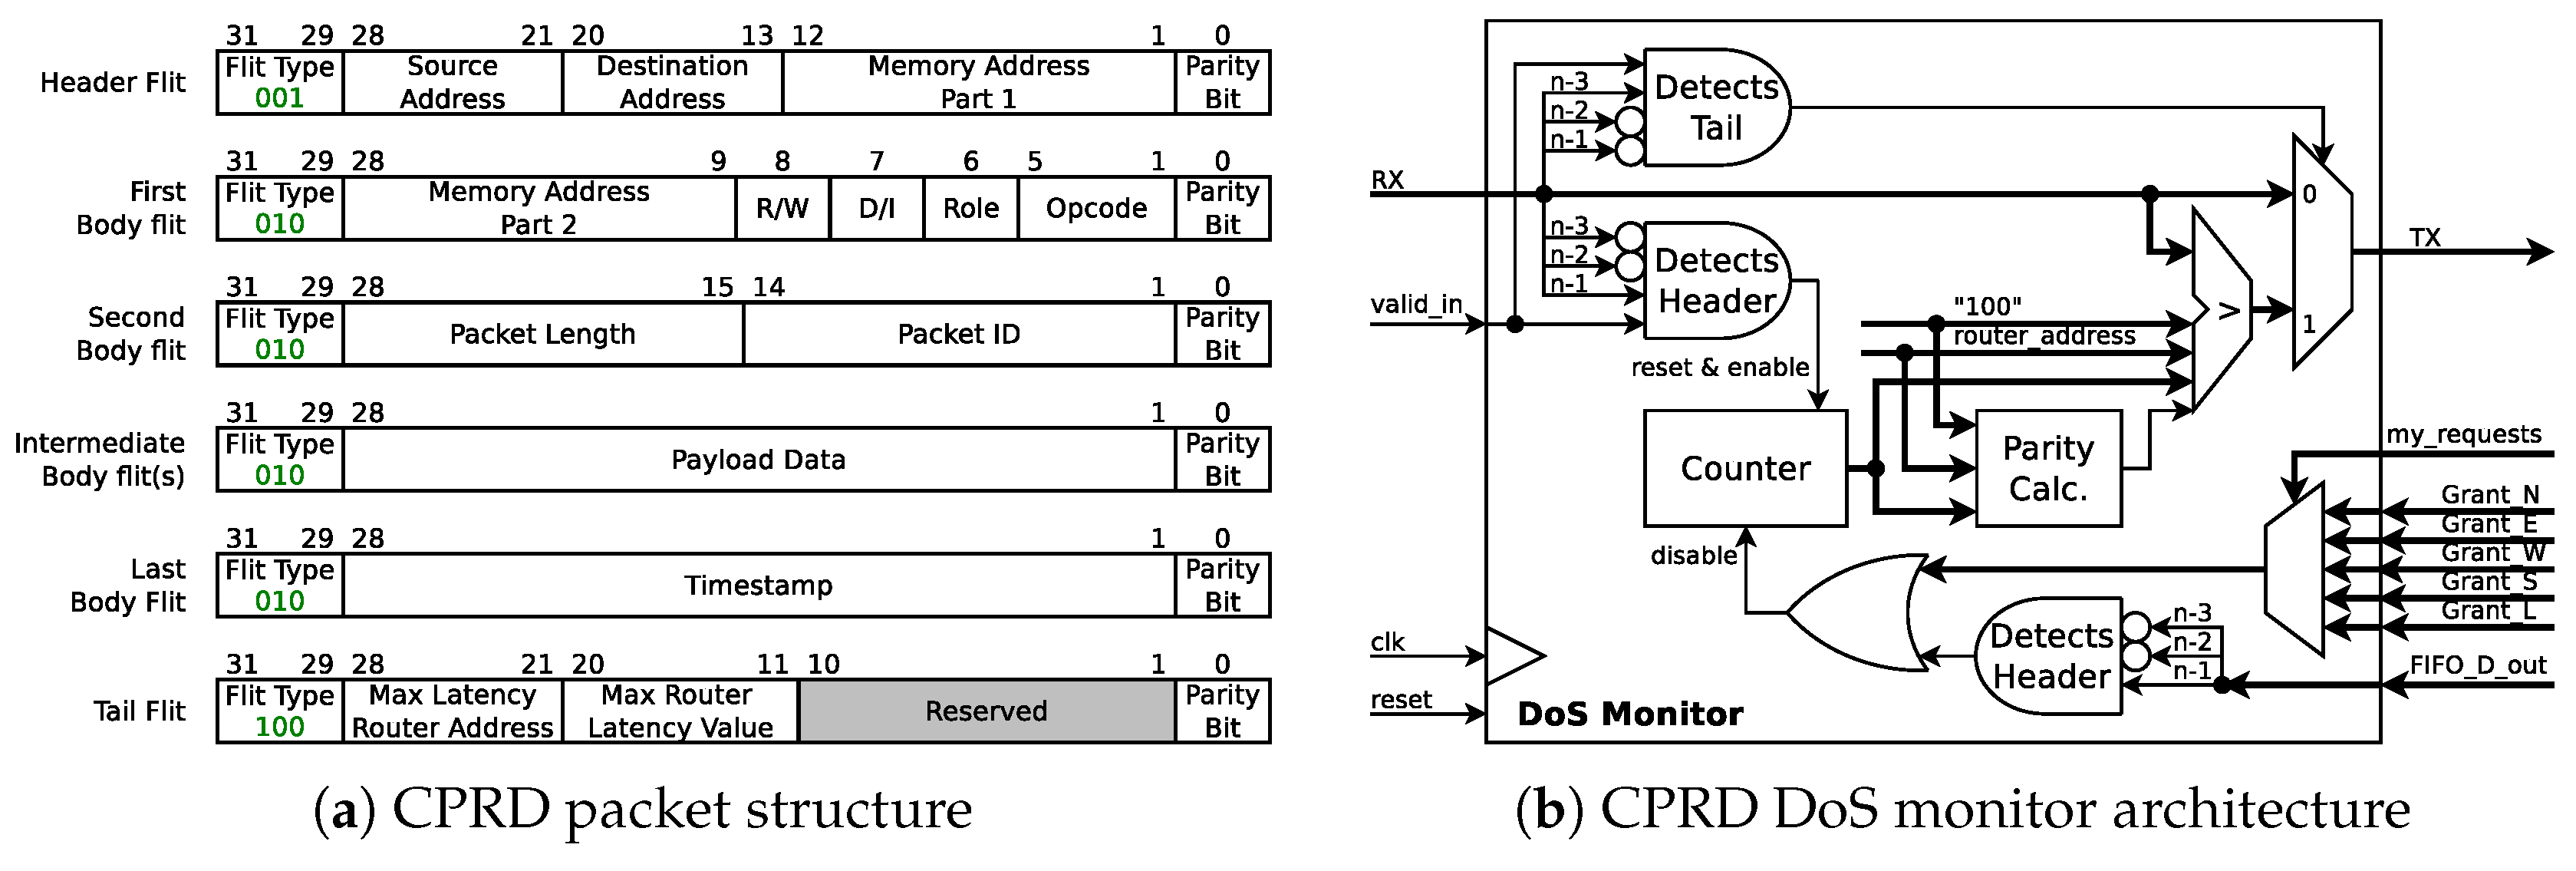
6.1. Collision Point Router Detection (CPRD) Architecture
The goal of this approach is not only to detect a DoS attack, but also the router where the attacker’s packets collide with the sensitive traffic. Hence, this architecture is called Collision Point Router Detection (CPRD) (The code is available for download at [
29]). We propose two main modifications to the Bonfire NoC project [
19]: (i) addition of the local and end-to-end delay and router information to the packet’s tail, and (ii) introduction of the monitors in the routers.
As shown in
Figure 11a (in comparison to
Figure 1b), the structure of the communication packets has been modified by adding the packet generation time stamp to the
Last Body Flit. This time-stamp is introduced to enable the system to calculate end-to-end latency of each packet, in order to detect the existence of a DoS attack. Additionally, the last flit of the packet (i.e., the
Tail Flit) now carries the address of the router where the packet waited the most, while its required output was busy (i.e.,
Max Latency Router Address), and the amount of clock cycles it waited (i.e.,
Max Router Latency Value). This information is evaluated on every router by a proposed DoS Monitor, and updated in case the waiting time in the current router is longer than the one stored in the packet.
Figure 10 depicts the addition of the proposed
CPRD DoS Monitor to the router’s data path. By adding the CPRD DoS monitor before each of the five FIFOs of each router, a NoC is able to distributively monitor DoS attacks and to locate the router where the attacker’s traffic enters the sensitive communication path.
Figure 11b depicts the internal architecture of the proposed
CPRD DoS Monitor. Once a new Header flit arrives at the input of the FIFO, the CPRD monitor starts a 10-bit counter, which is stopped when the Header flit leaves the FIFO’s output. The counter is incremented on each clock cycle while a packet is waiting to be forwarded, however, only while other packets are being forwarded through its required output port. This is achieved by monitoring the grants issued by the router’s allocator circuit and filtered by the request sent by the LBDR circuit. Furthermore, once the tail flit of the packet arrives, the counter value is compared against the
Max Router Latency Value stored in the tail flit. If the counter’s value is larger than the packet’s
Max Router Latency Value, the monitor replaces
Max Router Latency Value and
Max Latency Router Address with the new values and updates the parity bit for the tail flit.
The firmware of the MPSoC-powered IoT device will calculate the packets’ end-to-end latency upon their arrival using the packets’ generation time-stamp. Later, this value is compared with the maximum expected network latency. If the calculated packet latency is out of the acceptable latency range, the Max Latency Router Address and the Max Router Latency Value are also retrieved from the packet and analyzed together with previous DoS suspicion reports. Finally, when decided that a DoS attack is taking place, the firmware can localize and reset the PE identified as the source of the attack, thus eliminating its malicious traffic generation.
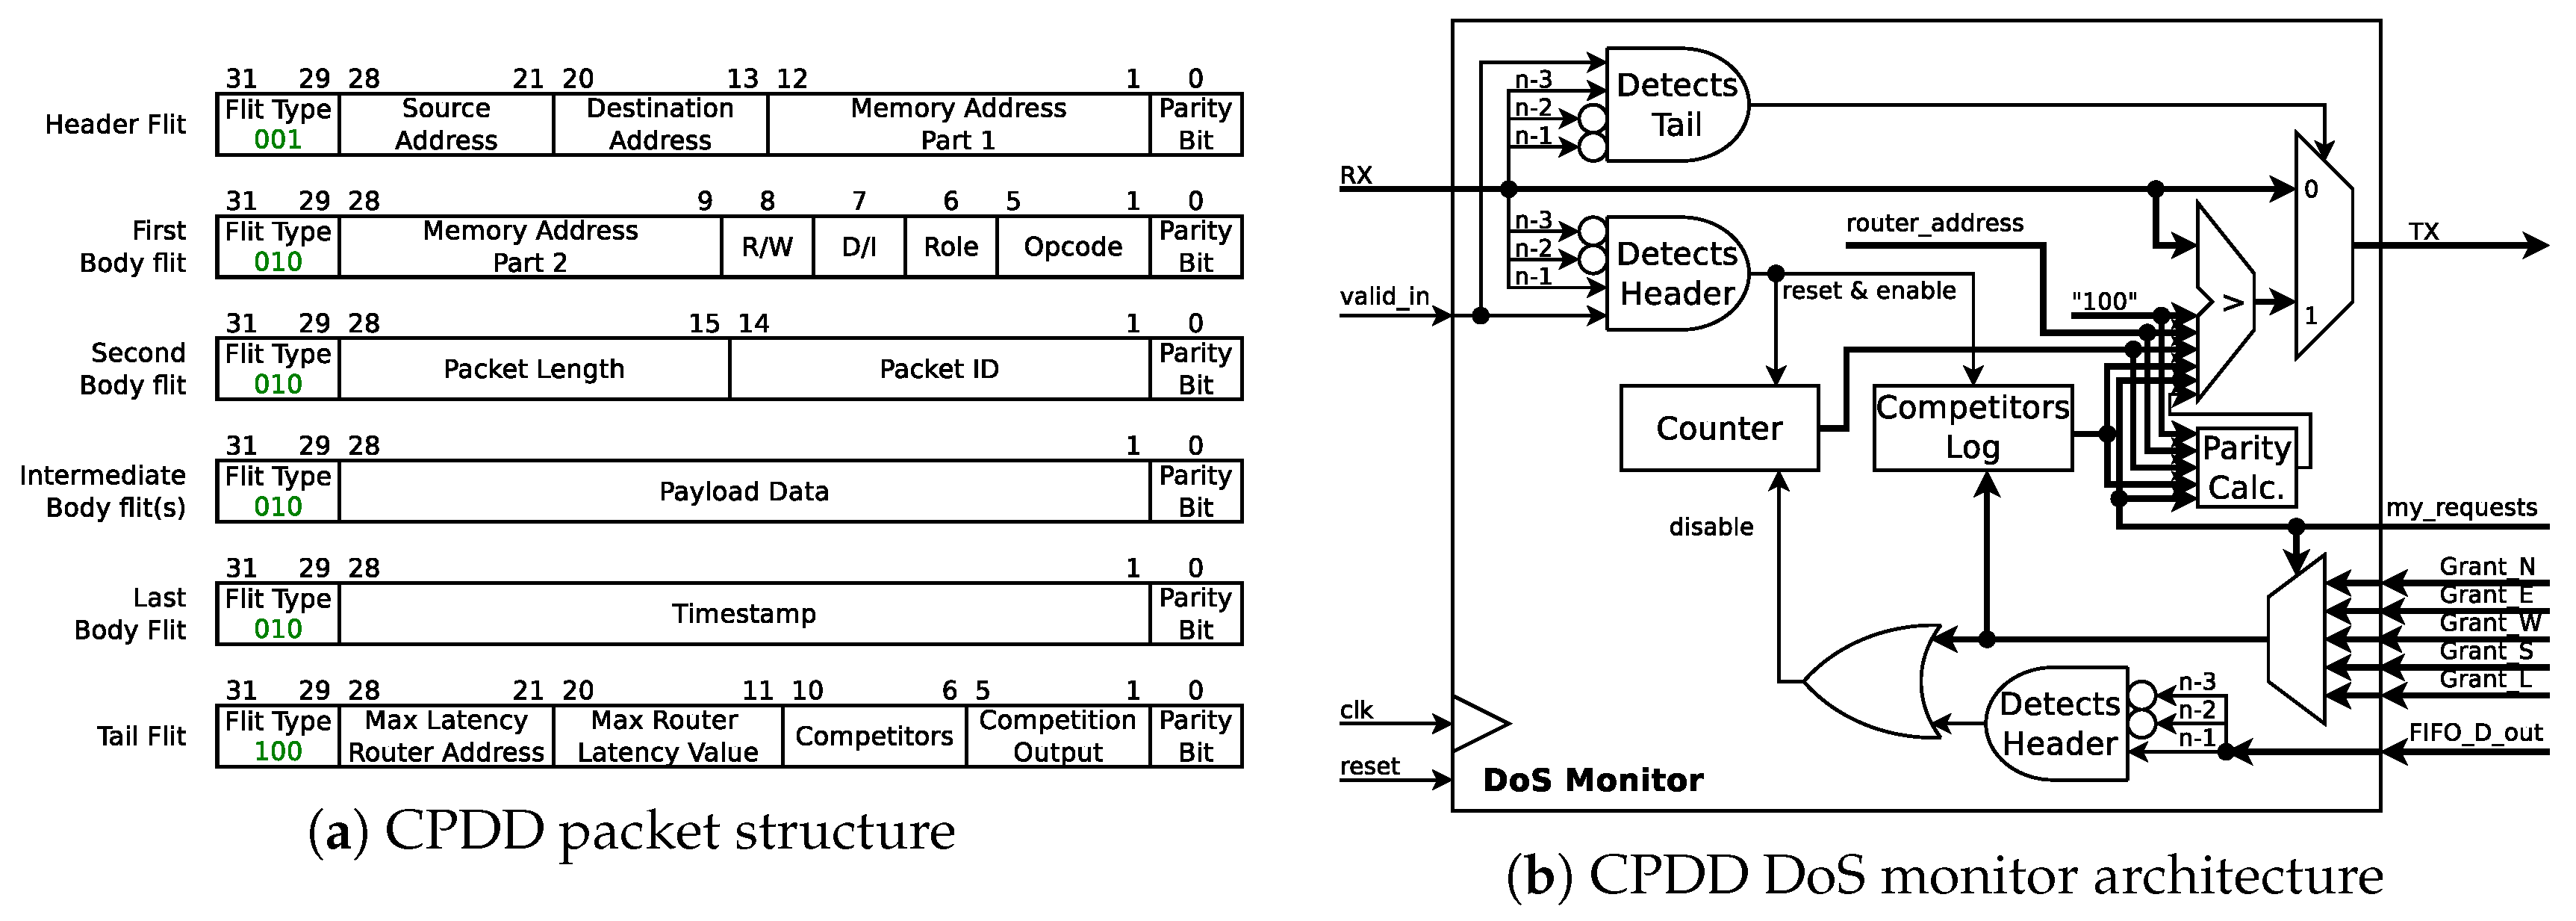
6.2. Collision Point Direction Detection (CPDD) Architecture
The second monitoring architecture works similar to the CPRD monitor, but also extends it to report the input direction of the malicious traffic through which it enters the collision point router. The packet format has been slightly changed in order to include the inputs competing to enter the sensitive path and the output for which they competed (see
Figure 12a).
Figure 12b shows the internal structure of the CPDD DoS monitor. The router uses the same structure as the one shown in
Figure 10. The most important task is to filter the requests sent to the Arbiter based on the issued requests from the input routing logic, once the requests from the other ports are identified. In case the latency value stored in the packet’s tail flit is less than the value of the local latency counter, the monitor updates the tail flit not only with the router address and the waiting time, but also the competitors and the output for which they compete. With the purpose of registering grants, given for the required output, while a packet is waiting to be forward, the CPDD monitor is equipped with a 5-bit register (
a.k.a. the Competitors log).
Once a sensitive packet reaches its destination, equal to the CPRD approach, the firmware of the MPSoC-powered IoT device calculates the end-to-end delay based on the timestamp contained in the packet. Provided that the calculated value exceeds the threshold, the collision point is determined. However, for the CPDD approach, the firmware will also extract the direction information to narrow down the suspects list and localize the compromised PE.
7. Experimental Results
In order to evaluate the performance of the proposed Distributed DoS Detection systems presented in
Section 6 (i.e., CPRD and CPDD), they have been implemented on the RTL level and integrated to the Bonfire framework [
19]. Traffic generators included in the Bonfire platform were leveraged for simulating normal traffic and DoS attacks on
mesh NoC-based MPSoC scenarios. Moreover, the network routers (applying either XY- or WestFisrt-routing algorithm) use a credit base flow control with fair Round-Robin arbitration (on packet level) and utilize Wormhole switching with 4-flit deep FIFOs. Furthermore, random traffic packets were transmitted with a length of 10 flits and a PIR of
(i.e., one packet every 100 clock cycles). The length and PIR of the sensitive and attacker packets, as well as their source and destination, vary according to the purpose of each scenario. Details of the scenario setup of the experiments and the results of simulations for CPRD are provided in
Section 7.1 and for CPDD in
Section 7.2. Additionally, an evaluation of the overhead of the proposed mechanisms in terms of area, critical-path delay, and power is presented in
Section 7.3.
7.1. Collision Point Router Detection (CPRD)
The experiments presented in this section target the analysis of the DoS attack from two sides: (i) from the point of view of the attacker in order to maximize the effectiveness of the attack, and (ii) from the point of view of the network protection, evaluating different metrics that can be leveraged for detecting an attack and qualifying the effectiveness of the CPRD mechanism.
Section 7.1.1 presents both sides of the DoS attack, considering a scenario that combines different PIR values for the attacker as well as for the sensitive traffic.
Section 7.1.2 goes further and evaluates the effects caused by attacks with different packet lengths and from different locations within the NoC.
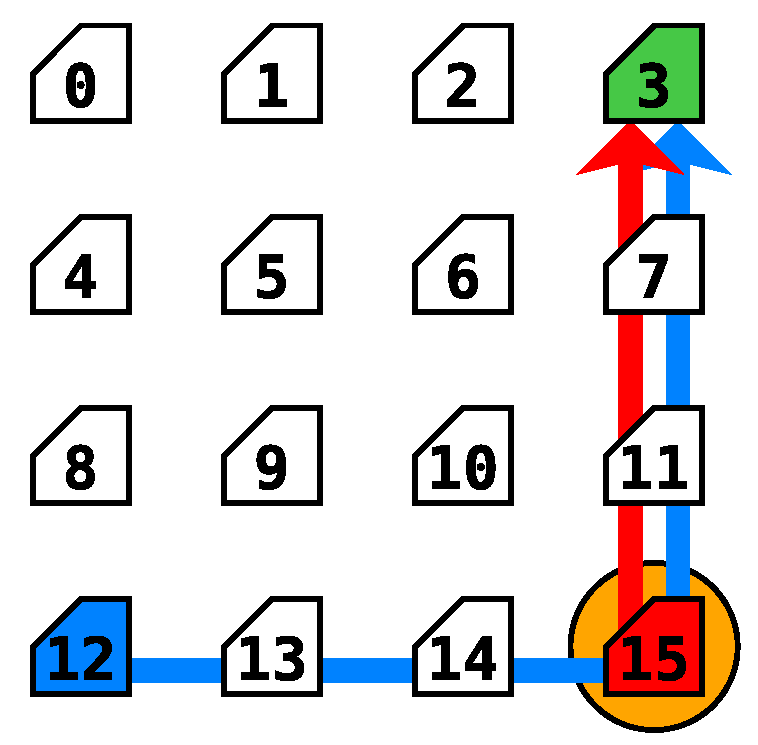
7.1.1. Effect of the Attacker’s PIR
In order to evaluate the effect of the attacker’s PIR value on the effectiveness of DoS attacks, the scenario described in
Figure 13 has been adopted. The sensitive packets go from router 12 (marked in blue) to the router 3 (marked in green) directed by the XY routing algorithm. This flow is marked with the blue arrow in the figure. The attacker, located on router 15 (marked in red), attempts to send packets to the same destination (router 3). The attacker’s packets’ flow has been marked by a red arrow on the figure. Moreover, the attacker’s and sensitive packets collide in router 15 (marked with an orange circle), while attempting to be forwarded to their destinations through the north port of the router.
Within this analysis, simulations were done considering different packet injection rates (PIR) for sensitive packets (PIR_S) and attack packets (PIR_A). The network’s random traffic was generated with a PIR_R of (one packet every 100 clock cycles). Each experiment was performed for 20 pseudo-random simulation seeds to provide uniform results. The network’s random traffic and the sensitive node’s traffic have been generated with a packet length of 10 flits (named (PL_R) and PL_S respectively). In the scenarios where an attack attempt was present, three different packet lengths were considered for the attacker’s packets (PL_A): 10, 30, and 50 flits.
As mentioned in
Section 4, an attacker can identify the success/effectiveness of the attack by measuring its own throughput [
23].
Table 4 lists results for different combinations of PIR_S and PIR_A from the attacker’s point of view. The first and third column of
Table 4, show the attacker’s intended and effective PIR, respectively. It can be seen that as the attacker’s intended PIR value is increased, the gap between the attacker’s intended and Effective PIRs widens. For example, in the case where the attacker’s intended PIR is
, the attacker is trying to send a 30-flit-length packet every 100 clock cycles. However, the effective PIR shows an insertion rate of approximately one packet every 140 clock cycles. The deviation of the attacker’s effective PIR from the intended value is expressed as a growth percentage in the fourth column of
Table 4. For the purpose of this work, we established that an attacker’s PIR_A variation (fourth column of
Table 4) of
is needed to consider the attack effective.
As mentioned in
Section 6, each packet carries (in the last body flit) a time-stamp of the instant when the packet is generated. This time-stamp is used for calculating the End-to-End communication latency upon arrival to the destination node.
Table 5 lists the mean End-to-End delay values of the sensitive packets for different PIR_S values in absence of an attacker. This mean value and the sample standard deviation (SSD) are used for calculating a threshold
T as shown in (
1), and such a threshold for diagnosing DoS attacks.
Furthermore,
Table 6 lists the results of the experiments from the network protection’s point of view for the same scenario where the attacker is located at router 15 (
Figure 13). Since a DoS attack was present, the end-to-end delay reached values greater than the threshold
T (see Equation (
1) and
Table 5), enabling the diagnosis mechanism to detect the attack. However, for a PIR_A of
, the collision point was not determined. This because the traffic entering from other inputs and requiring the same output was more or less equal to the one from the attacker. On the other hand, for PIR_A configurations, where the attacker noticed success by monitoring its own throughput (i.e., PIR_A
), the proposed DoS CPRD mechanism managed not only to detect the attack, but also the point where the malicious traffic intercepted the sensitive path. For the scenarios where the collision point router was found, the last column of the table lists the detection confidence. In some cases the confidence is not complete due to the randomness of the additional traffic.
7.1.2. Effect of the Attacker’s Packet Length and the Location
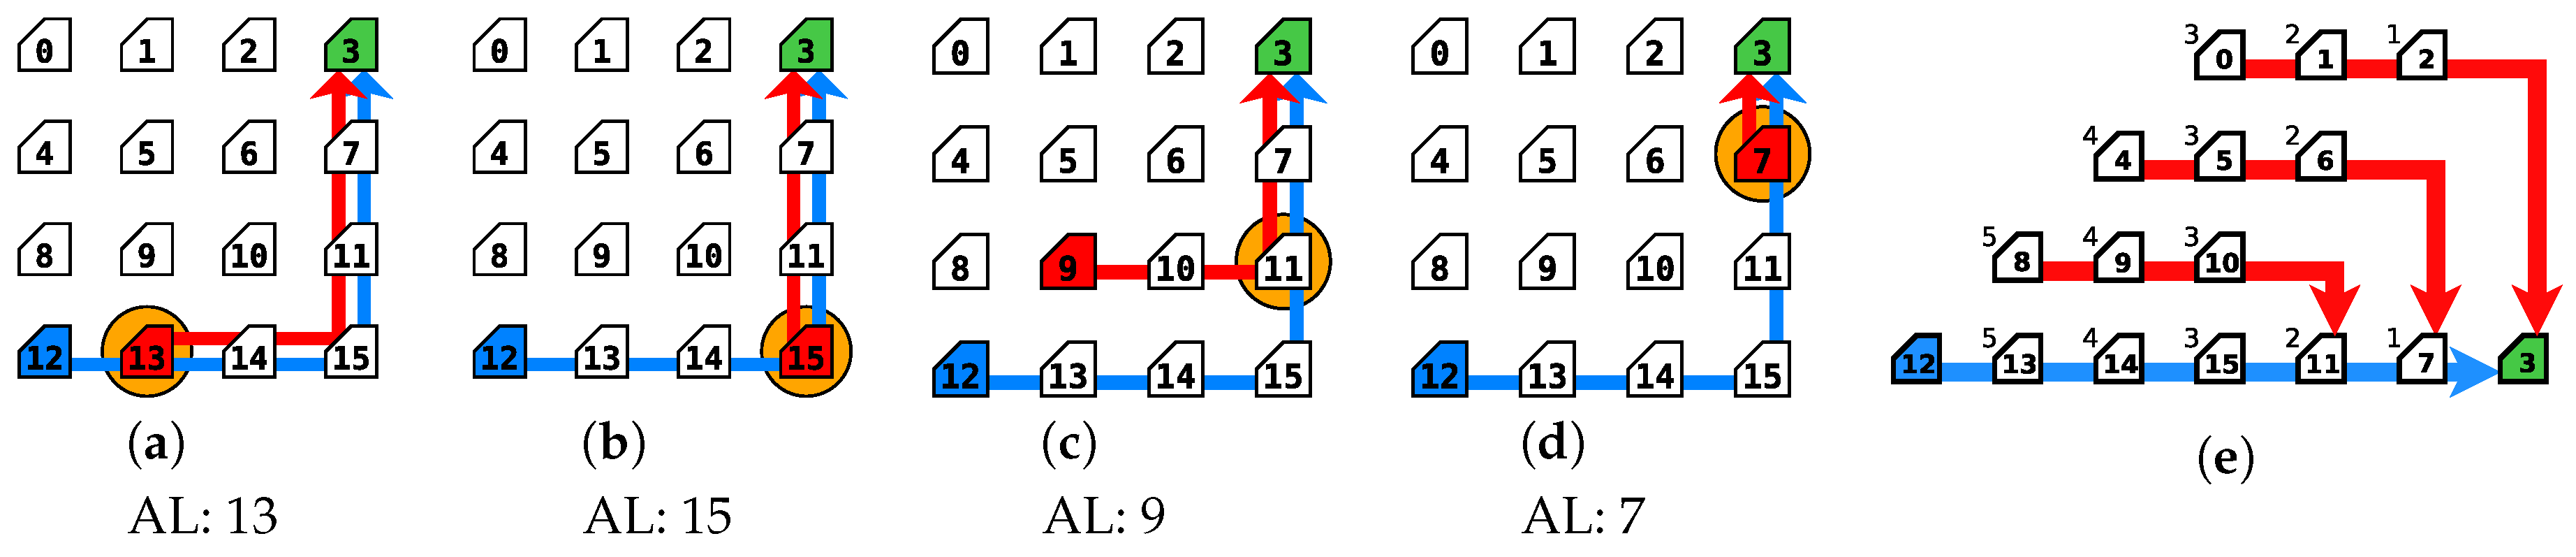
In order to find configurations that would maximize the success of an attack, experiments were done for four different PL_A values (i.e., 10, 20, 30, and 50 flits), as well as placing the attack source in different routers of the NoC (router connected to the infected PE) and for the three scenarios presented in
Section 5.1;
Figure 14a–d shows some of the scenarios with different sources of attacks (symbolized with the red router, and specified in the label of each sub-figure). The malicious traffic runs from the scenario specific source to the same destination as the sensitive traffic (router 3); as in the scenario from the previous section, the red arrow connecting these two routers represents such a path and the orange circle indicates the collision point, where DoS traffic collides with the path of the sensitive traffic. Finally, as depicted in
Figure 14e, depending on the selected attack source, the malicious path length and the collision point to the sensitive path vary. In the cases where the attack source is directly in the sensitive path, the source and collision point routers are the same. For such experiments, PL_S and PL_R were set to 10 flits, and all the PIRs were set to
(i.e., PIR_A = PIR_S = PIR_R =
).
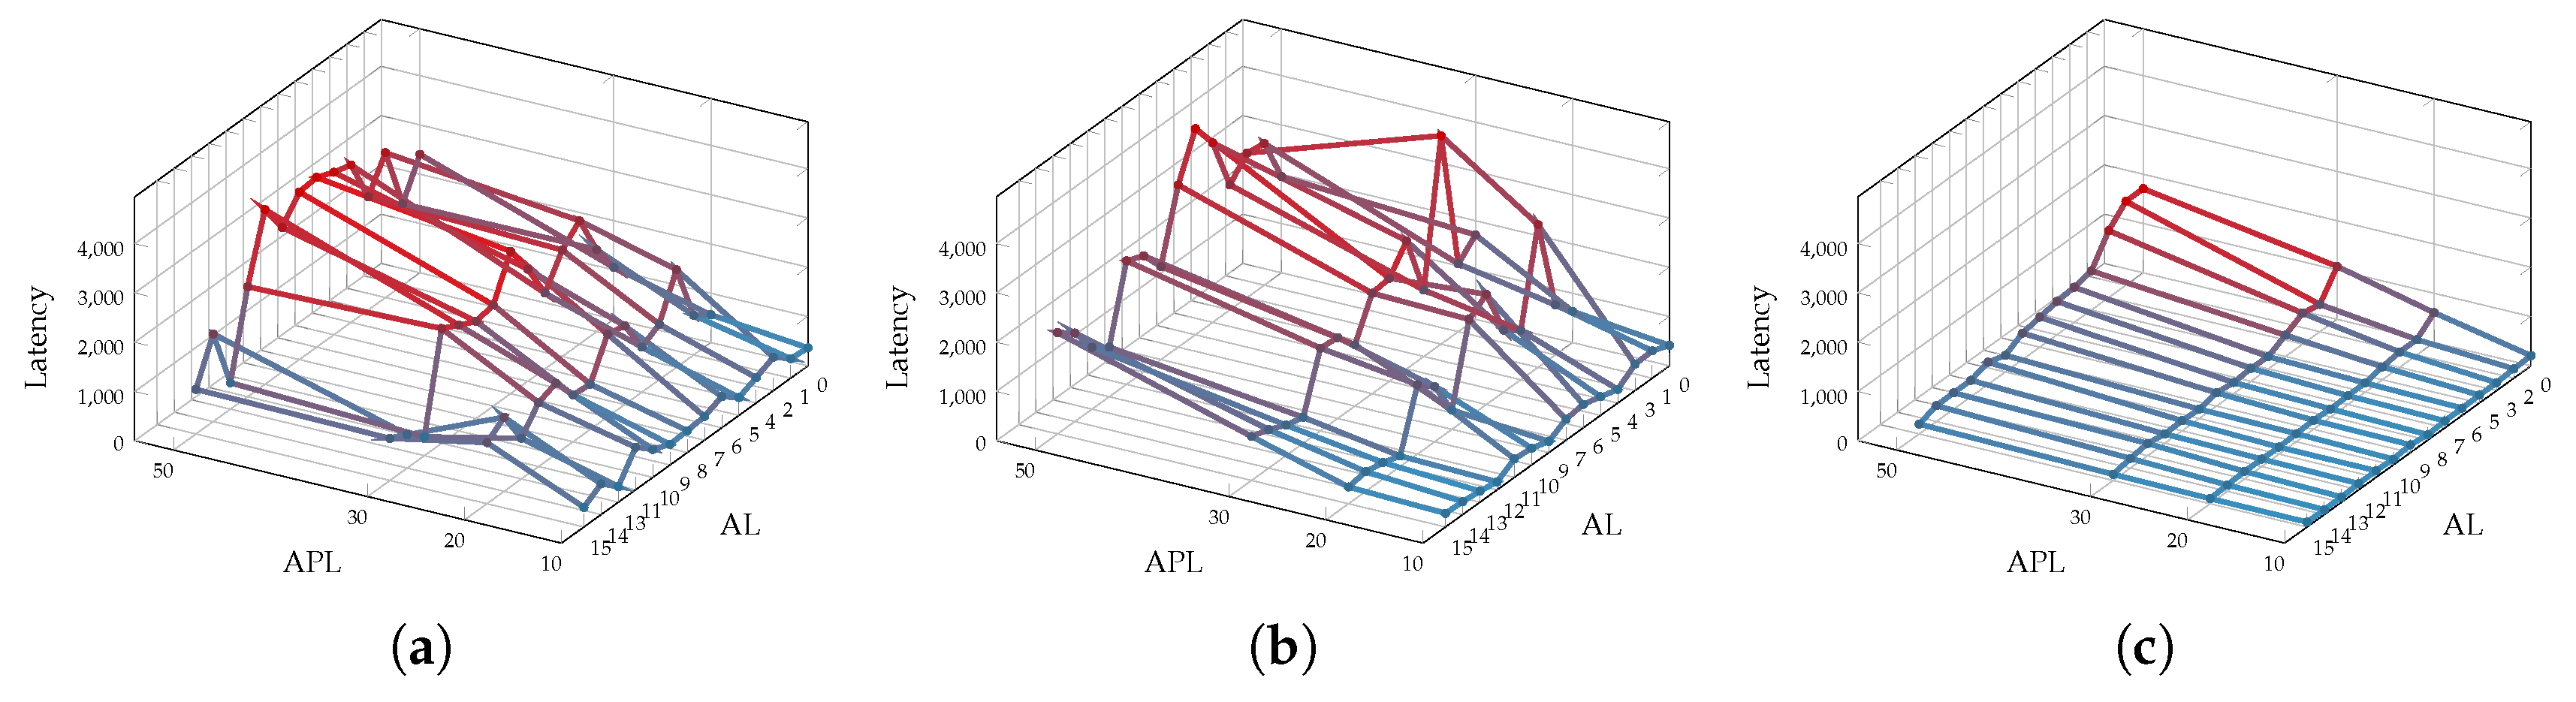
End-to-End mean delay values of the sensitive packets for each of the scenarios are depicted in
Figure 14 and more, are presented in
Figure 15. As expected, the results show that the trend of End-to-End delay of the sensitive packets rises proportionally to the PL_A value, achieving in most cases the highest mean delay values for the 50-flit PL_A configurations. This is due to the fact that longer packets manage to retain the grant of a router output longer, preventing other packets of being forwarded. Regarding the location of the attacker, as shown in
Figure 15, the highest sensitive End-to-End transmission delays were caused when injecting the malicious traffic into the routers closest to the sensitive destination. This is due to the propagation of arbitration fairness of each router. Consider that the attacker can block 50% of the traffic on the point of insertion (in case its only competing with one other input direction). If this point of insertion is close to the source of the sensitive data, the attacker can successfully block 50% of the sensitive packets. However, if the attacker is close to the destination node, it can block 50% of the destination stream where the sensitive data flow is a part of it. Hence, the effect of the attack gets amplified by the distance of the attacker from the source.
7.2. Collision Point Direction Detection (CPDD)
Section 5 explained the benefit of identifying the port through which malicious traffic intercepts the sensitive path. This section presents the direction detection success and misses of the CPDD mechanism for the scenarios described in
Section 5.1. Simulations were executed considering a PIR_A value of
and PIR_S = PIR_R =
. Each experiment was performed for 20 pseudo-random simulation seeds to provide uniform results. Additionally, four attacker packet lengths were adopted (i.e., 10, 20, 30, and 50 flits), while the network’s random traffic and the sensitive node’s traffic generated packets with the length of 10 (i.e., PL_R = PL_S = 10). Moreover, experiments were executed considering not only a deterministic routing algorithm, but also an adaptive routing algorithm. Results for each routing algorithm are presented separately in
Section 7.2.1 and
Section 7.2.2, respectively.
7.2.1. Analysis of the Proposed Method under Deterministic Routing
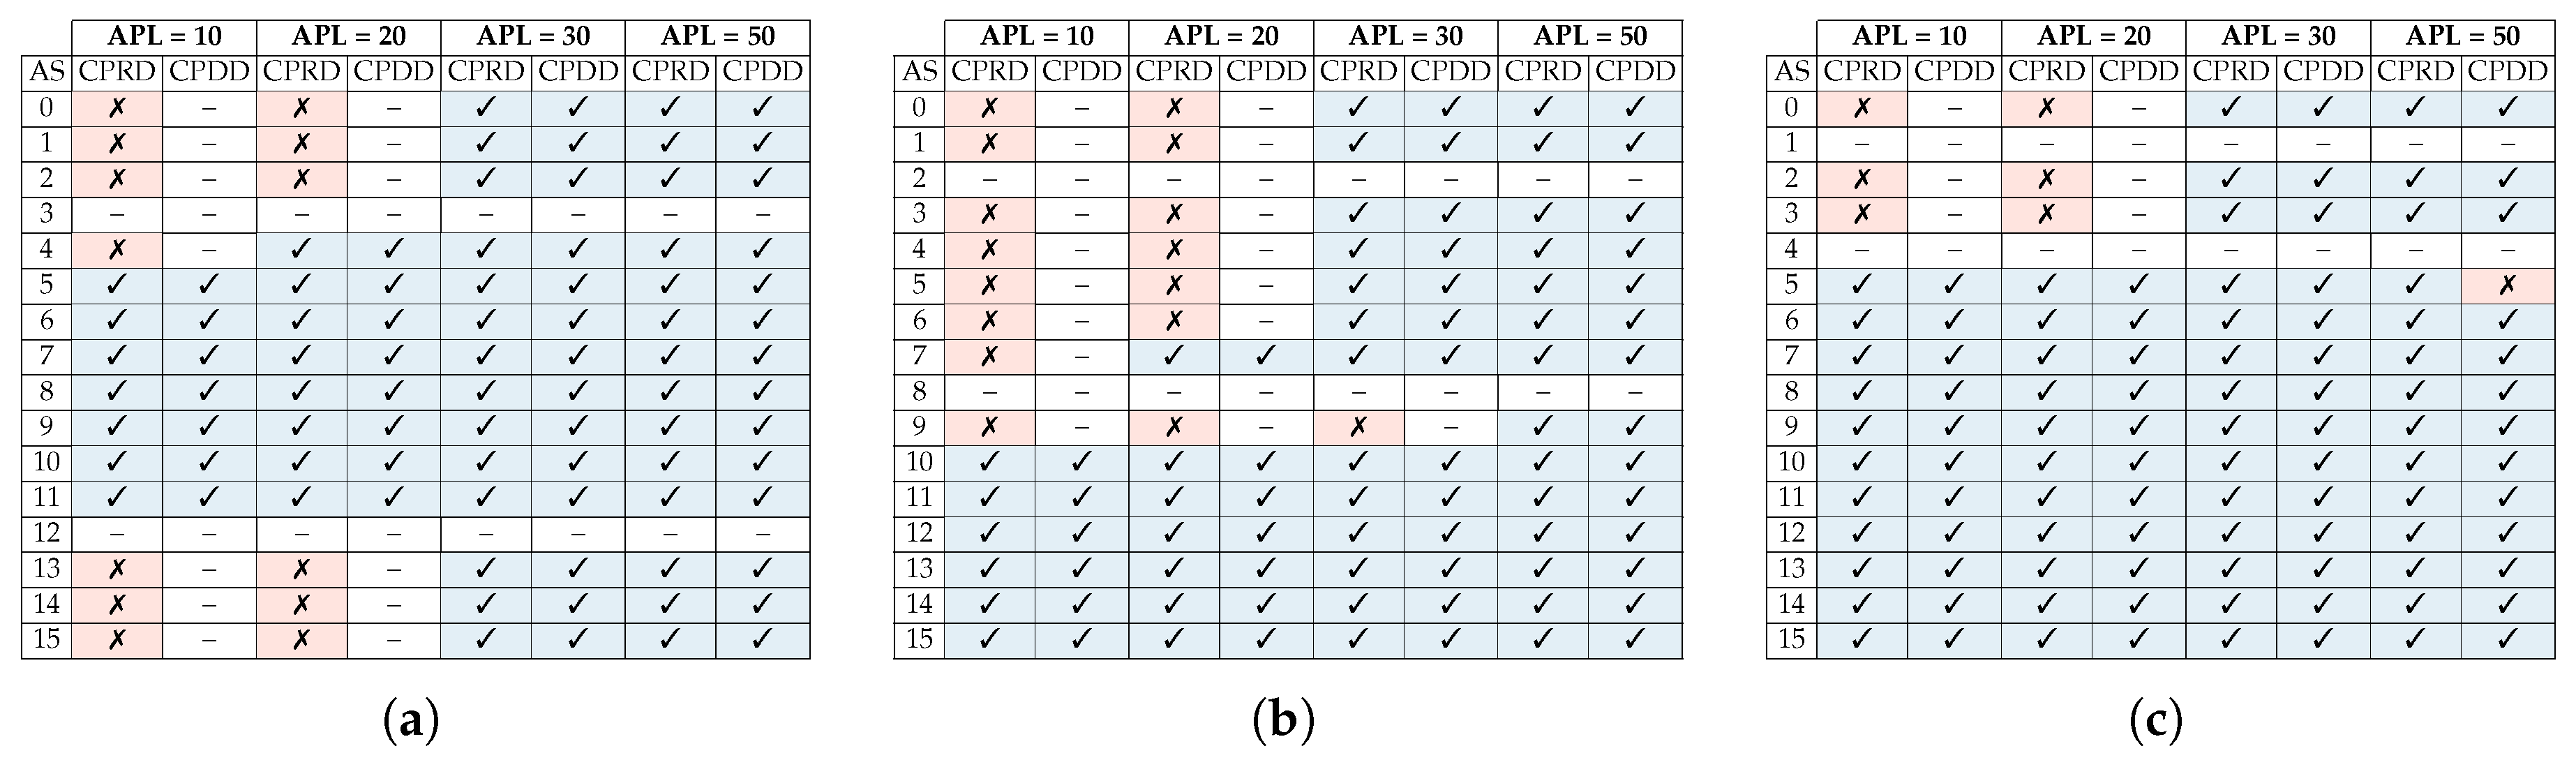
Figure 16 summarizes the obtained detection results for scenarios depicted in
Figure 4,
Figure 5 and
Figure 6 under XY routing. Each row lists the detection effectiveness of the collision point router and input direction of the malicious packets for every possible attack source. Also, each pair of columns group the router and direction detection results for each of the attacker packet length values.
Results showed that the CPDD managed to detect the input direction for almost all the scenarios where the collision point router was found. Also, once again, due to the wormhole switching, that as the packet length of the attacker was increased, it became easier to detect the collision point router.
7.2.2. Analysis of the Proposed Method under Adaptive Routing
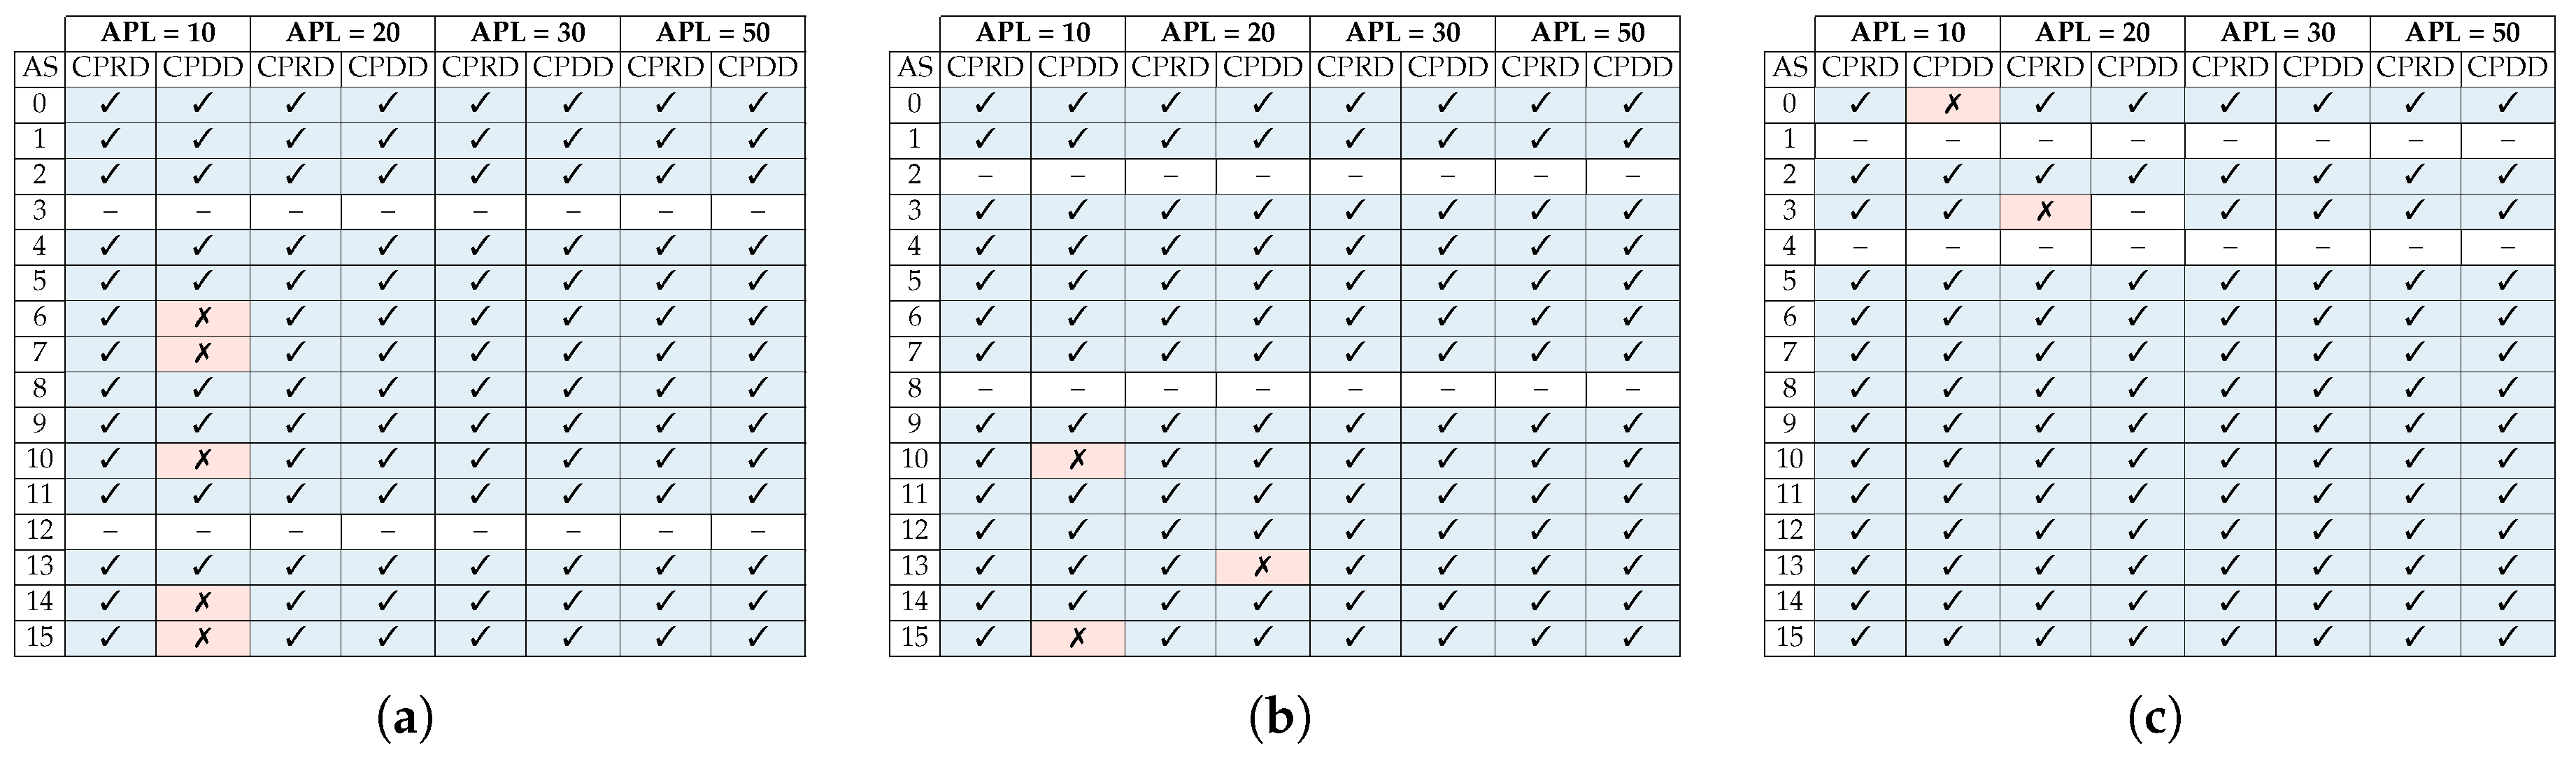
A similar analysis to the one shown in the previous section has been performed on the system adopting the West-First adaptive routing algorithm.
Figure 17 summarizes the obtained detection results when adopting the West-First routing in the scenarios depicted in
Figure 4,
Figure 5 and
Figure 6. Each row lists the detection effectiveness of the collision point router and input direction of the malicious packets for every possible attack source. Also, each pair of columns group the router and direction detection results for each of the attacker packet length values.
The results for this set of experiments show a better detection efficiency of the attacker’s location compared to a system using XY routing, however, since traffic between two routers may have more than one minimal path, the size of the search space for the attacker is much larger (please refer to
Figure 7,
Figure 8 and
Figure 9).
7.3. Overhead Evaluation
The proposed architectures (CPRD and CPDD Routers) were synthesized using the
m AMS library and Synopsys design vision at 200 MHz. Area overhead and critical path delay of the proposed architecture compared to the baseline architecture are reported in
Table 7. The critical path delay overhead of the CPRD method is negligible and the proposed CPRD monitors only add
area overhead to the minimalist router area (each CPRD monitor only adds
overhead to the router’s area). Its important to note that the main contribution to area overhead is from the inclusion of the counter register. The width of the counters can be adjusted based on the application. The CPDD router applies 23.2% area overhead to the baseline router. In order to put the area overheads into perspective, we will consider the overheads on a 4 mm
chip. For an SoC using a
mesh NoC, the CPRD and CPDD would impose 0.4% and 0.5% overhead to the system respectively.
Power analysis: the power consumption of the proposed methods (CPRD and CPDD routers) and the baseline architecture have been evaluated for random uniform traffic with a packet injection rate of
(without presence of attacker). The results of these experiments are reported in
Table 8. The results show that the CPRD approach induces
power overhead and the CPDD approach adds 9.4% to the baseline router.
8. Conclusions
Network-on-Chip solutions have become the central communication infrastructure of the modern MPSoCs. However, Denial of Service (DoS) attacks have been shown as an important threat to NoC integrity. Hence, it is of utmost importance to detect the occurrence of such attacks in the system, and also to localize the attacker in order to neutralize its effects. To this end, this paper provides two main contributions. First we analyze the effect of obtaining additional information about the collision location and the incoming direction of the attacker’s flow in the collision point with the sensitive data on localizing the attacker. Second we propose two distributed DoS detection schemes for measuring the performance degradation of sensitive data transmissions under Denial of Service attacks and for detecting the collision point and direction of the collision of the DoS packets into the sensitive path. We perform an exploration of the effect of different attack configurations targeting the sensitive traffic including different packet lengths, packet injection rates, and attack sources. Our experimental results show that longer attacker packets, intercepting the sensitive path closer to its destination, cause a greater effect of the attack. We have also shown that we can almost in all cases identify the direction of incoming attack flows.
Author Contributions
Conceptualization, C.G.C., S.P.A., T.H. and J.S.; Data curation, C.G.C. and S.P.A.; Formal analysis, C.G.C., S.P.A., T.H. and J.S.; Funding acquisition, T.H. and J.S.; Investigation, C.G.C., S.P.A., T.H. and J.S.; Methodology, C.G.C., S.P.A., T.H. and J.S.; Project administration, T.H.; Resources, S.P.A.; Software, C.G.C. and S.P.A.; Supervision, T.H. and J.S.; Validation, C.G.C. and S.P.A.; Visualization, C.G.C. and S.P.A.; Writing—original draft, C.G.C., S.P.A., T.H. and J.S.; Writing—review & editing, T.H. and J.S.
Funding
This work was partially funded by the German Academic Exchange Service (DAAD) and by the German Federal Ministry of Education and Research (BMBF), grant number 01IS160253 (ARAMiS II) and also supported partly by the ETAG IUT19-1 grant.
Acknowledgments
The authors thank TalTech (Tallinn University of Technology), Department of Computer Engineering, for providing a high performance server infrastructure as resource for the extensive simulations needed to prove the evidence of the presented research.
Conflicts of Interest
The authors declare no conflict of interest.
References
- Ericsson Mobility Report. Available online: https://www.ericsson.com/assets/local/mobility-report/documents/2016/ericsson-mobility-report-june-2016.pdf (accessed on 16 January 2019).
- The Internet of Things: Mapping the Value Beyond the Hype. 2015. Available online: https://www.mckinsey.de/#energiewende (accessed on 16 January 2019).
- Azad, S.P.; Niazmand, B.; Ellervee, P.; Raik, J.; Jervan, G.; Hollstein, T. SoCDep2: A framework for dependable task deployment on many-core systems under mixed-criticality constraints. In Proceedings of the 2016 11th International Symposium on Reconfigurable Communication-centric Systems-on-Chip (ReCoSoC), Tallinn, Estonia, 27–29 June 2016; pp. 1–6. [Google Scholar]
- Hollstein, T.; Azad, S.P.; Kogge, T.; Ying, H.; Hofmann, K. NoCDepend: A Flexible and Scalable Dependability Technique for 3D Networks-on-Chip. In Proceedings of the 2015 IEEE 18th International Symposium on Design and Diagnostics of Electronic Circuits Systems, Belgrade, Serbia, 22–24 April 2015; pp. 75–78. [Google Scholar]
- Worldwide Infrastructure Security Report. Available online: https://pages.arbornetworks.com/rs/082-kna-087/images/12th_worldwide_infrastructure_security_report.pdf (accessed on 16 January 2019).
- Fang, D.; Li, H.; Han, J.; Zeng, X. Robustness analysis of mesh-based network-on-chip architecture under flooding-based denial of service attacks. In Proceedings of the 2013 IEEE Eighth International Conference on IEEE Networking, Architecture and Storage (NAS), Xi’an, China, 17–19 July 2013; pp. 178–186. [Google Scholar]
- Evain, S.; Diguet, J.P. From NoC security analysis to design solutions. In Proceedings of the IEEE Workshop on Signal Processing Systems Design and Implementation, Athens, Greece, 2–4 November 2005; pp. 166–171. [Google Scholar]
- Sepúlveda, J.; Strum, M.; Chau, W. An Hybrid Switching Approach for NoC-Based Systems to avoid Denial-of-Service SoC Attacks. In Proceedings of the 16th Iberchip Wksp (IWS 2010), Iguaczú Falls, Brazil, 23–25 February 2010; pp. 23–25. [Google Scholar]
- Sepúlveda, J.; Flórez, D.; Gogniat, G. Efficient and flexible NoC-based group communication for secure MPSoCs. In Proceedings of the 2015 International Conference on ReConFigurable Computing and FPGAs (ReConFig), Mexico City, Mexico, 7–9 December 2015; pp. 1–6. [Google Scholar]
- Fiorin, L.; Palermo, G.; Silvano, C. A Security Monitoring Service for NoCs. In Proceedings of the 6th IEEE/ACM/IFIP International Conference on Hardware/Software Codesign and System Synthesis; ACM: New York, NY, USA, 2008; pp. 197–202. [Google Scholar]
- Sepulveda, M.J.; Diguet, J.P.; Strum, M.; Gogniat, G. NoC-Based Protection for SoC Time-Driven Attacks. IEEE Embedded Syst. Lett. 2015, 7, 7–10. [Google Scholar] [CrossRef]
- Caimi, L.L.; Fochi, V.; Wachter, E.; Munhoz, D.; Moraes, F.G. Activation of secure zones in many-core systems with dynamic rerouting. In Proceedings of the 2017 IEEE International Symposium on Circuits and Systems (ISCAS), Baltimore, MD, USA, 28–31 May 2017; pp. 1–4. [Google Scholar]
- Sepúlveda, J.; Flórez, D.; Gogniat, G. Reconfigurable security architecture for disrupted protection zones in NoC-based MPSoCs. In Proceedings of the 2015 10th International Symposium on Reconfigurable Communication-centric Systems-on-Chip (ReCoSoC), Bremen, Germany, 29 June–1 July 2015; pp. 1–8. [Google Scholar]
- JS, R.; Ancajas, D.M.; Chakraborty, K.; Roy, S. Runtime detection of a bandwidth denial attack from a rogue network-on-chip. In Proceedings of the 9th International Symposium on Networks-on-Chip, Vancouver, BC, Canada, 28–30 September 2015; p. 8. [Google Scholar]
- Fiorin, L.; Silvano, C.; Sami, M. Security aspects in networks-on-chips: Overview and proposals for secure implementations. In Proceedings of the 2007 10th Euromicro Conference on Digital System Design Architectures, Methods and Tools, Lubeck, Germany, 29–31 August 2007; pp. 539–542. [Google Scholar]
- Diguet, J.P.; Evain, S.; Vaslin, R.; Gogniat, G.; Juin, E. NOC-centric Security of Reconfigurable SoC. In Proceedings of the First International Symposium on Networks-on-Chip, Princeton, NJ, USA, 7–9 May 2007; pp. 223–232. [Google Scholar]
- Grammatikakis, M.D.; Papadimitriou, K.; Petrakis, P.; Papagrigoriou, A.; Kornaros, G.; Christoforakis, I.; Tomoutzoglou, O.; Tsamis, G.; Coppola, M. Security in MPSoCs: A NoC Firewall and an Evaluation Framework. IEEE Trans. Comput. Aided Des. Integr. Circuits Syst. 2015, 34, 1344–1357. [Google Scholar] [CrossRef]
- Achballah, A.B.; Othman, S.B.; Saoud, S.B. Toward on hardware firewalling of networks-on-chip based systems. In Proceedings of the 2017 International Conference on Advanced Systems and Electric Technologies (IC_ASET), Hammamet, Tunisia, 14–17 January 2017; pp. 7–13. [Google Scholar]
- Azad, S.P.; Niazmand, B.; Janson, K.; George, N.; Oyeniran, A.S.; Putkaradze, T.; Kaur, A.; Raik, J.; Jervan, G.; Ubar, R.; Hollstein, T. From online fault detection to fault management in Network-on-Chips: A ground-up approach. In Proceedings of the 2017 IEEE 20th International Symposium on Design and Diagnostics of Electronic Circuits Systems (DDECS), Dresden, Germany, 19–21 April 2017; pp. 48–53. [Google Scholar]
- Bonfire Wiki. Available online: https://github.com/Project-Bonfire/Bonfire/wiki (accessed on 16 January 2019).
- Flich, J.; Duato, J. Logic-Based Distributed Routing for NoCs. IEEE Comput. Archit. Lett. 2008, 7, 13–16. [Google Scholar] [CrossRef]
- Fettweis, G.P. 5G and the future of IoT. In Proceedings of the ESSCIRC Conference 2016 42nd European Solid-State Circuits Conference, Lausanne, Switzerland, 12–15 September 2016; pp. 21–24. [Google Scholar]
- Sepulveda, J.; Aboul-Hassan, D.; Sigl, G.; Becker, B.; Sauer, M. Towards the formal verification of security properties of a Network-on-Chip router. In Proceedings of the 2018 IEEE 23rd European Test Symposium (ETS), Bremen, Germany, 28 May–1 June 2018; pp. 1–6. [Google Scholar]
- Duato, J.; Yalamanchili, S.; Lionel, N. Interconnection Networks: An Engineering Approach; Morgan Kaufmann Publishers Inc.: San Francisco, CA, USA, 2002. [Google Scholar]
- Shafiee, A.M.; Montazeri, M.; Nikdast, M. An Innovational Intermittent Algorithm in Networks-On-Chip (NOC). Int. J. Comput. Electr. Autom. Control Inf. Eng. 2008, 2, 2907–2909. [Google Scholar]
- Glass, C.J.; Ni, L.M. The Turn Model for Adaptive Routing. In Proceedings of the 19th Annual International Symposium on Computer Architecture, Queensland, Australia, 19–21 May 1992; pp. 278–287. [Google Scholar]
- Mubeen, S.; Kumar, S. Designing Efficient Source Routing for Mesh Topology Network on Chip Platforms. In Proceedings of the 13th Euromicro Conference on Digital System Design: Architectures, Methods and Tools (DSD), Lille, France, 1–3 September 2010; pp. 181–188. [Google Scholar]
- Miura, Y.; Shimozono, K.; Watanabe, S.; Matoyama, K. An Adaptive Routing of the 2-D Torus Network Based on Turn Model. In Proceedings of the 2013 First International Symposium on Computing and Networking (CANDAR), Matsuyama, Japan, 4–6 December 2013; pp. 587–591. [Google Scholar]
- Secure Bonfire. Available online: https://github.com/Project-Bonfire/Secure_Bonfire/releases/tag/CPRD (accessed on 3 February 2019).
Figure 1.
Bonfire baseline frameworks: (
a) router architecture and (
b) packet structure [
20].
Figure 1.
Bonfire baseline frameworks: (
a) router architecture and (
b) packet structure [
20].
Figure 2.
Multiprocessor System-on-Chip (MPSoC)-powered Internet-of-Things (IoT) execution environment.
Figure 2.
Multiprocessor System-on-Chip (MPSoC)-powered Internet-of-Things (IoT) execution environment.
Figure 3.
Basic procedure of a malicious application.
Figure 3.
Basic procedure of a malicious application.
Figure 4.
Sensitive path 1.
Figure 4.
Sensitive path 1.
Figure 5.
Sensitive path 2.
Figure 5.
Sensitive path 2.
Figure 6.
Sensitive path 3.
Figure 6.
Sensitive path 3.
Figure 7.
Average number of nodes to be checked under different routing algorithms (Sensitive path 1).
Figure 7.
Average number of nodes to be checked under different routing algorithms (Sensitive path 1).
Figure 8.
Average number of nodes to be checked under different routing algorithms (Sensitive path 2).
Figure 8.
Average number of nodes to be checked under different routing algorithms (Sensitive path 2).
Figure 9.
Average number of nodes to be checked under different routing algorithms (Sensitive path 3).
Figure 9.
Average number of nodes to be checked under different routing algorithms (Sensitive path 3).
Figure 10.
Proposed router architecture with Denial of Service (DoS) detection.
Figure 10.
Proposed router architecture with Denial of Service (DoS) detection.
Figure 11.
DoS detection using Collision Point Router Detection (CPRD).
Figure 11.
DoS detection using Collision Point Router Detection (CPRD).
Figure 12.
DoS detection using Collision Point Direction Detection (CPDD).
Figure 12.
DoS detection using Collision Point Direction Detection (CPDD).
Figure 13.
Experiment scenario for attacker’s Packet Injection Rates (PIR) efficiency.
Figure 13.
Experiment scenario for attacker’s Packet Injection Rates (PIR) efficiency.
Figure 14.
Experimental examples (a–d) for attack scenario 1 and (e) illustration of different malicious path length and the collision point based on the location of the attacker.
Figure 14.
Experimental examples (a–d) for attack scenario 1 and (e) illustration of different malicious path length and the collision point based on the location of the attacker.
Figure 15.
End-to-End latency vs attacker’s packet length for different attack sources (XY Routing) for (a) Scenario 1, (b) Scenario 2, and (c) Scenario 3.
Figure 15.
End-to-End latency vs attacker’s packet length for different attack sources (XY Routing) for (a) Scenario 1, (b) Scenario 2, and (c) Scenario 3.
Figure 16.
Effectiveness of the proposed architecture in establishing the attacker search space for XY routing of (a) Scenario 1, (b) Scenario 2, and (c) Scenario 3.
Figure 16.
Effectiveness of the proposed architecture in establishing the attacker search space for XY routing of (a) Scenario 1, (b) Scenario 2, and (c) Scenario 3.
Figure 17.
Effectiveness of the proposed architecture in establishing the attacker search space for West-First routing of (a) Scenario 1, (b) Scenario 2, and (c) Scenario 3.
Figure 17.
Effectiveness of the proposed architecture in establishing the attacker search space for West-First routing of (a) Scenario 1, (b) Scenario 2, and (c) Scenario 3.
Table 1.
Attack suspects for Sensitive path 1.
Table 1.
Attack suspects for Sensitive path 1.
| Collision | Suspects with Collision | Detected | Suspects with Collision |
|---|
| Point | Point Router Detection | Direction | Point Direction Detection |
|---|
| 13 | 13 | L | 13 |
| 14 | 14 | L | 14 |
| 15 | 15 | L | 15 |
| 11 | 8, 9, 10, 11 | W | 8, 9, 10 |
| L | 11 |
| 7 | 4, 5, 6, 7 | W | 4, 5, 6 |
| L | 7 |
| 3 | 0, 1, 2 | W | 0, 1, 2 |
Table 2.
Attack suspects for Sensitive path 2.
Table 2.
Attack suspects for Sensitive path 2.
| Collision | Suspects with Collision | Detected | Suspects with Collision |
|---|
| Point | Point Router Detection | Direction | Point Direction Detection |
|---|
| 9 | 9 | L | 9 |
| 10 | 10, 11, 12,
13, 14, 15 | E | 11 |
| S | 12, 13, 14, 15 |
| L | 10 |
| 6 | 4, 5, 6, 7 | E | 7 |
| W | 4, 5 |
| L | 6 |
| 2 | 0, 1, 3 | E | 3 |
| W | 0, 1 |
Table 3.
Attack suspects for Sensitive path 3.
Table 3.
Attack suspects for Sensitive path 3.
| Collision | Suspects with Collision | Detected | Suspects with Collision |
|---|
| Point | Point Router Detection | Direction | Point Direction Detection |
|---|
| 5 | 5, 6, 7 , 8,
9, 10, 11, 12,
13, 14, 15 | E | 6, 7 |
| S | 8, 9, 10, 11,
12, 13, 14, 15 |
| L | 5 |
| 1 | 0, 2, 3 | E | 2, 3 |
| W | 0 |
Table 4.
Attack effectiveness (S_A: 15, PL_A: 30, PL_S: 10, PL_R: 10, PIR_R: 0.01).
Table 4.
Attack effectiveness (S_A: 15, PL_A: 30, PL_S: 10, PL_R: 10, PIR_R: 0.01).
| Attacker | Sensitive | Attacker | Attacker PIR_A | Attack |
|---|
| PIR_A | PIR_S | Effective PIR_A | Deviation (%) | Effective |
|---|
| 0.003 | 0.003 | 0.003 | 0 | ✗ |
| 0.003 | 0.01 | 0.003 | 0 | ✗ |
| 0.003 | 0.03 | 0.003 | 0 | ✗ |
| 0.01 | 0.003 | 0.0071 | 29 | ✓ |
| 0.01 | 0.01 | 0.0071 | 29 | ✓ |
| 0.01 | 0.03 | 0.0070 | 30 | ✓ |
| 0.03 | 0.003 | 0.0086 | 71.33 | ✓ |
| 0.03 | 0.01 | 0.0085 | 71.67 | ✓ |
| 0.03 | 0.03 | 0.0086 | 71.33 | ✓ |
Table 5.
End-to-End delay under no attack (PL_S: 10, PL_R: 10, PIR_R: 0.01).
Table 5.
End-to-End delay under no attack (PL_S: 10, PL_R: 10, PIR_R: 0.01).
| Sensitive | Mean End-to-End | Sample Standard | Detection Threshold |
|---|
| PIR_S | Delay (Clock Cycles) | Deviation (Clock Cycles) | (Clock Cycles) |
|---|
| 0.003 | 88.9056 | 17.3167 | 97.5640 |
| 0.01 | 162.0356 | 43.6219 | 183.8466 |
| 0.03 | 915.5529 | 405.9398 | 1118.5228 |
Table 6.
Attack detection (S_A: 15, PL_A: 30, PL_S: 10, PL_R: 10, PIR_R: 0.01).
Table 6.
Attack detection (S_A: 15, PL_A: 30, PL_S: 10, PL_R: 10, PIR_R: 0.01).
| Attacker | Sensitive | End-to-End | Attack Detected by | Attack Detected | Collision Point |
|---|
| PIR_A | PIR_S | Delay (Clock cycles) | System Manager | by Attacker | Detection Confidence |
|---|
| 0.003 | 0.003 | 181.331 | ✓ | ✗ | ✗ |
| 0.003 | 0.01 | 765.047 | ✓ | ✗ | ✗ |
| 0.003 | 0.03 | 2679.22 | ✓ | ✗ | ✗ |
| 0.01 | 0.003 | 656.859 | ✓ | ✓ | 1 |
| 0.01 | 0.01 | 3346.42 | ✓ | ✓ | 0.8 |
| 0.01 | 0.03 | 4336.19 | ✓ | ✓ | 0.7 |
| 0.03 | 0.003 | 308.823 | ✓ | ✓ | 1 |
| 0.03 | 0.01 | 2937.8 | ✓ | ✓ | 1 |
| 0.03 | 0.03 | 4318.1 | ✓ | ✓ | 0.95 |
Table 7.
Area and critical path delay overhead.
Table 7.
Area and critical path delay overhead.
| Router | Area | Critical Path Delay (ns) |
|---|
| Sequential | Combinational | Total | Overhead |
|---|
| (m) | (m) | (m) | (%) |
|---|
| Baseline | 48378.7 | 42669.0 | 91047.8 | – | 4.82 |
| CPRD Router | 52033.7 | 55129.9 | 107163.7 | 17.7% | 4.8 |
| CPDD Router | 58313.6 | 53873.9 | 112187.5 | 23.2% | 4.79 |
Table 8.
Power overhead.
| Router | Switching | Internal | Leakage | Total | Total |
|---|
| Power (mW) | Power (mW) | Power (mW) | Power (mW) | Overhead (%) |
|---|
| Baseline | 0.151 | 3.663 | 0.261 | 3.814 | – |
| CPRD Router | 0.273 | 3.374 | 0.327 | 4.008 | 5% |
| CPDD Router | 0.269 | 3.905 | 0.346 | 4.174 | 9.4% |
© 2019 by the authors. Licensee MDPI, Basel, Switzerland. This article is an open access article distributed under the terms and conditions of the Creative Commons Attribution (CC BY) license (http://creativecommons.org/licenses/by/4.0/).

 ,
, 


