


The Water–Energy–Food Nexus: An Analysis of Food Sustainability in Ecuador

1
Department of Energy and Mechanics, Universidad de Las Fuerzas Armadas ESPE, s/n Av. General Ruminahui, Sangolquí 171103, Ecuador
2
Faculty of Administrative Sciences, Escuela Politécnica Nacional, E11-253 Av. Ladrón de Guevara, Quito 170525, Ecuador
*
Author to whom correspondence should be addressed.
Resources 2022, 11(10), 90; https://0-doi-org.brum.beds.ac.uk/10.3390/resources11100090
Submission received: 31 August 2022
/
Revised: 24 September 2022
/
Accepted: 24 September 2022
/
Published: 30 September 2022
(This article belongs to the Topic Energy-Water Nexus)
Abstract
:In Latin America and the Caribbean, the interrelationships among water, energy, and food are complex, partly due to their development models, which are intensive in their use of these resources. This research aims to recognize and quantify the use of water and energy in food in Ecuador by identifying the main interrelationships, together with their causes and current impacts. Regarding methodology, this research uses sectoral data available at the national level and international databases to obtain cross indexes. The following indicators were sought: percentage of energy demanded by food in different stages, extraction of water for agricultural use, food energy productivity, virtual water, and embodied energy. As a result, it was estimated that food consumes 50% of imported energy and cocoa stands out with 7.6 km3 of water footprint; the products with the highest energy consumption are shrimp with 2090 KBOE and fish with 1459 KBOE. Fishing and aquaculture products present with a significantly high consumption level. Nearly all the virtual water and embodied energy are exported in banana, cocoa, and shrimp. Exporting groups make extensive use of the country’s water and energy resources.
1. Introduction
The concept of the water–energy–food nexus (WEF nexus) was born in 2011 at the Bonn conference [1]. These resources are essential and fundamental elements for the well-being of humanity, for poverty reduction, and for sustainable development. The WEF nexus approach establishes that, in an environment of climate change, demographic growth, and changes in consumption habits, these resources are increasingly interdependent. This means that the policies of one sector can affect the other, and this must be taken into account for the sustainability of the development plans of each country [2].
According to Zisopolou et al. [3], a WEF nexus approach is presented as the only viable solution that can balance the expected increase in demand for these three fundamental resources, which are unevenly distributed around the world. This approach identifies the interrelations among water, energy, and food production, and advocates for its integrated management.
The WEF nexus approach aims to meet the Sustainable Development Goals (SDG) set in the 2030 Agenda. The SDGs that are directly relevant to the nexus approach are Goal 2: zero hunger, Goal 6: clean water and sanitation, and Goal 7: affordable and clean energy. The adoption of this approach reduces the risk that the actions formulated in favor of the SDGs weaken each other, thus guaranteeing the sustainable use of resources [4].
Food systems are at the center of the SDG and crucially depend on a series of natural resources, particularly fresh water and energy. Seventy percent of the water is used for the production of agricultural goods in the countryside, and also all along the food supply chain. Thirty percent of the total end-use energy consumption is devoted to this sector [5,6].
Managing food, water, and energy systems is a growing challenge for Latin America and the Caribbean (LAC), which is the most unequal region in the world [7]. According to [2], local and global population growth and its changing habits exert great pressure on water, energy, and food resources in LAC. This subregion is the world’s leading net food exporter [8], but this intensive exploitation has gone hand in hand with the increase in pollution and the degradation of ecosystems, threatening water, energy, and food security [9]. As the global demand for food grows, the pressure on its natural resources in LAC will increase [10].
The connection among the food, water, and energy sectors in LAC are complex [2,7,9]. Understanding the various risks and synergies of the WEF nexus, as well as the impacts on different stakeholders, is essential to seek sustainable development. For this reason, governments, academia, and other interested parties are undergoing investigations in order to help design policies that seek a balance between sustainable development and competitiveness.
This research aims to identify and quantify the use of water and energy in food in Ecuador by identifying the main interrelationships, together with their causes and current impacts. This document begins with Section 2, which is a background chapter on the characteristics of Ecuador in the food, energy, and water sectors. Section 3 presents the methods used in this research. Section 4 contains the results and their discussion. At the end of this document, conclusions are drawn, and policy suggestions are presented.
2. Characteristics of Ecuador
Ecuador is a tropical country located right in the middle of the equinoctial line. It is one of the smallest countries in the subcontinent, has a population of 17.3 million people, and the highest population density in LAC (Index Mundi 2021) [11]. The prevalence of undernourishment exceeds the regional average of 7.2% (FAO 2021a) [12]. During the period of 2009 to 2019, it had an accumulated GDP growth of 31.8%. The primary sector of economy has a participation of 20%, being over the average in LAC, which is 13% [13]. Its main export product after crude oil is food [14].
The Constitution, known for being progressive, establishes in articles 313 and 318 that water and energy are strategic sectors that must be mainly at the service of food sovereignty. The food, energy, and water production sectors are described below.
2.1. Food Production in Ecuador
Article 281 of the Constitution establishes that food sovereignty constitutes a strategic objective and an obligation of the State in order to guarantee that individuals, communities, peoples, and nationalities achieve healthy and culturally adequate food self-sufficiency in a permanent manner. The Organic Law of the Food Sovereignty Regime (LORSA, By its initials in Spanish.) [15] was approved in 2009. The purpose of this law is to establish the mechanisms through which the State complies with the food sovereignty regime.
Ecuador is considered a megadiverse country thanks to, among other things, the presence of the Andes Mountain range, which divides the territory into diverse natural landscapes, climates, and microclimates that encourage agricultural practices [16]. In addition, it has a privileged oceanographic location that offers an abundant and varied maritime platform [17]. Ecuador, along with Chile, Colombia, and Uruguay are the leading food exporting countries in the LAC region [18].
Based on the Food Balance Sheet (FBS), the largest production of these are listed on Table 1, and represent 97% of the total production.
In 2019, the main export foods were shrimp with USD 3891 million, bananas with USD 3174 million, canned tuna with USD 1207 million, and cocoa with USD 657 million [14]. Activities associated with agricultural, livestock, and fishery products account for 53% of employment linked to exports [19].
From the total imports related to agriculture, 41% corresponded to foods like soy oil, wheat, fish, frozen crustacean, and fruits. Fifty-three percent correspond to raw material, intermediate products (soybean meal and other feed concentrates used to feed animals), and supplies (seeds, fertilizers, fungicides, herbicides, and insecticides) [20].
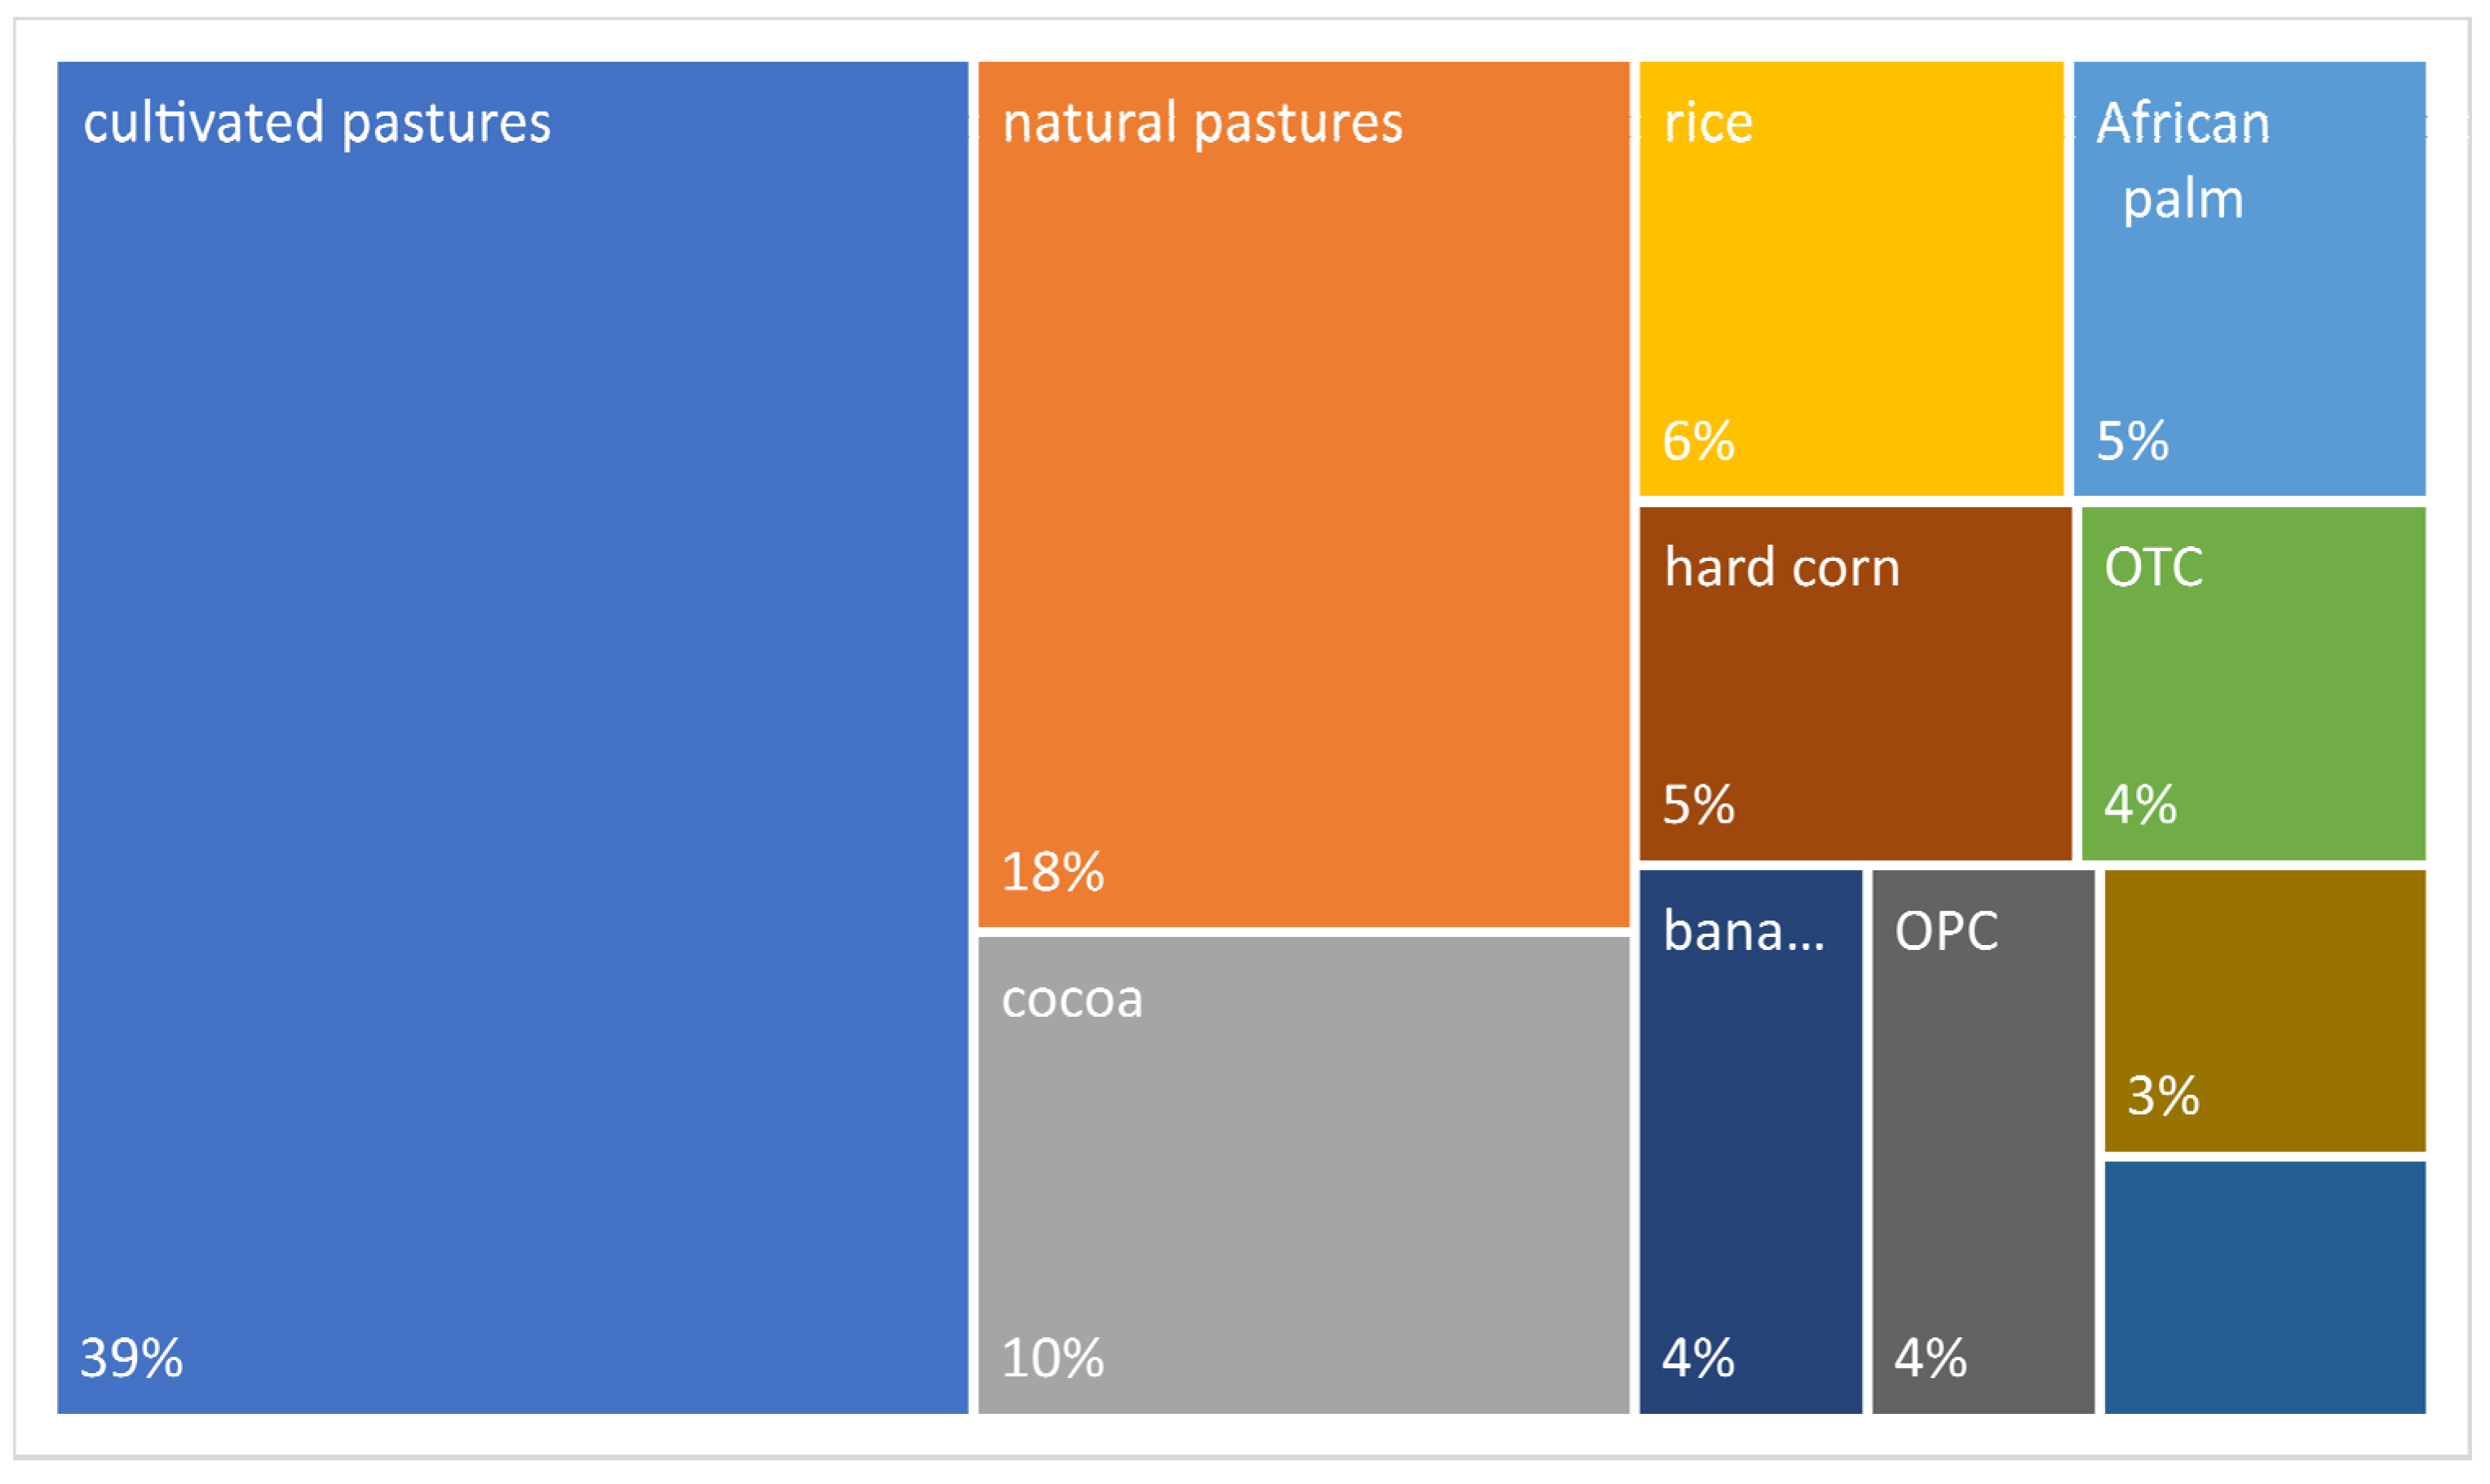
The farming work surface in 2020 was 5.2 million hectares. From the areas destined to production, 39% corresponds to cultivated pastures, 18% to natural pastures, 28% corresponds to permanent crops oriented to exportation and agroindustry, like cocoa, African palm, green plantain, banana, sugar, and other permanent crops, and 16% corresponds to transitory crops of peasant family farming, like rice, hard corn, and other temporary crops [21]. See Figure 1 for more details.
Access to resources is different. The large agro-industrial and exporter groups have 80% of the land gathered in 15% of the agricultural production units (APU), utilize 63% of the irrigation water, use agrochemicals indiscriminately, and are focused on agroindustry and export. On the other hand, peasant family farming has 20% of the land with 85% of the APUs, has 37% of the irrigation water, and plays a strategic role within the concept of food security, since it is in charge of 64% of the supply of agricultural goods fit for consumption in the inland region [16,22].
Of the four countries previously mentioned, Ecuador presents the highest use of fertilizers [18]. The average use of fertilizers in Ecuador is 314 kg/ha, and it is one of the highest users worldwide [23]. Banana stands out, using 682 kg/ha of fertilizer, which implies 112,611 tons applied in 2019. The products that consume the most fertilizers are shown in Table 2.
As stated by the FAO [5], out of the 10 main users of pesticides by cultivation area in the world, six are from LAC. Ecuador ranks second after China, with 26 kg/ha [25]. Agrochemicals have various benefits, but the lack of efficient management leads to a series of adverse effects on health and the environment throughout their life cycles [26].
2.2. Water in Ecuador
According to the Constitution of the Republic of Ecuador, water is a natural heritage, strategic, and for public benefit, and must be used in harmony and with social, community, environmental, cultural, economic, and political values. Articles 318 and 411 state that water resources will be used for human consumption, irrigation that will guarantee food sovereignty, ecological flow, and productive activities, in this order of priority. In addition, it is mentioned that the sustainability of ecosystems and human consumption will be imperative in the use and exploitation of water.
The Organic Law of Water Resources, Uses, and Utilization of water (LORHUyA, By its initials in Spanish.) [27] was brought into effect on 6 August 2014. This law is an example of a form of modern water regulation that attempts to provide a solution to specific national problems, using the techniques present in modern legislation on water resources, such as integrated management, water planning, ecological flow, and the right to water [28]. The regulation that makes LORHUyA operational was approved on 20 April 2015 [29].
In Ecuador, there is an important water wealth, however, it presents a greatly diverse panorama in water systems, and a great heterogeneity in the spatial distribution of the resource, which is limited by physical and weather conditions. It has two hydrographic watersheds: The Atlantic one to the orient and the Pacific one to the occident. The water systems that course through the Amazon and flow into the Atlantic have 317 km3 per year, while the ones that flow into the Pacific have 115 km3 per year [30]. Irrigation, with 71%, is the activity with the highest water consumption, and this is a trend in Latin America [31].
In Ecuador, it is estimated that 65% of the water that flows below 2000 masl is polluted [32]. According to SENAGUA [33], it is not fit for human consumption and fulfills only half of the quality standards for the use in agricultural activities. For example, the Daule River, in addition to being used for irrigation, is a source of water for human consumption. The values found are compared with the permissible limits established in the Ecuadorian regulations (https://www.ambiente.gob.ec/wp-content/uploads/downloads/2018/05/TULSMA.pdf (accessed on 20 August 2022)). The dissolved oxygen value found was 4.56 mg/L; which does not meet the minimum limit of 6 mg/L. In addition, 16,000 MPN/100 mL of fecal coliforms were found; the maximum permissible limit is 1000 MPN/100 mL. In the El Mate irrigation system, associated with this river, a nitrate value of 86.48 mg/L was detected; the limit is 10 mg/L. The water quality index determined that it is questionable for human consumption and requires treatment to be used in most crops [33].
This situation arises, among other factors, because only 5% of the wastewater in the urban sector is treated, and more than 61% is discharged directly into the rivers in most cities. Furthermore, there is pollution due to the use of agrochemicals and industrial waste, among others. According to Deknock et al. [34] and Villegas et al. [35], pollution of the freshwater environment with pesticides was widely present throughout the Guayas river basin and represents an environmental risk. According to Izurieta et al. [36], pollution by agrochemicals is mainly related to the industrial agricultural production of bananas and African palm, while pollution of the river mouths is closely related to shrimp activity.
According to SENAGUA [30], in 2016, the authorizations for the use of surface water were 16,574 L/s for irrigation and 7466 L/s for the industrial sector. Regarding the authorized underground flow, the increase was significant, going from 2342 L/s mainly for irrigation in 2006 to 9841 L/s mainly for industrial use in 2016 [30]. However, according to the database concessions (The superficial and groundwater concessions database was provided by the Ministry of Environment, Water and Ecological Transition for this research.), the largest flows are used for fish farming, shrimp farming, pastures, watering holes, banana, rice, and sugar and for banana, sugar, shrimp, and rice, to superficial and groundwater, respectively. This database has typing errors and non-uniform information which, according to the Ministry of Environment, Water and Ecological Transition personnel, is being corrected.
There is fresh water available underground, mainly in the basin of the river Guayas and in the Oriental region. In the Western part of the Guayas province, there are areas in which underground water is the only resource accessible for the public supply of towns or the irrigation of crops [37], and, consequently, it is the essential resource for food security and vital for the functioning of ecosystems.
Additionally, 78% of the surface with irrigation infrastructure in Ecuador uses the gravity drip method, which presents with high losses of liquid in the conduction) [38]. According to the Ministry of Agriculture and Livestock (MAGAP, The superficial and groundwater concessions database was provided by the Ministry of Environment, Water and Ecological Transition for this research.) [39,40], it is imperative to establish policies that tend to improve agricultural practices, especially regarding the use of agrochemicals and irrigation methods.
Probably, for the reasons indicated in the previous paragraphs, the productivity of water in Ecuador, which is equal to US$6/m3, is the lowest of the Andean countries [41]. According to Arroyo et al. [41], the average in LAC and the world is US$10/m3 and US$12/m3, respectively.
Through a regulation issued by the Water Regulation and Control Agency (ARCA) [42], the technical criteria for raw water rates for the different uses and exploitation of water were achieved. For productive irrigation of up to 50 L/s, the rate established was USD 0.0039/m3.
The virtual water exported by the LAC region is projected at about 190 km3, that is, about 20% of the global estimate [41]. In certain regions of Ecuador, the relations among the different users of the resource are controversial, especially between industrial and export agriculture and peasant family farming [43,44,45,46,47,48].
2.3. Energy Panorama in Ecuador
The promotion of sovereignty and energy efficiency are mentioned in the Constitution in Articles 15 and 143, respectively. According to this Magna Carta, these will not be achieved through the detriment of food sovereignty, nor will it affect the right to water.
The Organic Law on Energy Efficiency (LOEE) [15], approved in 2019, declares, of national interest and as State policy, the efficient, rational, and sustainable use of energy in all its forms as a key element in the development of a supportive society, competitive in production, and concerned with economic and environmental sustainability. In 2021, through Executive Decree No. 229, its General Regulations are issued.
Ecuador is a net exporter of energy, which exported 137,253 KBOE in 2019. The index of energy sufficiency between 2009 and 2019 was 2.12 on average. This indicates that primary energy production, mostly made up of crude oil, was more than double its energy demand [51].
In 2019, the main energetics consumed were diesel with 29,560 KBOE, gasoline with 27,869 KBOE, electricity with 15,996 KBOE, and LPG with 9339 KBOE. In order to supply the energy demand, Ecuador needs to import diesel, gas, and LPG at 62%, 63%, and 86%, respectively. The index of energy self-sufficiency between 2009 and 2019 decreased 5.7% due to an increase of 64% of the imports of the oil derivatives that were mentioned above [51].
The final energy consumption per capita in Ecuador, with 5.1 BOE/hab, is the highest in the Andean countries. See the last column in Table 3. According to Castro et al. [52], it is mainly due to the consumption of transport. In Ecuador, the energy indexes of the transport sector stand out. Together with Bolivia and El Salvador, they are the countries that consume over 50% of their energy through transportation. The energy intensity of transport is 0.3 BOE/US$1000, which is the highest after Bolivia. Ecuador, with 12.6 BOE/eq-car, is the country that consumes the most energy per equivalent vehicle. See columns 2, 6, and 9 of Table 3.
In contrast, the percentage of consumption in the industrial, agricultural, and residential sectors is 15%, 1%, and 14%, respectively; they are one of the lowest percentages of LAC [53,54]. See columns 3, 4, and 5 of Table 3. The production system in the agricultural sector in Ecuador is 81% low-scale production and low-energy consumption [55].
According to Lapillone [53], Ecuador, along with Panama and El Salvador, were the nations with the greatest predominance of oil in their industrial energy matrix, at around 60%. In the 2019 Energy Balance [51], the most used energy sources in the industrial sector were electricity and diesel, at 49% and 17%, respectively. The industrial energy intensity is 0.4 BOE/US$1000. See column 7 of Table 3. It should be pointed out that the biggest industrial (Industrial sector with more than 10 employees) energy consumer is the food, drinks, and tobacco sector at 48% [56].
Agricultural energy intensity with 0.1 BOE/US$1000 is the lowest in LAC, along with Panama, Costa Rica, and El Salvador. This contrasts with the high participation of this sector in Ecuador’s GDP, which, at 8.8% in 2019, is one of the highest in LAC [53]. See column 8 of Table 3.
On the other hand, the household sector consumes LPG, electricity, and fuelwood at 52%, 37%, and 11%, respectively. It is the highest consumer of LPG in the country, with 71% of the total consumed, preferably for cooking food [51]. Household energy consumption in Ecuador is 2.6 BOE/dw, one of the lowest in LAC after Bolivia, Costa Rica, and El Salvador. Homes designate, on average, 3.4% of the annual expense to energy, which is equivalent to approximately US$300 per year. Along with El Salvador, Bolivia, and Nicaragua, it is one of the lowest averages in LAC [57]. See columns 10, 11 of Table 3 for more details.
In 2015, a Cooking Energy Efficiency Program was implemented, which resulted in the sale of approximately 600,000 induction cookers and represented around 17% of the planned amount. As stated by Nolivos [58], this initiative is the biggest change to cooking using electric energy around the world. Nonetheless, the original goal was not achieved, which was to attain a massive transition of LPG to electricity and, thus, avoid the import of this hydrocarbon [59]. Furthermore, in 2012, the program named “Renova” was carried out, which replaced 28,000 inefficient refrigerators [57].

Table 3.
Ecuador energy indicators.
| Country | Percentage | Energy Intensity | Unit Consumption of Road Transport b | Energy Use per Household b | Annual Household Energy Expenditures c | Final Energy Consumption per Capita a | |||||
|---|---|---|---|---|---|---|---|---|---|---|---|
| Transport a | Industry a | Agriculture a | Household a | Transport b | Industry b | Agriculture b | |||||
| % | % | % | % | BOE/US$1000 | BOE/US$1000 | BOE/US$1000 | BOE/eq-car | BOE/dw | US$ | BOE/hab | |
| Argentina | 33 | 22 | 7 | 25 | 0.2 | 0.5 | 0.5 | 4.7 | 7.8 | 650 | 9.4 |
| Bolivia | 58 | 19 | 3 | 15 | 0.4 | 0.5 | 0.2 | 7.5 | 1.9 | 300 | 4.0 |
| Brazil | 36 | 36 | 6 | 11 | 0.2 | 1.0 | 0.6 | 6.0 | 2.8 | 1300 | 8.0 |
| Chile | 36 | 21 | 19 | 16 | 0.2 | 0.6 | 0.3 | 5.8 | 5.6 | 1500 | 11.6 |
| Colombia | 37 | 29 | 2 | 18 | 0.1 | 0.3 | 0.2 | 7.9 | 3.0 | 600 | 4.8 |
| Costa Rica | 50 | 23 | 2 | 12 | 0.2 | 0.5 | 0.1 | 5.8 | 2.2 | 1050 | 6.1 |
| Ecuador | 52 | 15 | 1 | 14 | 0.3 | 0.4 | 0.1 | 12.6 | 2.6 | 300 | 5.1 |
| El Salvador | 52 | 17 | 1 | 23 | 0.2 | 0.4 | 0.1 | 2.8 | 2.3 | 250 | 3.0 |
| Mexico | 43 | 34 | 3 | 14 | 0.2 | 0.5 | 0.5 | 4.5 | 3.8 | 750 | 7.4 |
| Nicaragua | 31 | 12 | 1 | 42 | 0.2 | 0.3 | 0.0 | 3.3 | 5.5 | 300 | 2.9 |
| Panama | 46 | 21 | 0 | 21 | 0.1 | 0.2 | 0.1 | 2.3 | 3.6 | 750 | 6.3 |
| Paraguay | 40 | 25 | - | 28 | 0.2 | 0.4 | 0.0 | 9.5 | 7.1 | 1000 | 6.5 |
| Peru | 45 | 18 | 10 | 19 | 0.2 | 0.2 | 0.6 | 8.3 | 3.1 | 350 | 4.4 |
| Uruguay | 28 | 42 | 5 | 17 | 0.1 | 1.0 | 0.4 | 6.5 | 4.7 | 2100 | 9.7 |
3. Methodology
As Naranjo and Willarts [9] recommend, to facilitate understanding of the interrelationship of the WEF nexus, the following indicators were sought: percentage of energy demanded by food in the different stages, extraction of water for agricultural use, and food energy productivity. In addition, following Salmoral and Yan [61], the virtual water and the embedded energy were determined. For this, data available at national level was used, such as Energy Balances [51], Food Balance Sheets (FBS) [55], and other secondary information from Ecuador or similar countries. The period of analysis was 2019; the years 2020 and 2021 are not a good benchmark due to the effect of the COVID-19 pandemic.
3.1. Indicators
3.1.1. Extraction of Water for Agricultural Use
3.1.2. Food Energy Productivity
This indicator proposed by Naranjo and Willaarts [9] is the energy productivity of food, expressed in tons per kilobarrel of oil equivalent (t/KBOE). See Equation (1).
where is the food energy productivity; is the food energy consumption. It is the energy consumption necessary to obtain each product, expressed in the barrel of oil equivalent per ton (BOE/t). This information does not exist in Ecuador, which is why data from Colombia, a neighboring country, is used [67]; and is each type of food.
3.1.3. Virtual Water
Following Salmoral and Yan [61] and Arroyo et al. [41], virtual water was understood as the volume of water exported in the trade of food products. See Equation (2).
where is virtual water; is the water footprint obtained from information from Ecuador. If it did not exist, international information was taken. The breakdown is in Section 3.3; is mass of the exported food (t) obtained from the food balance sheet [55]; and is each type of food exported.
3.1.4. Embodied Energy
Following Salmoral and Yan [61], embodied energy was understood as the quantity of energy exported in the trade of food products. See Equation (3).
where is embedded energy; is mass of exported food; and is each type of food exported.
3.1.5. Percentage of Energy Demanded by Food by Stage
This indicator was proposed by Naranjo and Willaarts [9] and refers to the amount of energy consumed in the different steps of the production chain. Its breakdown is developed in Section 3.2.
3.2. Energy Consumed by Food at Different Stages
Energy consumption in food was analyzed in the production, transport, processing, user transport, and household stages.
3.2.1. In Production
3.2.2. In Transport
For the estimation of transport demand, the load estimation proposed by Ulloa [69] was used. For this, the total demand in the farming, fishing, and trade sector was considered. For the manufacturing sector, 38% was considered, which corresponds to the percentage of the GDP of the food and beverage subsector [70]. See Table 5.
As a result, a demand of 41% in relation to the total of the freight transport was found.
The energy consumption of cargo transportation in 2019 was 16,680 KBOE [51], 41% of which corresponds to 6839 KBOE of diesel.
3.2.3. In Processing
In order to determine the energy consumption in processing, the energy participation of the food, drinks, and tobacco subsectors was used, regarding the industrial sector consumption. The percentages of each energetic are 52% diesel, 33% electricity, 100% sugarcane bagasse, 25% fuel oil, 30% LPG, 100% fuelwood, and 40% gasoline. These percentages were obtained from the Energy Balances in Ecuador in 2013 [56]. It should be noted that, in the subsequent Energy Balances, this analysis does not exist, which is why it is assumed that this percentage is applied for the period of 2019. See Table 6.
3.2.4. User Transport
In order to analyze user transport, the same criteria as Van Hauwermeiren et al. [71] was applied, which is a 5 km trip to the sales location to get 25 kg of food per family. One and a half trips per week was supposed. As a result, 5% of the average journey of a private vehicle to get food was obtained. For this reason, this percentage was applied to the average consumption of cars and SUVs in 2019. According to Terneus et al. (2022) [72], the average travel of a vehicle is 15,000 km/yr. See Equation (4).
The energy consumption of cars and SUVs in 2019 was 9900 KBOE [51], and 5% corresponds to 495 KBOE of gasoline.
3.2.5. Food Preparation
For energy consumption in food storage, it is considered that consumption by domestic refrigeration is 450 kWh per year on average. It should be noted that this value corresponds to the maximum consumption of a refrigerator established in the regulations [73]. Taking into account that energy consumption in a household is 1557 KWh a year [60], this value is equivalent to 30% of residential energy consumption.
3.3. Water and Energy Consumption in the Production of Food
A bibliographic revision was carried out with the purpose of finding previous studies about the water and energy consumption of main Ecuadorian products.
The water footprint of agricultural products can be found, which indicates direct or indirect appropriation of fresh water. Water footprint also includes the water necessary to assimilate the pollution produced by the use of agrochemicals [76,77]. The study done by Clerk et al. [62], ANA [64], and Pérez [66] was considered. In the absence of national information, global data presented by Mekonnen & Hoekstra [63,78] was used for milk, sugar, palm oil, and poultry. For shrimp, the water footprint provided by Wojcikiewicz et al. [65] was used. See the second column in Table 8.
To obtain the energy consumption in the production of the 14 main foods, in the absence of national data, the study carried out by the Mining and Energy Planning Unit of Colombia was used [67]. The energy consumption of the fishing and aquaculture sector was obtained as the ratio between the energy dispatch and the production of each product. See the third column in Table 8.
4. Results and Discussion
This chapter analyzes the results found. In Section 4.1, you will find the amount of energy dedicated to food in Ecuador and the energetics used. Section 4.2 shows the water and energy consumption of the main foods produced in Ecuador. In Section 4.3, there is a discussion.
4.1. Energy and Food
Based on the analysis of the energy consumed by food in the different stages, detailed in Section 3.2, the following information was obtained. See Table 9.
The energy demanded by food is made up of 14% electric energy, 73% fossil fuels, and 13% biomass. Food uses 50% of imported petroleum derivatives. The total energy consumption devoted to food is 24,967 KTOE, which is equivalent to 28% of the total consumption in Ecuador. According to Canning [79], this percentage in the USA, United Kingdom, and New Zealand is 16%, 20%, and 30%, respectively, while in developing countries it can reach 55% [5].
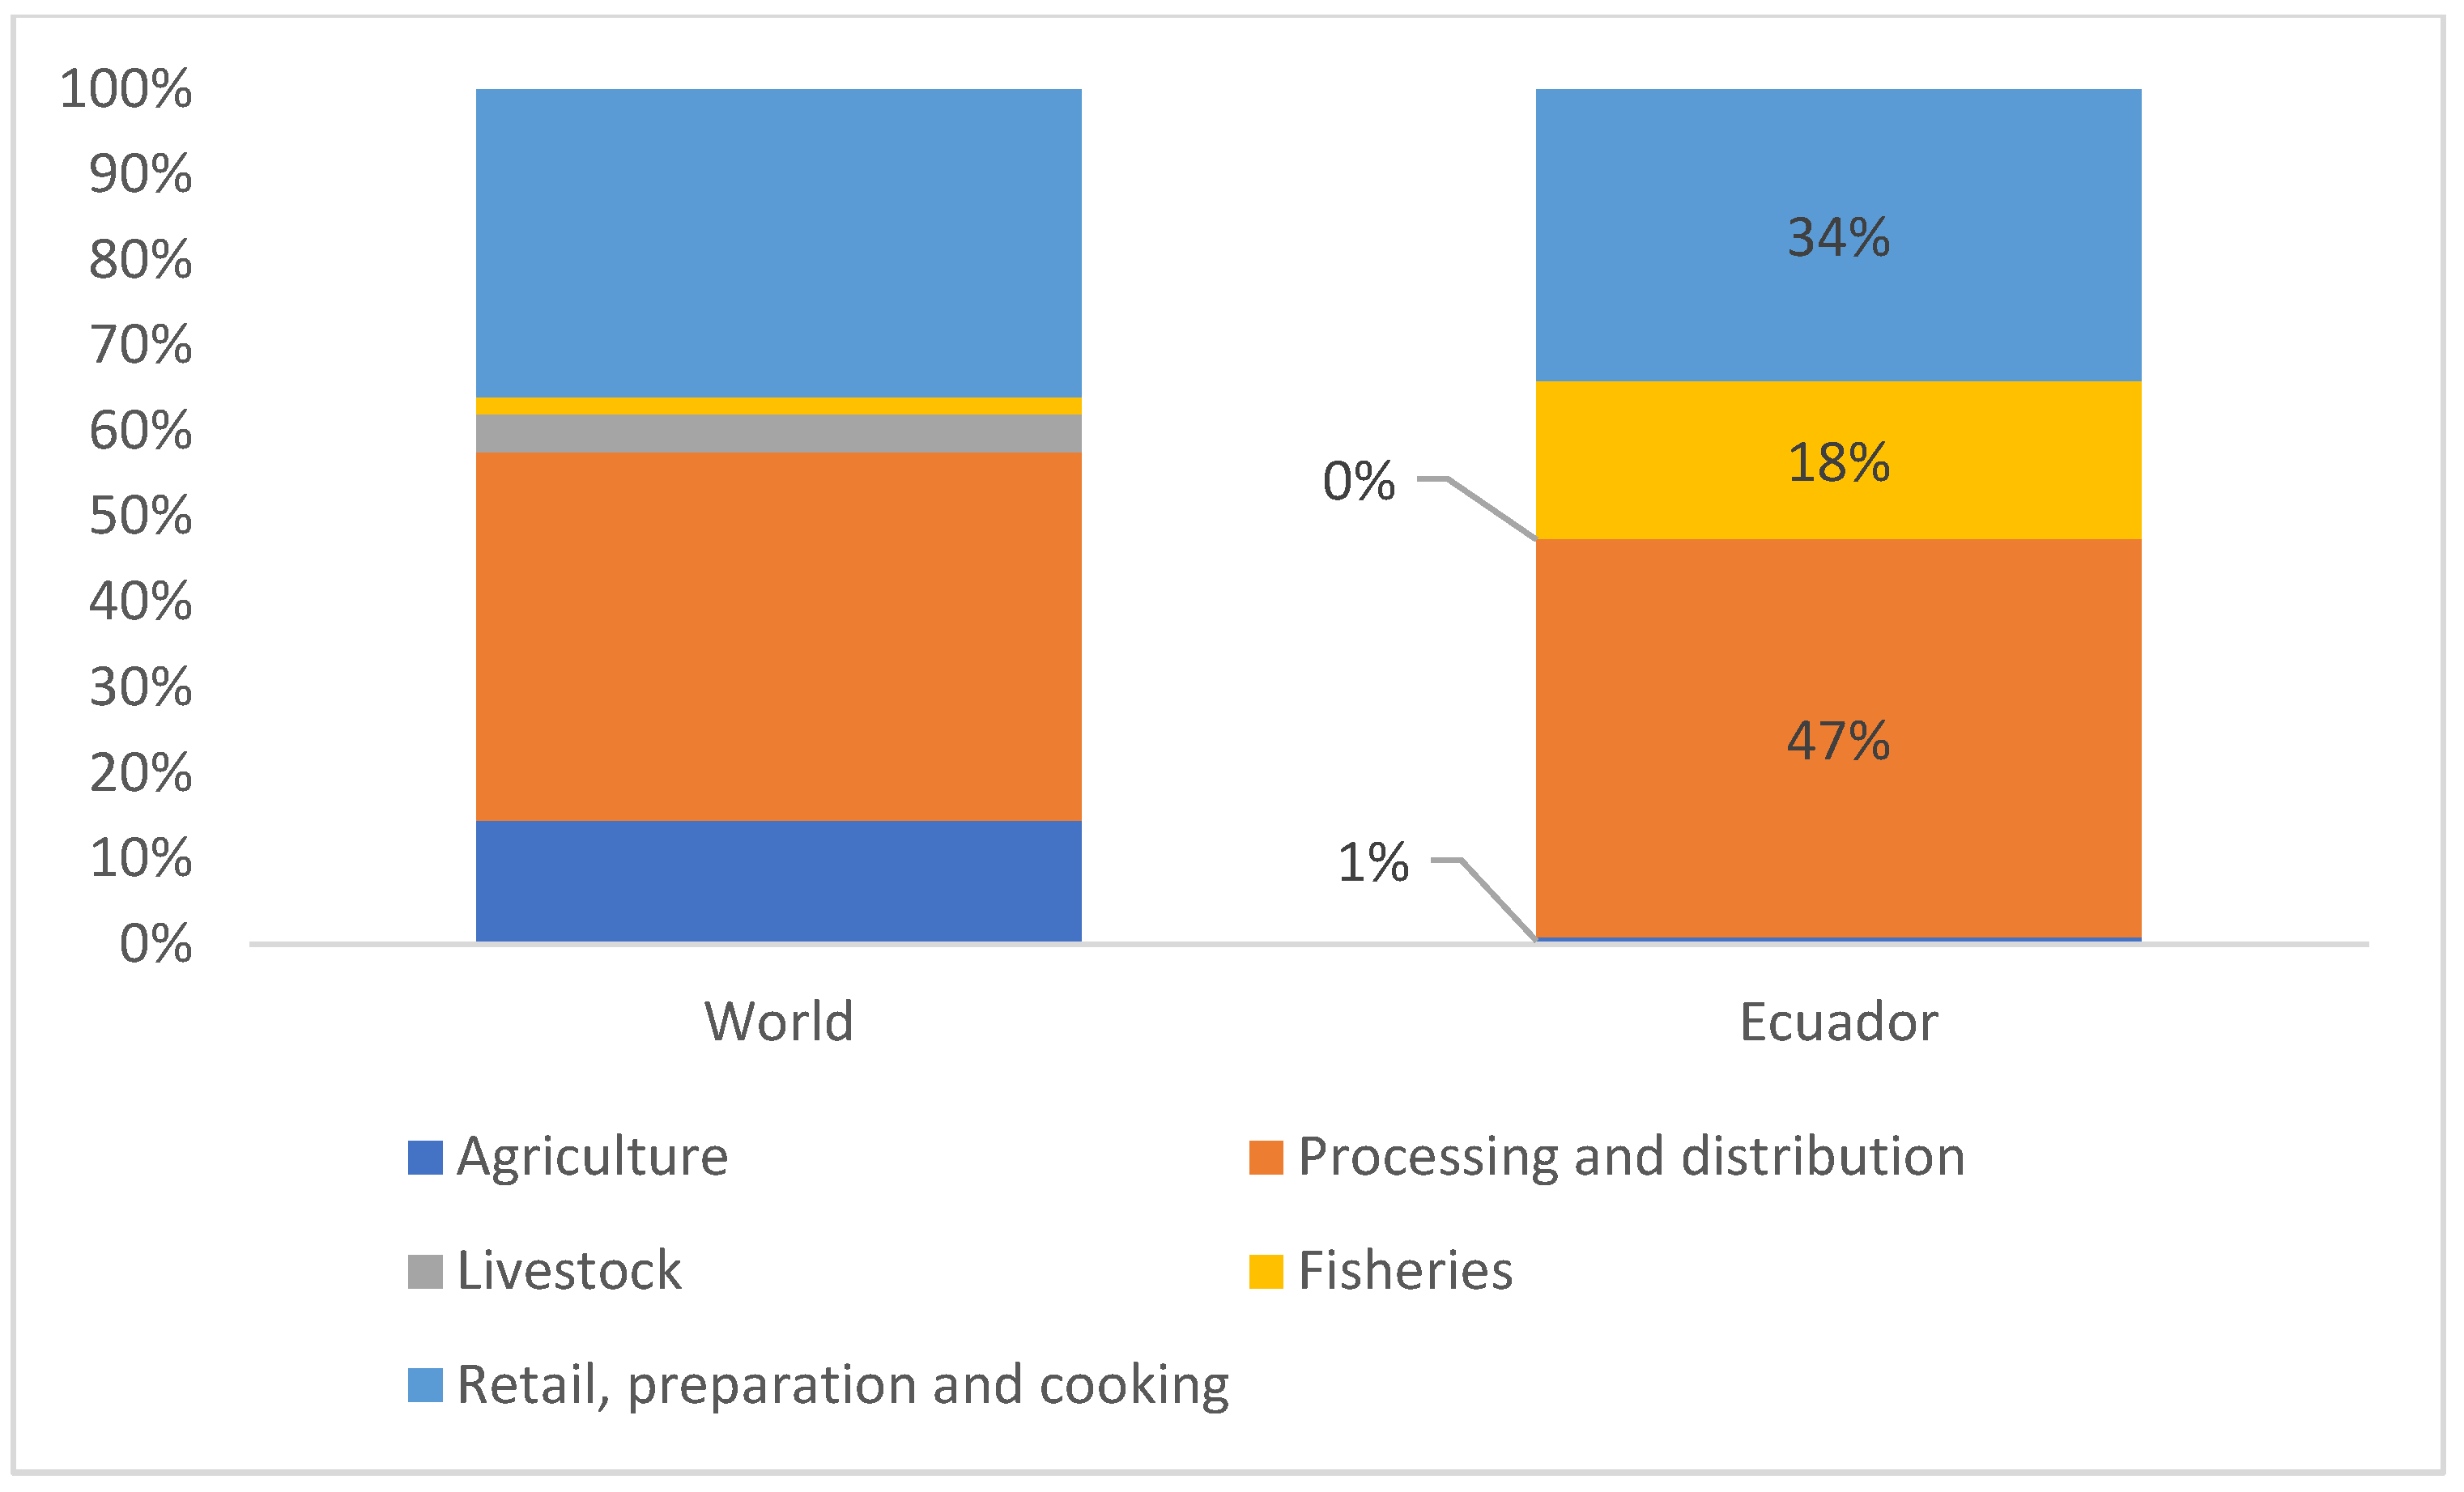
On the other hand, in Figure 2, the percentage of participation for agricultural, processing, fishing, and household activities is compared with a graphic of global averages according to the FAO [5]. It should be mentioned that, in Ecuador, there is no disintegration of the consumption of fuel for livestock.
When comparing areas in Figure 2, the following is inferred: First, the percentage of energy consumption from agriculture is lower than the world average. Second, consumption in retail, preparation, and cooking has a lower percentage than the world average. These two characteristics of Ecuador in the energy field were already indicated in Section 2.3. Third, fishing and aquaculture consumption in Ecuador have a higher percentage than the global average, which is 1% [80]. Next, the consumption in this sector is analyzed.
4.1.1. Fishing and Aquaculture Energy Productivity
According to the ARCERNNR, the fishing and aquaculture sector is classified as shrimp, tuna, other fisheries, and artisanal fishing.
Shrimp production is an energetically intense process, mainly due to pumping water and mechanical aeration [81,82]. Shrimp protein consumes the most fossil fuel after lobster protein [83]. Due to the high energy consumption of shrimp, which can be seen in Table 4 the Ecuadorian government launched the Project for the electrification of the shrimp sector [84].
The main exponent of industrial fishing is tuna, oriented mainly to the export market. According to Avadi et al. [85], the average consumption in Ecuador is significantly higher than the average catch in the Pacific Ocean, which is 2.2 BOE/t according to Parker et al. [86]. Table 10 presents the energy productivity and energy consumption of shrimp and tuna.
According to Article 104 of the Organic Law for the Development of Aquaculture and Fishing [87], the area established for artisanal fishing is within eight nautical miles. Artisanal fishing uses a significantly high amount of gasoline for two-stroke engines [88]. However, there is no information on the landings of artisanal fishing, so it is not possible to establish indexes of energy productivity or energy consumption.
4.1.2. Energetics Used in Food
Below, the use of diesel, electricity, LPG, firewood, gasoline, bagasse, and fuel oil in food is detailed.
Diesel
With 42% and 10,548 KBOE, diesel is the fuel with the highest consumption, mainly due to transportation, which has a consumption of 6839 KBOE. It should be noted that the energy consumption dedicated to transportation in Ecuador is the most inefficient in LAC, as indicated in Section 2.3 [53,60]. Additionally, among the sectors that consume diesel is fishing and aquaculture, with a consumption of 3599 KBOE. The industrial sector shows a small amount of consumption at 212 KBOE.
Electricity
In second place, with 14%, is electricity. This consumption is 3548 KBOE between industrial use and household use. The latter equals 1423 KBOE due to the use of the domestic refrigerator. Household electricity consumption per capita in Ecuador is below average in LAC [57].
LPG
LPG, with 23% of the total, has a consumption of 5697 KBOE, out of which 5286 KBOE corresponds to domestic cooking consumption. The energy consumption of the second is equivalent to 1.3 LPG tanks a month per family, as indicated by INEC [89]. The expense percentage of this energy in relation to the total household expense is 0.5%, which is the lowest in LAC [57]. On the other hand, consumption of this type of energy in the household sector is the highest in LAC with 85% [90]. The subsidy that Ecuador provides for this fuel is the highest that has ever been granted globally for cooking [58].
The industrial sector has a consumption of 214 KBOE. The agricultural sector has a consumption of 196 KBOE, which is used for grain drying, as indicated in Agreement 139 (https://www.ecolex.org/es/details/legislation/acuerdo-no-139-uso-de-gas-licuado-de-petroleo-glp-para-el-sector-agroindustrial-dedicado-al-secado-de-granos-lex-faoc079450/? (accessed on 20 August 2022)).
Gasoline
This energetic presents a consumption of 1566 KBOE. With this fuel, artisanal fishing stands out with 1005 KBOE, as already indicated in Table 4.
Fuelwood
This biomass presents a consumption of 1689 KBOE, mainly due to its use in domestic cooking, calculated at 1331 KBOE. In LAC, 20% of households located mainly in the rural areas use fuels like fuelwood, which are less efficient and more harmful to health. Ecuador is one of the countries in LAC that uses less fuelwood [57].
Sugarcane Bagasse
It is used seasonally to produce heat and electric energy [51,91,92] and has a consumption of 1543 KBOE. There is potential for the use of African palm, banana, rice, and sugarcane residues in export crops as well as in subsistence crops. Nonetheless, certain public policies, like energy subsidies, discourage the exploitation of residues [93].
Fuel Oil
Fuel oil has a consumption of 376 KBOE and is mainly used to produce heat.
4.2. Water and Energy Used in Food Production
The results found allow for the identification and estimation of the amount of energy and water used to produce food in Ecuador.
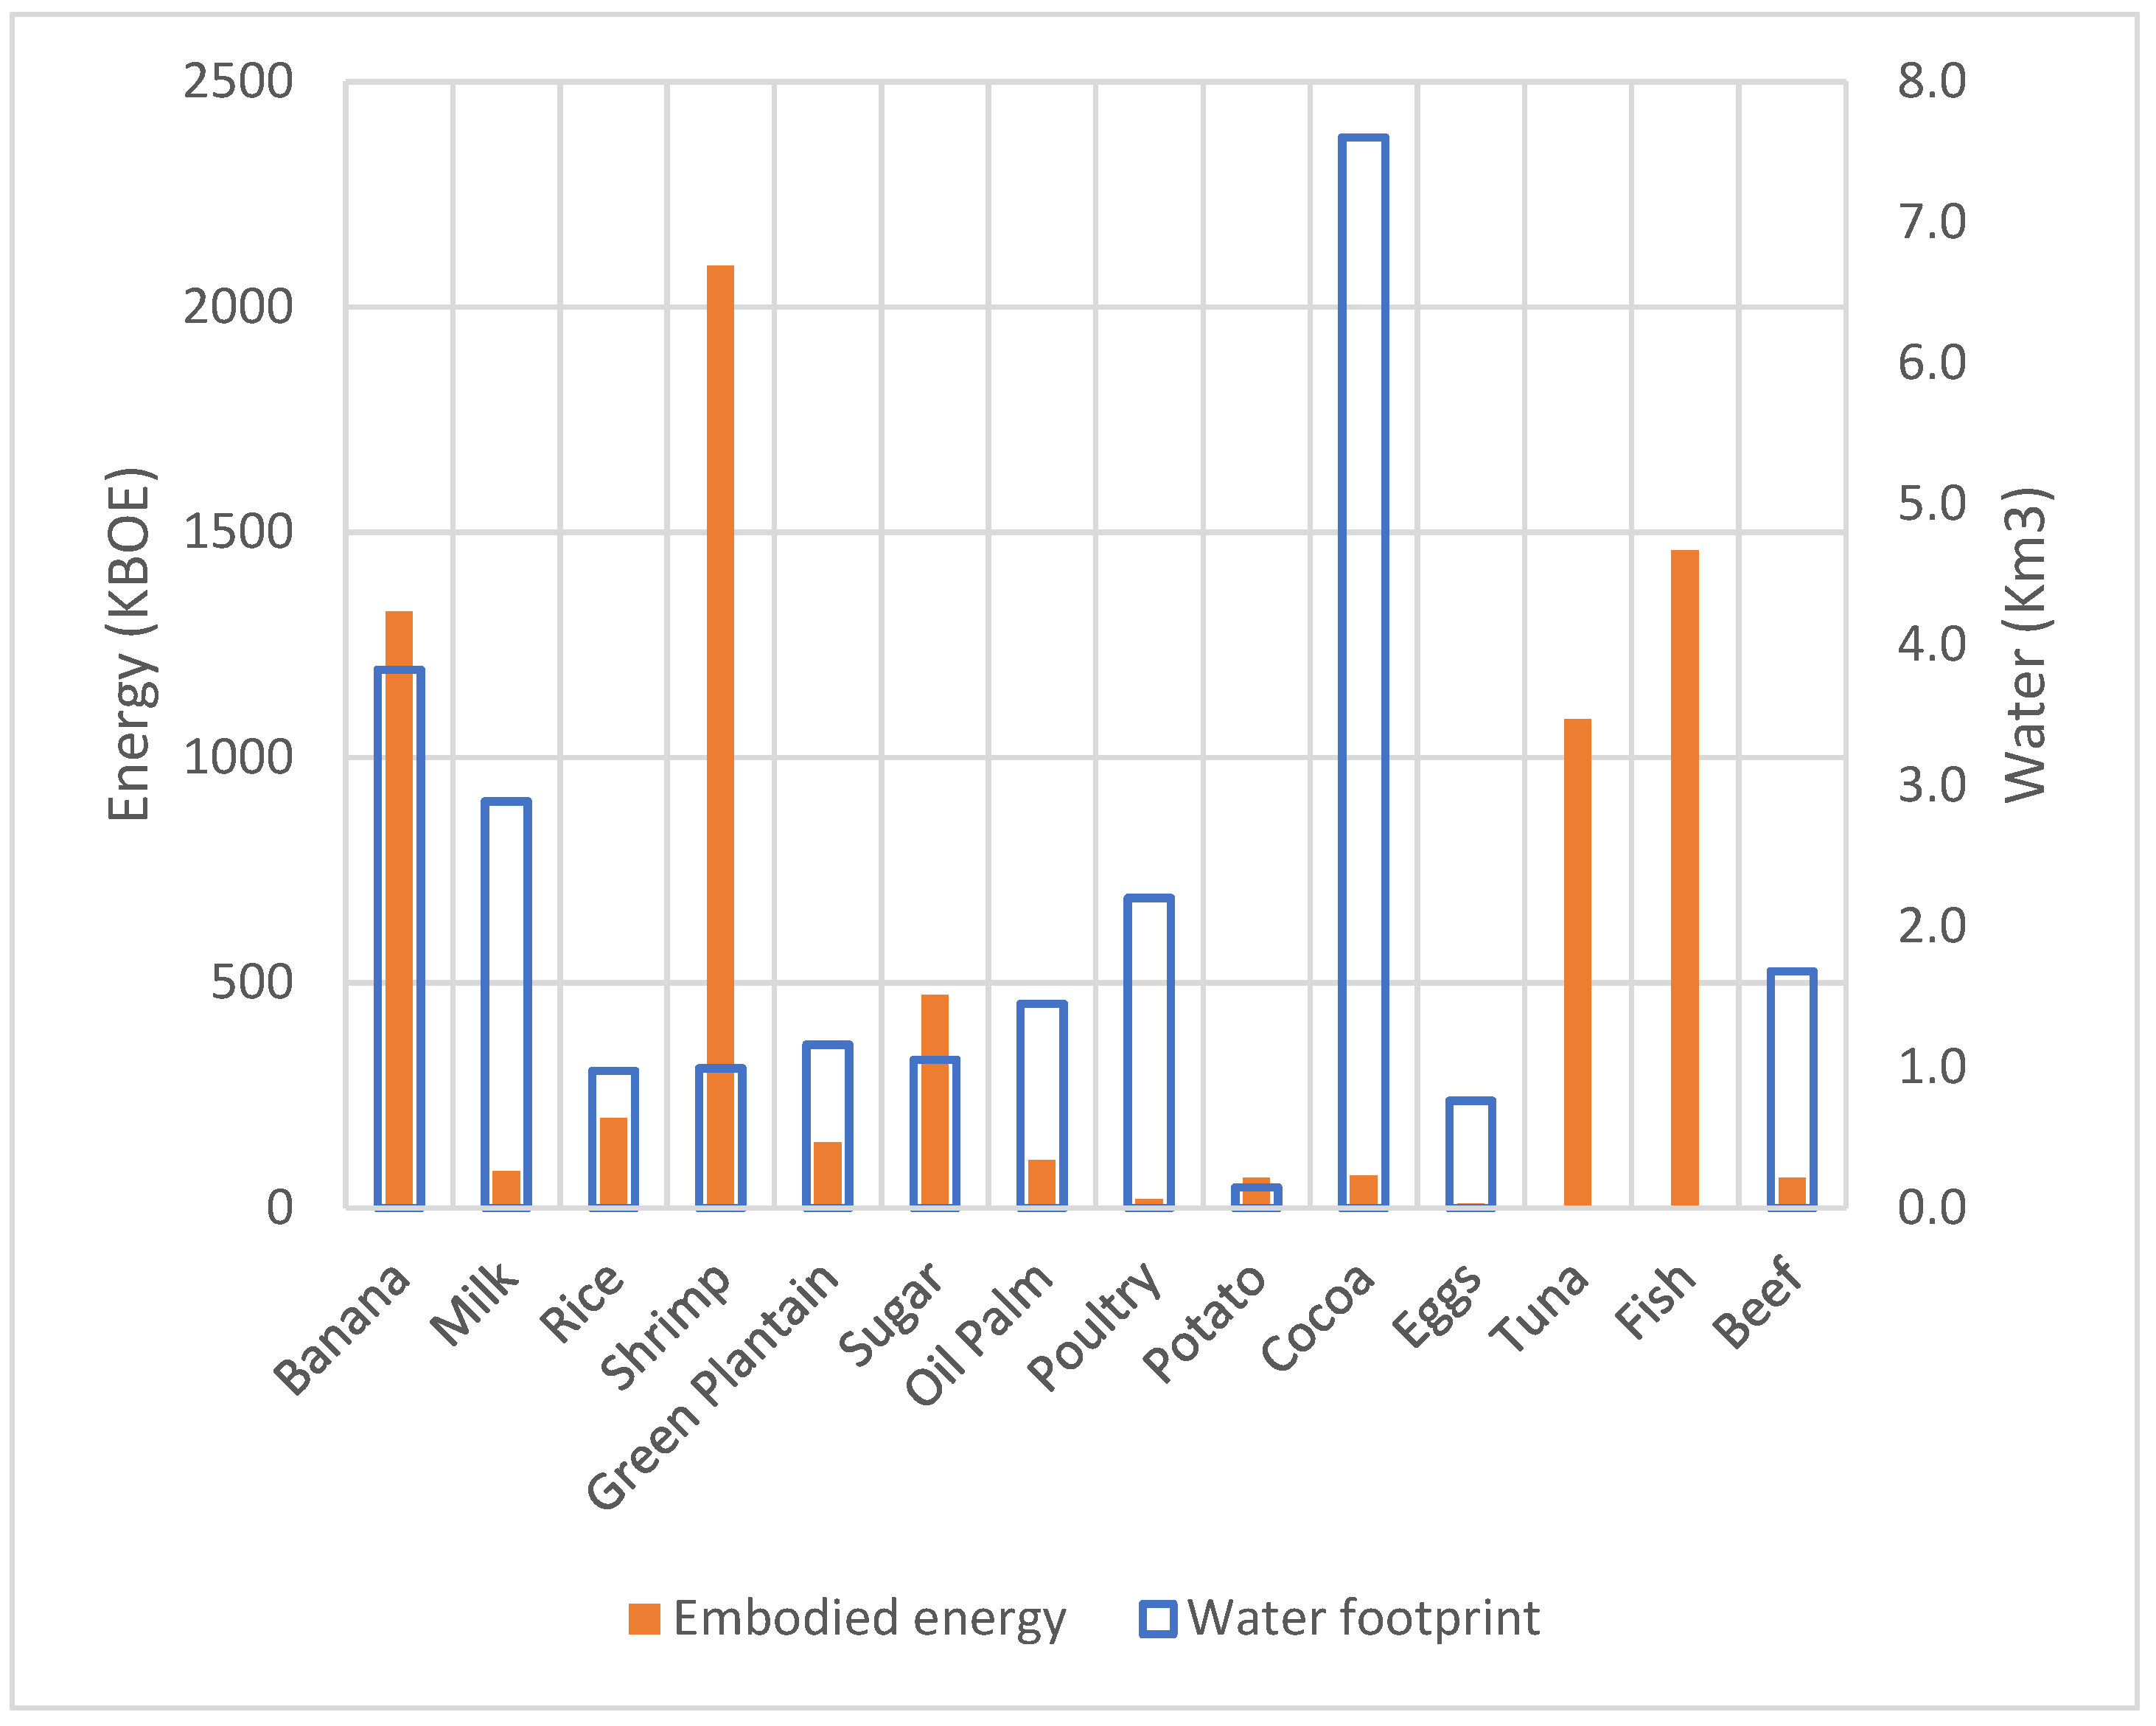
Cocoa, banana, milk, and poultry stand out with 7.6 km3, 3.8 km3, 2.9 km3, and 2.2 km3 of water footprint, respectively. On the other hand, the products with the highest energy consumption are shrimp, fish, banana, and tuna with 2090 KBOE, 1459 KBOE, 1324 KBOE, and 1084 KBOE, respectively. See Figure 3.
From the analyzed products, the water footprint is 25 km3, out of which 51% is oriented to the international market. Nearly all the virtual water is exported in banana and cocoa, at 60% and 35%, respectively. As stated by Isch & Zapata [46], the competitive advantage of Ecuador before the world seems to be precisely water. The amount of energy consumed in the products analyzed is 9213 KBOE, out of which 52% is destined for export. The largest amount of embodied energy in export products is found in shrimp and banana at 37% and 17%, respectively.
4.3. Discussion
Water is a preferential element within the WEF nexus and, in fact, out of the three elements, it has no substitute or alternative. However, due to a social conception that considers it abundant and cheap, it tends to be undermined because of the unequal value range in relation to other resources. In Ecuador, the high consumption of water and the levels of pollution, which are referred to in Section 2.3, make it clear that there is no conscience about the fact that water is a resource that needs protecting. As indicated by Jouralev & Saravia [10], development policies are required to build a social vision that water and the ecosystem are the natural resources in LAC, the base of its wealth, and their sustainability in time must be guaranteed.
Objective 3.3 of the National Irrigation Plan 2019–2027 [39] says to “optimize the efficiency in the use of water for irrigation.” As a goal for 2027, this objective includes the following: “55,966 ha with land irrigation technification.” Nonetheless, according to Franco & Sumpsi [94], the low price of water in Ecuador does not motivate more efficient water management. The incorporation of new technology will always generate barriers, which is why tax schemes should be established for those agents that use inefficient practices. On the other hand, addressing water scarcity problems by increasing technologies that promote irrigation efficiency is only possible if there are energy guarantees to support those technologies.
According to Embid and Martin [7], the risk of abusing surface and groundwater resources has three consequences. The first one, a reduction in water availability for use downstream, is due to resource grabbing. The second one is a deterioration in its quality due to pollution with agrochemicals. These two consequences are experienced in Ecuador and have already been described in Section 2.2. The conflicts over water are indicators of the imperative and especially troublesome interactions of the WEF nexus. Despite the fact that water contamination is a problem of great magnitude [32], the information available on this subject is limited and scattered. According to CEPAL [95], the laxity of the policies, their lack of compliance or their non-existence have contaminated the country’s water resources.
As a third point, overuse of underground aquifers with low prices in energy can lead to energy inefficiency and, in some cases, social injustice. As indicated in Section 2.2, in Ecuador there has been a sharp increase in the use of groundwater. In Mexico and in the Indian state of Punjab, excessive groundwater pumping for agriculture was directly related to energy subsidies [6,96]. An example of the interrelations with the three areas of the nexus can be seen in this case, having an impact on the quantity and quality of the groundwater for food, with a high energy cost for its extraction.
The low quality of the database of concessions granted by the state, which was mentioned in Section 2.2, shows a lack of attention to this resource. Shrimp farms located inland use groundwater, which means a potential risk for the salinization of aquifers. Because of this, they must reuse their water, which prevents effluents from entering natural waters [97,98]. According to the LORHUyA [29], control of the quantity and quality of water resources must be carried out. However, this mandate has been fulfilled in a limited way due to scarce economic resources, insufficient institutional capacities, and a lack of political will [32].
In Ecuador, the low price of oil derivatives, due to a generalized state subsidy, has induced the careless use of these energy sources, as widely mentioned by Vallejo [99], Espinoza and Guayanlema [100], Puig et al. [101], and Terneus, Guayanlema, and Cabrera [72]. This has had repercussions on the transport sector, which has the most inefficient energy consumption in LAC (see column 9 in Table 3). According to Avadi [85], this is one of the causes of the high energy consumption in tuna fishing, as indicated in 4.1.1. Without denying the need for subsidies as policy instruments to alleviate energy poverty, in Ecuador there is significant potential for their reorientation.
Article 285 of the Ecuadorian Constitution establishes that subsidies are intended to redistribute income. However, in this investigation, it has been determined that it also provides important support to large agro-industrial groups and exporters.
In this research, it has been found that food in Ecuador depends on approximately 50% of imported fossil fuel, which implies food vulnerability is influenced by the ups and downs of the world economy. The induction cooker program, explained in Section 2.3, was intended to reduce the use of imported LPG for domestically produced electricity, mostly from renewable sources. It can be pointed out that 63% of the electrical power installed in Ecuador is hydroelectric [51]. LPG, with 20%, is the third most used energy source, preferably for households. As seen in Section 2.3, in the region, Ecuador stands out for its extensive use of this hydrocarbon for domestic purposes, despite being imported and easily smuggled.
However, the most used type of energy is diesel, used mainly for cargo transportation. It should be noted that Article 14 of the recently approved LOEE considers this sector a priority. Historically, the State has been weak in its application of the respective controls in terms of registration and useful life times in trucks [102] and compliance with traffic laws [103]. On the contrary, the transportation sector has been gaining power [101,104].
Fishing and aquaculture have a significantly high energy consumption. The State must ensure that these industries implement actions to optimize the use of energy in their production processes, considering that the fuel is heavily subsidized by the State. It is important to note that the private sector could also be interested in reducing inefficiencies related to accessing international markets. These actions will have much better chances of success if they are developed within the framework of public policies.
On the other hand, artisanal fishing should be strengthened as a strategic sector for food security. However, informality and precarious living conditions make it an easy target to be co-opted by criminal organizations for drug and fuel traffic [105,106,107,108,109,110]. Yet, support for this sector should not consist of the cost of fuel that stimulates non-rational use and smuggling, but rather, in the improvement of its vessels, training, infrastructure, and other factors. In 2013, there was a program to replace two-stroke outboard engines with four-stroke engines, which are more efficient [111], but their impact is unknown.
In this investigation, with its own limitations, it has been possible to identify that the foods that consume the most energy in Ecuador are related to bananas, shrimp, tuna, and fishing. On the other hand, the foods that produce the most water footprint are banana and cocoa.
Ecuador, like the LAC region [66,112], is an exporter of virtual water and embodied energy through food. Virtual water is an indicator of the pressure exerted by international trade on water resources in producing countries [18].
Ecuador’s economic situation has forced it to opt for a development model fundamentally based on the intensive exploitation of its natural resources, which entails serious social conflicts and environmental degradation [10,113]. Nonetheless, this country depends on these industries for foreign exchange generation and job creation.
5. Conclusions
In this investigation, the WEF nexus in food in Ecuador was analyzed by estimating indicators that allow for the visualization of existing interrelationships. Information available publicly was analyzed, such as the food balance sheet and the National Energy Balance for 2019, which was the reference year of the research. For information that did not exist in Ecuador, approximations were established based on general parameters or those of other countries.
A significant dependence on imported energy for food was determined, which implies a situation of vulnerability to external events. The fishing and aquaculture sector presents a significantly high percentage of energy consumption. The artisanal fishing sector requires an intervention from the State in order to be a contributor to food security. Nevertheless, it should be noted that fuel subsidies makes it unsustainable and encourage traffickers to operate illegally.
Of all the water and energy required for food production, just over half goes to the international market as virtual water and embedded energy. This implies that export groups make extensive use of the country’s water and energy resources. This occurs mainly with bananas, but also with cocoa and shrimp. It is imperative that Ecuador diversifies its development model centered on the intensive exploitation of natural resources, since this implies a crisis in the physical–natural system and an increase in social inequity.
The low productivity of water and the high energy consumption of certain foods in Ecuador poses the need to formulate policies through which a more efficient use of resources can be achieved, which is a founding principle in the initial conception of the WEF nexus [1]. The principle of efficiency is mentioned countless times in the Magna Carta, however, it has not aroused political interest, in part due to an alleged abundance of natural resources.
Ecuador is faced with the challenge of designing and applying prices and rates in accordance with reality, simultaneously with the introduction of effective subsidy systems for those who require it. The general subsidy to the price of energy and the low rate for water use did not show adequate signs of a rational and efficient use of the resources of the WEF nexus. Even while maintaining the subsidy function, they must provide minimal incentives for its efficient use.
It is necessary to develop policies and regulatory frameworks that take into account the interrelationships between water, energy and food. A clear assessment of the current state of natural resources, such as water and soil quality, as well as the energy required in agriculture and their interrelationships, would be necessary to make informed policy decisions. It is suggested that these be the topics of future research by government, academia, or other institutions.
An effective application of the nexus approach requires, as a starting point, the strengthening of monitoring programs and the generation of standardized information. The independent and isolated management of the water, energy, and food sectors makes it difficult to obtain productivity rates.
The declarative principles of the Constitution of Ecuador regarding food sovereignty, water, and energy do not have effective operational aspects. Weak governance is identified as the cause of water pollution and the irrational use of energy. According to Jouralev and Saravia [10], in the context of weak governance, private sector interests can constitute a major obstacle to the implementation of the nexus approach, which can even pursue opposing objectives.
Author Contributions
Conceptualization, C.F.T.P. and O.V.S.; writing—original draft preparation, C.F.T.P.; supervision, O.V.S.; project administration, O.V.S. All authors have read and agreed to the published version of the manuscript.
Funding
This research was funded by Escuela Politécnica Nacional, grant number PIGR-19-15.
Data Availability Statement
Not applicable.
Acknowledgments
Carlos Francisco Terneus Paez acknowledges support from Universidad de las Fuerzas Armadas ESPE. To the Ministerio de Ambiente, Agua y Transición Ecológica and the Agency for the Regulation and Control of Energy and Non-Renewable Natural Resources for the information provided. Oswaldo Viteri Salazar and Carlos Francisco Terneus Paez acknowledge financial support provided by the Escuela Politécnica Nacional for the development of the project PIGR-19-15.
Conflicts of Interest
The authors declare no conflict of interest. The funders had no role in the design of the study; in the collection, analyses, or interpretation of data; in the writing of the manuscript; or in the decision to publish the results.
References
- Hoff, H. Understanding the Nexus. Background Paper for the Bonn 2011 Conference: The Water, Energy and Food Security Nexus. 2011. Available online: https://mediamanager.sei.org/documents/Publications/SEI-Paper-Hoff-UnderstandingTheNexus-2011.pdf (accessed on 18 September 2021).
- Willaarts, B.A.; Blanco, E.; Llavona, A.; Martínez, D. Análisis Comparativo de Acciones Con Enfoque del Nexo Agua-Energía-Alimentación: Lecciones Aprendidas Para los Países de América Latina y el Caribe; CEPAL: Vitacura, Chile, 2021. [Google Scholar]
- Zisopoulou, K.; Karalis, S.; Koulouri, M.-E.; Pouliasis, G.; Korres, E.; Karousis, A.; Triantafilopoulou, E.; Panagoulia, D. Recasting of the WEF Nexus as an actor with a new economic platform and management model. Energy Policy 2018, 119, 123–139. [Google Scholar] [CrossRef]
- Weitz, N.; Nilsson, M.; Davis, M. A Nexus Approach to the Post-2015 Agenda. SAIS Rev. Int. Aff. 2014, 34, 37–50. [Google Scholar] [CrossRef]
- FAO. Energy-Smart Food for People and Climate; FAO: Rome, Italy, 2011. [Google Scholar]
- WWAP. The United Nations World Water Development Report 2014; UNESCO: Paris, France, 2014. [Google Scholar]
- Embid, A.; Liber, M. Lineamientos de Políticas Públicas: Un Mejor Manejo de las Interrelaciones del Nexo Entre el Agua, la Energía y la Alimentación; CEPAL: Vitacura, Chile, 2018. [Google Scholar]
- CEPAL. Agencias ONU y Expertos Llaman a América Latina y el Caribe a Aunar Visiones Hacia la Cumbre Sobre Los Sistemas Alimentarios. 2021. Available online: https://www.cepal.org/es/noticias/agencias-onu-expertos-llaman-america-latina-caribe-aunar-visiones-la-cumbre-sistemas (accessed on 16 April 2022).
- Naranjo, L.; Bárbara, A.; Willaarts. Guía Metodológica: Diseño de Acciones Con Enfoque del Nexo Entre Agua, Energía y Alimentación Para Países de América Latina y el Caribe; CEPAL: Vitacura, Chile, 2020. [Google Scholar]
- Jouravlev, A.S.; Saravia Matus, S.; Gil Sevilla, M. Reflexiones Sobre la Gestión del Agua en América Latina y el Caribe Textos Seleccionados 2002–2020; CEPAL: Vitacura, Chile, 2021. [Google Scholar]
- Index Mundi. Densidad de Población—Comparación de Países. 2021. Available online: https://www.indexmundi.com/g/r.aspx?v=21000&l=es (accessed on 29 January 2022).
- FAO. Panorama de la Seguridad Alimentaria y Nutricional en América Latina y El Caribe 2020: Seguridad... Alimentaria y Nutricional Para los Territorios Mas; FAO: Rome, Italy, 2021. [Google Scholar]
- Calderón, A.; Giovanni, M.-S. Los Desafíos del Ecuador Para el Cambio Estructural Con Inclusión Social; CEPAL: Santiago, Chile, 2016. [Google Scholar]
- BCE. Evolución de La Balanza Comercial Enero—Diciembre 2019; Banco Central del Ecuador: Quito, Ecuador, 2020. [Google Scholar]
- Asamblea Nacional del Ecuador, Ley Orgánica del Régimen de la Soberanía Alimentaria. 2010. Available online: https://www.gob.ec/sites/default/files/regulations/2018-10/Documento_Ley-de-soberan%C3%ADa-alimentaria.pdf (accessed on 1 January 2022).
- FAO. Informe Nacional Sobre El Estado de La Biodiversidad Para La Alimentación y La Agricultura En El Ecuador; FAO: Rome, Italy, 2016. [Google Scholar]
- Ministerio de Comercio Exterior. Informe Sobre el Sector Atunero Ecuatoriano; Ministerio de Comercio Exterior: Quito, Ecuador, 2017. Available online: https://www.produccion.gob.ec/wp-content/uploads/2019/06/Reporte-del-sector-atunero.pdf (accessed on 29 January 2022).
- Olmos, X. Sostenibilidad Ambiental de Las Exportaciones Agroalimentarias; CEPAL: Santiago, Chile, 2017. [Google Scholar]
- Lima, J.D.; Sebastián, C. Estimación del Empleo Directo e Indirecto Asociado a las Exportaciones del Ecuador a la Unión Europea; CEPAL: Vitacura, Chile, 2016. [Google Scholar]
- Egas, J.; Olga, S.; Marisol, I.; De Salvo, C.P. Análisis de Políticas Agropecuarias En Ecuador|Publications; IBD: San Francisco, CA, USA, 2018. [Google Scholar]
- INEC. Encuesta de Superficie y Producción Agropecuaria Continua, 2020; INEC: Quito, Ecuador, 2021. [Google Scholar]
- FAO. Organización de Las Naciones Unidas Para La Alimentación y La Agricultura: Ecuador En Una Mirada|FAO En Ecuador|Organización de Las Naciones Unidas Para La Alimentación y La Agricultura’. 2019. Available online: https://www.fao.org/ecuador/fao-en-ecuador/ecuador-en-una-mirada/es/ (accessed on 5 February 2022).
- Gorospe, I. Fertilizantes En Ecuador; Oficina Económica y Comercial de España en Quito: 2018. Available online: https://www.icex.es/icex/GetDocumento?dDocName=DAX2018791785&site=icexES (accessed on 19 March 2003).
- INEC. Módulo de Información Agroambiental y Tecnificación 2020; INEC: Quito, Ecuador, 2020. [Google Scholar]
- FAO. Pesticides Use. Global, Regional and Country Trends 1990–2018; Faostat Analytical Brief; FAO: Rome, Italy, 2021. [Google Scholar]
- ONU. Efectos de Plaguicidas y Fertilizantes Sobre El Medio Ambiente y La Salud y Formas de Reducirlos; ONU: Princeton, NJ, USA, 2022. [Google Scholar]
- Asamblea Nacional del Ecuador, Ley Orgánica de Recursos Hídricos, Usos y Aprovechamiento del Agua. 2014. Available online: https://www.gob.ec/regulaciones/ley-organica-recursos-hidricos-usos-aprovechamiento-agua (accessed on 1 January 2022).
- Embid, A.; Liber, M. La Experiencia Legislativa del Decenio 2005–2015 en Materia de Aguas en América Latina; CEPAL: Vitacura, Chile, 2015; p. 57. [Google Scholar]
- Correa, R. Reglamento de Recursos Hídricos, Usos y Aprovechamiento Del Agua. Rev. Ecohabitar 2015, 740, 1–45. [Google Scholar]
- SENAGUA. Boletín de La Estadística Sectorial Del Agua; SENAGUA: Quito, Ecuador, 2017. [Google Scholar]
- SENAGUA. Plan Nacional de Riego y Drenaje 2019–2027; SENAGUA: Quito, Ecuador, 2019. [Google Scholar]
- SENAGUA. Estrategia Nacional de Calidad del Agua; SENAGUA: Quito, Ecuador, 2016. [Google Scholar]
- SENAGUA. Línea Base Para El Monitoreo de La Calidad Del Agua de Riego En La Demarcación Hidrográfica Del Guayas; SENAGUA: Quito, Ecuador, 2010. [Google Scholar]
- Deknock, A.; De Troyer, N.; Houbraken, M.; Dominguez-Granda, L.; Nolivos, I.; Van Echelpoel, W.; Forio, M.A.E.; Spanoghe, P.; Goethals, P. Distribution of agricultural pesticides in the freshwater environment of the Guayas river basin (Ecuador). Sci. Total Environ. 2018, 646, 996–1008. [Google Scholar] [CrossRef]
- Villegas, L.; Cabrera, M.; Capparelli, M.V. Assessment of Microplastic and Organophosphate Pesticides Contamination in Fiddler Crabs from a Ramsar Site in the Estuary of Guayas River, Ecuador. Bull. Environ. Contam. Toxicol. 2021, 107, 20–28. [Google Scholar] [CrossRef]
- Izurieta, R.; Arturo, C.; Juan, C.; Edmundo, E.; Ochoa. Calidad Del Agua En Ecuador. Pp. 190–217; IANAS: Baton Rouge, LA, USA, 2019. [Google Scholar]
- del Guayas, G.P. Plan de Ordenamiento Territorial de La Provincia Del Guayas 2012–2021. 2012. Available online: https://guayas.gob.ec/wp-content/uploads/dmdocuments/ley-detransparencia/literal-g/POT-1.pdf (accessed on 8 April 2022).
- Caicedo, C.; Oscar, C.; Balmaseda, E.; Jaime, P.S. Programación del riego del banano (Musa paradisiaca) en finca San José. Rev. Cienc. Técnicas Agropecu. 2015, 24, 18–22. [Google Scholar]
- MAGAP. Plan Nacional de Riego y Drenaje 2019–2027; MAGAP: Quito, Ecuador, 2019. [Google Scholar]
- Valarezo, O.; Javier, M. Insecticidas de Uso Agrícola En El Ecuador; MAGAP: Quito, Ecuador, 2011. [Google Scholar]
- Arroyo, V.; Ballestero, M.; Mejía, A. Inseguridad Económica Del Agua En Latinoamérica: De La Abundancia a La Inseguridad; CAF: Caracas, Venezuela, 2015. [Google Scholar]
- ARCA. Fórmula de Cálculo Para La Obtención de La Tarifa Referencial de Agua Cruda; ARCA: Quito, Ecuador, 2016; Volume 54. [Google Scholar]
- Acosta, A.; Martínez, E. Agua un Derecho Humano Fundamental; Nadesha Montalvo Rueda; Abya Yala: Quito, Ecuador, 2010. [Google Scholar]
- Gaybor, A. Acumulación Capitalista y Despojo Del Agua; Consorcio Camaren: Quito, Ecuador, 2010. [Google Scholar]
- Hitz, J. The Water Conflict in Ecuador. State of the Planet. 2010. Available online: https://news.climate.columbia.edu/2010/05/14/the-water-conflict-in-ecuador/ (accessed on 8 March 2022).
- Isch, E.; Alex, Z. Tierra y Agua: Interrelaciones de Un Acceso Inequitativo. Sistema de Investigación Sobre La Problemática Agraria En El Ecuador: Quito, Ecuador; SIPAE: Quito, Ecuador, 2010. [Google Scholar]
- Román, S.P. Lucha Por Agua En La Costa Ecuatoriana. Dinámicas de Los Conflictos de Agua de Riego Entre Pequeños y Grandes Productores Agrícolas: Un Caso En El Río Boliche; Wageningen University: Wageningen, The Netherlands, 2010. [Google Scholar]
- SENAGUA. Estudio Exploratorio: “Problemática y Conflictos Sobre Los Recursos Hídricos Por Efectos Del Cambio Climático”; SENAGUA: Quito, Ecuador, 2009. [Google Scholar]
- INEC. Información Ambiental En Hogares; INEC: Quito, Ecuador, 2012. [Google Scholar]
- Ekos. Se Promueve El Consumo Inteligente de Agua En Ecuador. Ekos Negocios. 2019. Available online: https://www.ekosnegocios.com/articulo/se-promueve-el-consumo-inteligente-de-agua-en-ecuador (accessed on 8 March 2022).
- Ministerio de Energía y Recursos Naturales No Renovables. Balance Energético Nacional 2019; Ministerio de Energía y Recursos Naturales No Renovables: Quito, Ecuador, 2020.
- Castro, P.; Castro, M.; Cunha, M. Análisis Comparativo de Indicadores Energéticos de Países Miembros de La Comunidad Andina de Naciones. Rev. Técnica Energía 2018, 14, 236–245. [Google Scholar] [CrossRef]
- Lapillone, B. Monitoreando la Eficiencia Energética en América Latina; CEPAL: Vitacura, Chile, 2016. [Google Scholar]
- OLADE. Panorama Energético Para América Latina y El Caribe; OLADE: Quito, Ecuador, 2019. [Google Scholar]
- MAGAP. RESULTADOS DE LA HOJA DE BALANCE DE ALIMENTOS Ecuador—Año 2019; MAGAP: Quito, Ecuador, 2020. [Google Scholar]
- Ministerio Coordinador de Sectores Estratégicos. Balance Energético Nacional 2013; Ministerio Coordinador de Sectores Estratégicos: Quito, Ecuador, 2013.
- Jimenez, R.; Ariel, Y. Cómo Consumen Energía Los Hogares? Evidencia En América Latina y El Caribe; Inter-American Development Bank: Washington, DC, USA; New York, NY, USA, 2020. [Google Scholar] [CrossRef]
- Nolivos, I.; Emilio, M.; Lorena, B.; Alfredo, V. Importancia Del Subsidio Eléctrico Para Las Cocinas De Inducción Y Su Efecto En La Salud, La Eficiencia Energética Y El Ahorro De Recursos, Para Los Ecuatorianos. 2021. Available online: https://www.usfq.edu.ec/sites/default/files/2021-04/white_paper_PEC-GLP_versus_Induccion.pdf (accessed on 26 February 2022).
- Recalde, P. Programa de Eficiencia Energética Para Cocción Por Inducción y Calentamiento de Agua Con Electricidad En Sustitución Del GPL En El Sector Residencial—Ecuador—OPS/OMS|Organización Panamericana de La Salud. 2015. Available online: https://www.paho.org/es/file/42775/download?token=Lu09uhuH (accessed on 1 March 2022).
- CEPAL. Base de Información de Eficiencia Energética. 2021. Available online: https://biee-cepal.enerdata.net/en/datamapper/electricity-consumption-per-electrified-household.html (accessed on 29 March 2022).
- Salmoral, G.; Yan, X. Food-energy-water nexus: A life cycle analysis on virtual water and embodied energy in food consumption in the Tamar catchment, UK. Resour. Conserv. Recycl. 2018, 133, 320–330. [Google Scholar] [CrossRef]
- Clercx, L.; Torres, E.Z.; Kuiper, J. Water footprint assessment of bananas produced by small banana farmers in Peru and Ecuador. Acta Hortic. 2016, 1112, 21–28. [Google Scholar] [CrossRef]
- Mekonnen, M.M.; Hoekstra, A. A Global Assessment of the Water Footprint of Farm Animal Products. Ecosystems 2012, 15, 401–415. [Google Scholar] [CrossRef]
- ANA. Huella Hídrica Del Perú; Sector Agropecuario: Lima, Perú, 2015. [Google Scholar]
- Wojcikiewicz, C.A.; Nascimento, F.V.D.; Garbossa, L.H.P.; Lapa, K.R.; Arana, L.A.V. Pegada hídrica cinza de sistema de cultivo intensivo de camarão-branco em água salobra. Bol. Do Inst. Pesca 2017, 43, 426–436. [Google Scholar] [CrossRef]
- Pérez, A.; Solange, I. Evaluación y Análisis de la Huella Hídrica y Agua Virtual de la Producción Agrícola en el Ecuador; Zamorano: Pregrado, Spain, 2012. [Google Scholar]
- UPME. Caracterización Del Consumo Final de Energía En El Sector Agroindustrial. 1517-14-2007; UPME: Bogotá, Colombia, 2007. [Google Scholar]
- IIGE. Balance-Energético-Nacional-2018.Pdf; IIGE: Quito, Ecuador, 2019. [Google Scholar]
- Ulloa, F. Estimación de la Demanda de Transporte Mediante el Método Insumo Producto: Casos de Brasil, Chile, Ecuador y Nicaragua; CEPAL: Chile, Ecuador, 2017. [Google Scholar]
- Ekos. Industria de Alimentos y Bebidas: La Mayor Industria Del País’. Ekos Negocios. 2018. Available online: https://www.ekosnegocios.com/articulo/industria-de-alimentos-y-bebidas-la-mayor-industria-del-pais (accessed on 22 January 2022).
- Van Hauwermeiren, A.; Coene, H.; Engelen, G.; Mathijs, E. Energy Lifecycle Inputs in Food Systems: A Comparison of Local versus Mainstream Cases. J. Environ. Policy Plan. 2007, 9, 31–51. [Google Scholar] [CrossRef]
- Terneus Páez, C.F.; Guayanlema, V.; Cabrera Mera, A.G. Estimation of Energy Consumption Due to the Elimination of an Environmental Tax in Ecuador. Energy Sustain. Dev. 2022, 66, 92–100. [Google Scholar] [CrossRef]
- MERNNR. Ficha Informativa Del Proyecto. Renovación de Equipos de Consumo Energético Ineficiente: Sustitución de Refrigeradoras; Ministerio de Energía y Recursos naturales No Renovables: Quito, Ecuador, 2020.
- CONELEC. Estudio y Gestión de La Demanda Eléctrica; CONELEC: Quito, Ecuador, 2013. [Google Scholar]
- Espín, N. Focalización Del Subsidio al Gas, Impacto Sobre La Demanda Eléctrica y Expansión Del Sistema Nacional Interconectado; Escuela Politécnica Nacional: Quito, Ecuador, 2009. [Google Scholar]
- IRENA. Renewable Energy in the Water, Energy & Food Nexus; IRENA: Paris, France, 2015. [Google Scholar]
- Roibás, L.; Elbehri, A.; Hospido, A. Evaluating the sustainability of Ecuadorian bananas: Carbon footprint, water usage and wealth distribution along the supply chain. Sustain. Prod. Consum. 2015, 2, 3–16. [Google Scholar] [CrossRef]
- Mekonnen, M.M.; Hoekstra, A.Y. The green, blue and grey water footprint of crops and derived crop products. Hydrol. Earth Syst. Sci. 2011, 15, 1577–1600. [Google Scholar] [CrossRef]
- Canning, P.N. Energy Use in the U.S. Food System; DIANE Publishing: Darby, PA, USA, 2010. [Google Scholar]
- FAO. Fuel and Energy Use in the Fisheries Sector—Approaches, Inventories and Strategic Implications; FAO: Rome, Italy, 2015. [Google Scholar]
- Boyd, C.E.; Davis, R.P.; Wilson, A.G.; Marcillo, F.; Brian, S.; McNevin, A.A. Resource use in whiteleg shrimp Litopenaeus vannamei farming in Ecuador. J. World Aquac. Soc. 2021, 52, 772–788. [Google Scholar] [CrossRef]
- Troell, M.; Tyedmers, P.; Kautsky, N.; Rönnbäck, P. Aquaculture and Energy Use. Encycl. Energy 2004, 1, 97–108. [Google Scholar]
- Pimentel, D.; Marcia, H.; Pimentel (Eds.) Food, Energy, and Society, 3rd ed.; CRC Press: Boca Raton, FL, USA, 2007. [Google Scholar]
- Ministerio de Energía. Gobierno Del Encuentro Socializa Beneficios Del Programa de Electrificación Del Sector Camaronero—Ministerio de Energía y Minas. 2021. Available online: https://www.recursosyenergia.gob.ec/gobierno-del-encuentro-socializa-beneficios-del-programa-de-electrificacion-del-sector-camaronero/ (accessed on 24 July 2022).
- Avadí, A.; Bolaños, C.; Sandoval, I.; Ycaza, C. Life cycle assessment of Ecuadorian processed tuna. Int. J. Life Cycle Assess. 2015, 20, 1415–1428. [Google Scholar] [CrossRef]
- Parker, R.W.; Vázquez-Rowe, I.; Tyedmers, P.H. Fuel performance and carbon footprint of the global purse seine tuna fleet. J. Clean. Prod. 2015, 103, 517–524. [Google Scholar] [CrossRef]
- Asamblea Nacional del Ecuador, Ley Orgánica para el Desarrollo de la Acuicultura y Pesca, vol. 187–2020. 2020. Available online: https://www.gob.ec/regulaciones/ley-organica-desarrollo-acuicultura-pesca (accessed on 1 January 2022).
- Urresta, E. Eficiencia Energética En La Pesca Artesanal. 2021. Available online: http://www.eloriente.com/articulo/eficiencia-energetica-en-la-pesca-artesanal/16588 (accessed on 17 March 2022).
- INEC. Encuesta Nacional de Ingresos y Gastos de Los Hogares Urbanos y Rurales 2011–2012. Principales Resultados; INEC: Quito, Ecuador, 2012. [Google Scholar]
- García, N.G.; Arguello, S.A. Mercado del gas en América Latin. 2021. Available online: https://obtienearchivo.bcn.cl/obtienearchivo?id=repositorio/10221/32763/1/BCN___Mercado_del_gas_en_América_Latina.pdf (accessed on 12 March 2022).
- ARCONEL. Proyecto de Regulación: Generación Eléctrica a Partir de Residuos o Desechos Sólidos no Peligrosos Municipales; ARCONEL: Quito, Ecuador, 2019; Available online: https://www.regulacionelectrica.gob.ec/wp-content/uploads/downloads/2020/03/00419_Inf-Sust_RSNPM-V3-Vfinal-suscrito.pdf (accessed on 23 March 2022).
- Sociedad Agrícola e Industrial San Carlos. Cogeneración de Energía Eléctrica—Ingenio San Carlos. 2020. Available online: https://www.sancarlos.com.ec/modelo-de-produccion-sostenible/cogeneracion-de-energia-electrica/ (accessed on 23 March 2022).
- Calderón, L.; Marco, F.A.; Lorena, L.; Mauricio, M. Valoración Económica de Los Cobeneficios del Aprovechamiento Energético de los Residuos Agrícolas en el Ecuador; CEPAL: Santiago, Chile, 2017. [Google Scholar]
- Franco-Crespo, C.; Viñas, J.M.S. The Impact of Pricing Policies on Irrigation Water for Agro-Food Farms in Ecuador. Sustainability 2017, 9, 1515. [Google Scholar] [CrossRef] [Green Version]
- CEPAL; GIZ. Diagnóstico de Las Estadisticas Del Agua En Ecuador. Inf. Final 2012. Available online: https://bit.ly/3bmcGKg (accessed on 15 October 2019).
- FAO. Walking the Nexus Talk: Assessing the Water-Energy-Food Nexus in the Context of the Sustainable Energy for All Initiative; FAO: Rome, Italy, 2014. [Google Scholar]
- Ministerio del Ambiente. Texto Unificado de Legislación Secundaria del Ministerio del Ambiente. 2017. Available online: https://docplayer.es/44724147-Texto-unificado-de-legislacion-secundaria-de-medio-ambiente.html (accessed on 23 February 2022).
- Jory, D. Crecimiento lejos de la costa: Examinando el cultivo de camarón tierra adentro. 2017. Available online: https://www.globalseafood.org/advocate/crecimiento-lejos-de-la-costa-examinando-el-cultivo-de-camaron-tierra-adentro/ (accessed on 1 January 2022).
- Vallejo Carpio, C. Análisis de Intensidad Energética Para Los Sectores de Uso Final de La Economía Ecuatoriana. Cuest. Económicas 2019, 27, 17. [Google Scholar]
- Espinoza, S.; Verónica, G. Balance y Proyecciones Del Sistema de Subsidios Energéticos En Ecuador; Friedrich-Ebert-Stiftung Ecuador-Instituto Latinoamericano de Investigaciones Sociales; Friedrich-Ebert-Stiftung (FES): Quito, Ecuador, 2017. [Google Scholar]
- Puig Ventosa, I.; Martínez Sojo, A.; Córdova Vela, G.; Álvarez Rivera, P. Subsidios a los combustibles fósiles en ecuador: Diagnosos y opciones para su progresiva reducción. Rev. Iberoam. Econ. Ecológica 2018, 28, 87–106. [Google Scholar]
- INER. Estudio de Optimización Energética de Cadenas de Transporte Logísticas de Transporte de Carga Pesada en el Ecuador; INER: Quito, Ecuador, 2017. [Google Scholar]
- Izurieta, F.; Alvaro, C.; Verónica, G. Identificacion de las Necesidades de Eficiencia Energetica en el Transporte; INER: Quito, Ecuador, 2013. [Google Scholar]
- Tipanluisa, G. El Peso Político de Los Transportistas. El Comercio, November 21. 2018. Available online: https://bit.ly/2LmsUZt (accessed on 23 May 2022).
- Cornejo, O.A. Características Socioambientales de Comunidades de Pescadores Artesanales En La Costa Ecuatoriana, Luego Del Terremoto Del 16 de Abril de 2016; Maestría: FlacsoAndes, Quito, 2020. [Google Scholar]
- Ecuavisa. Combustible Termina en la Frontera Para Narcotráfico. 2018. Available online: https://www.ecuavisa.com/noticias/ecuador/combustible-termina-frontera-narcotrafico-EDEC416376 (accessed on 15 March 2022).
- El Telégrafo. Gasolina de Mejor Calidad Se Comercializa En El País. El Telégrafo. 2012. Available online: https://www.eltelegrafo.com.ec/noticias/economia/4/combustible-menos-contaminante-se-comercializa-en-el-pais (accessed on 24 July 2022).
- Oñate, S. Así es el Contrabando del Combustible en 6 Provincias del Ecuador. El Comercio. 2019. Available online: https://elcomercio-live.mediatiquepress.com/actualidad/seguridad/contrabando-combustible-ecuador-frontera-negocio.html (accessed on 15 March 2022).
- Parametría. El Pescador Artesanal Ecuatoriano Víctima del Narcotráfico. Parametria. 2019. Available online: https://parametria.org/el-pescador-artesanal-ecuatoriano-victima-del-narcotrafico/ (accessed on 26 March 2022).
- Zabala. Pescadores Frente a Las Denuncias Sobre Contrabando de Combustible. Lo Dijeron. 2013. Available online: https://lodijeron.wordpress.com/2013/09/25/pescadores-frente-a-las-denuncias-sobre-contrabando-de-combustible/ (accessed on 15 March 2022).
- OCARU. Inició “Plan Renova Motor Fuera de Borda”, en beneficio de pescadores artesanale. Observatorio del campo rural. 2013. Available online: https://ocaru.org.ec/2013/07/04/inicio-plan-renova-motor-fuera-de-borda-en-beneficio-de-pescadores-artesanale/ (accessed on 2 April 2022).
- Embid, A.; Liber, M. El Nexo Entre el Agua, la Energía y la Alimentación en América Latina y el Caribe: Planificación, Marco Normativo e Identificación de Interconexiones Prioritarias; CEPAL: Santiago, Chile, 2017. [Google Scholar]
- Stiglitz, J.E.; Dosi, G.; Mazzucato, M.; Pianta, M.; Lütkenhorst, W.; Alvarado, J.; Calderón, Á.; Correa, F.; Gligo, N.; Martínez, J.M.; et al. Políticas Industriales y Tecnológicas en América Latina; CEPAL: Santiago, Chile, 2017; p. 578. [Google Scholar]
Figure 1.
Farming work surface per crop. OPC = other permanent crops; OTC = other temporary crops.

Figure 2.
Energy consumption percentage in food by sectors in Ecuador.

Figure 3.
Water footprint and energy consumption of food products with the highest production in Ecuador.
Figure 3.
Water footprint and energy consumption of food products with the highest production in Ecuador.

Table 1.
Food production in Ecuador.
| Product | Production (t) | Product | Production (t) |
|---|---|---|---|
| Banana | 6,635,217 | Milk | 2,392,892 |
| Rice | 902,318 | Shrimp | 754,414 |
| Plantain | 724,414 | Sugar | 591,171 |
| Poultry | 505,100 | Palm oil | 443,155 |
| Potato | 424,736 | Cocoa | 359,075 |
| Eggs | 265,498 | Tuna | 277,786 |
| Fish | 177,737 | Beef | 164,192 |
Table 2.
Products that use the most fertilizers in Ecuador.
| Product | Fertilizer per Hectare a (kg/ha) | Amount of Fertilizer Applied (t) |
|---|---|---|
| Banana | 682 | 112,611 |
| Cocoa | 141 | 70,110 |
| Hard corn | 227 | 62,225 |
| African palm | 252 | 62,172 |
| Rice | 213 | 61,537 |
| Sugar cane | 337 | 42,560 |
| Green plantain | 113 | 16,450 |
| Potato | 458 | 10,130 |
a (INEC 2020a) [24].
Table 4.
Dispatch of fuel for the fishing and aquaculture sector in 2019.
| Sector | Diesel (KBOE) | Gasoline (KBOE) |
|---|---|---|
| Shrimp | 2062 | 28 |
| Tuna | 1083 | 1 |
| Other fisheries | 454 | 0 |
| Artisanal fisheries | 0 | 1005 a |
a Gasoline for two-stroke engine. This information was provided for this investigation by the Agency for the Regulation and Control of Energy and Non-Renewable Natural Resources (ARCERNNR, By its initials in Spanish.) through Official Letter No. ARCERNNR-DCOMH-2022-0539-OF.
Table 5.
Load estimation by sectors.
| Agricultural–fishing | Extractive | Manufacturing | Trade | Total Load | ||
|---|---|---|---|---|---|---|
| Load estimation | Mton | 15.1 | 21.7 | 55.4 | 2.1 | 94.5 |
| Load food estimation | Mton | 15.1 | 0 | 21.1 | 2.1 | 38.4 |
Table 6.
Industrial sector consumption by type of energy in KBOE.
| Diesel | Electricity | LPG | Fuelwood | Gasoline | Bagassse | Fuel Oil | Source | |
|---|---|---|---|---|---|---|---|---|
| Industrial sector percentage food consumption 2013 | 52% | 33% | 30% | 100% | 40% | 100% | 25% | [56] |
| Industrial sector energy consumption 2019 | 217 | 6438 | 714 | 358 | 147 | 1543 | 1505 | [51] |
| Food industrial sector energy consumption 2019 | 110 | 2125 | 214 | 358 | 59 | 1543 | 376 |
Table 7.
Household sector consumption by type of energy in KBOE.
| Electricity | LPG | Fuelwood | Source | |
|---|---|---|---|---|
| Percentage use by food | 30% | 80% | 100% | |
| Household sector energy consumption 2019 | 4744 | 6608 | 1331 | (Ministerio de Energía y Recursos Naturales No Renovables 2020) |
| Household sector food energy consumption 2019 | 1423 | 5286 | 1331 |
Table 8.
Water footprint and energy consumption of the main foods in Ecuador.
| Product | Water Footprint (m3/t) | Energy Consumption (BOE/t) |
|---|---|---|
| Banana | 576 a | 0.20 g |
| Milk | 1207 b | 0.06 g |
| Rice | 1080 c | 0.23 g |
| Shrimp | 1315 d | 2.77 h |
| Plantain | 1602 e | 0.20 g |
| Sugar | 1782 e | 0.80 g |
| Poultry | 2872 b | 0.04 g |
| Palm oil | 4970 e | 0.21 g |
| Potato | 348 c | 0.23 g |
| Cocoa | 21,180 f | 0.20 g |
| Eggs | 2872 b | 0.04 g |
| Tuna | 0 | 3.90 h |
| Fish | 0 | 1.46 h |
| Beef | 10,244 b | 2.08 g |
Table 9.
Energy consumption by stages of the food chain in KBOE.
| Diesel | Electricity | LPG | Fuelwood | Gasoline | Bagassse | Fuel Oil | |
|---|---|---|---|---|---|---|---|
| Production | 3599 | 1012 | |||||
| Transport | 6839 | ||||||
| Processing | 110 | 2125 | 214 | 358 | 59 | 1543 | 376 |
| User transport | 495 | ||||||
| Food preparation | 1423 | 5286 | 1331 | ||||
| Agriculture | 196 | ||||||
| Total | 10,548 | 3548 | 5697 | 1689 | 1566 | 1543 | 376 |
| Percentage | 42% | 14% | 23% | 7% | 6% | 6% | 2% |
Table 10.
Fishing and aquaculture energy productivity and energy consumption.
| Sector | Energy Productivity (t/KBOE) | Energy Consumption (BOE/t) |
|---|---|---|
| Shrimp | 361 | 2.8 |
| Tuna | 256 | 3.9 |
Publisher’s Note: MDPI stays neutral with regard to jurisdictional claims in published maps and institutional affiliations. |
© 2022 by the authors. Licensee MDPI, Basel, Switzerland. This article is an open access article distributed under the terms and conditions of the Creative Commons Attribution (CC BY) license (https://creativecommons.org/licenses/by/4.0/).
Share and Cite
MDPI and ACS Style
Páez, C.F.T.; Salazar, O.V. The Water–Energy–Food Nexus: An Analysis of Food Sustainability in Ecuador. Resources 2022, 11, 90. https://0-doi-org.brum.beds.ac.uk/10.3390/resources11100090
AMA Style
Páez CFT, Salazar OV. The Water–Energy–Food Nexus: An Analysis of Food Sustainability in Ecuador. Resources. 2022; 11(10):90. https://0-doi-org.brum.beds.ac.uk/10.3390/resources11100090
Chicago/Turabian StylePáez, Carlos Francisco Terneus, and Oswaldo Viteri Salazar. 2022. "The Water–Energy–Food Nexus: An Analysis of Food Sustainability in Ecuador" Resources 11, no. 10: 90. https://0-doi-org.brum.beds.ac.uk/10.3390/resources11100090
Note that from the first issue of 2016, this journal uses article numbers instead of page numbers. See further details here.