1. Introduction
The term sustainability is still highly controversial, and although it is believed that this concept has been defined independently, it is closely linked to ideas of an economic nature. Over the years, the attention paid to the definition of sustainable development and sustainability has materially shifted the choices of human activities towards radically different approaches. Consider the application of the Hartwick–Solow criterion [
1,
2,
3], which justified the exploitation of natural capital based on the criterion of substitutability with economic and artificial capitals. The Hartwick–Solow criterion can be described through the concept of weak sustainability. Weak sustainability has been partially overcome by strong sustainability, which presupposes the nonsubstitutability of natural capital. More simply, strong sustainability supports the need to guarantee natural resources stocks.
Over the past forty years, the paradigm shift towards strong sustainability has generated an increasingly present public opinion on comparing ecosystems and relative biodiversity preservation. Apparently, the interruption of resources exploitation promotes stock growth, but if this is true for abiotic resources, it is more complex for biotic resources. The SMS theory (Safe Minimum Standard) states that below a specific threshold, the restoration of natural capital through artificial capital is unsustainable, and the natural capital is hopelessly compromised [
4,
5,
6]. Wood is one of the biotic resources that highlight these aspects well and has been of interest in preservation for years. Wood production chain and land use change (LUC) have been considered bad practices for conserving woods and biodiversity. From the second half of the last century, the area covered by woods in Italy and Europe has increased [
7], and the biodiversity has remained almost stable [
8]. The Millennium Ecosystem Assessment (MA) in 2005 established the main drivers for biodiversity loss and ecosystem changes: habitat change (land use changes, physical modification of rivers or water withdrawal from rivers, loss of coral reefs, and damage to sea floors due to trawling), climate change, invasive alien species, overexploitation, and pollution. However, behind the definition of the key impact factors is the calculation of the impact itself.
Land use change is considered the most significant driver of loss in nature and biodiversity [
9]. LUC directly impacts the survival and proliferation of species through the potential destruction of habitats and modification of the environment. However, evaluating the effect of LUC on biodiversity can be challenging due to the elusive nature of the biodiversity concept and the inter-relation between LUC and other global drivers such as climate change. Moreover, some ecological impacts can either be small but cumulative, spatially removed, or be difficult to detect by methods used or spatiotemporal scales [
10]. Estimating the impacts of LUC on biodiversity largely depends on location, research methods, and taxonomic focus [
11]. Thus, advocating for adopting relevant mitigation strategies requires using interdisciplinary, inclusive, comprehensive, and replicable methods for biodiversity loss assessment [
12].
The life cycle assessment (LCA) is a universally accepted tool that can meet these criteria for good biodiversity metrics. LCA is a standardized scientific methodology for assessing the environmental impact of products and services related to human activities. This tool has been applied to determine indices based on resources exploitation, substances emission on the different environments (air, water, soil), and the impact on biodiversity throughout the evaluation of species reduction (considering a damage impact category). In LCA, biodiversity is mainly introduced as an endpoint category modeled as a loss in species richness related to the conversion and use of land over time and space. Due to biodiversity assessment’s complexity, the present land use models that use biodiversity indicators tend to significantly simplify the transient dynamics and intricate interactions among and between species and their habitats [
12]. Several studies linked LCA studies with biodiversity assessments [
13,
14,
15]. Matching this last aspect with the MA declaration, it appears clear that the LCA method is still not exhaustive because it cannot determine the habitat change and the presence of invasive species. Souza et al. (2015) [
12] highlighted several limitations in existing models relating to concepts, inventory analysis, definition of indicators, and impact assessment methods. However, considering that soil and its transformations are one of the main drivers of biodiversity loss [
16], all relative indices are deemed valid in the indirect assessment of biodiversity loss. Regarding this aspect, several indices have been tested to be included as impact categories for the LCA method. Neglecting the issues of the millennium assessment, the method has been applied to the forestry and biomass sector in numerous studies [
17,
18,
19,
20,
21,
22,
23,
24,
25,
26,
27], as reported in
Table 1. However, few of the case studies analyzed dealt with broadleaf species (rarely used for heat production and sometimes reporting unusual functional units) with different physiological characteristics, growth (related to forest management), and interaction with the environmental compartments (air, water, soil) that host biodiversity.
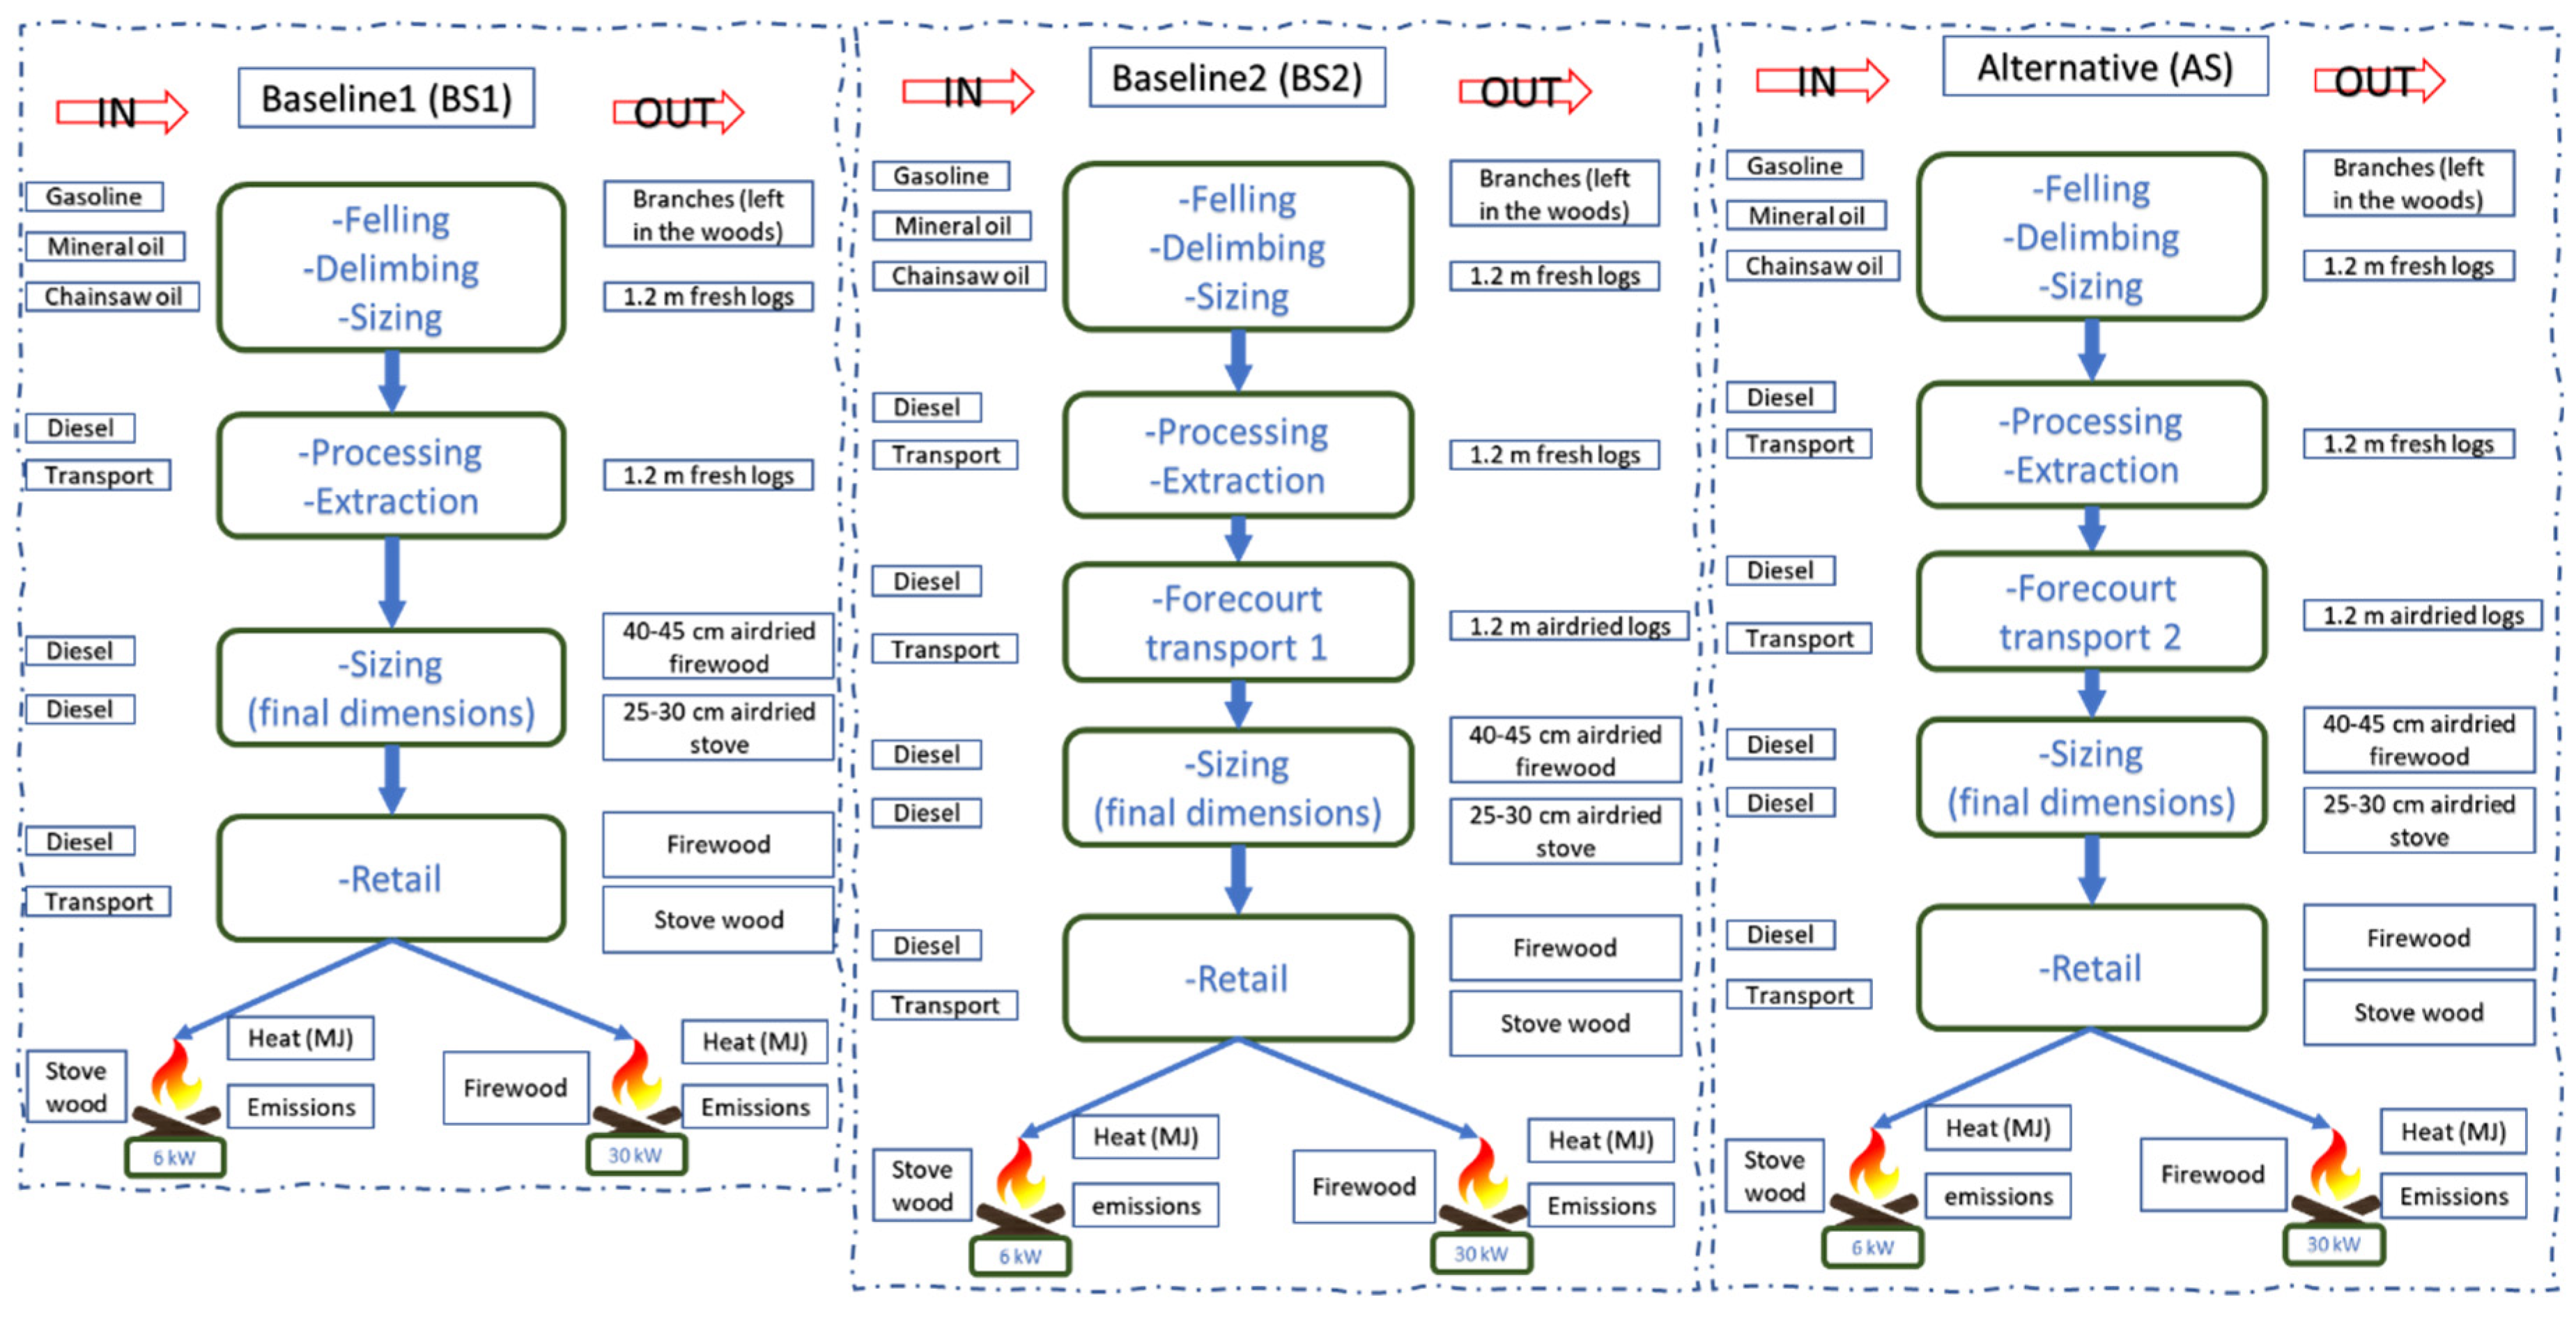
This paper aims to assess the impact of hophornbeam wood production for energy purposes using the LCA and includes specific indices to cover MA suggestions for biodiversity assessment. The hypothesis underlying the study is to test the ability of the classical indices of the LCA (suitably related to the MA drivers as described in the following chapters) in estimating the effects on the drivers identified by the Millennium Ecosystem Assessment. In particular, it is intended to identify any differences relating to the various scenarios tested. Considering the scarcity of specific studies on the forest sector, for temperate broad-leaved forests, the novelty of the study lies in providing primary information about material and energy flows of forest management operations and in analyzing the environmental impact of a widespread supply chain in central Italy and the Balkans.
3. Results
3.1. LCA
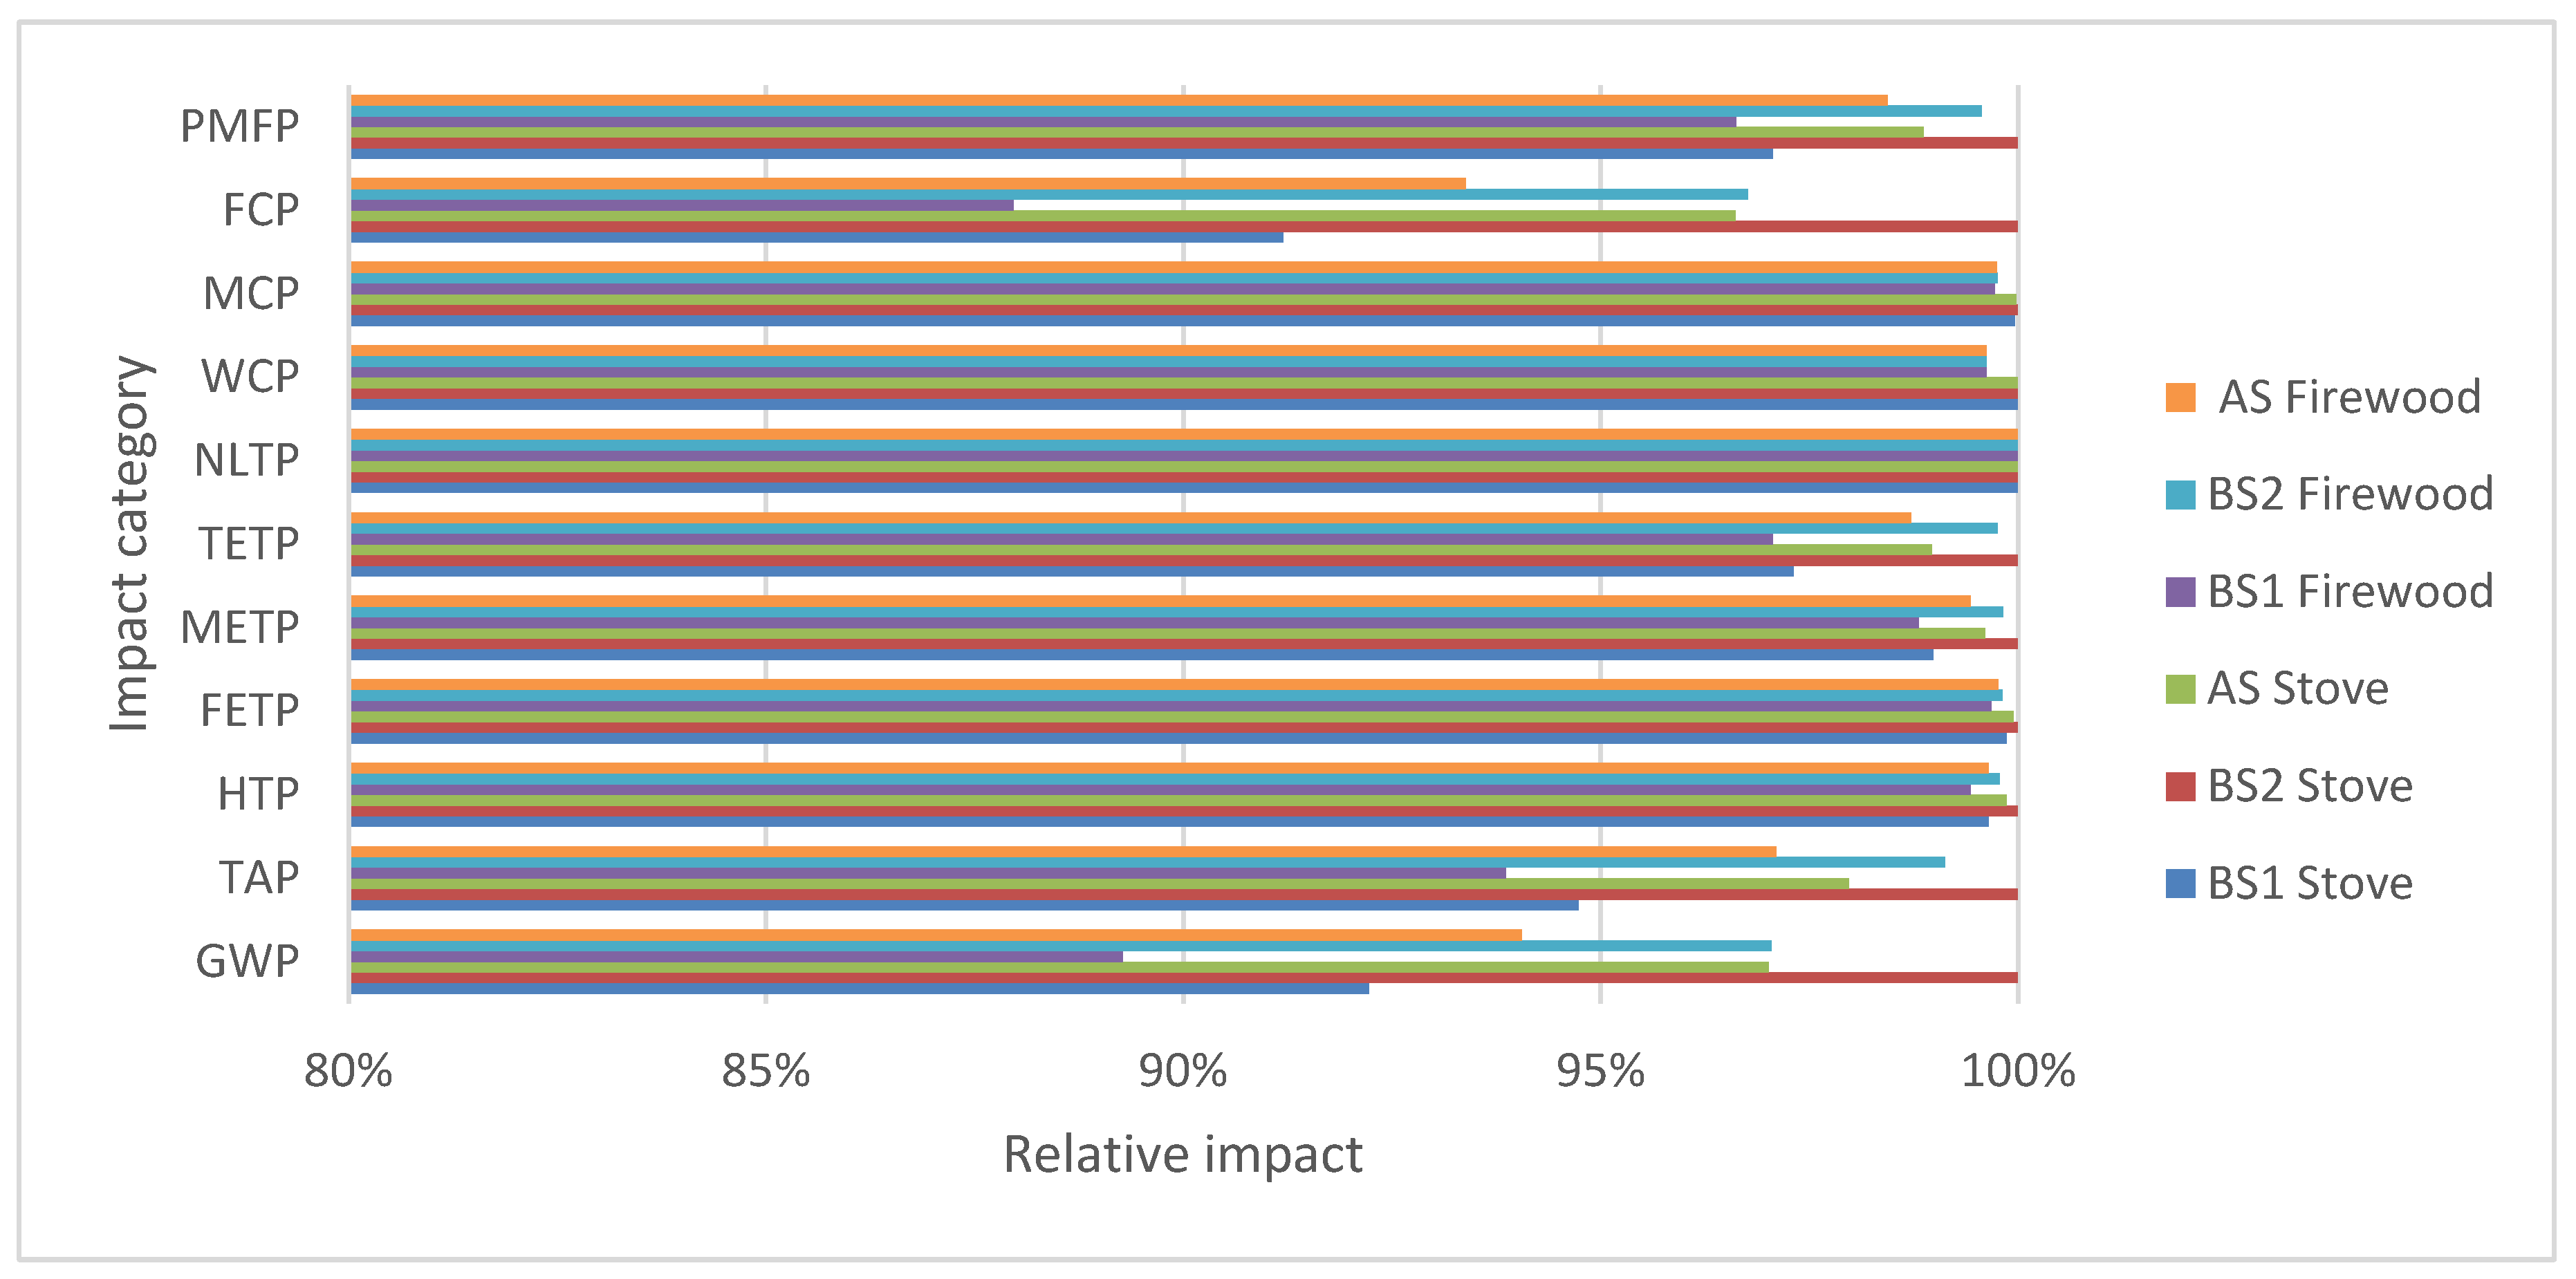
As reported in
Table 6a,b, and
Figure 2, BS2 stove shows the higher impact for all the impact categories selected except for NLTP, which remains constant (considering three decimal places).
The contribution analysis conducted is reported in
Table 7 and
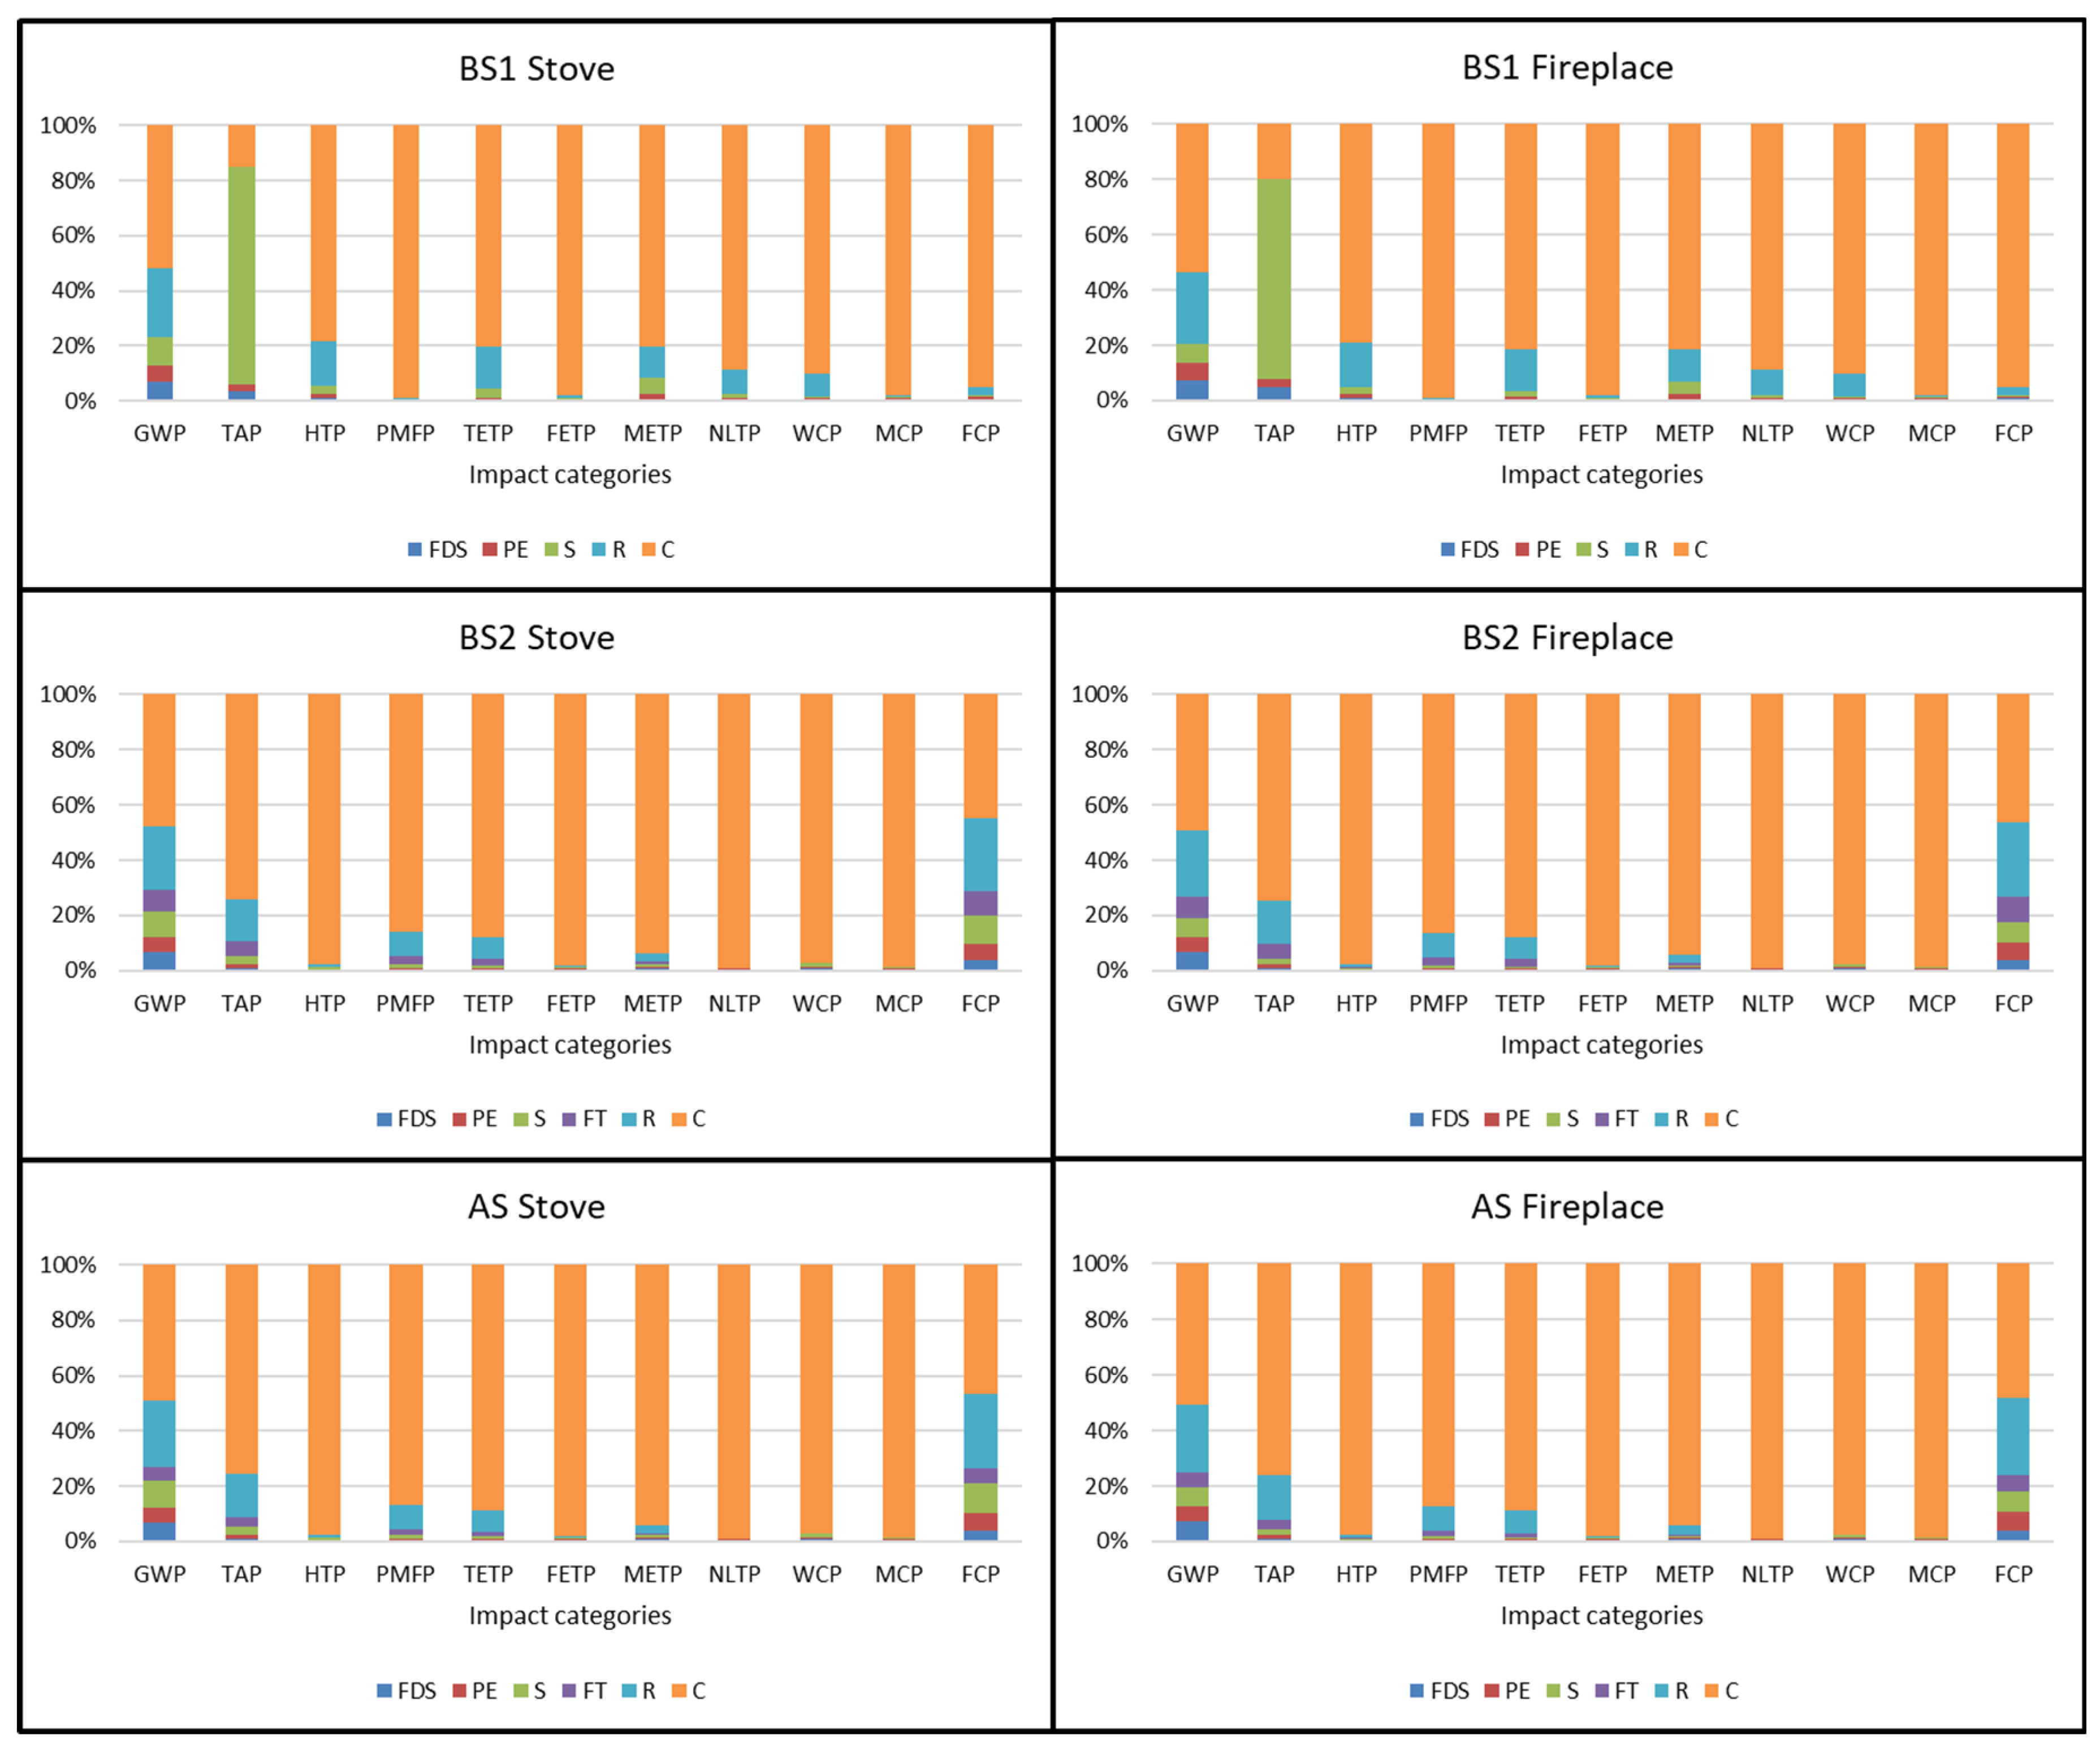
Table 8, and to ease its readability, it is presented in graphic form in
Figure 3. As is evident from the results, the distribution phase shows a high impact for many of the selected categories, except for NLTP, WCP, and MCP. The major contributor is processing and extraction for NLTP, sizing for WCP and MCP.
From the data obtained, combustion is the major contributor to impact for all the categories and all the scenarios selected. The share of combustion ranges from 14.9% to 99.1% for BS1 stove and from 19.7% to 99.1% for BS1 fireplace. Similar behavior is reported for BS2 stove and fireplace, where the share is lower due to the additional transport phase, ranging from 45.0% to 99.2% and 46.5% to 99.2%, respectively. For AS scenarios, a similar percentage to BS2 is detected, just slightly higher due to the more efficient forecourt transport that lowers the share of transportation for combustion (the lower impact of AS scenario lies in the greater quantity transported over the same distance as that in the BS2 scenario). A significant impact is also detected for the retail phase with a relevant contribution on GWP, HTP, TETP, and METP for BS1 scenarios. For BS2 and AS scenarios, the retail phase has a relevant contribution to FCP due to fossil fuels for transport. The contribution analysis for BS2 and AS shows an increasing impact related to the higher distance for forecourt transport.
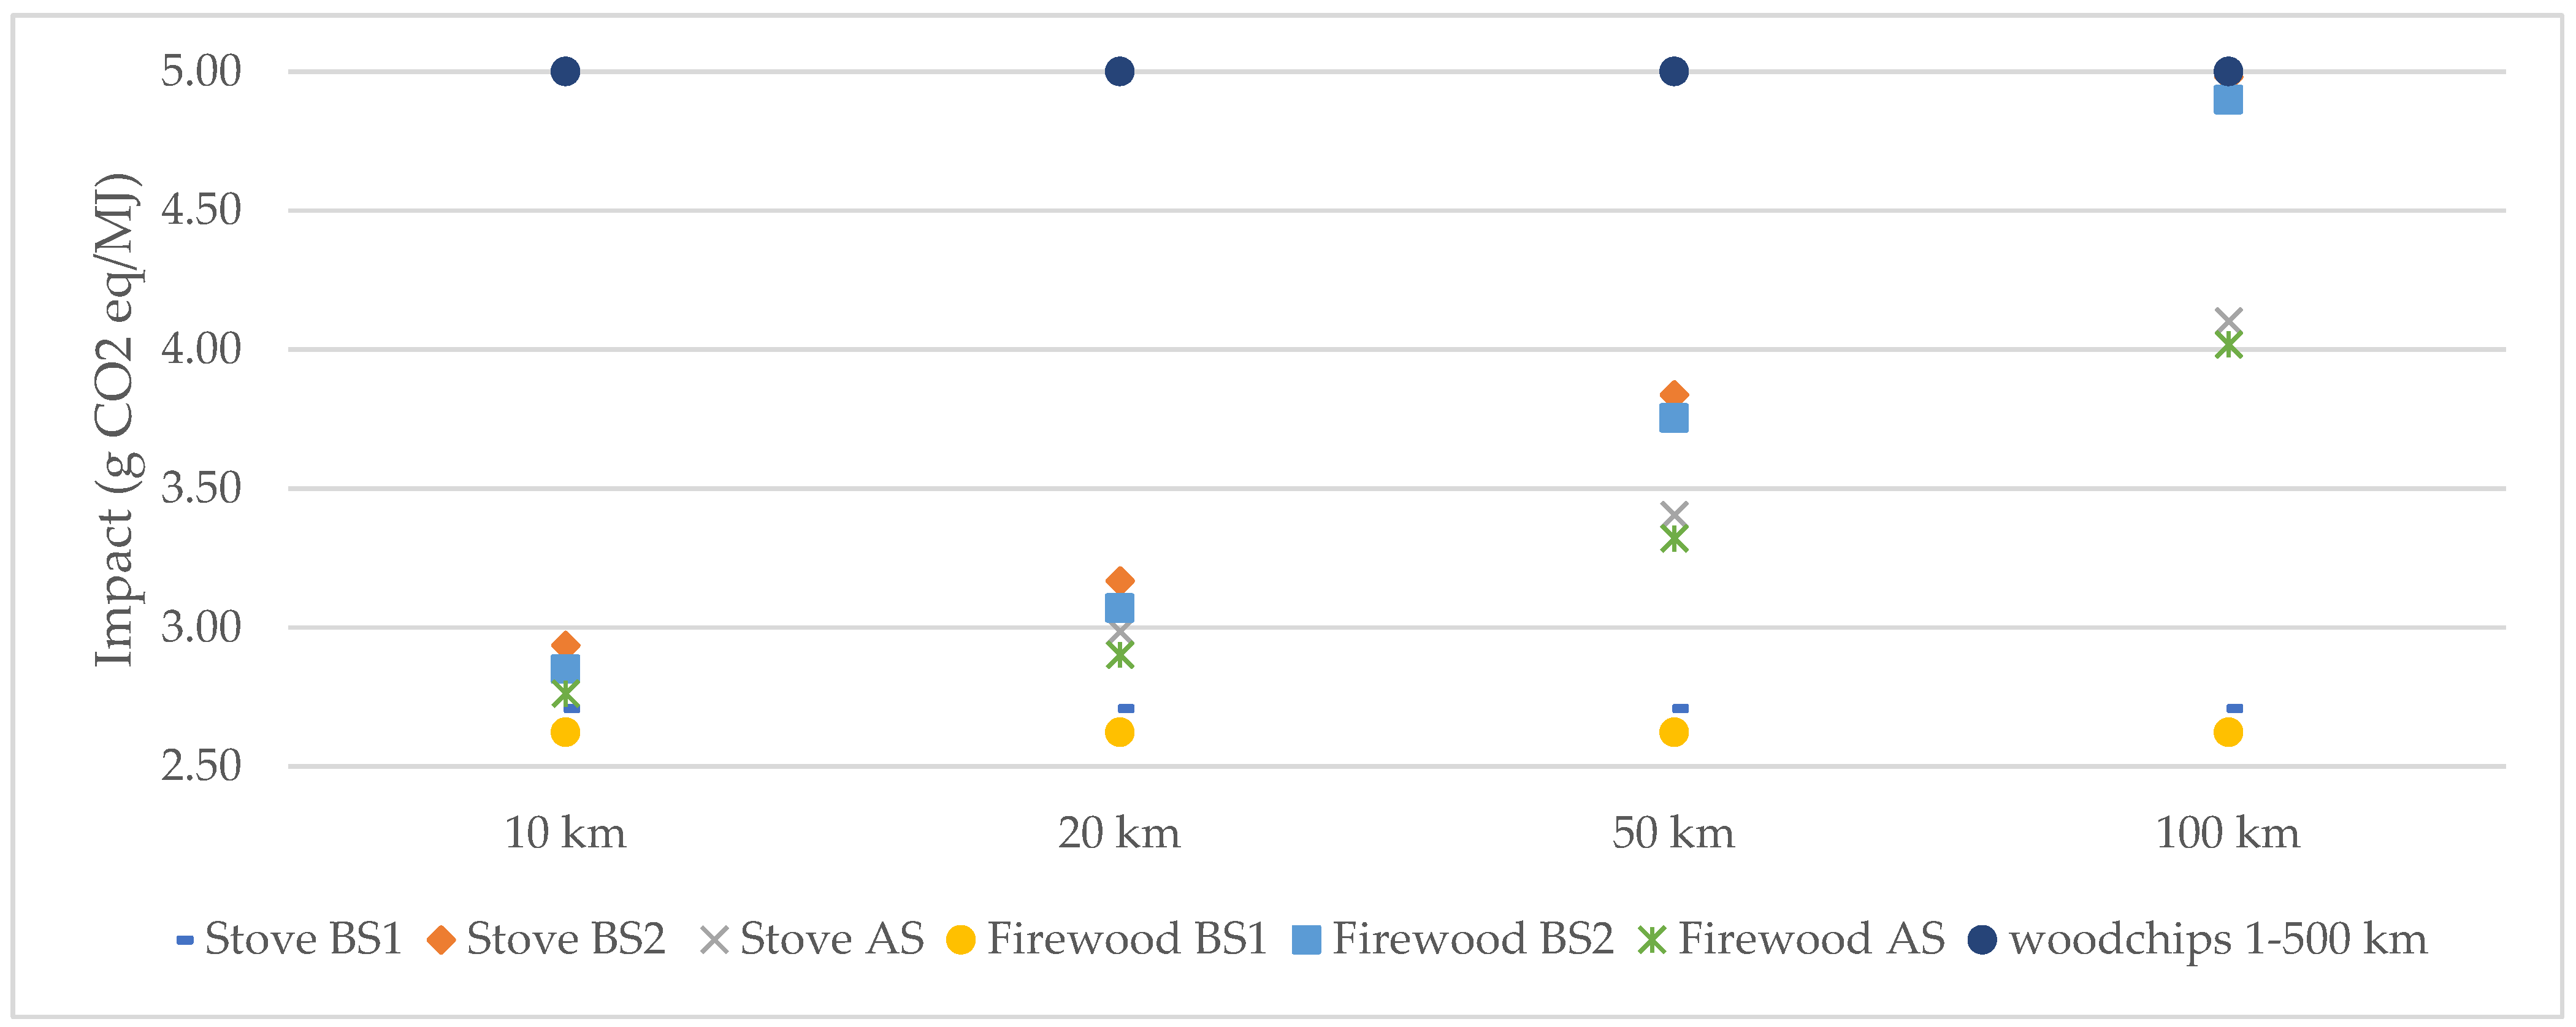
In contrast to what was previously written in the case of the TAP impact category, the sizing phase contributes the most, as far as the BS1 scenarios are concerned. For GWP, HTP, TAP, and FCP, the impact is more balanced between the different phases than in all the other categories in which combustion predominates. In
Figure 4 is reported the sensitivity analysis relative to an increasing distance for transport from the forecourt to final processing. Looking at the chart, it is clear that this impact is always lower than the reference impact of wood chips from annex C of RED II standard. From a standard distance of 10 km (baseline) to a maximum of 100 km, the impact increases until reaching the impact of wood chips as indicated in Annex C of the RED II regulation (BS2 scenarios with forecourt transport of 100 km).
The sensitivity analysis conducted on transportation from extraction location and sizing location (forecourt transport) for BS2 and AS (both stove and fireplace) shows a significant increase. By default, the distance set for this phase is 10 km considering that most of the forestry companies stay close to the production areas. However, it is not uncommon for some companies to set up processing areas closer to larger population centers to reduce the burden of the retail phase. Results show that increasing transportation distance by 100% (10 to 20 km) for forecourt transport will increase the final impact from 8% to 17% for BS2 stove and from 9% to 17% BS2 firewood. Similar results were found for AS. In this case, the final impact increased from 5% to 10% for AS stove and from 5% to 11% for AS firewood. Increasing the transportation distance to 50 km and 100 km also increased impact by 42% and 84%, respectively (BS2 stove), 43% and 87% (BS2 firewood), 26% and 52% (AS stove), and 27% and 53% (AS firewood).
3.2. Indirect Impact on Biodiversity
In
Table 9 is reported the impact for BS1, BS2, and AS considering the standard forecourt transport of 10 km, applying an endpoint approach for impact assessment (method used ReCiPe Endpoint (H) v1.10/Europe ReCiPe H/A).
It is possible to note that the impact categories linked to ecosystem damage and thus indirectly linked to biodiversity do not show a significant variation. On the other hand, the category of human health and resources damage shows an increasing impact starting from BS1 (lowest impact) to BS2 (highest impact) for both stove and fireplace scenarios.
4. Discussion
The results highlight the impact of heat production from the wood of a given tree species widely spread in Italy and the Balkans, which forms populations that are often dense and with few other species of silvicultural interest. The scenarios analyzed that represent the normal supply chains present in Italy show how the impact of the scenarios for firewood is less than that for wood for stoves. Although there are differences in the combustion processes, they do not show substantial differences in impact. The greater impact of the woodstove scenarios is entirely attributable to the increased use of fuels, lubricants, and machines for the wood splitting and cutting phases, which require more inputs as the material is reduced into smaller pieces. On the contrary, in the firewood scenarios, the impact for cutting and splitting is lower as the load capacity of the combustion devices is greater, and they can therefore handle longer logs with a greater diameter than those used stoves. The comparison between short chain (BS1) and medium chains (BS2 and AS) shows a foreseeable lower impact for short chain than for the two medium chains. AS shows better environmental performances due to the more efficient transport means employed compared to BS2. In all cases, combustion contributes to a higher impact in all the categories except TAP for BS1 stove and fireplace.
We compared our results to the impacts of similar supply chains included in technical standards such as the RED II regulation and the EU directive 2018/2001 [
41], which report the impact of different energy chains (for the production of electricity and heat) from solid biofuels such as wood. It is evident that the present case study presents lower but comparable values, 3 g CO
2 eq/MJ of the present study (baseline) against 5 g CO
2 eq/MJ of the 2018/2001 regulation (referring to wood chips from wood logs with transport distance 0–500 km). For this last case, the same legislation reports a contribution of 0.3 g CO
2 eq/MJ for the wood chips processing phase. For the scenarios tested with the forecourt transport distance of 100 km, the impact is very close to that reported by the legislation net of chipping (4.1–4.9 g CO
2 eq/MJ). Similar results can be found in the literature. Pierobon et al. 2015 [
42] reported an impact on GWP for firewood production that ranged from 4.3 and 9.7 g CO
2 eq/MJ (the study avoided the emission of biogenic CO
2) for short and long production chains. The other few studies focusing on energy conversion reported values of 1.5–3.5 g CO
2 eq/MJ [
43], 18–53 g CO
2 eq/MJ (the study considers managed and fertilized systems) [
44], 7.5–8 g CO
2 eq/MJ [
45], and 2.1–2.9 g CO
2 eq/MJ [
46].
The present study aims to increase multidisciplinary knowledge in the forestry field to objectively evaluate the best choices in terms of management of both Italian and broader geographic forest heritage. Specifically, for the Hophornbeam, scientific evidence [
47] demonstrates that coppice management favors a greater level of biodiversity right after cutting. This appears to contrast the requests of the ecological movements that support the need to stop all felling activities in the woods. Obviously, what is true for the cenosis in which the Hophornbeam predominates may not be true for other forest formations. However, considering the carbon neutrality of biological systems (limited to biogenic carbon emissions from wood-burning and in the absence of land use change), the advantage of rational forest cutting appears clear if this guarantees greater biodiversity and resilience.
Concerning the high contribution of the combustion phase of the present case study, a possible mitigation measure could be transforming the material into densified materials such as pellets or briquettes that would be valorized in devices with better energy performance and lower emissions of unburnt and particulate matter. This measure would generate a greater impact of the transformation phase (generated by the greater energy consumption to dry and densify the wood) regarding the GWP (as reported by the RED II reference values) against a reduced impact for categories such as human toxicity. The possible opportunity and advantage of the production of densified products is not certain and should be investigated on a case-by-case basis.


