
Enhancement of the ESSENZ Method and Application in a Case Study on Batteries
by
 ,
,
Julia Pelzeter
1,*, 
Vanessa Bach
1,*,
Martin Henßler
2,
Klaus Ruhland
2 and
Matthias Finkbeiner
1
1
Institute of Environmental Technology, Technische Universität Berlin, Straße Des 17. Juni 135, 10623 Berlin, Germany
2
Sustainability, Group Environmental Protection & Energy Management, Mercedes-Benz AG, 70546 Stuttgart, Germany
*
Authors to whom correspondence should be addressed.
Resources 2022, 11(6), 52; https://0-doi-org.brum.beds.ac.uk/10.3390/resources11060052
Submission received: 31 March 2022
/
Revised: 19 May 2022
/
Accepted: 20 May 2022
/
Published: 25 May 2022
Abstract
:With a growing awareness of the impact of resource exploitation, issues such as mine site certification and recyclate use in products come to the fore. These aspects are incorporated into the ESSENZ method which assesses resource criticality. Moreover, the method is enhanced by addressing further shortcomings and considering the SCARCE method. The resultant so-called ESSENZ+ method is tested in a case study on batteries involving a data update concerning the characterization factors of eight raw materials. The comparison of the results, using the original ESSENZ versus the updated ESSENZ+ characterization factors, shows significant changes regarding the demand growth (an increase of four times due to the inclusion of future trends) and price fluctuations (an increase of fourteen times due to a data update). The impact of the introduction of the aspects of mine site certification and recyclate use are examined via sensitivity analyses showing a reduced supply risk, yet to different extents in the different categories. A comparison of nickel-manganese-cobalt (NMC) batteries with different NMC ratios shows a decreasing supply risk per kWh, along with technological advancement, due to lower material requirements and smaller cobalt shares. ESSENZ+ enables users to include relevant developments in their assessment such as increasing mine site certifications and recyclate use.
1. Introduction
Resources are crucial for a stable economy and society. Due to fast-growing industries and technological development, the demand for resources, especially for abiotic resources such as metals and fossil fuels, has increased considerably over recent decades [1]. The resulting exploitation of resources leads to adverse effects on all three dimensions of sustainability: the environment becomes polluted and climate change is amplified [2,3]; socio-economic problems such as supply risks occur, which are provoked, for instance, by high concentrations of reserves and production [4,5,6,7]; and furthermore, social issues such as child labor and violations of human rights arise, especially in connection with artisanal and small-scale mining [8,9,10]. To ensure access to, and use of, resources in the future in a justifiable manner, these issues have to be addressed. This can be done using criticality assessments that aim at hotspot analysis and risk mitigation [11]. In recent years, several assessment methods regarding resource efficiency and criticality have been developed [12,13].
The United Nations Environment Programme/Society of Environmental Toxicology and Chemistry (UNEP/SETAC) taskforce for mineral resources recently recommended two methods concerning short-term geopolitical and socio-economic aspects: the GeoPolRisk method (suggested) and the ESSENZ method (integrated method to assess resource efficiency), which is interim recommended [12,13,14,15]. The GeoPolRisk method assesses criticality aspects of abiotic raw materials on a product level. It provides characterization factors (CFs) to determine the country-specific supply risk by focusing on aspects of the geopolitical (in)stability of trade partners [16].
This paper focuses on the ESSENZ method, because it received a better rating from the taskforce, and furthermore, it was developed by some of the authors of this publication. Thus, background data was more easily accessible, and the method details and challenges were better known.
The ESSENZ method (hereinafter referred to as ESSENZ) assesses resource use on a product level including all three dimensions of sustainability [17,18,19]. It allows for a comprehensive assessment of resource use by addressing environmental impacts, criticality, as well as societal aspects. Environmental impacts are determined for the categories of acidification, eutrophication, climate change, ozone layer depletion, and photochemical ozone creation. For criticality, overall, 11 aspects are taken into account, which reflect medium-term factors that potentially decrease the availability of resources, and therefore, lead to a higher supply risk. The categories are: concentration of production and reserves, company concentration, feasibility of exploration projects, political stability, occurrence as co-product, mining capacity, primary material use, demand growth, price fluctuations, and trade barriers. Societal aspects address compliance with social standards (here: child labor, forced labor, and high conflict zones) as well as environmental standards (here: environmental performance of country’s policies).
The methodical approach of ESSENZ was not revised since its initial design, apart from further developments into CS-ESSENZ (company-specific ESSENZ) [20] and the SCARCE method (approach to enhance the assessment of critical resource use on a national level; hereinafter referred to as SCARCE) with a focus on the criticality assessment of regions [21,22].
Several shortcomings have been addressed in the literature concerning the methodical approach [17,19,20,22]. Moreover, limitations of ESSENZ have been revealed in practice. A detailed overview of the shortcomings is provided in Section 2.1.
The objective of this paper is the methodological enhancement of ESSENZ. To achieve this goal, the individual shortcomings are identified, and on condition of feasibility, considered in the method adjustment (Section 2) leading to the so-called ESSENZ+ method (Section 3). The results are demonstrated with the help of a case study on batteries (Section 4). For the raw materials examined in the case study, the characterization factors (CFs) of ESSENZ+ are provided. Finally, the approaches of the methodological enhancement and of the case study are critically discussed (Section 5) and conclusions are drawn (Section 6).
2. Methods for the Derivation of ESSENZ+
In the following, the different steps of the enhancement of ESSENZ to ESSENZ+ are described (see Figure 1).
2.1. Identification of Limitations and Weaknesses of ESSENZ
To enhance ESSENZ, first, limitations and weaknesses of the method are gathered to obtain an overview of improvement potentials. For this step, the ESSENZ-related literature is examined and feedback from practice is collected. The identified shortcomings are listed below.
- Societal acceptance categories
Necessity for adjustment arose according to the relevance of the issues in practice [20].
- Future trends in the demand growth
Lack of inclusion of future trends concerning demand growth [19]. So far, ESSENZ uses production data of the last five years for calculation [17]. In fast-growing industries, however, data from the past is not necessarily representative.
- Recognition of mine site certification
The interest of investors and companies in compliance with social standards increases [23]. Audit services focused on supply chains and initiatives for certification of mine sites are about to be established [24,25,26]. Cobalt, which is largely mined in the Democratic Republic of the Congo (DR Congo) [27], is a particular focus of growing certification attempts. In ESSENZ, mine site certifications cannot be recognized.
- Mine-site-specific assessment
The assessment of risks due to missing societal acceptance is based on data on a sector and/or country level. Assessments on mine site level is not possible [17].
- Assessment of secondary materials
The use of recyclates is increasingly pursued by producers. Next to social and environmental impacts of primary production, supply risk issues are a reason for this trend. Recycling plants are located in different countries than mine production, which is enabled by the independence from the location of geological reserves [28,29,30]. This allows for domestic recycling, thus implying lower supply risks [16]. ESSENZ covers general recycled contents with regard to global metal flows [17,31]. Secondary materials are not assessed.
- Company-specific assessment
The ESSENZ results represent global averages [17]. Company specific efforts on risk reduction cannot be included [20].
- Data update
The underlying supply risk data of the ESSENZ CFs should be regularly updated to “adequately reflect changing supply risks” [19] (p. 13).
- Set Distance-to-Target (DtT) results below one to zero
The step “set all DtT results below one to zero” might lead to the underestimation of certain risks [19].
- Indicator uncertainties
Used indicators such as the Worldwide Governance Indicators (WGI) carry uncertainties that are reproduced in the method [22].
2.2. Feasibility Check of Identified Improvement Potentials
The identified aspects for improvements are checked regarding their feasibility (see Table 1). For numbers 4 and 6, trade-offs between inclusion into the method and practicability in terms of application exist. Number 8 would significantly change the methodological basis of ESSENZ and is therefore not included. Number 9 relates to the inherent shortcomings that cannot be tackled within the scope of ESSENZ.
2.3. Methodical Adjustment of ESSENZ
The enhancement of the original ESSENZ method to the adjusted method, called ESSENZ+, comprises two main steps. First, the SCARCE method is consulted for a revision of the considered categories and underlying indicators. The Societal acceptance dimension is more comprehensively addressed in SCARCE [21]. Hence, for these aspects, SCARCE is utilized as a basis for ESSENZ. Along with the revision of the categories of the Societal acceptance dimension, underlying indicators from other categories and dimensions are checked for more recent versions as well (improvement potentials number 1 and 2 are addressed). In doing so, a new approach for a future-related demand growth calculation is introduced.
Furthermore, an extension of the CF sets is necessary (to address improvement potentials number 3 to 6). The existing set of CFs is hereinafter called the “baseline” set. To enable the recognition of mine site certification and the assessment of secondary materials, two more CF sets are introduced: the “certified” and the “recyclate” set. The former is used for the share of raw materials in a product that comes from certified mine sites. The “recyclate” CF set is used for the share of secondary material in a product. For the remaining share of the inventory, the “baseline” CF set is applied.
An overview of the enhancement steps is given in Figure 2.
2.4. Testing of Methodical Adustment via Case Study
To demonstrate the results of ESSENZ+, a case study is carried out. Sensitivity analyses are performed to examine the extent of the impact of the new features regarding recyclates and certified primary raw materials.
The objects of study are batteries in the automotive sector. The market for batteries faces an increasing demand, especially due to the upturn in e-mobility [32]. However, even though batteries are regarded as key components for a more sustainable future, they encounter specific challenges during production. For instance, main components such as lithium and cobalt are associated with serious environmental and social implications [33,34,35,36]. Numerous current life cycle assessment (LCA) studies on batteries exist, but only a few address the criticality of resource use [36]. Furthermore, existing criticality assessments of batteries focus on socio-economic supply risks and lack assessment of environmental and/or social risks [37,38,39]. This case study contributes to the literature in terms of the criticality of the raw materials of batteries, especially as it incorporates the necessary aspect of metal recycling, and as it considers the call for the use of current data [36].
3. ESSENZ+ Method
In this section, ESSENZ+ is presented. First, the adjusted categories, along with the underlying indicators, are introduced. Thereafter, the new structure of the three sets of CFs to be applied in parallel is described.
3.1. Adjusted Categories and Indicators
The structure and categories of ESSENZ+ are shown in Figure 3, which indicates the adjusted categories compared with the original ESSENZ method by using red markings.
The specific adjustments of the categories are listed in the following:
Availability:
- Abiotic resource depletion
The Abiotic resource depletion category is based on the Abiotic Depletion Potential (ADP) indicator of van Oers et al. from 2002 [40]. In 2020, van Oers et al. provided an updated set of ADPs recommending the cumulative option, since it better reflects the original aim of the ADP method [41]. Thus, ESSENZ+ uses the cumulative ADP [41]. The anthropogenic stock extended ADP (AADP) is not applied anymore due to practicability reasons owing to the limited availability of AADP values [42].
- Feasibility of exploration projects
As the Policy Potential Index was changed by the Fraser Institute to the Policy Perception Index (PPI), which uses the same data basis but differs in determining the overall score [43], ESSENZ+ uses the PPI.
- Political instability
ESSENZ uses all six Worldwide Governance Indicators (WGI) [17,44], whereas SCARCE divides the indicators into two groups used for the Political instability and the Geopolitical risk category [21]. ESSENZ+ follows the latter approach, pursuing the thematic division of the WGI. Moreover, the naming of the category is slightly adjusted from “stability” to “instability” to better reflect the associated risk.
- Demand growth
Originally, the demand growth was obtained considering the global production changes of a raw material over the last five years [17]. Since trends in previous years can be a lot different from trends in the coming years, and since the latter is far more important in terms of the induced supply risk, ESSENZ+ builds on a future-based approach. The period in question is 2019–2030, as 2030 is a year for which cross-sectoral, raw-material-specific demand forecasts exist [45,46,47], and as it is frequently used as reference year for political and company targets [48,49]. The compound annual growth rate (CAGR) is the indicator for the adjusted Demand growth category and is calculated with Equation (1):
with = global demand of a raw material for all sectors, = baseline year (2019), and = year at the end of the period in question (2030).
- Price fluctuations
Price fluctuations are quantified with the volatility indicator provided by the Federal Institute for Geosciences and Natural Resources (BGR) [50]. However, whereas ESSENZ uses the one-year value, ESSENZ+ applies the five-year value. This long-term indicator is more robust. The one-year value already fluctuates within half a year, as the example of aluminum illustrates, indicating a price volatility of 7.7% for the period from June 2020 to May 2021 [50], and 16.5% from December 2020 to November 2021 [51]. The five-year value from January 2016 to December 2020, however, is 12.5% [50,51].
Societal acceptance:
As in SCARCE, for the former ESSENZ category Compliance with social standards two new categories, Human rights abuse and Geopolitical risk, are set up, which included renaming them. Compliance with social standards is called Social risk, as the subordinated categories comprise risk aspects instead of representing compliance issues. Moreover, the category Human rights abuse is renamed Risk of labor rights violation, since the underlying indicators originate from the section “Labor Rights” in the Social Hotspots Database (SHDB) [52].
- Risk of labor rights violation
Besides the renaming of the category, the underlying indicator regarding torture is omitted, since this aspect is already taken up in one of the WGI [53] which is used in the Geopolitical risk category. Instead, the sub-indicator Freedom of association, collective bargaining and right to strike, with data from the SHDB [52], is added. These issues, mostly being part of the Fundamental Principles and Rights at Work of the International Labour Organization (ILO) [54], also gain importance from a supply risk perspective, considering the Corporate Social Responsibility (CSR) attempts and legal obligations such as the Act on Corporate Due Diligence Obligations in Supply Chains in Germany [55].
- Geopolitical risk
The former ESSENZ indicator High conflict zones from the SHDB is omitted, and in return, the category Geopolitical risk is introduced as being analogous to SCARCE [21].
- Artisanal and small-scale mining
Similarly to SCARCE, ESSENZ+ also introduces a category regarding artisanal and small-scale mining (ASM). Researched ASM shares, per raw material and country , are multiplied with the respective mine production shares and are then summed up to obtain the indicator results (see Equation (2)).
- Sensitivity of local biodiversity
This new category is added to the sub-dimension Environmental risk. In contrast to SCARCE, ESSENZ+ uses the ecoregion factor (EF) of Lindner et al. [56] which is based on more recent data. For the application in ESSENZ+, the EF has to be transformed to a country-based indicator with the help of geographic information system (GIS) data bringing together ecoregion and national territory information.
- Environmental policy
As in ESSENZ, the Environmental Performance Index (EPI) is used [17]. Due to changes concerning the underlying sub-indicators of the EPI over time, the choice is adjusted to comprise the following sub-indicators in ESSENZ+, which are all related to protected areas: Terrestrial biome protection, Marine protected areas, Protected Areas Representativeness Index, and Species Protection Index [57]. Out of these four sub-indicators, the average is calculated which is then scaled from 0 to 1 (see Equation (S1) in Section S1 in the Supplementary Material) before it is multiplied with the global production shares.
An overview of the different categories and (sub-)indicators within the Societal acceptance dimension is given in Figure 4.
Environmental impacts:
- Water scarcity
SCARCE included the category Water scarcity in the Societal acceptance dimension [21]. In ESSENZ+, the category is moved to the Environmental impacts dimension, since the aspect of water scarcity has also been introduced into the LCA field with the consensus model AWARE, which is available in common LCA databases and software [58].
- Ozone layer depletion
Ozone layer depletion used to be a major topic regarding environmental protection and still is not completely solved; however, the achievements related to the ban of ozone-depleting substances based on the Montreal Protocol, ratified in 1989, initiated ozone layer recovery [59]. Hence, this category is no longer focused upon in ESSENZ+.
Figure 5 is a visual illustration of the several adjustments in all dimensions of resource criticality.
The indicator scaling approach is largely the same as in ESSENZ and SCARCE [17,21]. An overview and description indicating minor differences are provided in the Supplementary Material in Section S1, and adjusted targets for the Distance-to-Target (DtT) approach are also provided (see Table S1). Data gaps (i.e., missing values for certain countries) are complemented by extrapolation based on the WGI (see Figures S1 and S2 in the Supplementary Material).
3.2. Three Parallel Sets of Characterization Factors
ESSENZ+ introduces a new structure of three different sets of CFs to be used in parallel. This approach allows the recognition of mine site certifications and the incorporation of product-specific recyclate rates in ESSENZ+. The application of the parallel CF sets begins in the inventory phase; after the bill of material (BoM) of the analyzed product is related to the functional unit of the study, the mass of each considered raw material is multiplied with the respective shares, i.e., the percentage of material that is sourced from certified mine sites (), and the percentage of secondary material, i.e., recyclate, used in the product (). The remaining mass share is obtained with the multiplication of the BoM with ( obtained with Equation (3)).
Then, the inventory is split into three mass shares that are multiplied with the respective CFs. The results are then aggregated again per category . The described calculation steps are summarized in Equation (4).
For categories in the dimension Societal acceptance, the approach is slightly different, because societal acceptance is independent of the mass of a raw material used in a product [18]. Thus, for the respective categories, Equation (4) is modified in the way that the multiplication with is omitted.
3.2.1. Considering Mine Site Certification in ESSENZ+
The Initiative for Responsible Mining Assurance (IRMA) standard [60,61] is a comprehensive and internationally recognized standard that is described as “today’s best practice” [62] (p. 25) or even platinum standard [63]. It is not restricted to certain raw materials and was developed by involving stakeholders from civil society and industry [64,65]. Due to its high acceptance and coverage of raw materials, this standard is chosen as a reference to integrate mine site certification into ESSENZ+.
To quantify the influence of an IRMA standard based mine site certification on the supply risk, an IRMA expert is consulted, and research is done as specified below. The choice of ESSENZ+ categories that are affected by mine site certification is made by considering which issues are covered by the IRMA standard, and whether the mine site specific regulations resulting from the standard application make a difference to the supply risk. As the impact of certification varies with respect to the different categories, quantification is done based on each specific category.
To obtain the CFs for raw materials from certified mine sites, a relative approach is chosen. Risk multipliers are determined via the quantification of qualitative risk levels based on an evenly distributed scale from 0 to 1 as shown in Table 2. These risk multipliers are then applied to the respective (sub-)indicator values.
The relevant categories and (sub-)indicators along with the respective risk multipliers are displayed in Table 3.
The supply risk due to artisanal and small-scale mining (ASM) is reduced by half when a mine site is certified. Since certified mine sites are usually related to large-scale mining (LSM) [66], one could argue for a risk multiplier of 0.0; however, this would neglect the situation in reality, as ASM also exists right next to or even on concession areas of LSM. Hence, LSM and ASM partly cooperate, and material flows are mixed in the supply chain [67].
Regarding child labor and forced labor, the risk multiplier is set to 0.25. Child labor is predominantly associated with ASM [68] and it is interdicted by the IRMA standard [61]. Though, even if no child labor occurs at the industrial mine site that is certified, it can be present in the mine’s supply chain [9], especially considering the material flow mixing described above. The same applies to forced labor [69].
A risk multiplier of 0.5 is assigned to the sub-indicator Freedom of association, collective bargaining and right to strike. According to the IRMA standard, these labor rights shall be respected [60]; however, whereas the issues of freedom of association and collective bargaining are listed in the critical requirements that are mandatory for any IRMA achievement level, the right to strike is not on that list [61]. Furthermore, even in the ILO, the right to strike is challenged by the International Organisation of Employers [70], emphasizing that this issue remains a matter of concern.
The risk based on the Environmental Performance Index is only lowered by 25% when a mine site is certified. This minimal reduction is based on the appraisal that the standards for “environmental practices […] are mostly at the surface of the issues only. As such they are limited in their power to complement environmental regulation” [66] (p. 19). All of these introduced estimations were confirmed by an IRMA expert.
3.2.2. Considering Recyclate Use in ESSENZ+
An overview of the adjustment of the CFs for recyclates is given in Figure 6. The red marked categories are adjusted, whereas the greyed-out categories are assumed to be irrelevant for recyclates, so the respective risk is set to zero.
The ADP is assumed to be irrelevant for recyclates, since recycled material is not considered [41]. The other greyed-out categories refer to mined primary material. The categories Demand growth and Price fluctuations are not adjusted since commodity demand can be met by primary as well as secondary material, and because raw materials “regardless of their primary or secondary origin normally have the same value” [71] (p. 316).
For the Company concentration category, the Herfindahl–Hirschman Index (HHI) is calculated with company shares regarding the product-specific recycling sector. The categories in the Environmental impacts dimension are adjusted by using recyclate data in the LCA.
All other red marked categories are using country-based indicators. For primary raw materials, the corresponding indicator values are multiplied with global production shares derived from U.S. Geological Survey (USGS) data [27]. For recyclates, however, research needs to be carried out to compile a list with country shares regarding the product-specific global recycling activities. The research should cover all recycling activities with outputs that can be used in the assessed product. An example for scope and assumptions concerning this research is given in the course of this case study (see Section 4.1 and Supplementary Material, Section S3.3). The researched country shares replace the global production shares regarding primary raw materials. Hence, with regard to the country-based categories, the difference between secondary and primary raw materials originates from the different locations of production (i.e., global recycling activities versus global mine production of a raw material).
4. Case Study: Battery Cells
A case study on batteries in the automotive sector is conducted, presenting how ESSENZ+ should be applied.
4.1. Goal and Scope of the Case Study
The goal of the case study is firstly to demonstrate the applicability of ESSENZ+. This is done by focusing on the baseline CFs of ESSENZ+ to enable a comparison to ESSENZ. Secondly, sensitivity analyses are performed to illustrate the impacts of recognition of mine site certifications and recyclate use; therefore, the respective CFs for raw materials from certified mine sites and for recyclates are applied. A further aim of the case study is to compare five different battery cell chemistries. Since cellular chemistries of batteries are under steady enhancement [72,73], this comparison is drawn in order to obtain a picture of whether the technological advancement also goes hand in hand with a better performance regarding resource criticality.
Figure 7 provides an overview of the different aspects examined in the case study.
The object of study is a lithium-nickel-manganese-cobalt-oxide (NMC) battery of the type NMC 811 (numbers indicate the molar ratio of nickel: manganese: cobalt metal ions). The type NMC 811 is chosen, since it will most likely overtake the current dominant cell chemistry of NMC 622 in 2025 [74]. In the case study, only the battery cell is examined, consisting of the eight raw materials aluminum, cobalt, copper, graphite, iron, lithium, manganese, and nickel. For the comparison of different battery cells, the chemistries NMC 111, NMC 532, NMC 611, and NMC 9.5.5 (9:0.5:0.5) are also assessed, so that the full range of NMC batteries is depicted [74]. The bill of material per functional unit of 1 kg/kWh is given in the Supplementary Material (see Table S2).
The ESSENZ+ categories of the LCA field are beyond the scope of the case study.
The sensitivity analyses regarding mine site certification and recyclate use are carried out separately in order to highlight the individual contributions of these aspects. The scenarios for the procurement of raw materials from certified mine sites are listed in Table 4, beginning with the base scenario (scenario 1).
The scenarios for the use of recyclates have some particularities. Instead of setting one general recyclate rate for all considered raw materials, scenarios 2 and 3 refer to the levels of recycled content required in 2030 and 2035 according to the proposal for the EU Batteries Regulation [75] (see Table 5). The sensitivity analysis regarding recyclate use focuses on three raw materials, as the regulation refers to only cobalt, lithium, and nickel (next to lead which is not of interest for NMC batteries). Furthermore, these raw materials are, or (in the case of lithium) will be, the main target materials in the recycling process of Li-ion batteries [76], which reinforces the need to restrict to these raw materials. Aluminum, copper, and steel are classic target materials for recycling as well, but for these raw materials, established recycling systems already exist independently from battery recycling plants [76]. Hence, the sensitivity analysis focuses on Li-ion battery specific recycling activities.
As regular data updates are necessary to adequately reflect changing supply risks [19], for the raw materials and categories considered in the case study, the underlying indicators are updated (see Section S2 in the Supplementary Material) [32,45,46,47,77,78,79,80,81,82,83,84,85,86,87,88,89,90,91,92,93,94,95,96,97,98,99]. The updated CFs are provided in the Electronic Supplementary Material.
For recyclates, the country shares (as described in Section 3.2.2) regarding global Li-ion battery recycling are compiled using product-specific research [30,74,93,94,97,100,101,102,103] (see Supplementary Material in Section S3.3). These country shares serve the same purpose as the USGS data for primary raw materials.
4.2. Results of the Case Study
4.2.1. General Results
First, general ESSENZ+ results of the NMC 811 battery cell are presented. Figure 8 shows the raw material contributions to all considered categories as well as to the BoM. As described in Section 3.2, in the categories of the Socio-economic availability dimension, the CFs are multiplied with the BoM, whereas in the categories Social risk and Environmental risk, the approach is independent of mass, so the CFs of the different raw materials are simply summed up per category.
Especially noticeable is the high contribution of cobalt to nearly all categories despite its very small share in the BoM. To some extent, this can be traced back to the high production share (69% in 2019) of the DR Congo [27], which directly influences the categories Concentration of reserves and Concentration of production. The DR Congo remains an unstable country [104], which has an impact on categories such as Political instability, Trade barriers, and Social risk. The high contribution to the category Occurrence of co-production is explainable by the fact that cobalt is not mined directly, but as a by-product of copper and nickel [67]. The contribution to the Demand growth and Price fluctuations categories is driven by the booming battery market needed for green technologies [105].
The latter applies to lithium and graphite as well, considering the example of lithium, with an increase in demand in the EU by about 10 times for e-mobility alone until 2030 [106]. The high shares of these two raw materials regarding the concentration related categories are due to Australia and Chile together accounting for about 70% of the global lithium reserves and mine production, and graphite mainly being extracted in China (64% in 2019) [27]. Regarding the company concentration, graphite is the only raw material out of the considered portfolio that is not set to zero after the DtT approach (indicator scaling steps described in the Supplementary Material in Section S1). None of the considered raw materials show a supply risk in the category Feasibility of exploration projects. This is attributable to the high interest in battery raw materials, implying rising exploration expenditure [105], which makes it conceivable that governments of resource-rich countries do not intend to hinder mining activities.
4.2.2. Comparison of Original ESSENZ and ESSENZ+
Next, the effects of the enhancement of ESSENZ to ESSENZ+, along with the data updates, are demonstrated. In Figure 9, the results obtained with the original CFs are compared with the ones obtained using the new CFs of ESSENZ+ in their baseline version.
The categories Company concentration, Occurrence of co-production, and Primary material use do not show any difference, since they are not updated. The Trade barriers category is not updated in its underlying raw data either, but the different scaling approach (see Section S1 in the Supplementary Material) provokes the differences. Besides the value of zero for Feasibility of exploration projects, the greatest reduction from the original to new results can be observed in the category Concentration of reserves. This is based on the updated USGS data on reserves, resulting in concentrations that are lower for aluminum, copper, graphite, and lithium. By far the greatest increase, compared with the results using the original CFs, is shown in the Demand growth category. This can be traced back to the change of the calculation method to a future-based approach, depicting the high increase in demand of the raw materials of batteries which is expected until 2030 and beyond [106]. Not displayed in Figure 9 for scale reasons is the category Price fluctuations. The results obtained with the new CFs are about 14 times (or 1400%) higher compared with the results obtained using the original CFs. This massive increase is based on the data update, and illustrates the high volatility in the battery raw material markets, especially regarding cobalt [105].
4.2.3. Sensitivity Analyses
In the following, the sensitivity analyses show the impacts of mine site certification and recyclate use on ESSENZ+. Figure 10 shows the sensitivity analysis regarding the procurement from certified mine sites. Since certification only influences categories in the Societal acceptance dimension (see Section 3.2.1), only the respective categories are displayed.
Looking at the scenario of 100% of all considered raw materials coming from certified mines, the social risk can be reduced by half, whereas the environmental risk is only reduced by 10%. This residual risk can be traced back to the risk multipliers (see Table 3) that impede a risk of zero. The small risk reduction for the sub-dimension Environmental risk is further attributable to the comprised category Sensitivity of local biodiversity. This category is based on indicators such as the share of grassland and forest, and the share of roadless area (see Figure 4). Hence, it is not affected by mine site certification, since it is in the nature of mine sites to have adverse effects on the abovementioned indicators, considering the area that is necessary for resource extraction and mining infrastructure [1].
The second sensitivity analysis examines the influence of recyclate use (see Figure 11). As explained in Section 4.1, this analysis only includes cobalt, lithium, and nickel.
Not displayed in Figure 11 are the categories Demand growth and Price fluctuations, as they are assumed to be unaffected by the use of recyclates (see Section 3.2.2), nor are the categories Company concentration and Feasibility of exploration projects shown, since they show a value of zero for all scenarios for this resource subset. The missing bars for the scenario of using 100% recyclates in the product have different reasons: the categories Concentration of reserves, Mining capacity, Occurrence of co-production, and Primary material use only apply to primary raw materials (correspond to the greyed-out categories in Figure 6). Thus, in the 100% recyclates scenario, there is no residual risk associated with these categories. Regarding the categories Trade barriers and Political instability, the missing bars can be traced back to indicator values for recyclates that are below the targets, so they are set to zero in the DtT step. Overall, especially the categories in the Socio-economic availability dimension show a significant reduction in risk.
Concerning the scenarios based on the EU Batteries Regulation proposal (2030/2035, see Table 5), a risk reduction up to 20% (2035 scenario in the Political instability category) can be observed. Hence, more than 80% of residual risk will remain in 2035, according to this assessment, if no further measures are taken.
Looking at the categories Social risk and Environmental risk, the results appear similar to the ones for certified mine sites shown in Figure 10. However, whereas the risk reduction regarding certification is based on risk multipliers (see Table 3), the reduction regarding recyclate use is due to the lesser impact of the category Artisanal and small-scale mining (as this category is assumed to be irrelevant for the recyclate share), and due to the different compositions of country shares compared with primary raw materials (see Section 3.2.2). Hence, e.g., in the case of cobalt, the high share of the DR Congo regarding primary raw materials is replaced by, among others, China, Germany, and the USA regarding recyclates. Furthermore, it has to be noted that Figure 10 refers to the whole resource portfolio of the case study (eight raw materials) whereas Figure 11 only refers to a subset of three raw materials (cobalt, lithium, and nickel). The results for certified mine sites focusing on the same resource subset do not, however, appear very differently (see Figure S3 in the Supplementary Material). The low improvement of the Environmental risk category due to the use of recyclates is, along with the role of China, outlined in detail below.
To point out the differences between the three CF sets in ESSENZ+ on a raw material level, the CFs of cobalt, lithium, and nickel, for the categories Social risk and Environmental risk, are compared (see Figure 12).
In both categories, the lowest CF of cobalt is the one for recyclates, whereas lithium and nickel have their lowest CF for certified mine sites. Considering that the CF for recyclates is, in absolute value, the same for the three raw materials within each category, this relative difference is due to rather high baseline CFs of cobalt compared with lithium and nickel (see proportions of baseline CFs for the two categories in Figure 8). The CFs for recyclates are predominantly influenced by the high estimated country share of China, accounting for about one third of the global Li-ion battery recycling industry as it appears to develop based on current capacities and announcements (see Table S5 in the Supplementary Material). China has its social issues, such as the lack of freedom of association rights [107,108], so recycled battery materials still hold a social risk. This risk can be even higher than the one of primary raw materials, as in the case of lithium. However, looking at cobalt, lithium, and nickel altogether, the social risk can be noticeably reduced by the use of recyclates as the sensitivity analysis presented in Figure 11 demonstrates.
Regarding the impact of recyclate use on the Environmental risk category, the small improvement compared with the baseline CFs can be traced back to a better performance in the category Sensitivity of local biodiversity. This improvement is partly counteracted by a worse performance in the Environmental policy category, mainly due to the high Chinese share of global battery recycling along with China’s bad score regarding the EPI [57].
4.2.4. Comparison of Different NMC Battery Cells
Finally, the comparison of the five different NMC battery cells is presented, considering only baseline CFs (see Figure 13). Here, the categories of the Societal acceptance dimension are multiplied with the BoM as an exception to be able to show the differences between the battery cells.
In all categories, the risk is considerably reduced along with the technological advancement of the NMC battery cells from NMC 111 to NMC 9.5.5. The greatest reductions can be observed in the development from NMC 111 to NMC 532 and from NMC 622 to NMC 811, mainly due to the strong reductions (44% and 56%, respectively) of cobalt per functional unit at these battery cell transition points (see Table S2 in the Supplementary Material). The category with the greatest decrease in risk, of 86%, is Occurrence of co-production. The reason for that is the substantial diminution of the mass of cobalt along with the high influence of cobalt on this category (see Figure 8). In categories such as Company concentration and Environmental risk, where the influence of cobalt is rather small or non-existent (see Figure 8), the risk reduction is lower. Whereas all other raw materials decrease in mass with the battery cell advancements, the mass of nickel increases due to the trend of higher energy densities [73] (see Table S2 in the Supplementary Material). Nevertheless, this increasing amount of nickel does not outweigh the risk reductions based on the other declines in raw material mass.
5. Discussion
In the theoretical part of this paper, as well as in the case study, there are some aspects that should be critically addressed.
5.1. Discussion of the Methodical Approach of ESSENZ+
Building on forecasts in the Demand growth category bears uncertainties, as is the nature of prognoses. These inherent uncertainties face the benefit of better estimating supply risks. Furthermore, demand predictions face the problems of limited data availability and greater research effort compared with historic data. However, the extension to all raw materials of the portfolio would be facilitated, if access to databases of market report providers, such as Roskill [109], was available.
Addressing mine site certification, the risk of categories in the Environmental impacts dimension could be reduced by certification as well, acknowledging that the IRMA standard also covers, for example, water quality management [60,66]. However, a general application of the relative approach using the risk multipliers on LCA results would ignore the complexity of LCA studies, since only certain sub-processes would be affected. Additionally, the LCA related categories take the whole life cycle of the assessed product into account, unlike the ESSENZ+ specific categories that only consider resource extraction and production. Hence, for the LCA related categories, data regarding certified mine sites from LCA databases would have to be used directly in the course of the LCA of the assessed product, but existing databases provide only average data without distinguishing whether a material is certified or not. Further aspects of mine certification are discussed in the Supplementary Material (see Section S4.1) [110,111,112,113,114].
Concerning the integration of the recyclate use, the omission of certain categories assumed as not being relevant for recyclates can be questioned, especially with regard to Mining capacity. Corresponding to the time when a reserve is exhausted, which is important for primary raw materials, recycling faces the challenge of limited availability of end-of-life (EoL) products, in particular, when in combination with the local resolution of the availability. Taking the example of the case study, despite availability of production scrap and earlier replacements, EoL batteries from electric vehicles will only reach significant levels in the 2030s, taking into account the lifetime of batteries that can even be extended by re-use and second-life applications [74]. Moreover, only 16% of the EoL batteries available for recycling by 2030 will be obtainable for the European recycling industry [115], which only accounts for a fraction of the battery demand in Europe at that time [74];. However, addressing this issue implies a lot of effort, considering the required material- and product-specific research due to lacking databases. Nevertheless, the aspect of EoL product availability should be kept in mind during interpretation of results.
5.2. Discussion of the Methodical Approach of the Case Study
The compilation of global battery recycling activities is based not only on battery recycling, but also on related industries. Furthermore, not only existing plants, but announcements are also taken into account (see Section S3.3 in Supplementary Material). Hence, uncertainties remain as to how the market will eventually develop, especially considering the multitude of announcements of e.g., new battery cell plants [97].
Referring to the pursued local concentration of battery recycling and production (see Section S3.3 in Supplementary Material), a sensitivity analysis is carried out with a scenario where recyclates only come from one country (e.g., the location of a company conducting an ESSENZ+ analysis). Figure 14 includes the scenario for secondary material that was only recycled in Germany. This scenario is added to the comparison of the three different CFs per raw material already presented in Figure 12.
In this case, the comparison of the CFs shows different results than in Figure 12. The CFs for recyclates, 100% of which came from Germany, are by far the lowest ones for all considered raw materials and categories. This reveals one of the limitations of the method: ESSENZ+ is designed for the general analysis of products providing CFs that are based on global averages. Hotspots identified by an assessment with ESSENZ+ should therefore always be checked upon correspondence with the specific supply chain of, for example, the conducting company. The CS-ESSENZ method, incorporating company-specific information in the application, has been recently published [20], but it does not provide the sets of CFs extended by mine site certification and recyclates.
Aspects regarding the data update are addressed in the Supplementary Material (Section S4.2) [116].
Concerning the comparison of the different NMC battery cells, one aspect regarding the Societal acceptance dimension has to be addressed. The actual principle of the method intends to not multiply the respective CFs with the BoM, since the societal acceptance is independent of whether, for example, 1 g or 1 kg of cobalt in the product is associated with child labor or other human rights violations [18]. However, this approach produces exactly the same results in the Social risk and Environmental risk categories for the five NMC battery cell types as they comprise the same raw materials, differing only in the respective mass per raw material (see Table S2 in the Supplementary Material). Thus, the authors decided to multiply the respective CFs with the BoM as an exception to allow for a better comparison of battery cells.
Finally, a look at the big picture might be interesting. With growing electromobility, the comparison of internal combustion engine versus electric vehicles is undertaken, showing higher impacts caused by resource use for electric vehicles mainly due to the battery [36]. Fortunately, the results displayed in Figure 13 show that this challenge is at least being tackled with the technological advancement of the NMC battery cells, resulting in lower supply risk per kWh. This positive development applies as long as it is not counteracted by batteries getting bigger to power bigger cars with higher energy requirements per kilometer [117].
6. Conclusions
The enhancement of ESSENZ to ESSENZ+ includes adjustments of categories and their underlying indicators. Relevant social risks are included as being already advanced in SCARCE [21,22]. In the environmental dimension, attention gaining aspects such as biodiversity and water scarcity are added, whereas the managed environmental problem of ozone layer depletion is excluded. Furthermore, a future perspective is included in the demand growth. With these further developments, this study updates ESSENZ and responds to the shortcomings of the original method.
Moreover, the method enhancement includes a conceptual approach to derive two more sets of characterization factors (CFs). This has the purpose of enabling the recognition of raw material procurement from certified mine sites, as well as recyclate use in a product, as these topics become more important, especially considering that industries and governments rely on resources and are becoming increasingly conscious. The case study on batteries in the automotive sector shows a risk reduction due to mine site certification and recyclate use in all affected categories. Thereby, the most significant reduction in risk can be observed for categories of the Socio-economic availability dimension due to the use of recyclates. With the integration of these production issues into the method, practitioners from the industry can recognize improvements to these aspects in the method results, which might function as an incentive for product and supply chain amendment in practice.
Though ESSENZ+ is not explicitly company-specific, as CS-ESSENZ is [20], it is individually customizable via an adjustment of shares regarding certified raw materials and used recyclates. Hence, as soon as ESSENZ+ CFs are updated for all raw materials, beyond the eight considered in the case study, individualized application would be possible without significant research effort. All that would remain is the investigation of country shares regarding the respective product-specific global recycling activities.
Supplementary Materials
The following supporting information can be downloaded at: https://0-www-mdpi-com.brum.beds.ac.uk/article/10.3390/resources11060052/s1. Section S1: Scaling of Indicators to Characterization Factors; Figure S1: Correlation analysis regarding ETI and GDP vs. WGI; Table S1: Targets for DtT approach; Figure S2: Scaling steps from raw data of indicators to characterization factors; Section S2: Update of Characterization Factors; Table S2: Data update of underlying indicators of considered categories; Section S3: Additional Information regarding the Case Study; Section S3.1: Inventory Data; Table S3: Inventory data regarding NMC batteries; Section S3.2: Demand Growth; Table S4: Demand growth indicator for case study specific raw material portfolio; Section S3.3: Adjustment regarding Recyclates; Table S5: Aspects of research regarding country shares for recyclates in the case study; Table S6: Country shares regarding global recycling activities of Li-ion batteries; Section S3.4: Supplementary Results; Figure S3: Comparison of results for the sensitivity analysis regarding certified mine sites; Section S4: Additional Aspects of Discussion; Section S4.1: Mine Site Certification; Section S4.2: Data update for the Case Study; Electronic Supplementary Material.
Author Contributions
Conceptualization, J.P. and V.B.; Data curation, J.P.; Formal analysis, J.P.; Investigation, J.P.; Methodology, J.P.; Project administration, M.H. and K.R.; Supervision, V.B., M.H., K.R. and M.F.; Validation, J.P. and V.B.; Visualization, J.P.; Writing—original draft, J.P.; Writing—review & editing, V.B., M.H., K.R. and M.F. All authors have read and agreed to the published version of the manuscript.
Funding
We acknowledge support by the German Research Foundation and the Open Access Publication Fund of the TU Berlin.
Institutional Review Board Statement
Not applicable.
Informed Consent Statement
Not applicable.
Data Availability Statement
The data presented in this study are available in the article and supplementary material.
Acknowledgments
We would like to thank Rosalie Arendt and Sylvia Marinova from TU Berlin for their support on some ESSENZ method details.
Conflicts of Interest
The authors declare no conflict of interest.
References
- International Resource Panel (IRP). Mineral Resource Governance in the 21st Century: Gearing Extractive Industries towards Sustainable Development; United Nations Environment Programme (UNEP): Nairobi, Kenya, 2020; ISBN 978-92-807-3779-0. [Google Scholar]
- International Resource Panel (IRP). Resource Efficiency and Climate Change: Material Efficiency Strategies for a Low-Carbon Future; United Nations Environment Programme (UNEP): Nairobi, Kenya, 2020; ISSN 978-92-807-3771-4. [Google Scholar]
- Marimuthu, R.; Sankaranarayanan, B.; Ali, S.M.; de Jabbour, A.B.L.S.; Karuppiah, K. Assessment of Key Socio-Economic and Environmental Challenges in the Mining Industry: Implications for Resource Policies in Emerging Economies. Sustain. Prod. Consum. 2021, 27, 814–830. [Google Scholar] [CrossRef]
- European Commission. Study on the EU’s List of Critical Raw Materials—Final Report; European Commission: Brussels, Belgium, 2020. [Google Scholar] [CrossRef]
- Helbig, C.; Schrijvers, D.; Hool, A. Selecting and Prioritizing Material Resources by Criticality Assessments. One Earth 2021, 4, 339–345. [Google Scholar] [CrossRef]
- Koyamparambath, A.; Santillán-Saldivar, J.; McLellan, B.; Sonnemann, G. Supply Risk Evolution of Raw Materials for Batteries and Fossil Fuels for Selected OECD Countries (2000–2018). Resour. Policy 2022, 75, 102465. [Google Scholar] [CrossRef]
- Hao, H.; Sun, X. The Impacts of Electric Vehicles on Resources and Supply Chains Sustainability. In China’s Resources, Energy and Sustainable Development: 2020; Springer: Singapore, 2021; pp. 195–215. ISBN 978-981-336-100-3. [Google Scholar]
- Mancini, L.; Sala, S. Social Impact Assessment in the Mining Sector: Review and Comparison of Indicators Frameworks. Resour. Policy 2018, 57, 98–111. [Google Scholar] [CrossRef]
- Sovacool, B.K. When Subterranean Slavery Supports Sustainability Transitions? Power, Patriarchy, and Child Labor in Artisanal Congolese Cobalt Mining. Extr. Ind. Soc. 2021, 8, 271–293. [Google Scholar] [CrossRef]
- Ullah, S.; Adams, K.; Adams, D.; Attah-Boakye, R. Multinational Corporations and Human Rights Violations in Emerging Economies: Does Commitment to Social and Environmental Responsibility Matter? J. Environ. Manag. 2021, 280, 111689. [Google Scholar] [CrossRef]
- Helbig, C.; Bruckler, M.; Thorenz, A.; Tuma, A. An Overview of Indicator Choice and Normalization in Raw Material Supply Risk Assessments. Resources 2021, 10, 79. [Google Scholar] [CrossRef]
- Berger, M.; Sonderegger, T.; Alvarenga, R.; Bach, V.; Cimprich, A.; Dewulf, J.; Frischknecht, R.; Guinée, J.; Helbig, C.; Huppertz, T.; et al. Mineral Resources in Life Cycle Impact Assessment: Part II—Recommendations on Application-Dependent Use of Existing Methods and on Futuremethod Development Needs. Int. J. Life Cycle Assess. 2020, 25, 798–813. [Google Scholar] [CrossRef] [Green Version]
- Sonderegger, T.; Berger, M.; Alvarenga, R.; Bach, V.; Cimprich, A.; Dewulf, J.; Frischknecht, R.; Guinée, J.; Helbig, C.; Huppertz, T.; et al. Mineral Resources in Life Cycle Impact Assessment—Part I: A Critical Review of Existing Methods. Int. J. Life Cycle Assess. 2020, 25, 784–797. [Google Scholar] [CrossRef]
- UNEP. Global Guidance for Life Cycle Impact Assessment Indicators (GLAM) Volume 2. In Life Cycle Initiative; Frischknecht, R., Jolliet, O., Eds.; UNEP: Nairobi, Kenya, 2019. [Google Scholar]
- Cimprich, A.; Bach, V.; Helbig, C.; Thorenz, A.; Schrijvers, D.; Sonnemann, G.; Young, S.B.; Sonderegger, T.; Berger, M. Raw Material Criticality Assessment as a Complement to Environmental Life Cycle Assessment: Examining Methods for Product-Level Supply Risk Assessment. J. Ind. Ecol. 2019, 23, 1226–1236. [Google Scholar] [CrossRef]
- Santillán-Saldivar, J.; Cimprich, A.; Shaikh, N.; Laratte, B.; Young, S.B.; Sonnemann, G. How Recycling Mitigates Supply Risks of Critical Raw Materials: Extension of the Geopolitical Supply Risk Methodology Applied to Information and Communication Technologies in the European Union. Resour. Conserv. Recycl. 2021, 164, 105108. [Google Scholar] [CrossRef]
- Bach, V.; Berger, M.; Henßler, M.; Kirchner, M.; Leiser, S.; Mohr, L.; Rother, E.; Ruhland, K.; Schneider, L.; Tikana, L.; et al. Integrated Method to Assess Resource Efficiency—ESSENZ. J. Clean. Prod. 2016, 137, 118–130. [Google Scholar] [CrossRef] [Green Version]
- Bach, V.; Berger, M.; Henßler, M.; Kirchner, M.; Leiser, S.; Mohr, L.; Rother, E.; Ruhland, K.; Schneider, L.; Tikana, L.; et al. Messung von Ressourceneffizienz mit der ESSENZ-Methode; Springer: Berlin/Heidelberg, Germany, 2016; ISBN 978-3-662-49263-5. [Google Scholar]
- Bach, V.; Berger, M.; Finogenova, N.; Finkbeiner, M. Analyzing Changes in Supply Risks for Abiotic Resources over Time with the ESSENZ Method—A Data Update and Critical Reflection. Resources 2019, 8, 83. [Google Scholar] [CrossRef] [Green Version]
- Yavor, K.M.; Bach, V.; Finkbeiner, M. Adapting the ESSENZ Method to Assess Company-Specific Criticality Aspects. Resources 2021, 10, 56. [Google Scholar] [CrossRef]
- Bach, V.; Finogenova, N.; Berger, M.; Winter, L.; Finkbeiner, M. Enhancing the Assessment of Critical Resource Use at the Country Level with the SCARCE Method—Case Study of Germany. Resour. Policy 2017, 53, 283–299. [Google Scholar] [CrossRef] [Green Version]
- Arendt, R.; Muhl, M.; Bach, V.; Finkbeiner, M. Criticality Assessment of Abiotic Resource Use for Europe—Application of the SCARCE Method. Resour. Policy 2020, 67, 101650. [Google Scholar] [CrossRef]
- Bian, J.; Liao, Y.; Wang, Y.-Y.; Tao, F. Analysis of Firm CSR Strategies. Eur. J. Oper. Res. 2021, 290, 914–926. [Google Scholar] [CrossRef]
- Calvão, F.; Gronwald, V. Blockchain in the Mining Industry: Implications for Sustainable Development in Africa. Policy Insights 2019, 74, 1–12. [Google Scholar]
- Ruokonen, E. Preconditions for Successful Implementation of the Finnish Standard for Sustainable Mining. Extr. Ind. Soc. 2020, 7, 611–620. [Google Scholar] [CrossRef]
- van den Brink, S.; Kleijn, R.; Tukker, A.; Huisman, J. Approaches to Responsible Sourcing in Mineral Supply Chains. Resour. Conserv. Recycl. 2019, 145, 389–398. [Google Scholar] [CrossRef]
- USGS. Mineral Commodity Summaries 2021; U.S. Geological Survey: Reston, VA, USA, 2021. [Google Scholar] [CrossRef]
- Or, T.; Gourley, S.W.D.; Kaliyappan, K.; Yu, A.; Chen, Z. Recycling of Mixed Cathode Lithium-Ion Batteries for Electric Vehicles: Current Status and Future Outlook. Carbon Energy 2020, 2, 6–43. [Google Scholar] [CrossRef] [Green Version]
- Pinegar, H.; Smith, Y.R. Recycling of End-of-Life Lithium Ion Batteries, Part I: Commercial Processes. J. Sustain. Metall. 2019, 5, 402–416. [Google Scholar] [CrossRef]
- Werner, D.; Peuker, U.A.; Mütze, T. Recycling Chain for Spent Lithium-Ion Batteries. Metals 2020, 10, 316. [Google Scholar] [CrossRef] [Green Version]
- Graedel, T.E.; Allwood, J.; Birat, J.P.; Buchert, M.; Hagelüken, C.; Reck, B.K.; Sibley, S.F.; Sonnemann, G. Rates of Metals: A Status Report; UNEP: Nairobi, Kenya, 2011. [Google Scholar]
- Buchert, M.; Dolega, P.; Degreif, S. Gigafactories für Lithium-Ionen-Zellen—Rohstoffbedarfe für die globale Elektromobilität bis 2050; Oeko-Inst. e.V.: Darmstadt, Germany, 2019. [Google Scholar]
- Liu, W.; Agusdinata, D.B. Interdependencies of Lithium Mining and Communities Sustainability in Salar de Atacama, Chile. J. Clean. Prod. 2020, 260, 120838. [Google Scholar] [CrossRef]
- Schüler, D.; Dolega, P.; Degreif, S. Social, Economic and Environmental Challenges in Primary Lithium and Cobalt Sourcing for the Rapidly Increasing Electric Mobility Sector; Oeko-Inst. e.V.: Darmstadt, Germany, 2018. [Google Scholar]
- Sun, X.; Bach, V.; Finkbeiner, M.; Yang, J. Criticality Assessment of the Life Cycle of Passenger Vehicles Produced in China. Circ. Econ. Sustain. 2021, 1, 435–455. [Google Scholar] [CrossRef]
- Dolganova, I.; Rödl, A.; Bach, V.; Kaltschmitt, M.; Finkbeiner, M. A Review of Life Cycle Assessment Studies of Electric Vehicles with a Focus on Resource Use. Resources 2020, 9, 32. [Google Scholar] [CrossRef] [Green Version]
- Bongartz, L.; Shammugam, S.; Gervais, E.; Schlegl, T. Multidimensional Criticality Assessment of Metal Requirements for Lithium-Ion Batteries in Electric Vehicles and Stationary Storage Applications in Germany by 2050. J. Clean. Prod. 2021, 292, 126056. [Google Scholar] [CrossRef]
- Greenwood, M.; Wentker, M.; Leker, J. A Region-Specific Raw Material and Lithium-Ion Battery Criticality Methodology with an Assessment of NMC Cathode Technology. Appl. Energy 2021, 302, 117512. [Google Scholar] [CrossRef]
- Wentker, M.; Greenwood, M.; Asaba, M.C.; Leker, J. A Raw Material Criticality and Environmental Impact Assessment of State-of-the-Art and Post-Lithium-Ion Cathode Technologies. J. Energy Storage 2019, 26, 101022. [Google Scholar] [CrossRef]
- van Oers, L.; Koning, A.; Guinée, J.B.; Huppes, G. Abiotic Resource Depletion in LCA; Road and Hydraulic Engineering Institute: Amsterdam, The Netherlands, 2002. [Google Scholar]
- van Oers, L.; Guinée, J.B.; Heijungs, R. Abiotic Resource Depletion Potentials (ADPs) for Elements Revisited—Updating Ultimate Reserve Estimates and Introducing Time Series for Production Data. Int. J. Life Cycle Assess. 2020, 25, 294–308. [Google Scholar] [CrossRef] [Green Version]
- Schneider, L.; Berger, M.; Finkbeiner, M. Abiotic Resource Depletion in LCA—Background and Update of the Anthropogenic Stock Extended Abiotic Depletion Potential (AADP) Model. Int. J. Life Cycle Assess. 2015, 20, 709–721. [Google Scholar] [CrossRef]
- Yunis, J.; Aliakbari, E. Fraser Institute Annual Survey of Mining Companies 2020; Fraser Institute: Vancouver, BC, Canada, 2021. [Google Scholar]
- Kaufmann, D.; Kraay, A. The Worldwide Governance Indicators, 2020 Update—Aggregate Governance Indicators 1996–2019; World Bank: Washington, DC, USA, 2020. [Google Scholar]
- CRUX Investor. The Cobalt Market 2021–2030F; CRUX Investor: London, UK, 2021. [Google Scholar]
- Minerals Council of Australia & Commodity Insights. Commodity Demand Outlook 2030; Minerals Council of Australia: Canberra, Australia, 2020. [Google Scholar]
- Mitchell, P. Why Mineral Supply May Be an E-Mobility Roadblock. Available online: https://www.ey.com/en_gl/mining-metals/why-mineral-supply-may-be-an-e-mobility-roadblock (accessed on 4 October 2021).
- United Nations. Transforming Our World: The 2030 Agenda for Sustainable Development—Resolution Adopted by the General Assembly on 25 September 2015; United Nations: New York, NY, USA, 2015. [Google Scholar]
- Science Based Targets initiative. Companies Taking Action. Available online: https://sciencebasedtargets.org/companies-taking-action (accessed on 4 October 2021).
- DERA. Volatilitätsmonitor May 2021; German Mineral Resources Agency (DERA): Berlin, Germany, 2021. [Google Scholar]
- DERA. Volatilitätsmonitor November 2021; German Mineral Resources Agency (DERA): Berlin, Germany, 2021. [Google Scholar]
- SHDB. Social Hotspots Database—Table of Supply Chain Risks for Multiple Issues in “Labor Rights & Decent Work”. Available online: http://www.socialhotspot.org/ (accessed on 1 October 2021).
- Kaufmann, D.; Kraay, A. Worldwide Governance Indicators—Documentation—Political Stability and Absence of Violence/Terrorism; World Bank: Washington, DC, USA, 2020. [Google Scholar]
- ILO. ILO Declaration on Fundamental Principles and Rights at Work and Its Follow-Up. In Proceedings of the International Labour Conference, Geneva, Switzerland, 18 June 1998. Annex Revised 15 June 2010. [Google Scholar]
- Bundesanzeiger Verlag. Gesetz über die unternehmerischen Sorgfaltspflichten in Lieferketten. In Bundesgesetzblatt Jahrgang 2021 Teil I Nr. 46; Bundesanzeiger Verlag: Bonn, Germany, 2021. [Google Scholar]
- Lindner, J.P.; Fehrenbach, H.; Winter, L.; Bloemer, J.; Knuepffer, E. Valuing Biodiversity in Life Cycle Impact Assessment. Sustainability 2019, 11, 5628. [Google Scholar] [CrossRef] [Green Version]
- Wendling, Z.A.; Emerson, J.W.; Sherbinin, A.; Esty, D.C.; Hoving, K.; Ospina, C.D.; Murray, J.; Gunn, L.; Ferrato, M.; Schreck, M.; et al. Environmental Performance Index 2020—Global Metrics for the Environment: Ranking Country Performance on Sustainability Issues. Yale Center for Environmental Law & Policy: New Haven, CT, USA, 2020. [Google Scholar]
- Boulay, A.-M.; Bare, J.; Benini, L.; Berger, M.; Lathuillière, M.J.; Manzardo, A.; Margni, M.; Motoshita, M.; Núñez, M.; Pastor, A.V.; et al. The WULCA Consensus Characterization Model for Water Scarcity Footprints: Assessing Impacts of Water Consumption Based on Available Water Remaining (AWARE). Int. J. Life Cycle Assess. 2018, 23, 368–378. [Google Scholar] [CrossRef] [Green Version]
- Chipperfield, M.P.; Bekki, S.; Dhomse, S.; Harris, N.R.P.; Hassler, B.; Hossaini, R.; Steinbrecht, W.; Thiéblemont, R.; Weber, M. Detecting Recovery of the Stratospheric Ozone Layer. Nature 2017, 549, 211–218. [Google Scholar] [CrossRef] [PubMed] [Green Version]
- IRMA. IRMA Standard for Responsible Mining IRMA-STD_001; Initiative for Responsible Mining Assuranc: Seattle, WA, USA, 2018. [Google Scholar]
- IRMA. IRMA Certification Body Requirements—Version 1.0; Initiative for Responsible Mining Assurance: Seattle, WA, USA, 2019. [Google Scholar]
- Tedesco, R.; Barczak, P.; Sommer, P.; Keynes, A. Enhancing the Sustainability of Batteries—A Joint NGOs’ Position Paper on the EU Battery Regulation Proposal; ECOS: Brussels, Belgium; European Environment Bureau: Brussels, Belgium; DUH: Hannover, Germany; T&E: Brussels, Belgium, 2021. [Google Scholar]
- Mudd, G.M. Sustainable/Responsible Mining and Ethical Issues Related to the Sustainable Development Goals. Geol. Soc. Lond. Spec. Publ. 2021, 508, 187–199. [Google Scholar] [CrossRef]
- Kickler, K.; Franken, G. Sustainability Schemes for Mineral Resources: A Comparative Overview. Federal Institute for Geosciences and Natural Resources (BGR): Hannover, Germany, 2017. [Google Scholar]
- UNEP. Sustainability Reporting in the Mining Sector—Current Status and Future Trends; UNEP: Nairobi, Kenya, 2020. [Google Scholar]
- Sauer, P.C.; Hiete, M. Multi-Stakeholder Initiatives as Social Innovation for Governance and Practice: A Review of Responsible Mining Initiatives. Sustainability 2020, 12, 236. [Google Scholar] [CrossRef] [Green Version]
- BGR. Mapping of the Artisanal Copper-Cobalt Mining Sector in the Provinces of Haut-Katanga and Lualaba in the Democratic Republic of the Congo; Federal Institute for Geosciences and Natural Resources (BGR): Hannover, Germany, 2019. [Google Scholar]
- Mancini, L.; Eslava, N.A.; Traverso, M.; Mathieux, F. Assessing Impacts of Responsible Sourcing Initiatives for Cobalt: Insights from a Case Study. Resour. Policy 2021, 71, 102015. [Google Scholar] [CrossRef]
- Schwartz, F.W.; Lee, S.; Darrah, T.H. A Review of Health Issues Related to Child Labor and Violence Within Artisanal and Small-Scale Mining. GeoHealth 2021, 5, e2020GH000326. [Google Scholar] [CrossRef]
- Frey, D.F. Conflict over Conflict: The Right to Strike in International Law. Glob. Labour J. 2017, 8, 17–31. [Google Scholar] [CrossRef] [Green Version]
- Renner, S.; Wellmer, F.W. Volatility Drivers on the Metal Market and Exposure of Producing Countries. Miner. Econ. 2020, 33, 311–340. [Google Scholar] [CrossRef] [Green Version]
- Hettesheimer, T.; Thielmann, A.; Neef, C.; Möller, K.; Wolter, M.; Lorentz, V.; Gepp, M.; Wenger, M.; Prill, T.; Zausch, J.; et al. Entwicklungsperspektiven für Zellformate von Lithium-Ionen-Batterien in der Elektromobilität; Fraunhofer-Allianz Batterien: Pfinztal, Germany, 2017. [Google Scholar]
- Vekić, N. Lithium-Ionen-Batterien für die Elektromobilität: Status, Zukunftsperspektiven, Recycling; Thinktank Industrielle Ressourcenstrategien: Karlsruhe, Germany, 2020. [Google Scholar]
- Mathieu, L.; Mattea, C. From Dirty Oil to Clean Batteries—Batteries vs. Oil: A Systemic Comparison of Material Requirements; Transport & Environment: Brussels, Belgium, 2021. [Google Scholar]
- EC. Proposal for a Regulation of the European Parliament and of the Council Concerning Batteries and Waste Batteries, Repealing Directive 2006/66/EC and Amending Regulation (EU) No 2019/1020; European Commission: Brussels, Belgium, 2020. [Google Scholar]
- Buchert, D.M.; Sutter, J. Stand und Perspektiven des Recyclings von Lithium-Ionen- Batterien aus der Elektromobilität; Oeko-Inst. e.V.: Darmstadt, Germany, 2020. [Google Scholar]
- Fitch Solutions Country Risk & Industry Research. Aluminium Demand Growth Will Soon Outpace Production Growth. Available online: https://www.pipingmart.com/news/aluminium-demand-growth-will-soon-outpace-production-growth-110042 (accessed on 30 December 2021).
- Basov, V. Global Refined Copper Demand to Rise 31% by 2030—Report. Available online: https://www.kitco.com/news/2021-06-08/Global-refined-copper-demand-to-rise-31-by-2030-report.html (accessed on 30 December 2021).
- Prescient & Strategic Intelligence. Graphite Market Research Report—Global Industry Trend and Growth Forecast to 2030. Available online: https://www.psmarketresearch.com/market-analysis/graphite-market (accessed on 30 December 2021).
- Barrera, P. Graphite Outlook 2021: Demand from Battery Segment to Grow. Available online: https://investingnews.com/daily/resource-investing/battery-metals-investing/graphite-investing/graphite-outlook/ (accessed on 30 December 2021).
- Qizhong, Z.; Damm, S. Supply and Demand of Natural Graphite—DERA Rohstoffinformationen Nr. 43; German Mineral Resources Agency (DERA): Berlin, Germany, 2020. [Google Scholar]
- Lasley, S. EV Batteries to Drive 9x Graphite Growth. Available online: https://www.miningnewsnorth.com/story/2019/06/01/critical-minerals/ev-batteries-to-drive-9x-graphite-growth/5754.html (accessed on 30 December 2021).
- Foundry Informatics Centre. Global Iron Ore Demand to Double in 2030. Available online: http://foundryinfo-india.org/Global%20iron%20ore%20demand%20to%20double%20in%202030.aspx (accessed on 30 December 2021).
- Accenture Strategy. Steel Demand Beyond 2030—Forecast Scenarios; Accenture Strategy: Chicago, IL, USA, 2017. [Google Scholar]
- World Steel Association. Apparent Iron Ore Consumption Worldwide from 2010 to 2019. Available online: https://0-www-statista-com.brum.beds.ac.uk/statistics/1168853/apparent-iron-ore-consumption-worldwide/ (accessed on 30 December 2021).
- The Business Research Company. Global Iron Ore Market Growth: Drivers and Trends 2020–2030. Available online: https://www.einnews.com/pr_news/530803327/global-iron-ore-market-growth-drivers-and-trends-2020–2030 (accessed on 30 December 2021).
- Comisión Chilena del Cobre. Projection of Total Worldwide Lithium Demand from 2016 to 2030. Available online: https://0-www-statista-com.brum.beds.ac.uk/statistics/452025/projected-total-demand-for-lithium-globally/ (accessed on 30 December 2021).
- Mordor Intelligence. Manganese Market—Growth, Trends, COVID-19 Impact, and Forecasts (2021–2026). Available online: https://www.mordorintelligence.com/industry-reports/manganese-market (accessed on 30 December 2021).
- Invest Saudi. Manganese Metal—Investment Opportunity Scorecard—Mining & Metals; Invest Saudi: Riyadh, Saudi Arabia, 2020. [Google Scholar]
- Fraser, J.; Anderson, J.; Lazuen, J.; Lu, Y.; Heathman, O.; Brewster, N.; Bedder, J.; Masson, O. Study on Future Demand and Supply Security of Nickel for Electric Vehicle Batteries; JRC.; Publications Office of the European Union: Luxembourg, 2021; ISBN 978-92-76-29139-8. [Google Scholar]
- Norilsk, N. Global Consumption of Nickel from 2010 to 2020. Available online: https://0-www-statista-com.brum.beds.ac.uk/statistics/273635/consumption-of-nickel-since-2007/ (accessed on 30 December 2021).
- S&P Global. SNL Metals & Mining Dataset. Marketplace—Market Intelligence. Available online: https://www.marketplace.spglobal.com/en/datasets/snl-metals-mining-(19) (accessed on 21 November 2021).
- Gulia, J.; Jain, S. Recycling of Lithium-Ion Batteries in India—$1,000 Million Opportunity; JMK Research & Analytics: Gurgaon, India, 2019. [Google Scholar]
- Harrison, D.; Ludwig, C. Electric Vehicle Battery Supply Chain Analysis—How Battery Demand and Production Are Reshaping the Automotive Industry; Automotive from Ultima Media Ltd.: London, UK, 2021. [Google Scholar]
- Chen, M.; Ma, X.; Chen, B.; Arsenault, R.; Karlson, P.; Simon, N.; Wang, Y. Recycling End-of-Life Electric Vehicle Lithium-Ion Batteries. Joule 2019, 3, 2622–2646. [Google Scholar] [CrossRef]
- Lv, W.; Wang, Z.; Cao, H.; Sun, Y.; Zhang, Y.; Sun, Z. A Critical Review and Analysis on the Recycling of Spent Lithium-Ion Batteries. ACS Sustain. Chem. Eng. 2018, 6, 1504–1521. [Google Scholar] [CrossRef]
- Betz, J.; Degreif, S.; Dolega, P. State of Play and Roadmap Concept: Mobility Sector—RE-SOURCING Deliverable 4.2; Oeko-Inst. e.V.: Darmstadt, Germany, 2021. [Google Scholar]
- Fan, E.; Li, L.; Wang, Z.; Lin, J.; Huang, Y.; Yao, Y.; Chen, R.; Wu, F. Sustainable Recycling Technology for Li-Ion Batteries and Beyond: Challenges and Future Prospects. Chem. Rev. 2020, 120, 7020–7063. [Google Scholar] [CrossRef] [PubMed]
- IEP. Global Peace Index 2020: Measuring Peace in a Complex World; Institute for Economics & Peace: Sydney, Australia, 2020. [Google Scholar]
- OICA. World Motor Vehicle Production—2019 Production Statistics. Available online: https://www.oica.net/category/production-statistics/2019-statistics/ (accessed on 10 August 2021).
- IEA. Global EV Data Explorer. Available online: https://www.iea.org/articles/global-ev-data-explorer (accessed on 29 July 2021).
- Automotive Logistics. Lithium-Ion Battery Gigafactory Database; Automotive from Ultima Media Ltd.: London, UK, 2021. [Google Scholar]
- Yu, A.; Sumangil, M. Top Electric Vehicle Markets Dominate Lithium-Ion Battery Capacity Growth. Available online: https://www.spglobal.com/marketintelligence/en/news-insights/blog/top-electric-vehicle-markets-dominate-lithium-ion-battery-capacity-growth (accessed on 14 October 2021).
- Mlambo, D.N.; Adetiba, T.C. Post-1994 South Africa’s Peacekeeping and Military Intervention in Southern Africa, Reference from the Democratic Republic of Congo (DRC) and Lesotho. J. Public Aff. 2020, 20, e1984. [Google Scholar] [CrossRef]
- DERA. Battery Raw Materials for E-Mobility; German Mineral Resources Agency (DERA): Berlin, Germany, 2021. [Google Scholar]
- Bobba, S.; Carrara, S.; Huisman, J.; Mathieux, F.; Pavel, C. Critical Raw Materials for Strategic Technologies and Sectors in the EU—A Foresight Study; European Commission: Brussels, Belgium, 2020. [Google Scholar]
- Anner, M. Monitoring Workers’ Rights: The Limits of Voluntary Social Compliance Initiatives in Labor Repressive Regimes. Glob. Policy 2017, 8, 56–65. [Google Scholar] [CrossRef]
- Franceschini, I.; Nesossi, E. State Repression of Chinese Labor NGOs: A Chilling Effect? China J. 2018, 80, 111–129. [Google Scholar] [CrossRef] [Green Version]
- Roskill. Market Reports—Roskill. Available online: https://roskill.com/market-reports/ (accessed on 25 October 2021).
- SAI. Guidance Document for Social Accountability 8000 (SA8000®:2014); Social Accountability International: New York, NY, USA, 2016. [Google Scholar]
- RMI. Standards. Available online: http://www.responsiblemineralsinitiative.org/minerals-due-diligence/standards/ (accessed on 3 January 2022).
- BGR. Certified Trading Chains. Available online: https://www.bgr.bund.de/EN/Themen/Min_rohstoffe/CTC/Concept_MC/CTC-Standards-Principles/ctc_standards-principles_node_en.html (accessed on 3 January 2022).
- Müller-Hoff, C.; Leifker, M.; Paasch, A. Menschenrechtsfitness von Audits und Zertifizierern? Eine sektorübergreifende Analyse der aktuellen Herausforderungen und möglicher Antworten; ECCHR: Berlin, Germany; Brot für die Welt: Berlin, Germany; MISEREOR e.V.: Aachen, Germany, 2021. [Google Scholar]
- Rüttinger, L.; Scholl, C. Responsible Mining? Challenges, Perspectives and Approaches—Summary of the Findings of the Research Project “Approaches to Reducing Negative Environmental and Social Impacts in the Production of Raw Materials (UmSoRess)”; German Environment Agency: Dessau-Roßlau, Germany, 2017. [Google Scholar]
- Willuhn, M. Europe’s Battery Recycling Quotas Are Blunt and a Decade Too Late. Available online: https://www.pv-magazine.com/2020/12/16/europes-battery-recycling-quotas-are-blunt-and-a-decade-too-late/ (accessed on 29 October 2021).
- Benoit Norris, C.B.; Bennema, M.; Norris, G. The Social Hotspots Database—Supporting Documentation—Update 2019; Social Hotspots Database: York, ME, USA, 2018. [Google Scholar]
- Ellingsen, L.A.-W.; Singh, B.; Strømman, A.H. The Size and Range Effect: Lifecycle Greenhouse Gas Emissions of Electric Vehicles. Environ. Res. Lett. 2016, 11, 054010. [Google Scholar] [CrossRef]
Figure 1.
Steps of the methodical derivation of ESSENZ+.

Figure 2.
Procedure of the methodical adjustment of ESSENZ.

Figure 3.
Enhancement of ESSENZ to ESSENZ+. Adjusted categories marked in red.

Figure 4.
Societal acceptance categories and underlying indicators.

Figure 5.
Category and underlying indicator adjustments.

Figure 6.
Affected categories regarding recyclates. Red marked categories are adjusted. Greyed-out categories are assumed to be irrelevant for recyclates.
Figure 6.
Affected categories regarding recyclates. Red marked categories are adjusted. Greyed-out categories are assumed to be irrelevant for recyclates.

Figure 7.
Procedure of the case study. * stands for multiplication. Multiplication with BoM only in the case of categories of the Socio-economic availability sub-dimension.
Figure 7.
Procedure of the case study. * stands for multiplication. Multiplication with BoM only in the case of categories of the Socio-economic availability sub-dimension.

Figure 8.
Results regarding the object of study NMC 811. Contributions of considered raw materials to the categories and BoM. Category Feasibility of exploration projects is not displayed since it is zero for the considered raw material portfolio.
Figure 8.
Results regarding the object of study NMC 811. Contributions of considered raw materials to the categories and BoM. Category Feasibility of exploration projects is not displayed since it is zero for the considered raw material portfolio.

Figure 9.
Comparison of results obtained using the original (ESSENZ) CFs and the new (ESSENZ+) CFs in their baseline version.
Figure 9.
Comparison of results obtained using the original (ESSENZ) CFs and the new (ESSENZ+) CFs in their baseline version.

Figure 10.
Results of the sensitivity analysis regarding certified mine sites.

Figure 11.
Results of the sensitivity analysis regarding recyclate use. Only cobalt, lithium, and nickel are considered.
Figure 11.
Results of the sensitivity analysis regarding recyclate use. Only cobalt, lithium, and nickel are considered.

Figure 12.
CFs for certified raw materials and for recyclates in relation to baseline CFs regarding the categories: (a) Social risk; (b) Environmental risk.
Figure 12.
CFs for certified raw materials and for recyclates in relation to baseline CFs regarding the categories: (a) Social risk; (b) Environmental risk.

Figure 13.
Comparison of NMC battery cell chemistries.

Figure 14.
Results of the sensitivity analysis regarding recyclates that were 100% recycled in Germany. Adjusted CFs in relation to baseline CFs regarding the categories: (a) Social risk; (b) Environmental risk.
Figure 14.
Results of the sensitivity analysis regarding recyclates that were 100% recycled in Germany. Adjusted CFs in relation to baseline CFs regarding the categories: (a) Social risk; (b) Environmental risk.


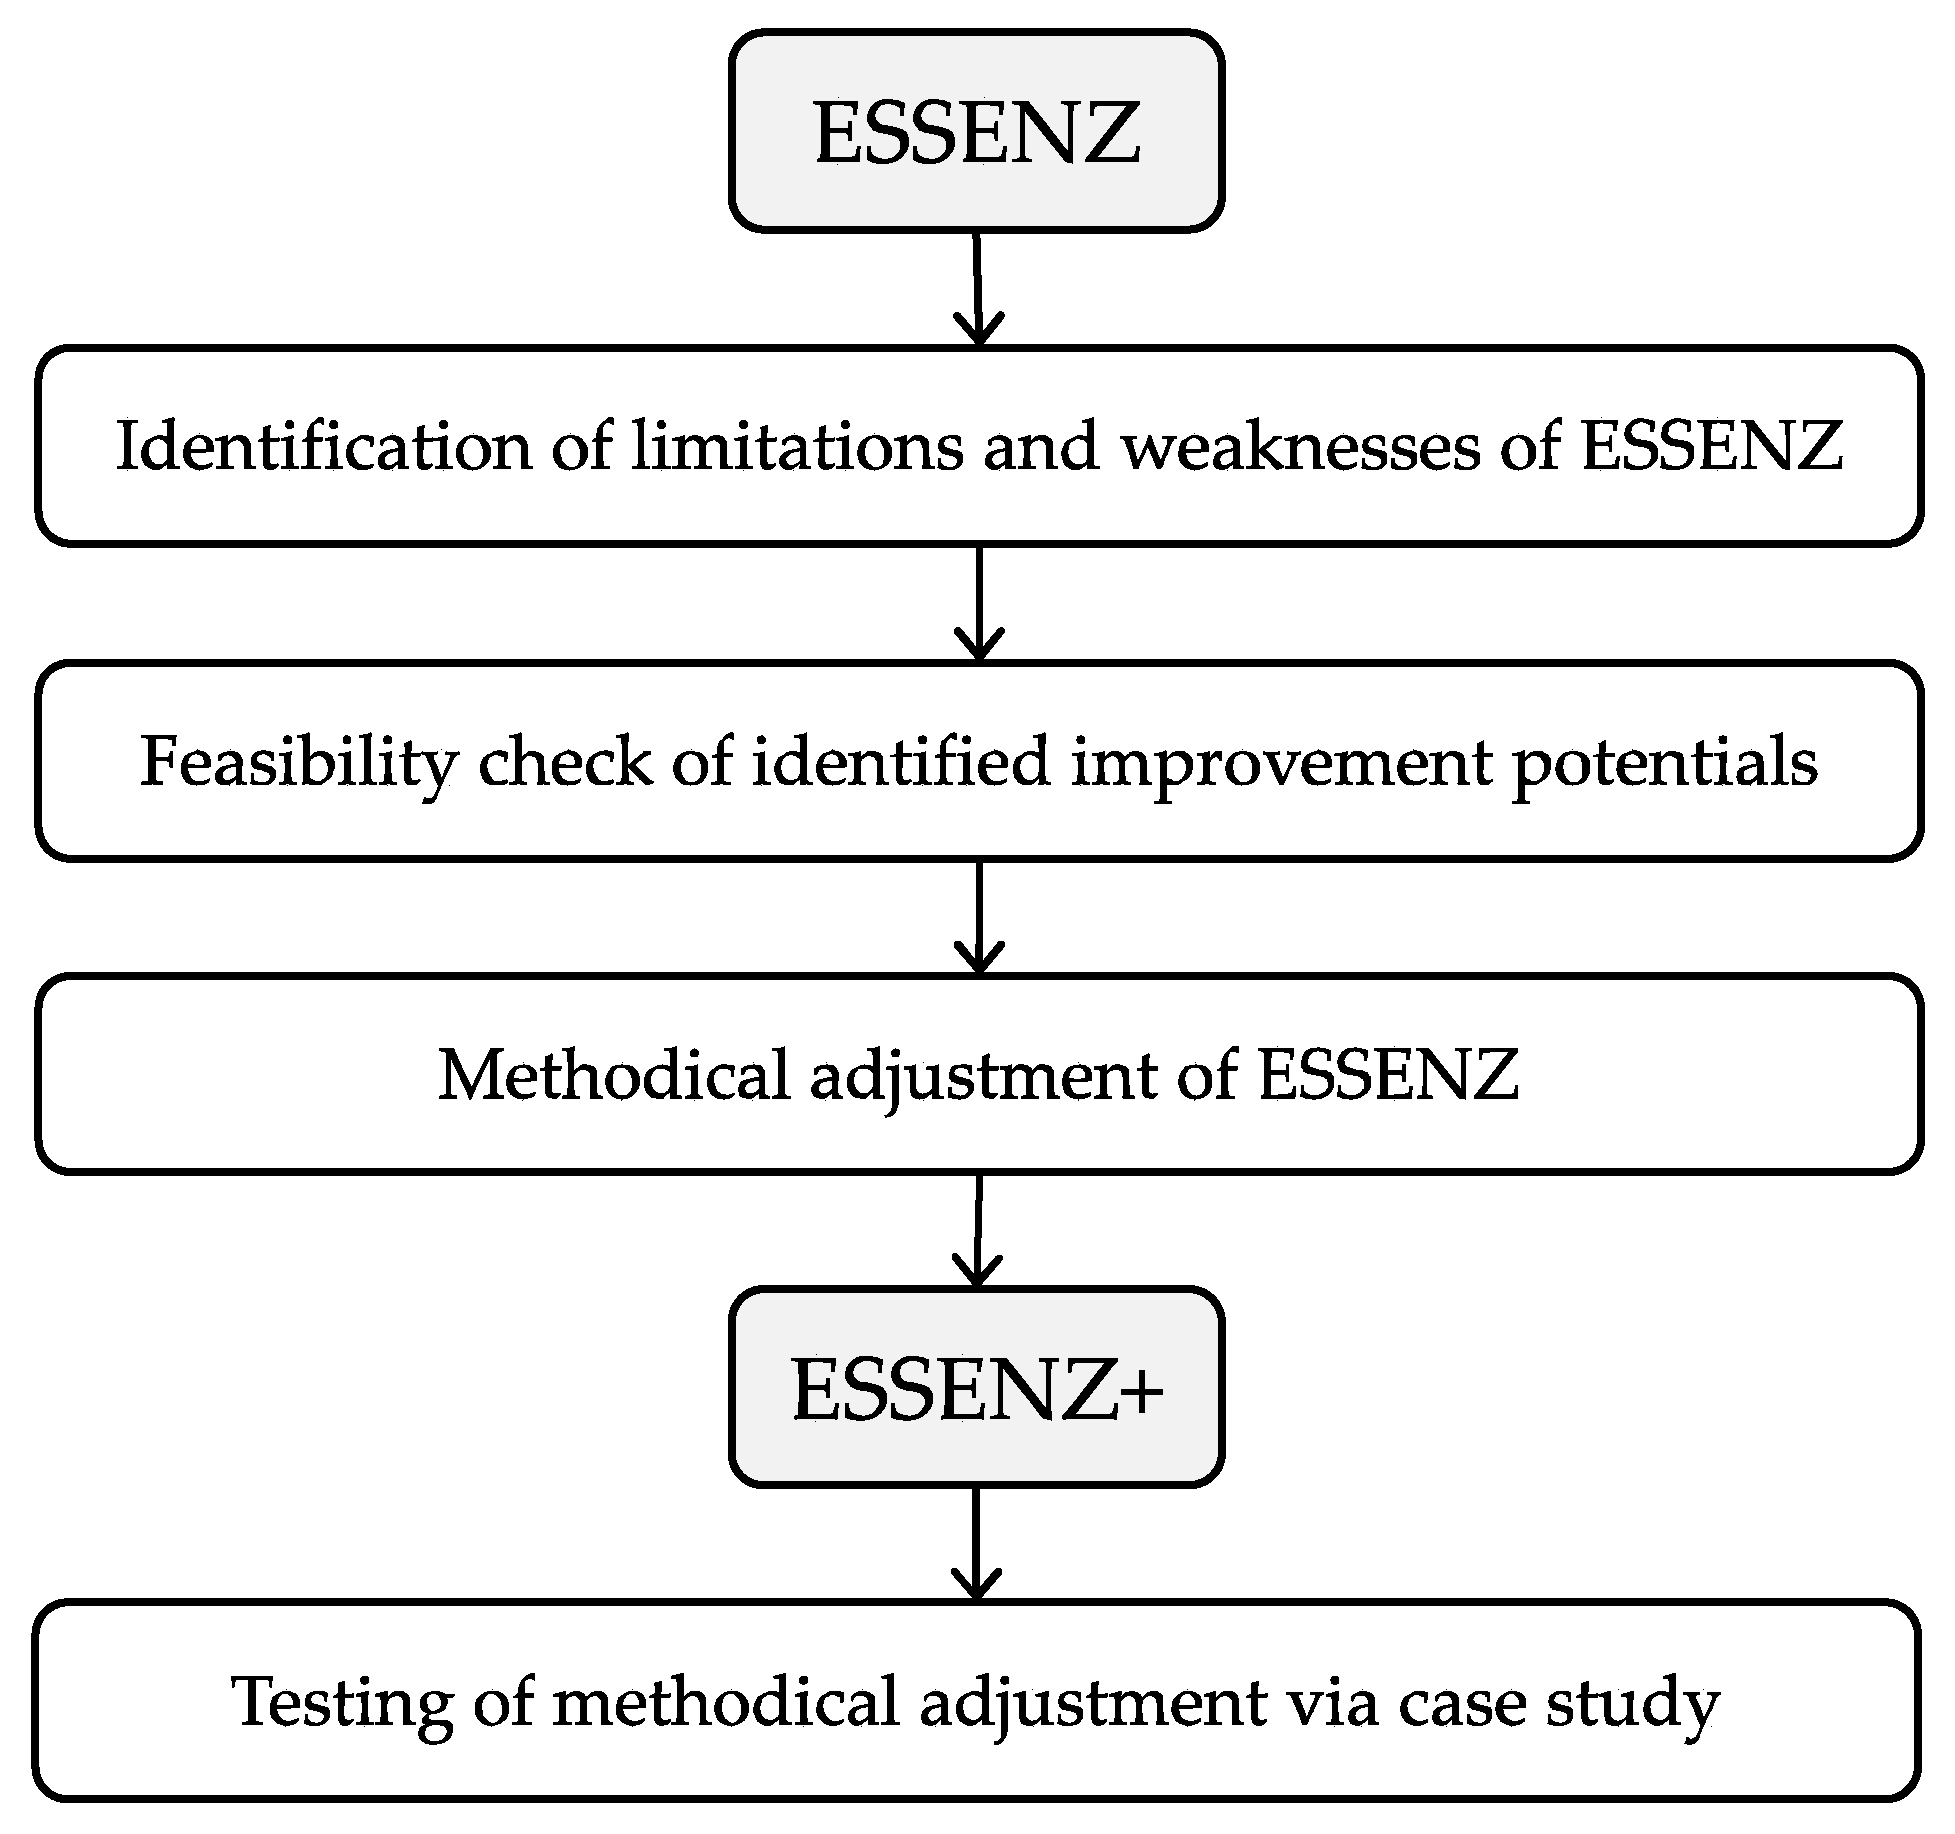
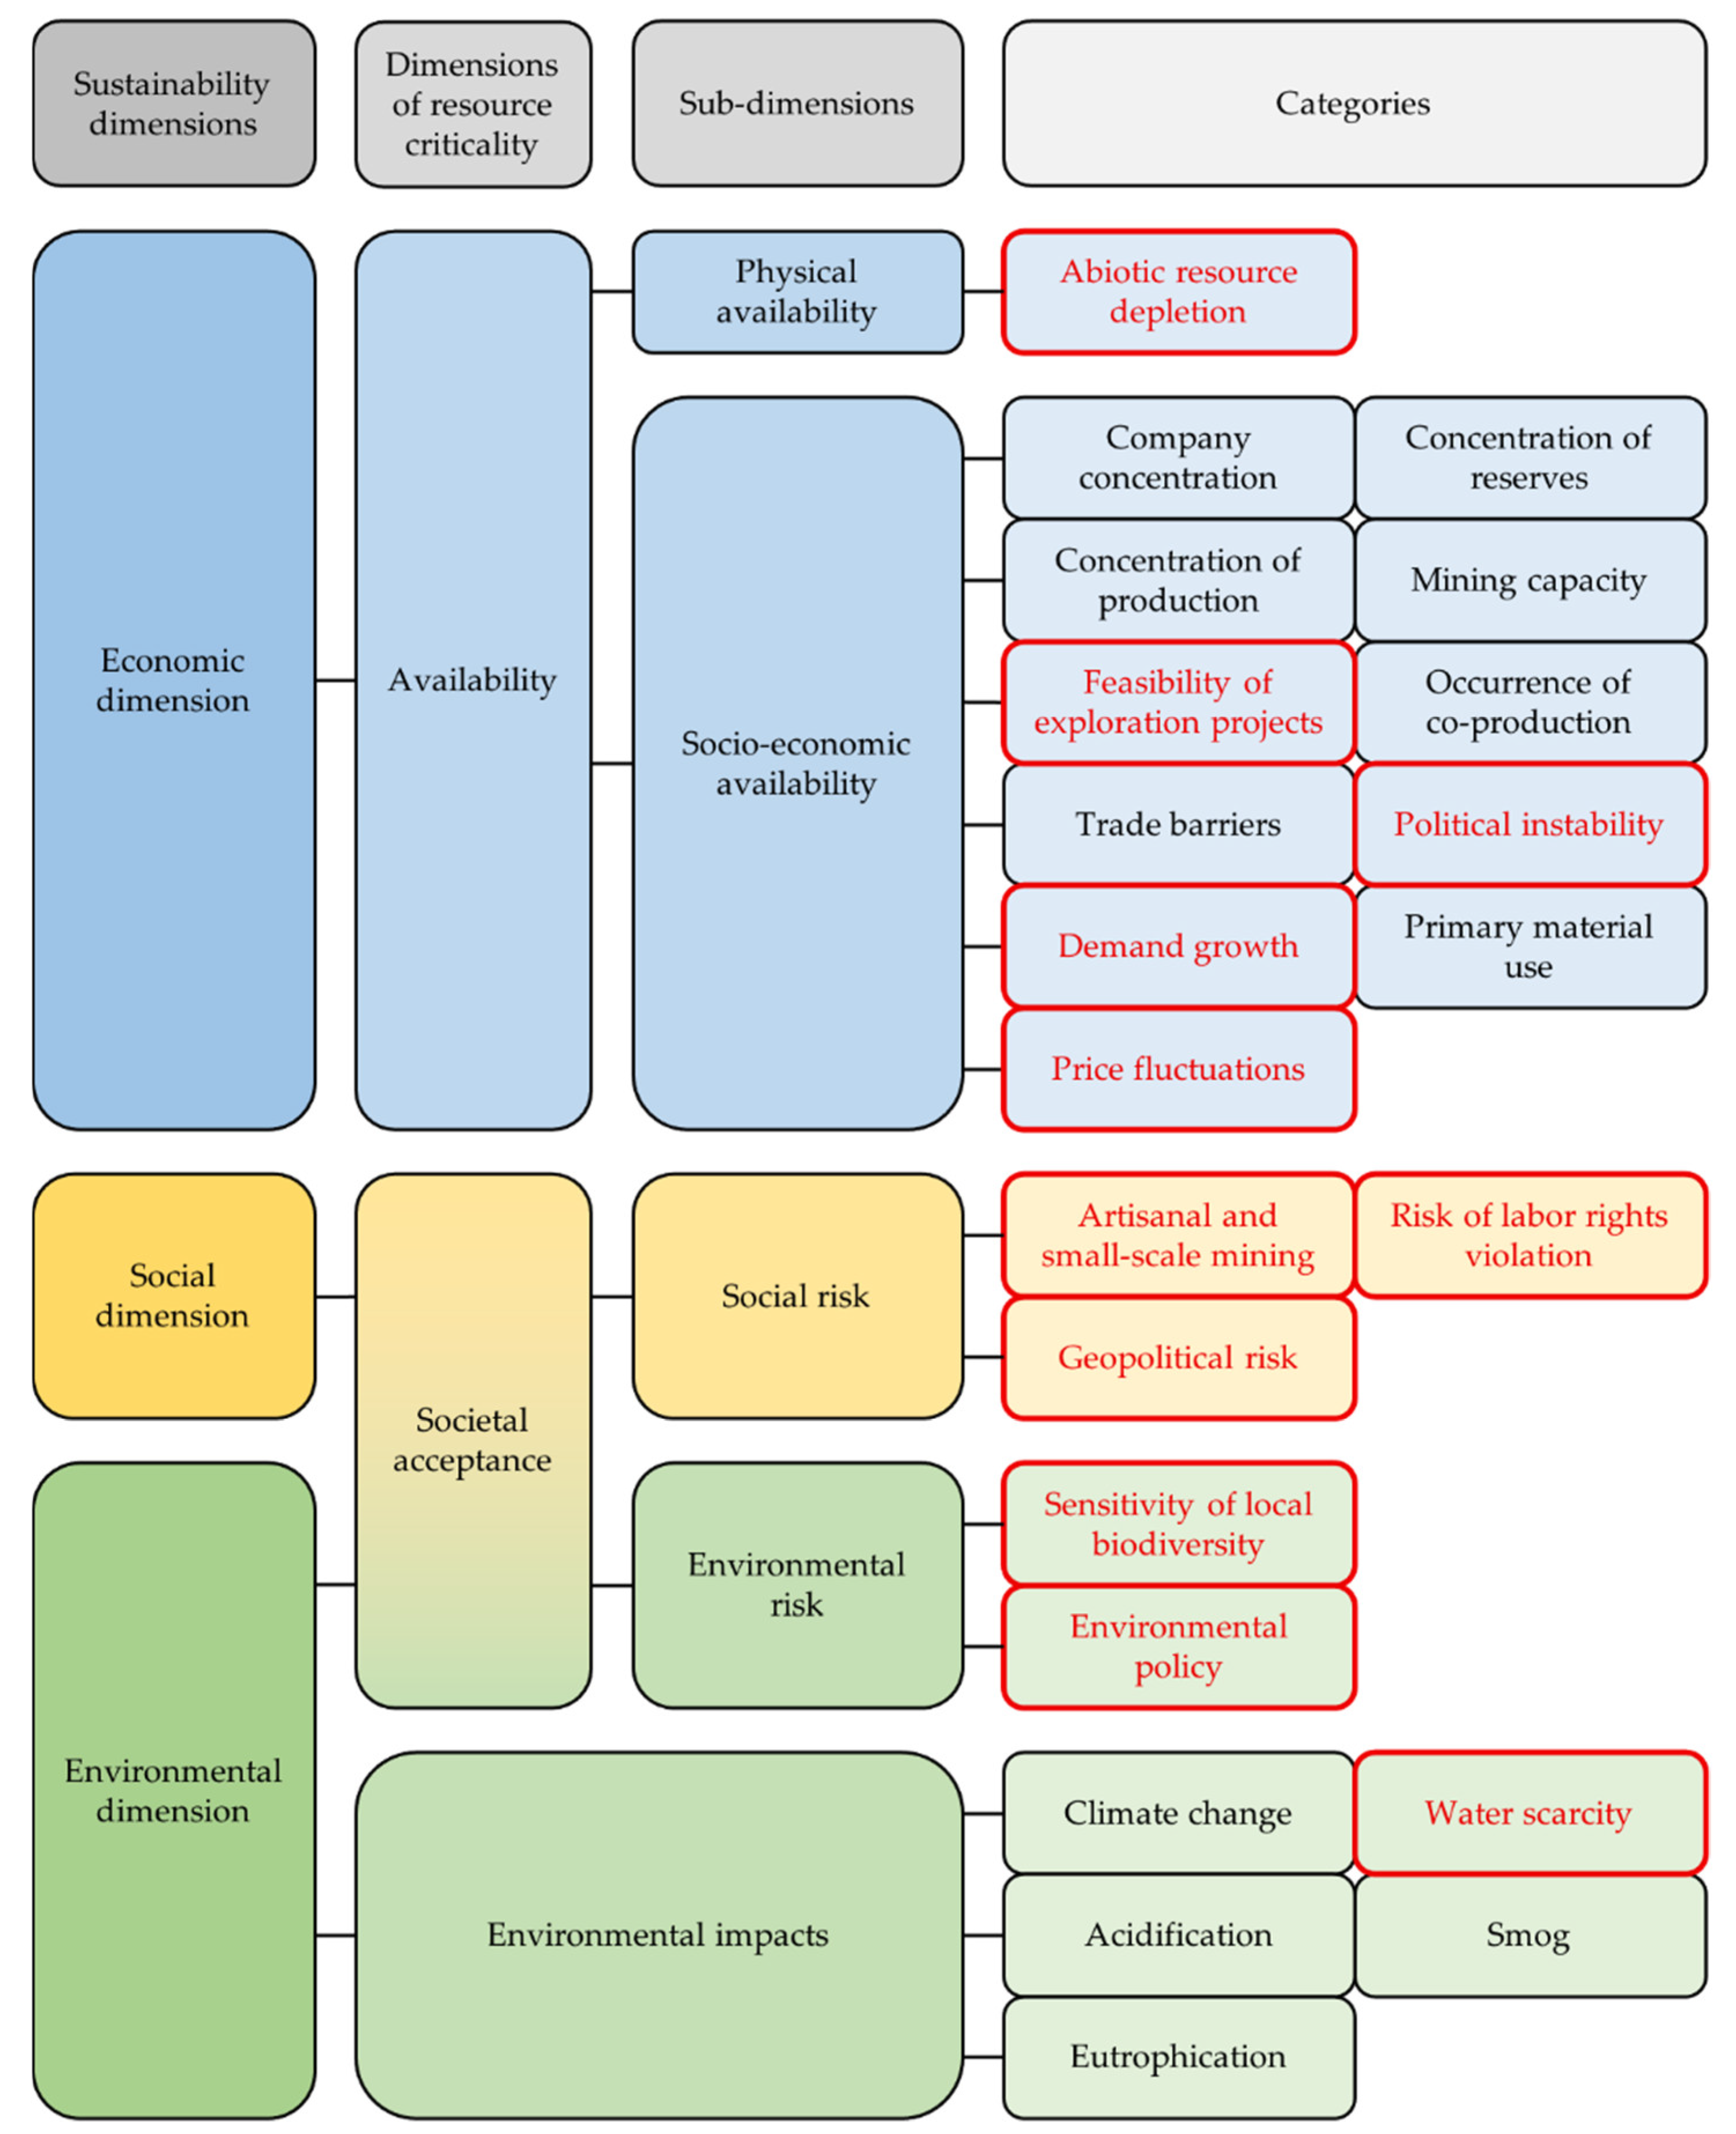
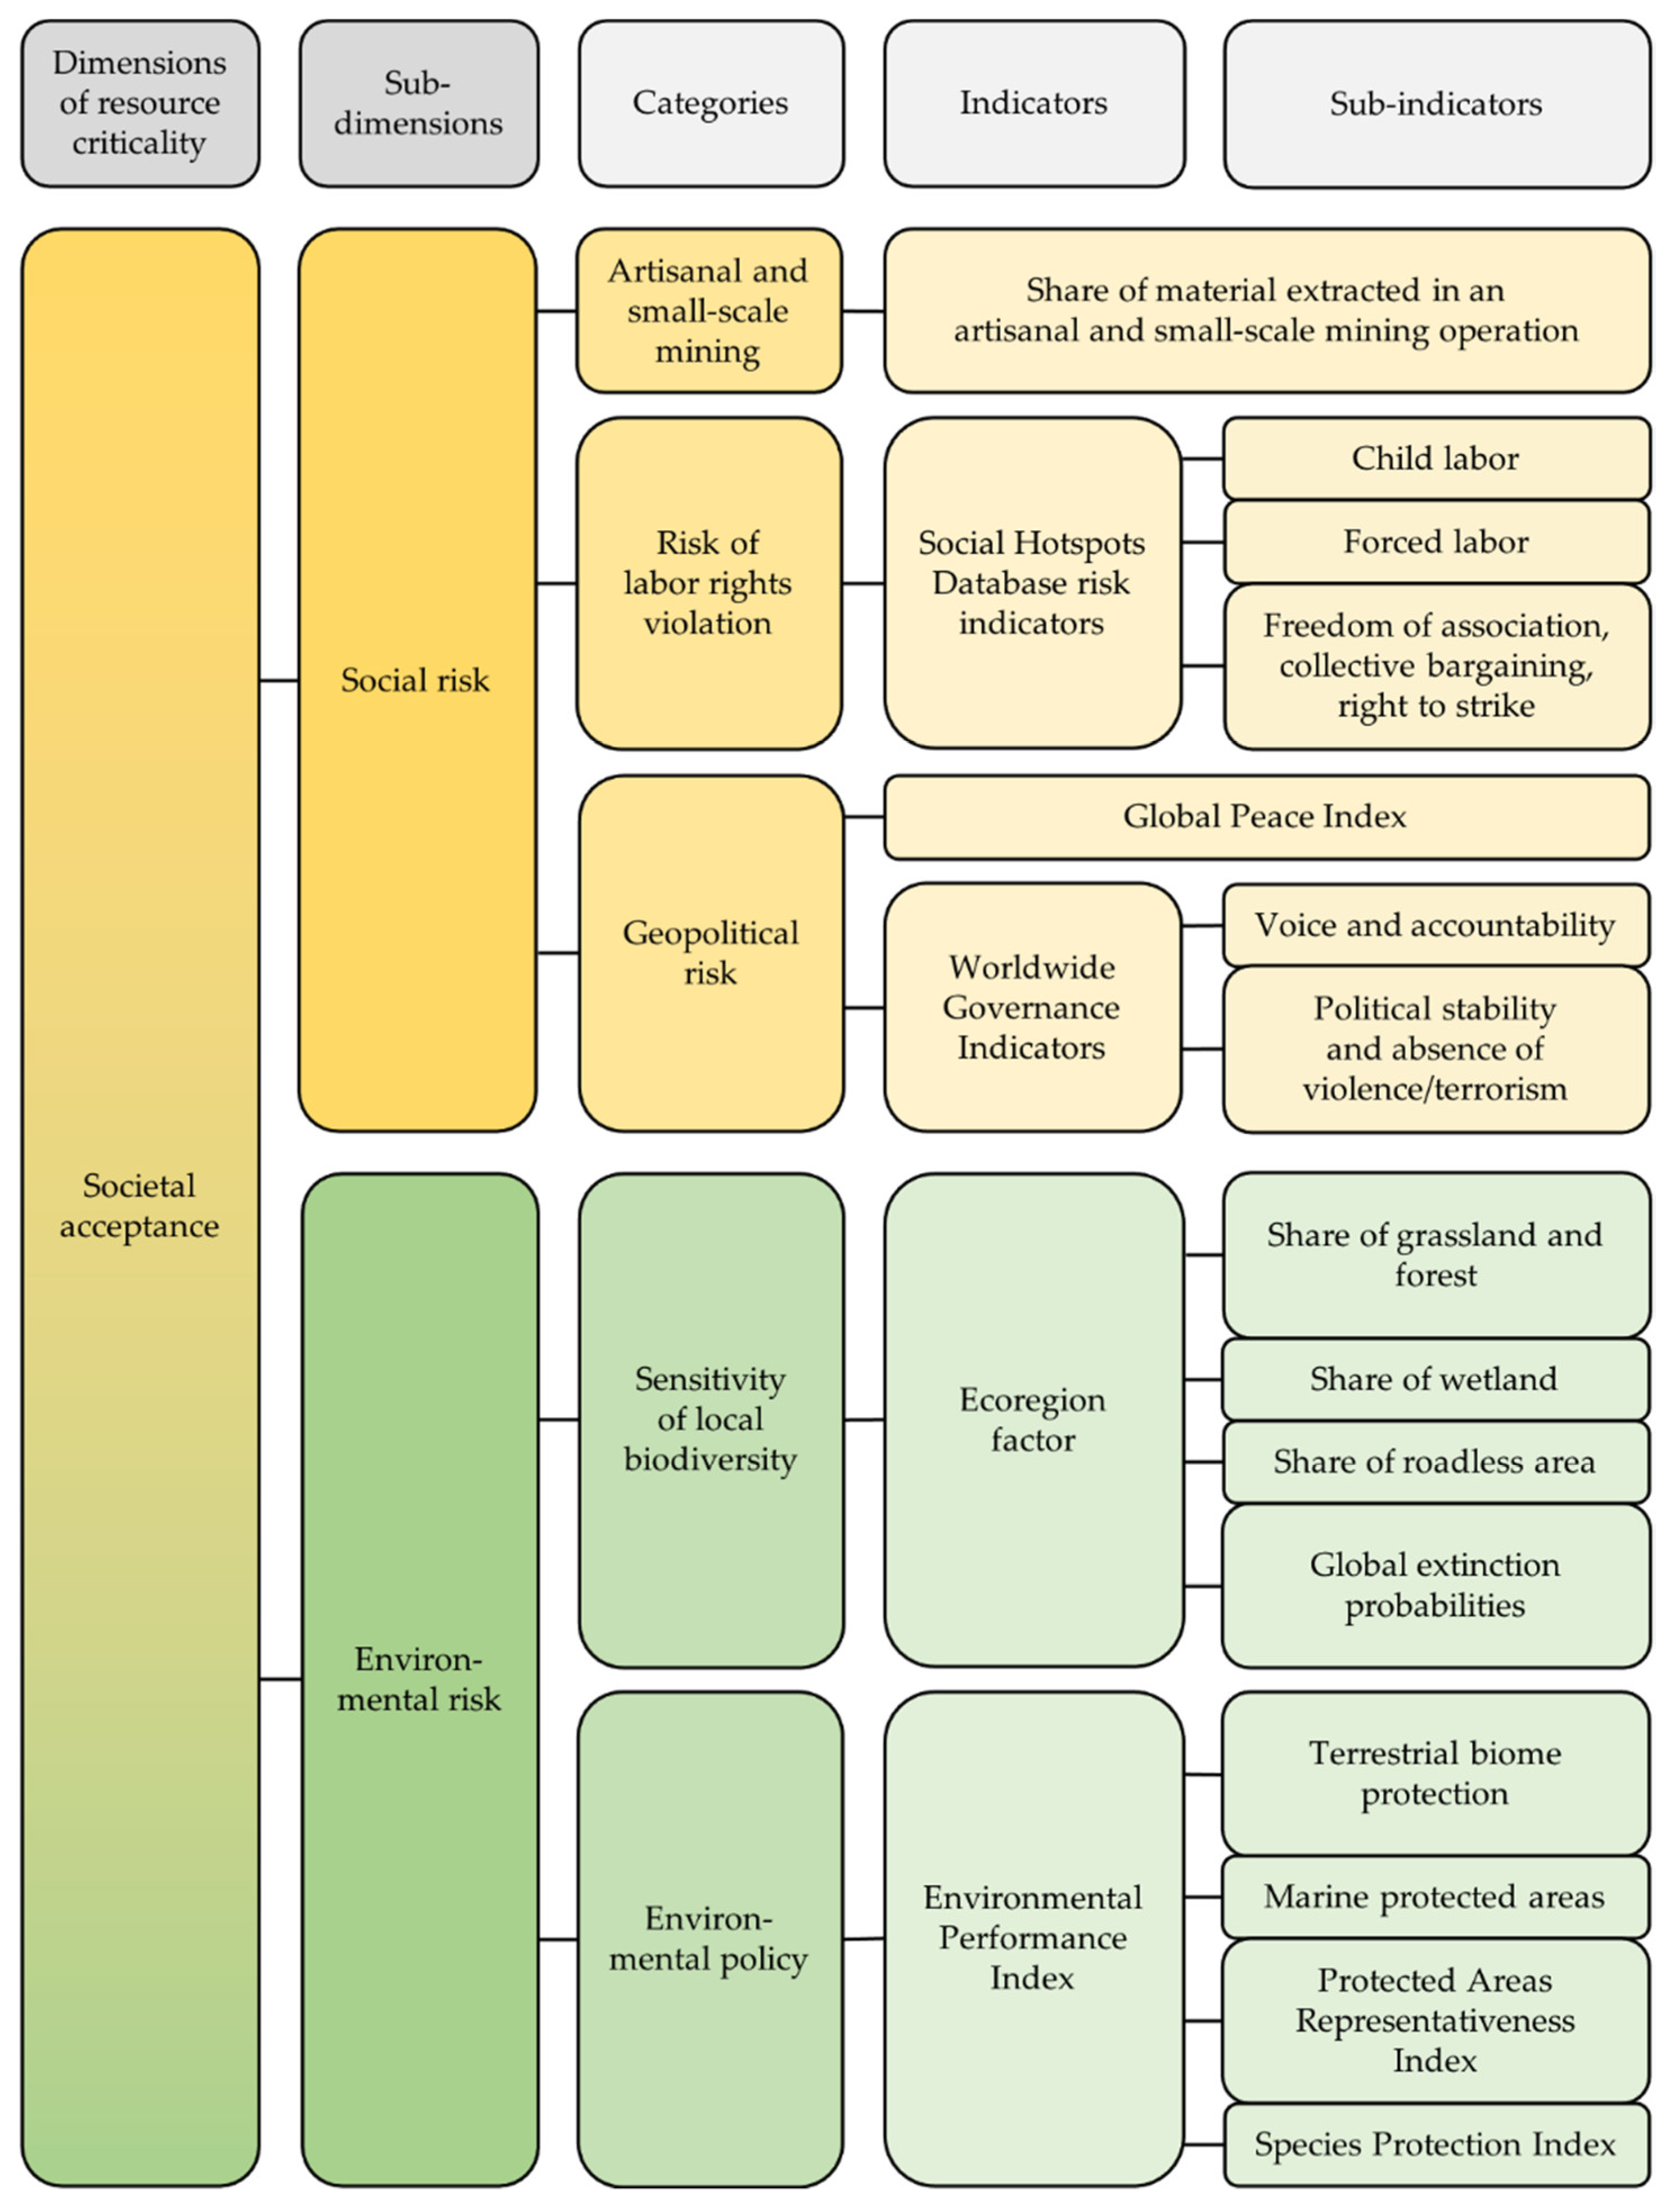
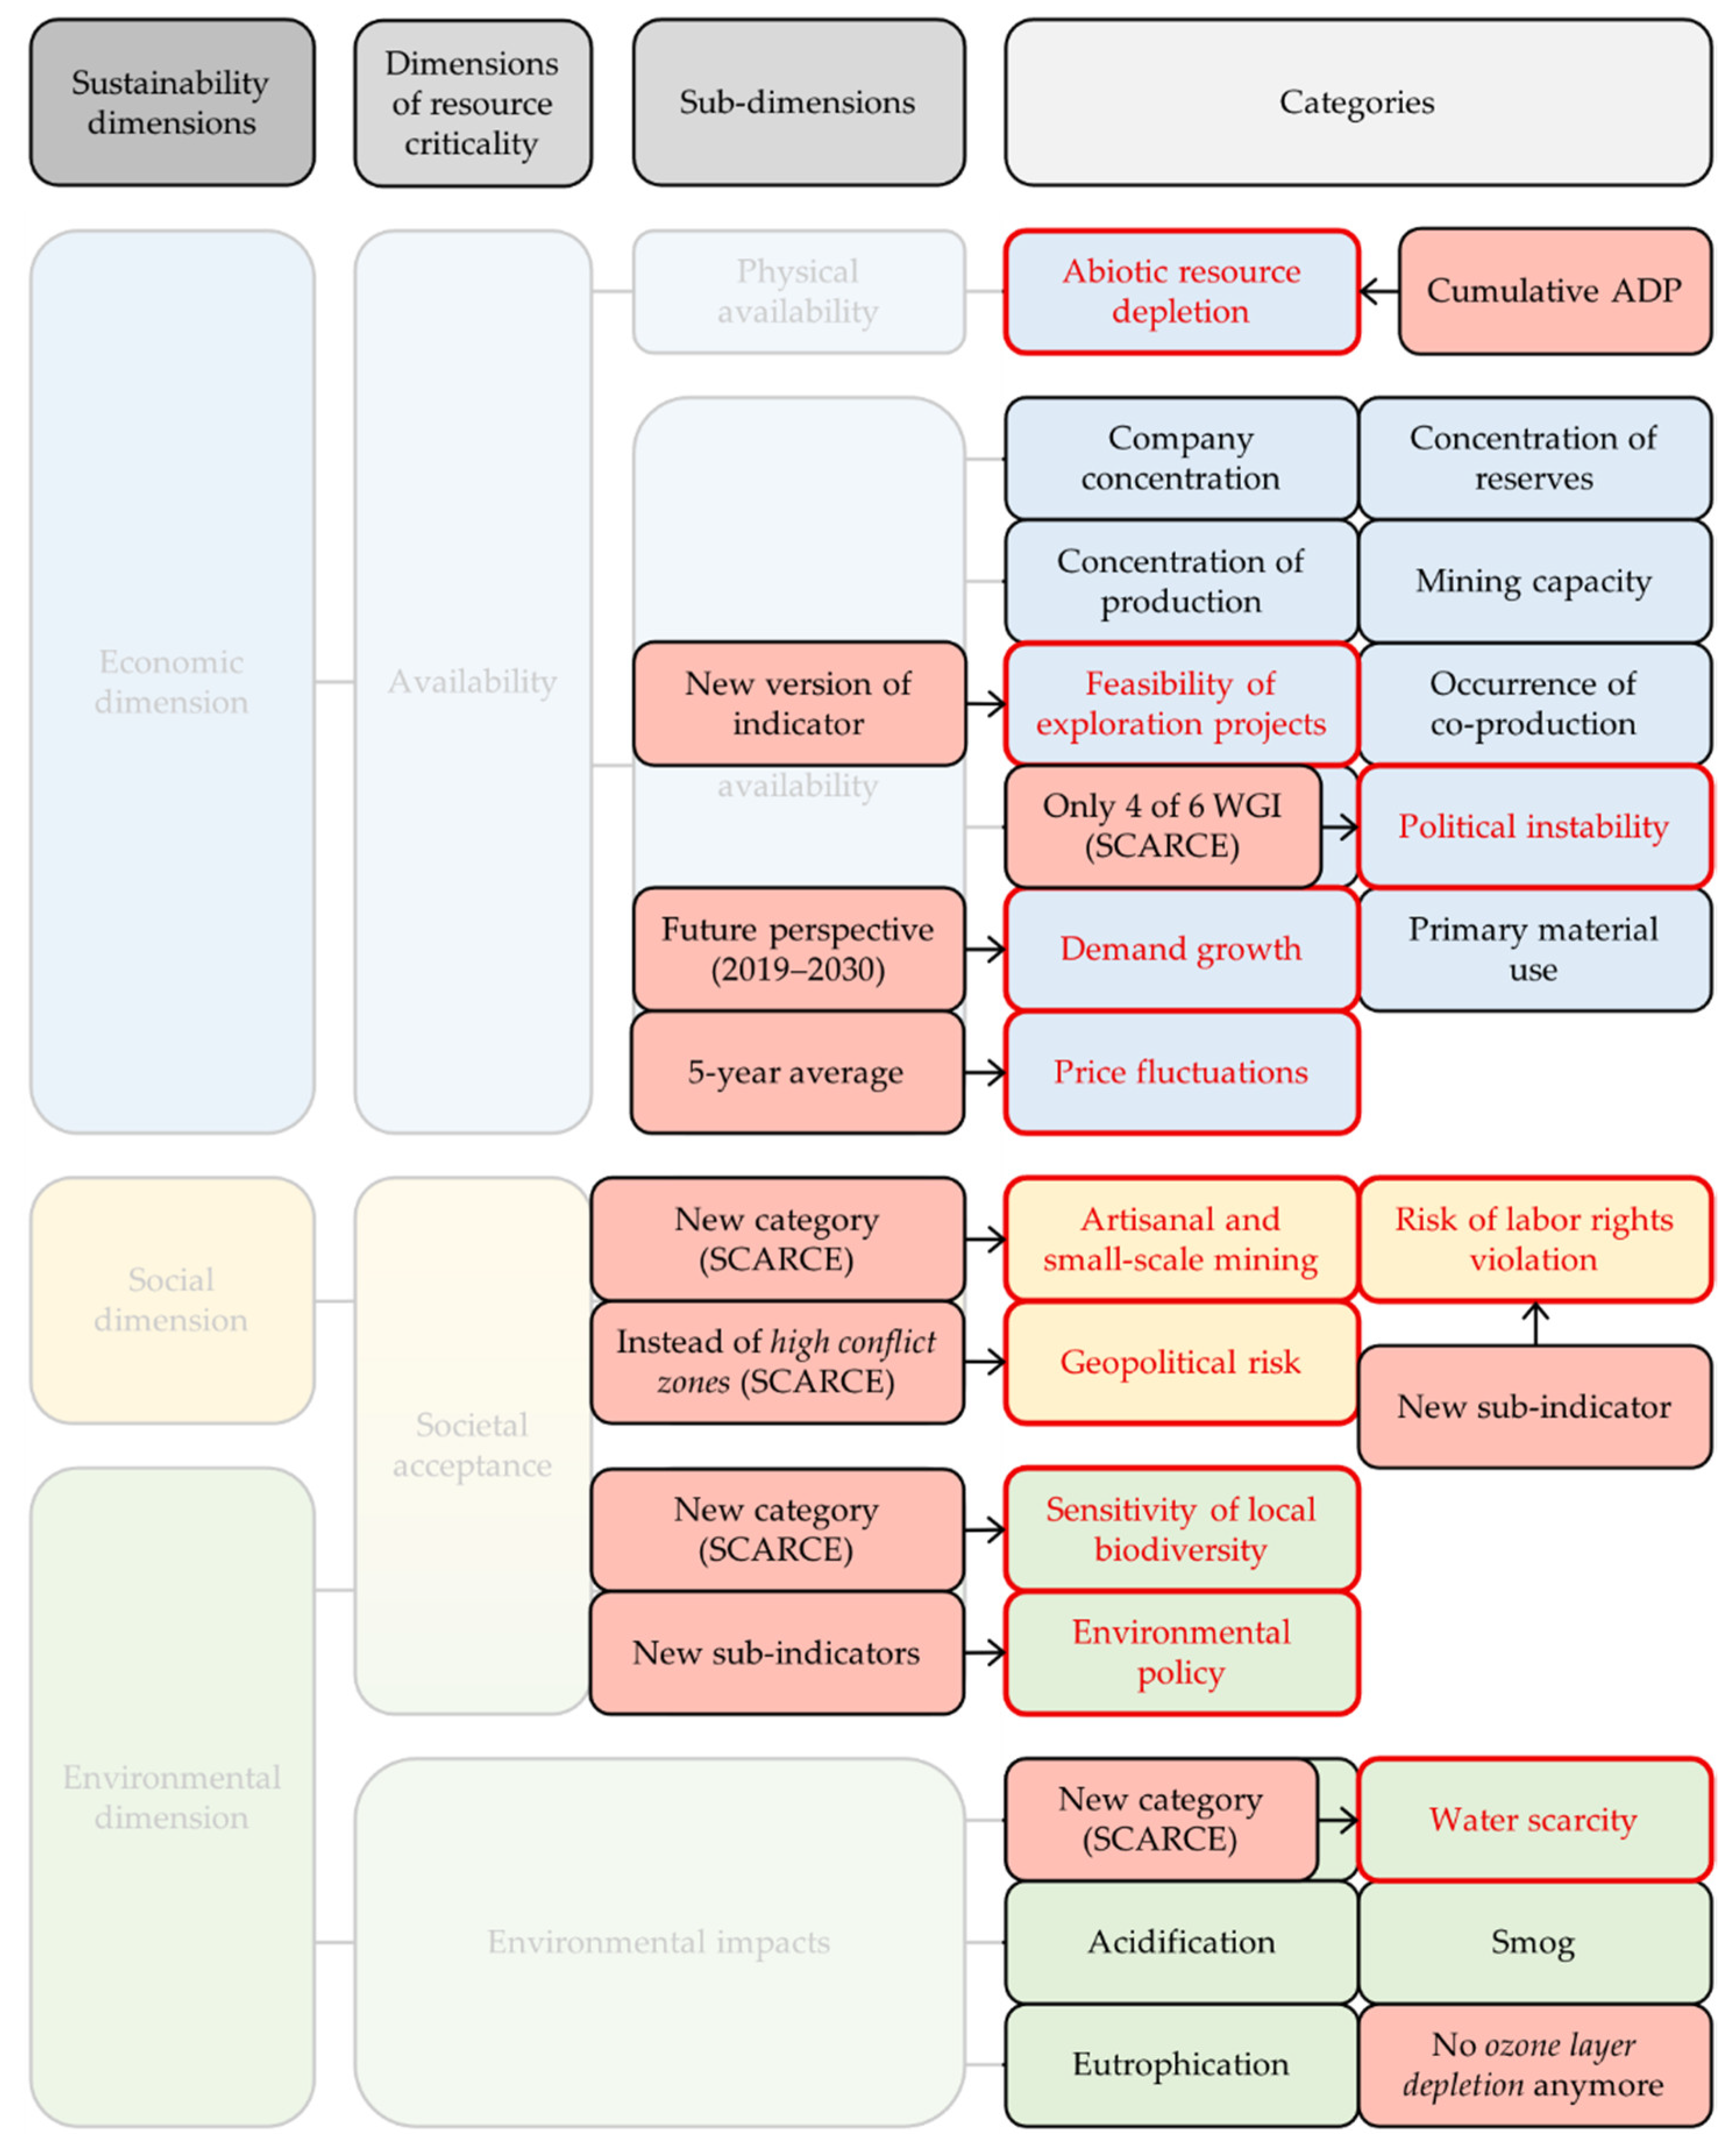
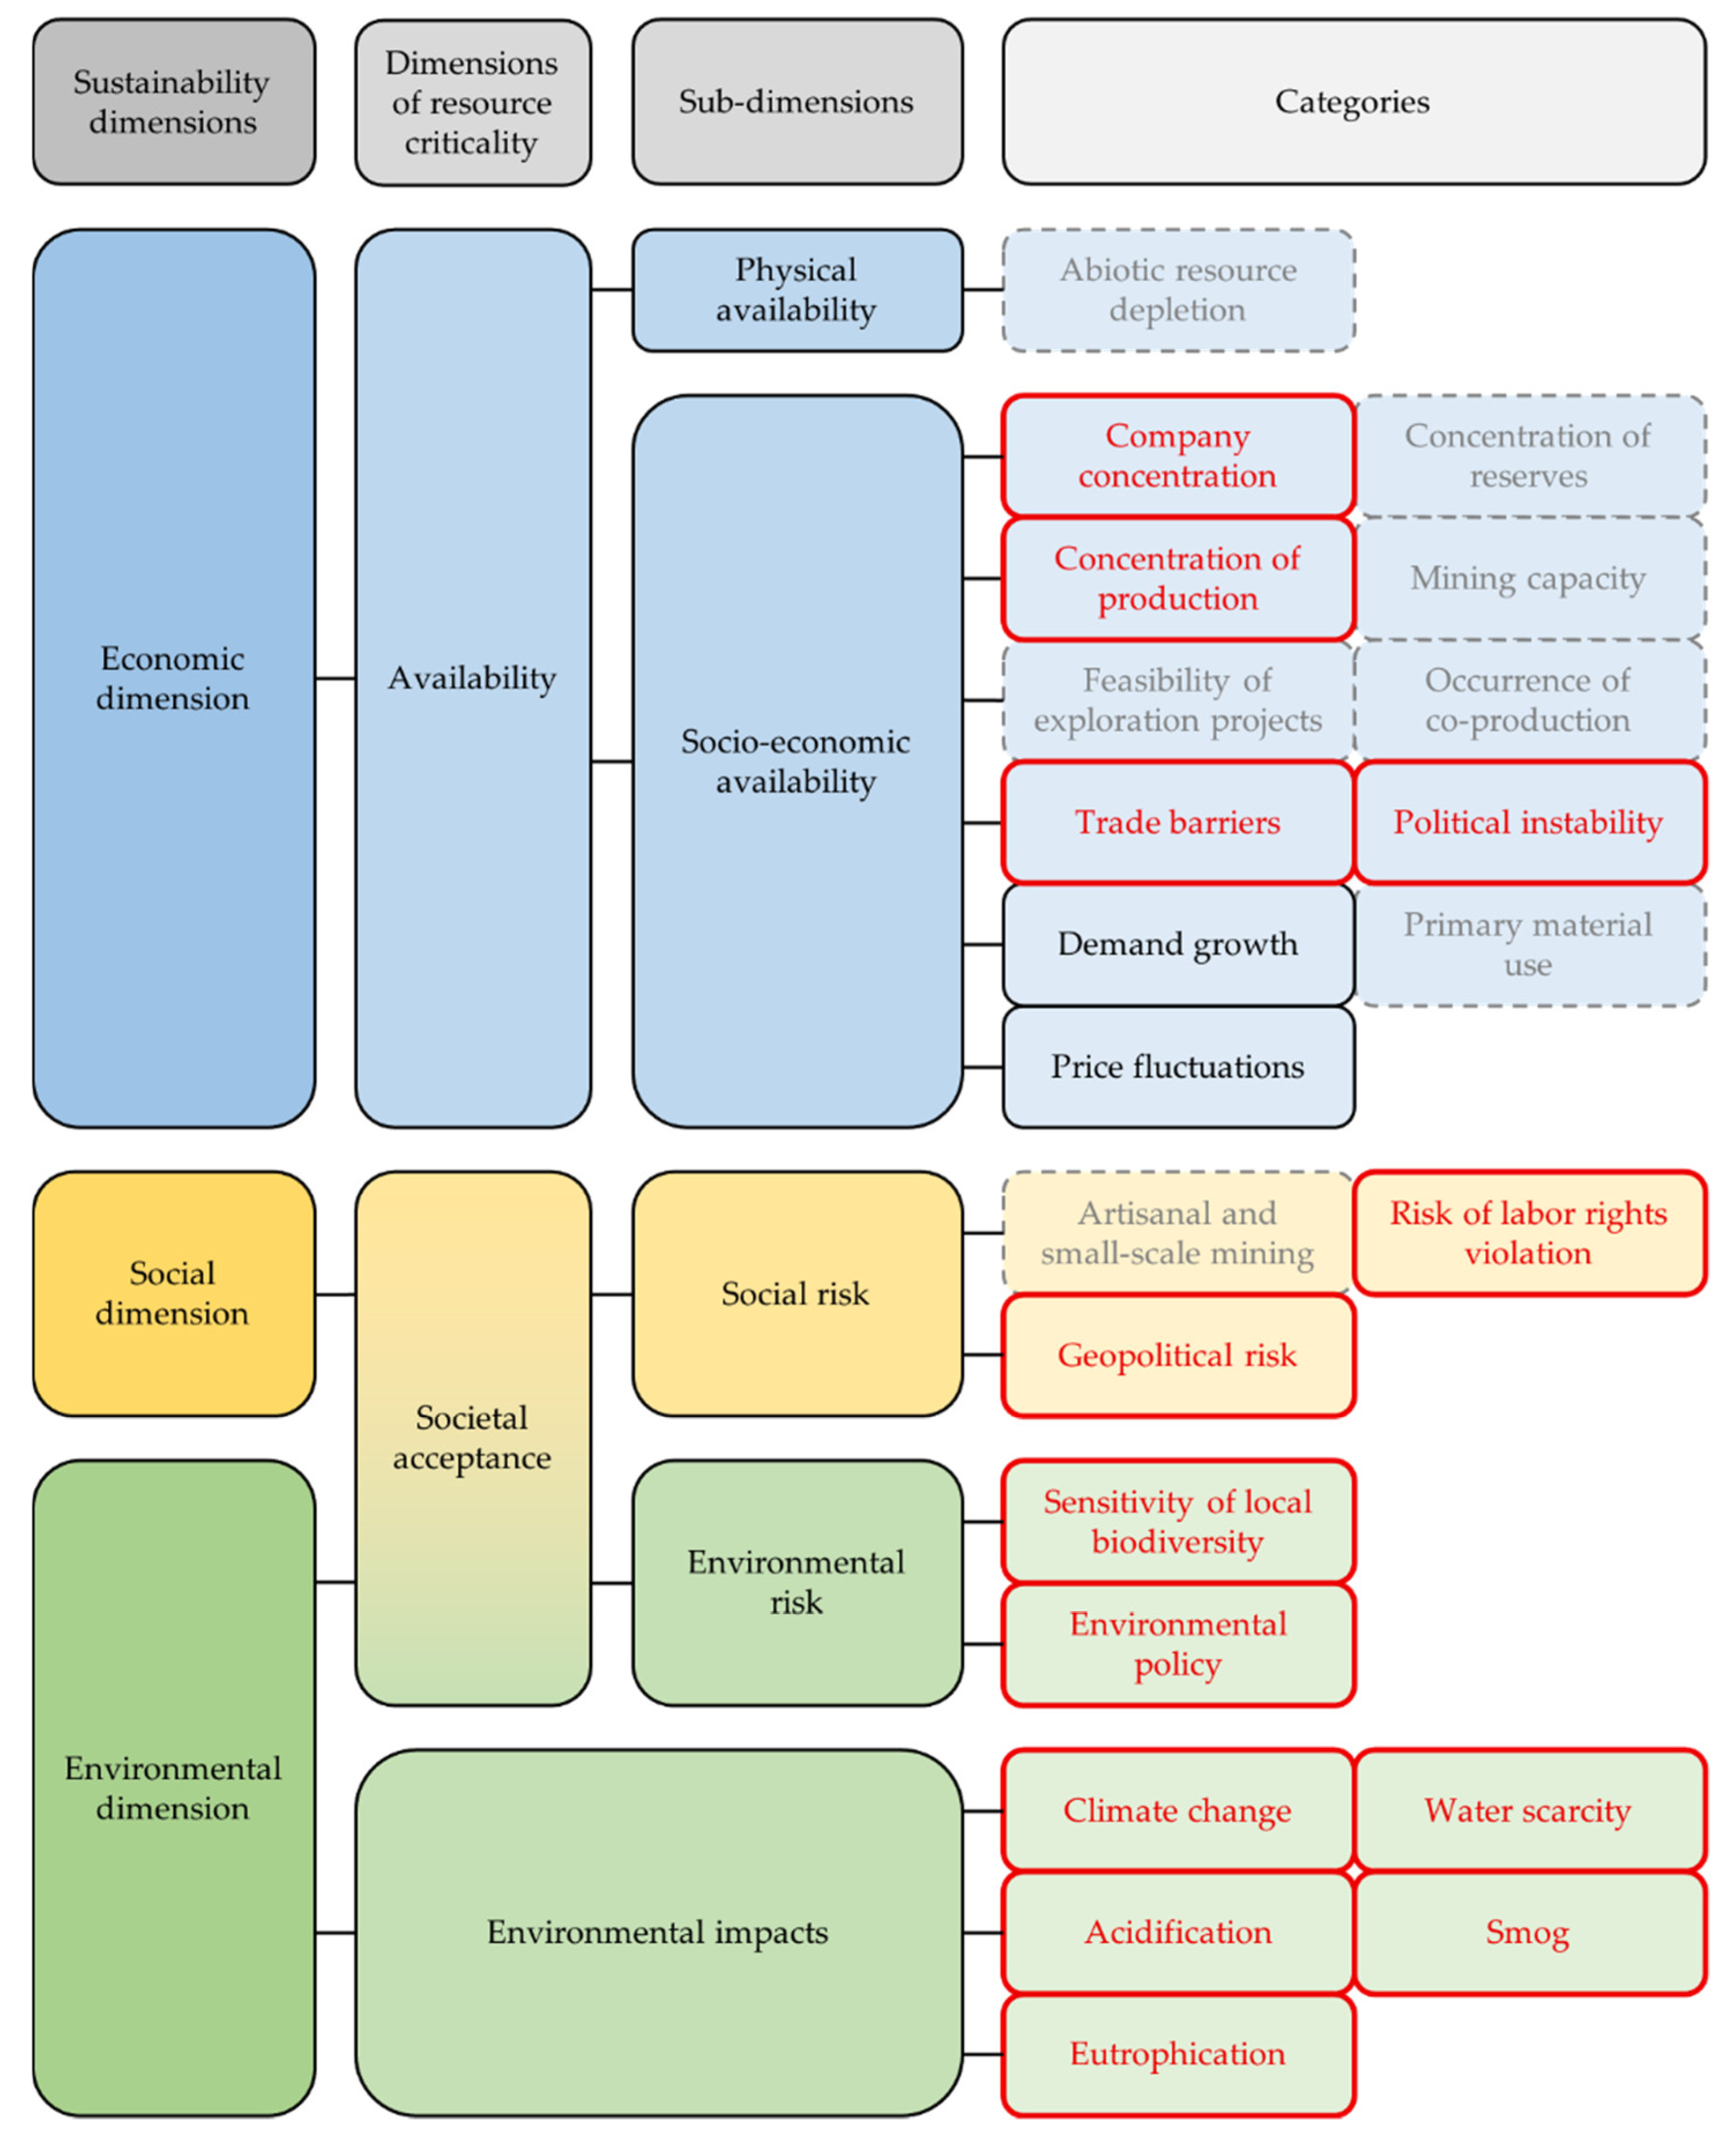
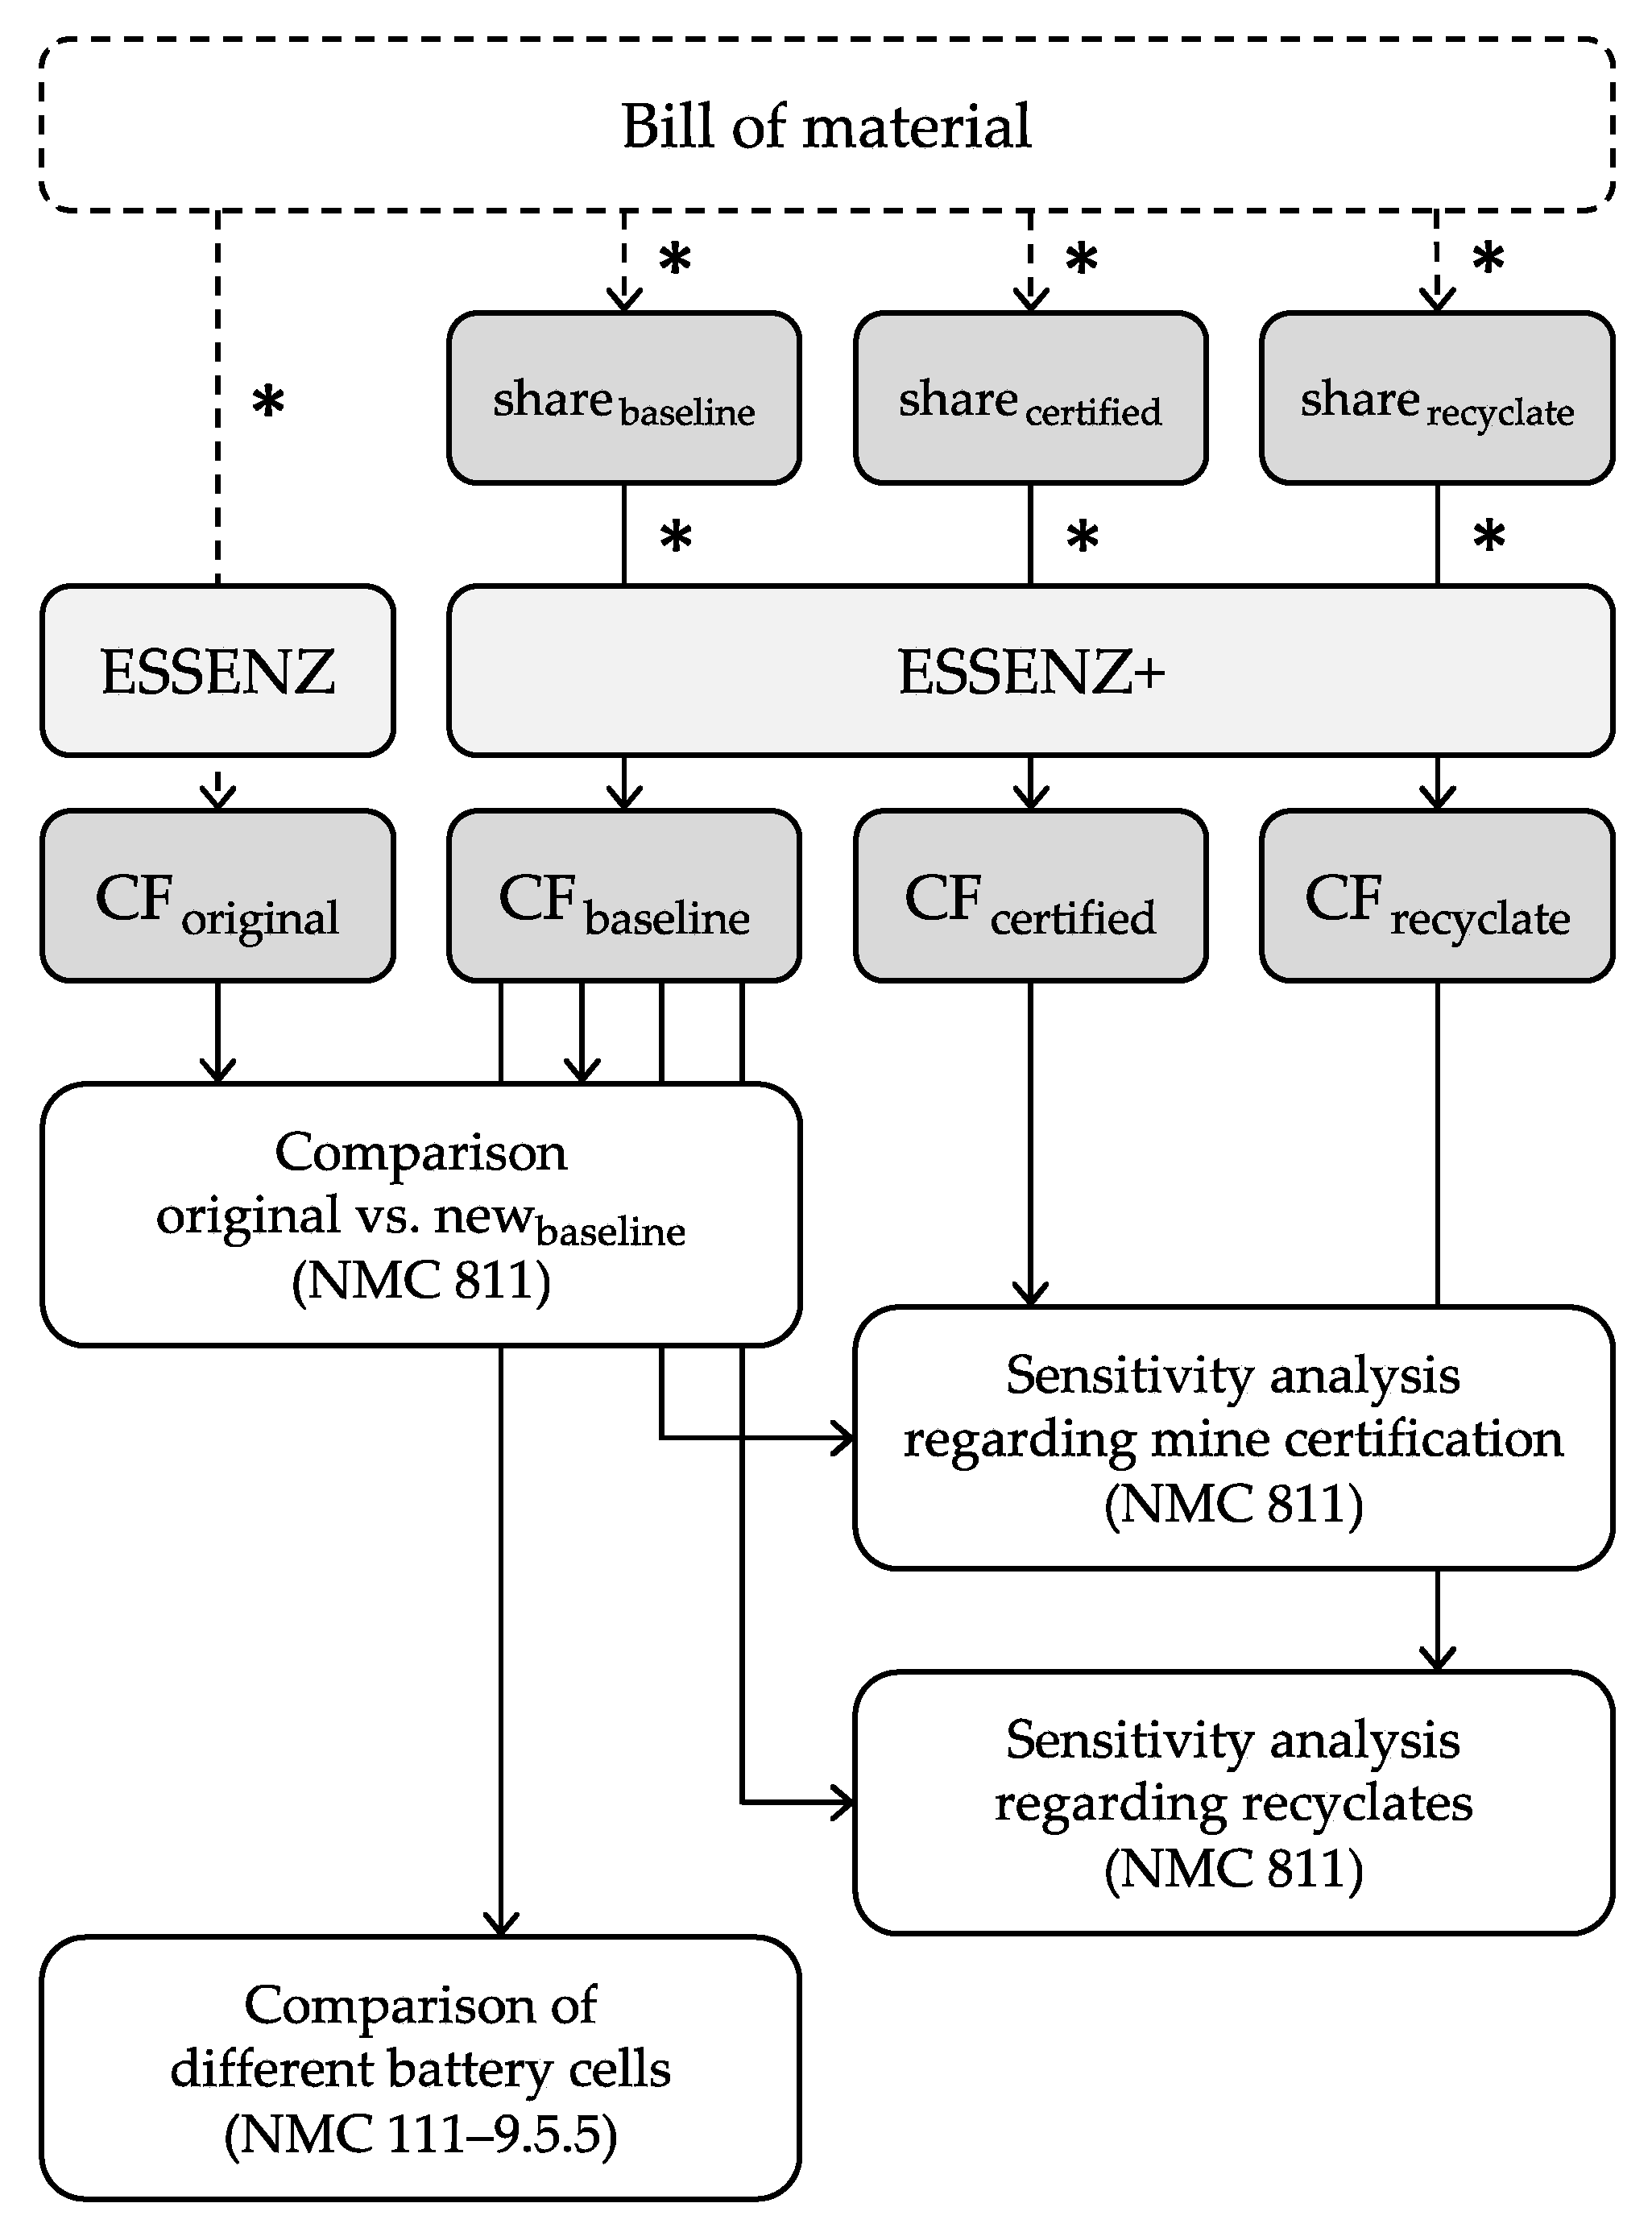
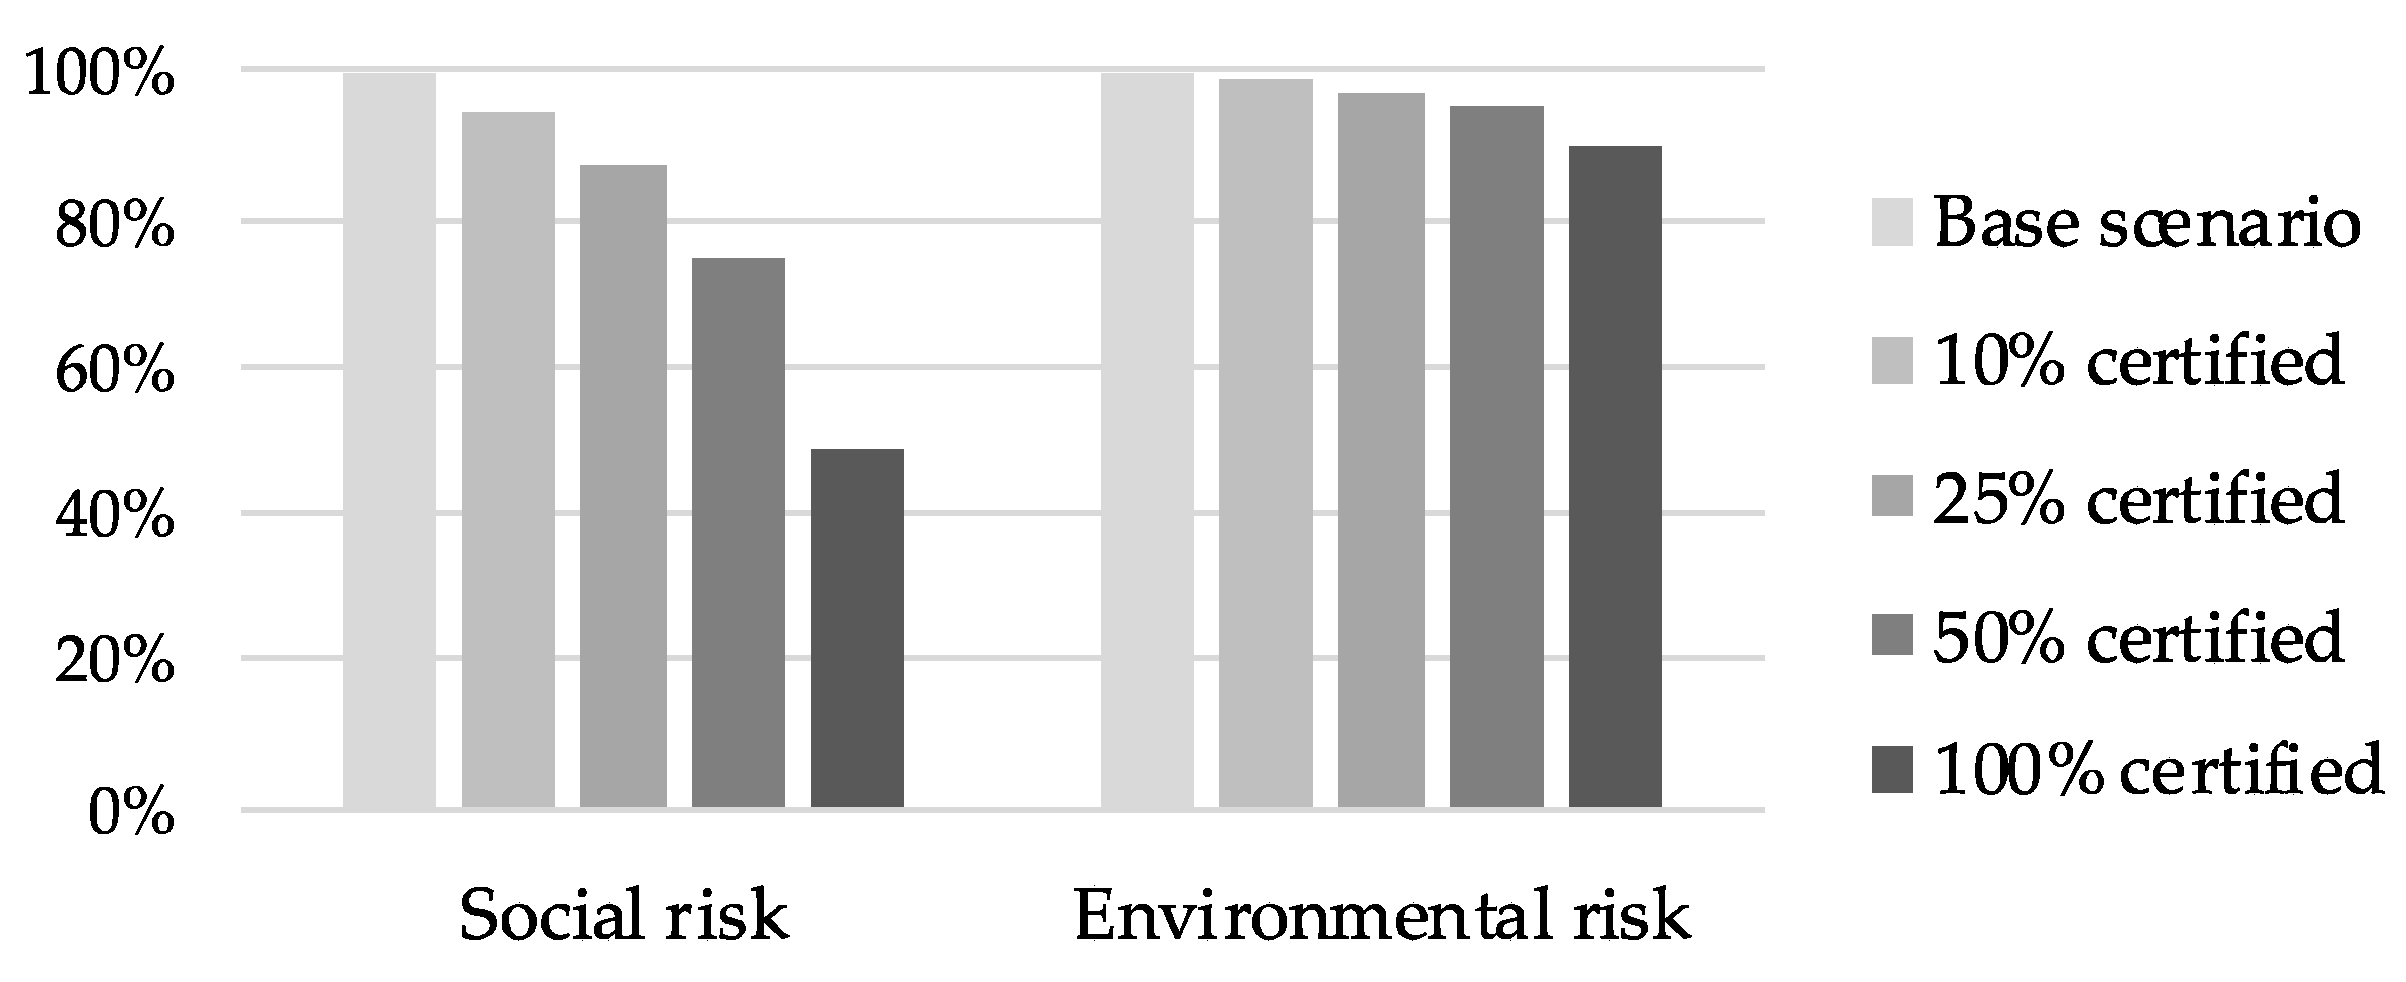
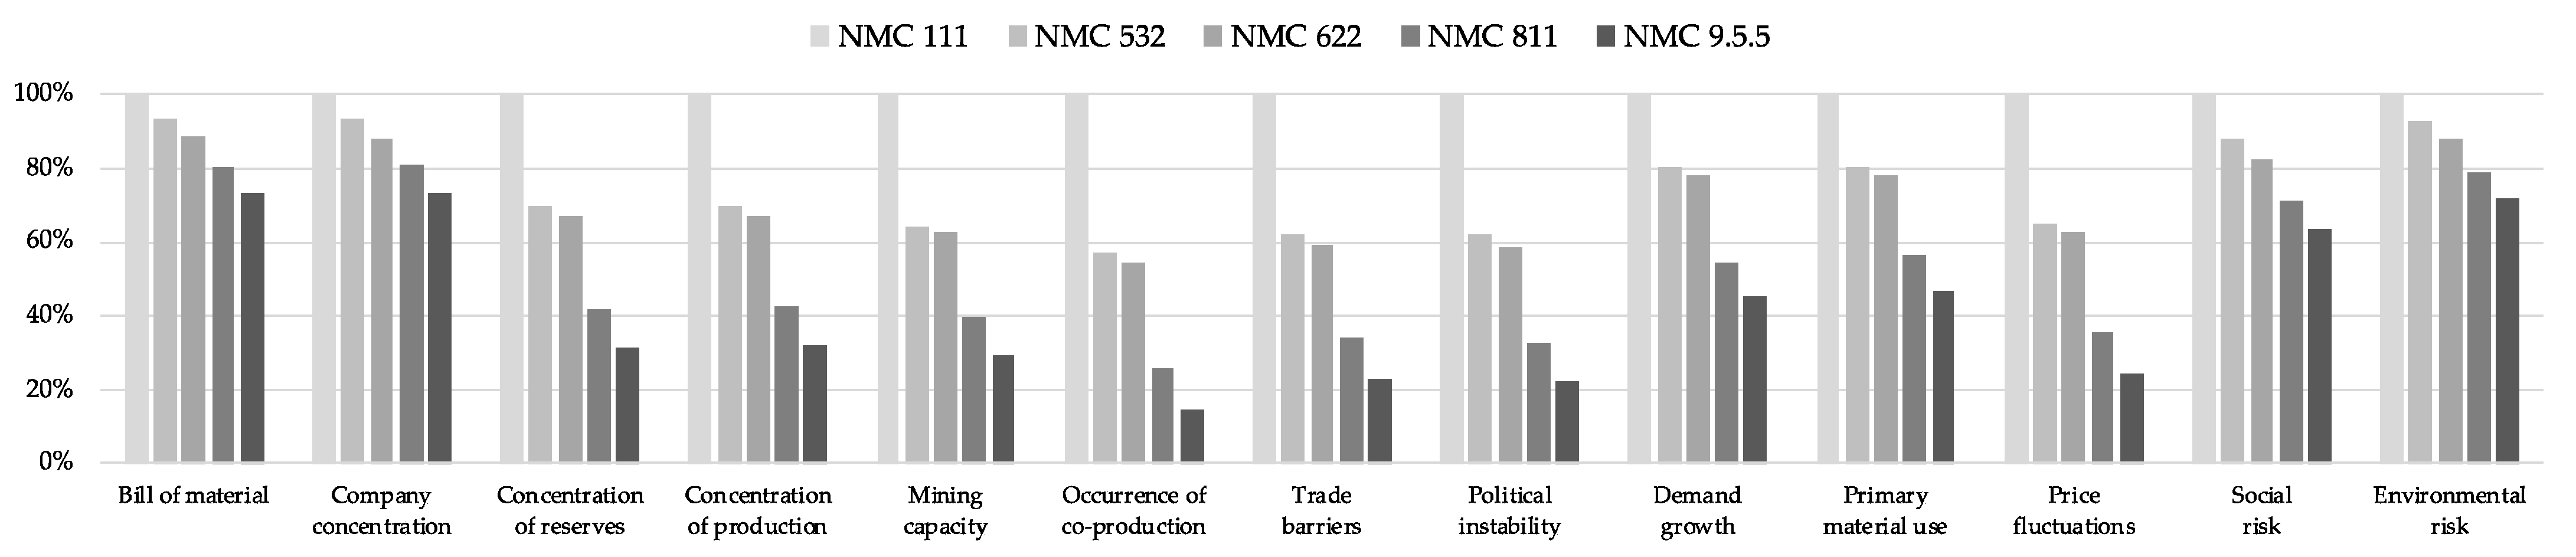
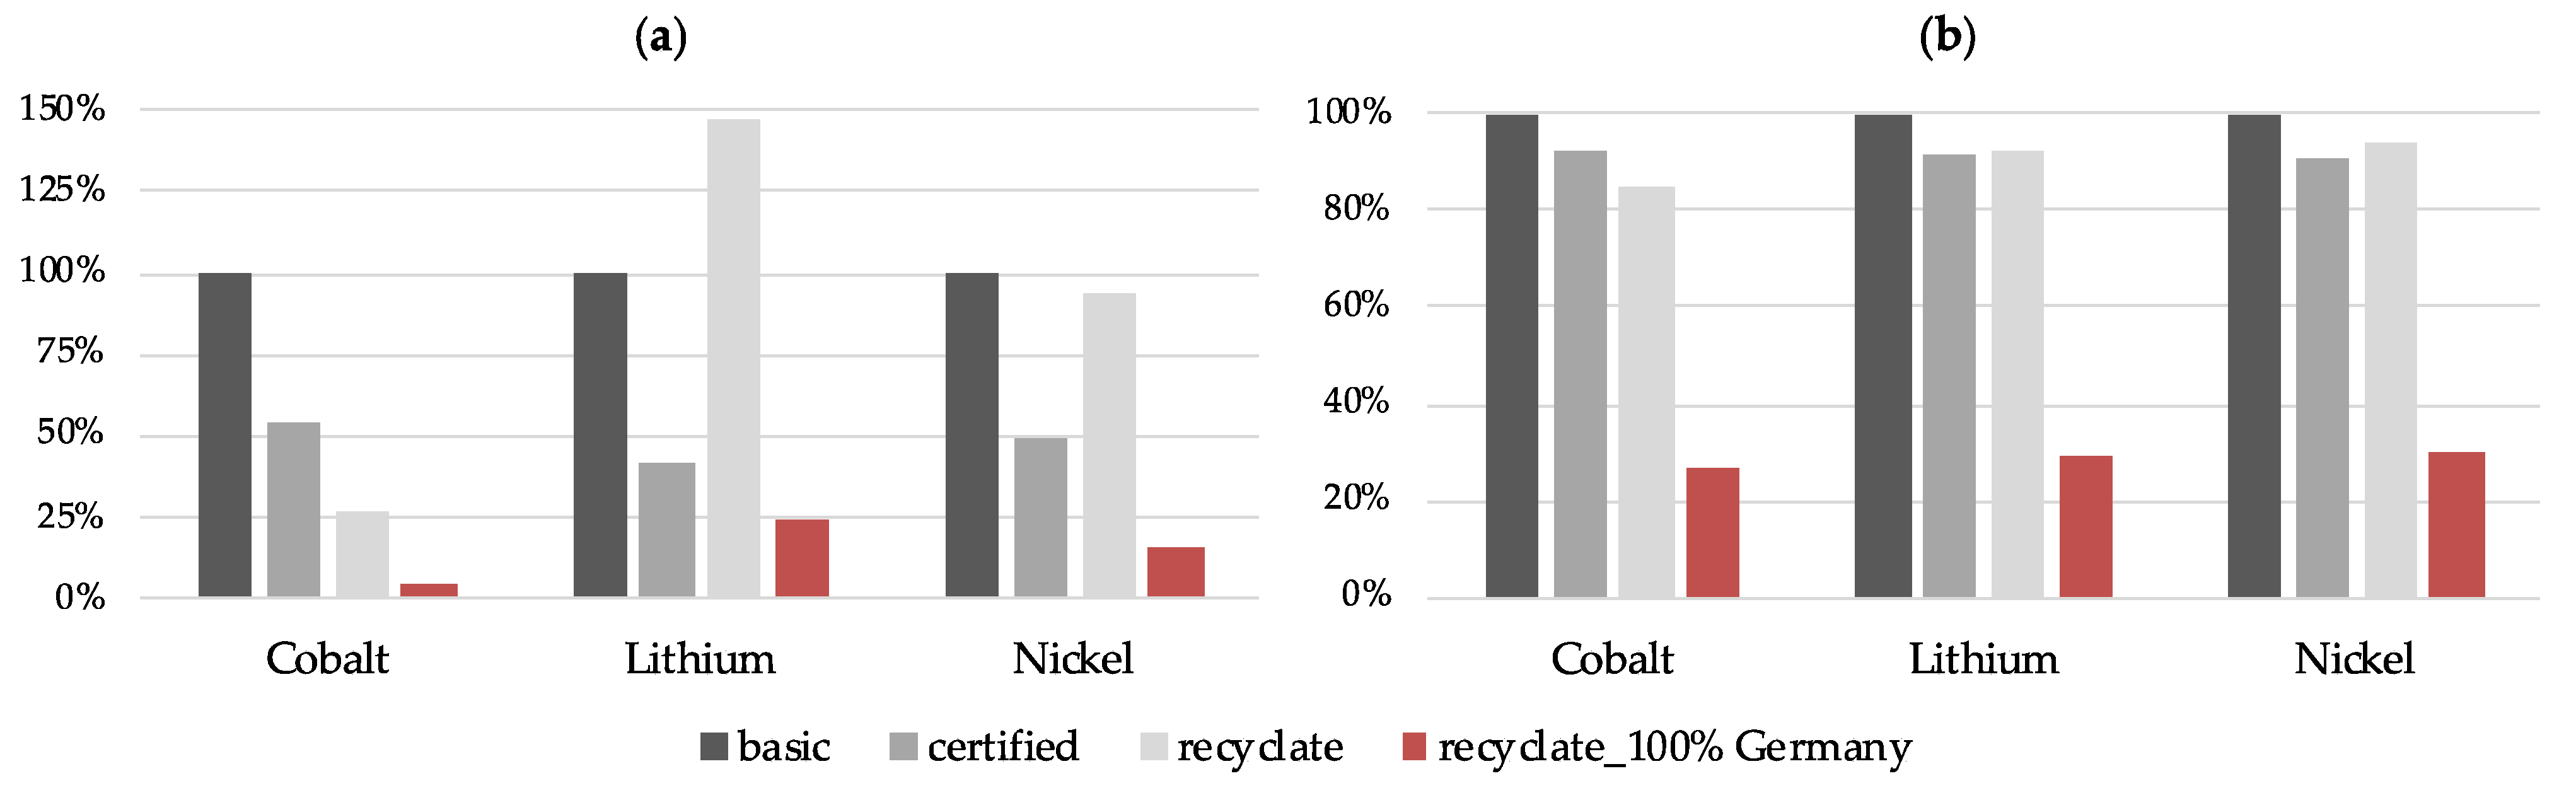
Table 1.
Overview of the feasibility of identified improvement potentials.
| # | Identified Improvement Potentials | Feasibility | Explanation |
|---|---|---|---|
| (1) | Societal acceptance categories | yes | Methodical adjustment of categories |
| (2) | Future trends in the demand growth | yes | Methodical adjustment of category |
| (3) | Recognition of mine site certification | yes | Methodical introduction in ESSENZ |
| (4) | Mine site specific assessment | only via (3) | Outside the scope of ESSENZ, but workaround via (3) |
| (5) | Assessment of secondary materials | yes | Methodical introduction in ESSENZ |
| (6) | Company-specific assessment | only via (3) and (5) | Outside the scope of ESSENZ 1, but workaround via (3) and (5) |
| (7) | Data update | yes | Only case-study-specific update of characterization factors |
| (8) | Set DtT results below one to zero | no 2 | Fundamental methodical adjustment to be dealt with in future work |
| (9) | Indicator uncertainties | no | Shortcoming not changeable |
1 A company-specific ESSENZ adaption exists [20], but it comprehensively modified the original method, so that this enhancement does not build upon it. 2 Minor improvement outlined in the Supplementary Material (see Section S1).
Table 2.
Evenly distributed quantitative risk levels.
| Qualitative Risk Level | Quantitative Value |
|---|---|
| no risk | 0.0 |
| low | 0.25 |
| medium | 0.5 |
| high | 0.75 |
| very high | 1.0 |
Table 3.
Influence of mine site certification on ESSENZ+ categories.
| Category | (Sub-)Indicator | Risk Multiplier |
|---|---|---|
| Artisanal and small-scale mining | Share of material extracted in an ASM operation | 0.5 |
| Risk of labor rights violation | Child labor | 0.25 |
| Forced labor | 0.25 | |
| Freedom of association, collective bargaining, right to strike | 0.5 | |
| Environmental policy | Environmental Performance Index | 0.75 |
Table 4.
Scenarios of the sensitivity analysis regarding certified mine sites.
| Scenario | Percentage of Raw Materials Coming from Certified Mine Sites [%] |
|---|---|
| 1 | 0 |
| 2 | 10 |
| 3 | 25 |
| 4 | 50 |
| 5 | 100 |
Publisher’s Note: MDPI stays neutral with regard to jurisdictional claims in published maps and institutional affiliations. |
© 2022 by the authors. Licensee MDPI, Basel, Switzerland. This article is an open access article distributed under the terms and conditions of the Creative Commons Attribution (CC BY) license (https://creativecommons.org/licenses/by/4.0/).
Share and Cite
MDPI and ACS Style
Pelzeter, J.; Bach, V.; Henßler, M.; Ruhland, K.; Finkbeiner, M. Enhancement of the ESSENZ Method and Application in a Case Study on Batteries. Resources 2022, 11, 52. https://0-doi-org.brum.beds.ac.uk/10.3390/resources11060052
AMA Style
Pelzeter J, Bach V, Henßler M, Ruhland K, Finkbeiner M. Enhancement of the ESSENZ Method and Application in a Case Study on Batteries. Resources. 2022; 11(6):52. https://0-doi-org.brum.beds.ac.uk/10.3390/resources11060052
Chicago/Turabian StylePelzeter, Julia, Vanessa Bach, Martin Henßler, Klaus Ruhland, and Matthias Finkbeiner. 2022. "Enhancement of the ESSENZ Method and Application in a Case Study on Batteries" Resources 11, no. 6: 52. https://0-doi-org.brum.beds.ac.uk/10.3390/resources11060052
Note that from the first issue of 2016, this journal uses article numbers instead of page numbers. See further details here.