1. Introduction
Tropical forests are known as the richest terrestrial ecosystems in the world in terms of flora and fauna as well as structural complexity [
1,
2]. These forests can be found inside watersheds, where both surface and groundwater emanate and drain into a common outlet. Watersheds are landscapes composed of a mix of local ecosystems and land uses covering a wide area. Currently, most watershed landscapes are being threatened by fragmentation, mainly caused by anthropogenic activities. As species are becoming extinct due to habitat destruction, the numerous ecosystem services (ES) being provided by these watersheds are being compromised at an alarming rate, which adversely affects both socio-ecological systems and human well-being. Ecosystems are indispensable sources of various goods and services needed by humans to survive, and keep natural processes intact [
3,
4].
To sustain the flow of ES, there is a need to address watershed fragmentation at the landscape level. Landscape fragmentation is defined as the breaking up of contiguous land use into several patches over time which affects the effective functioning of the ecosystem [
5,
6]. As deforestation happens, patches of original vegetation remain, modifying both biotic and abiotic elements of the environment [
7]. This process has been aggravated by continued expansion and encroachment of agriculture, cattle ranching, and illegal logging, converting the last remnants of tropical watersheds into isolated patches [
8,
9,
10,
11].
Studies estimate that the tropics has around 50 million forest fragments and that when summed up together will produce nearly 50 million kilometers of forest edges [
12]. Watershed landscape fragmentation is found to have substantially increased carbon emissions from tropical forests by 31%, and that Asia accounts for the second largest emission due to its topography and small-scale nature of fragments [
12].
Within the tropics are watershed landscapes composed of diverse and mosaic natural and human-modified ecosystems. As the components of the watershed landscape are interconnected, a change in the flow of ES upstream will have direct or indirect impacts to midstream and downstream areas [
13]. A change in land use due to human activities usually results to fragmentation of natural habitat that affects the capacity of the watershed to provide certain ES [
4]. Thus, understanding historical land use patterns can explain current and future conditions of the ES in a given watershed [
14].
While there has been an increase in the number of research studies investigating the link between fragmentation and ES in recent years [
4], current studies that examine the role of historical land use in shaping the current condition of the watershed are limited in the ES literature [
14]. Historical land use has an important role in influencing the current structure and function of the environment that affects its capacity to produce ES [
14,
15] and has a considerable effect in the way local people view and manage their resources.
Historical land use can characterize the relationship between populations and the ecosystem that they inhabit in a given time period [
16,
17], and can determine the driving forces of land cover change [
3]. Thus, understanding the drivers of land cover change in the past can therefore explain the differences in land use practices of people, which can be established by using local and scientific knowledge.
This paper therefore assesses the link between watershed landscape fragmentation and ES by comparing scientific data and local knowledge of people interacting with their environment. Examining the case of the Baroro River Watershed in Northern Philippines, the paper argues that local knowledge is a powerful medium through which watershed landscape fragmentation and the declining quality of ES can be better explained and addressed. Currently, majority of the 143 watersheds supporting the national irrigation system in the Philippines are affected by declining forest cover [
18]. Changes in the landscape are due to ballooning population, unsustainable land use practices, and lack of coordinated governance efforts resulting to loss of biodiversity and continuing poverty. Such conditions prompted the conduct of this timely and relevant study.
As knowledge of local people differ based on their cultural background, geographical location, life experiences and land practices, this study selected communities to represent the entire cross-section of the Baroro River Watershed (upstream, midstream, and downstream). This method of analysis aims to capture differences in levels of local knowledge and appreciation of ES.
Aside from the standard historical land use/land cover (LULC) change analysis, this study is the first scientific attempt to quantify the extent of watershed landscape fragmentation using established landscape ecology metrics at different time periods. Official LULC maps were used, except for the 1940s as satellite images were not yet available at that time. In addition, this is the only fragmentation study done in the Philippines, both at national or local levels, which relates to ES. Results of this study are expected to contribute to the buildup of knowledge relevant in designing future plans and interventions on watershed and habitat management.
2. Landscape Fragmentation in the Philippines: A Historical Perspective
In the 1600s, Philippine forests constituted around 90% of the total land area of the country [
19]. At that time, lands were traditionally owned and managed by the indigenous people who practiced swidden farming for survival. Under the Spanish regime in the 1880s, trees were cut and used in the construction of ships for the galleon trade. This practice reduced the forest cover to around 70% at the beginning of the 20th century [
20].
Table 1 shows data on land use changes in the Philippines from 1880 to 1980.
During the Post-World War II era, Philippine forests were given importance due to the value and contribution of its timber to economic development [
25]. Large-scale logging peaked in the 1970s that resulted in high deforestation rate, said to be among the fastest in the world [
26]. With the opening up of a significant portion of the forests in the watershed areas, migrants started to come in and occupied the logged-over areas. Migration in the country was mainly driven by landlessness and lack of employment opportunities in the lowland. As a result, more mid- and upland watershed areas were planted with agricultural crops such as rice, leading to increased fragmentation [
19]. Up till now, people are living in the uplands and contribute to changes in the watershed landscape.
Given its history of large-scale timber extraction, the forest cover in the Philippines is now at about 26% of its original state [
27]. This is a clear indication that forests and watersheds are the main casualties of economic development and population growth throughout the centuries. What remains of the natural tree vegetation in the country is confined in the upper elevation of the watershed landscape, with scattered distribution in the mid- and lowlands. This historical perspective on land use change from the early 17th century to the present is significant in the study of watershed landscape fragmentation in the Philippines as it explains why the conversion of watersheds into different land uses led to the breaking up of watershed landscape into numerous patches.
3. Watershed Landscape Fragmentation and Ecosystem Services
Changes in the watershed landscape are brought about by natural disturbances and human activities. As the world population grows over time, supporting people’s needs is critical for survival. This eventually led to the opening up of tropical forests for extractive industries, food production, and settlements resulting to watershed landscape fragmentation. A study of Gibbs et al. [
9] revealed that more than half of the new agricultural lands in the tropics encroached on intact forests, while an additional 28% are estimated to open up secondary forests [
11]. Hence, fragmentation and land-use intensification are integrally intertwined [
28].
Combined with climate change, landscape fragmentation may have deleterious consequences to a wide range of ES [
29]. It weakens the health of the ecosystem by increasing the edge to interior ratio and reducing the core of the forests to the point of endangering the survival of species. A recent study estimates that more than 70% of the world’s forests are now within one kilometer of an edge usually in close proximity to human modified areas [
30].
The disruption caused by fragmentation can have devastating effects to flora and fauna that cannot adjust to the level of sunlight, rain, noise, and pollution at the edge of these fragments [
31]. Some species that require large contiguous area for habitat can be permanently lost as fragmentation reduces the ability of these species to move across landscapes, interrupting its foraging and breeding activities [
32]. Large predators are usually absent in fragmented landscape that can result in food-web cascades. In this case, species at the lower level of the food chain multiply out of control, contributing to pests and diseases [
33]. Thus, only those species that can thrive in the edges of the fragments can adapt to the harsh conditions, eventually replacing the original species composition [
34].
Watershed landscape fragmentation will also likely lead to local warming due to creation of non-vegetative surfaces that absorb more solar radiation, affecting the microclimate of the watershed and exacerbating the impacts of global warming [
34]. This increases evapotranspiration that alters the local water cycle, with rivers and streams becoming more prone to either floods or droughts at any month of the year [
35]. This also affects soil dwelling organisms sensitive to increasing temperature and are critical in ecosystem processes such as nutrient cycling [
34]. As there is less vegetation to hold the soil during peak flows in a fragmented landscape, soil deposition or erosion is evident when observing the quality of water in the rivers and streams. Soil erosion encompasses water pollution and siltation, loss of organic matter, and reduction of water storage capacity of the watershed [
36].
Particularly interesting in ES studies and fragmentation is the time lags between land-use change and ecosystem responses. These time lags delay the effects of fragmentation on the provision of ES supply, which means that some effects of fragmentation can be manifested not at present but can be felt in the future [
14]. Such delayed effects are more pronounced for biodiversity-based services as re-colonization and establishing connectivity are slow processes [
37] as well as to hydrological services where groundwater turnover times are typically very slow, thereby reversing water quality degradation is difficult [
14].
4. Methods
4.1. Study Area
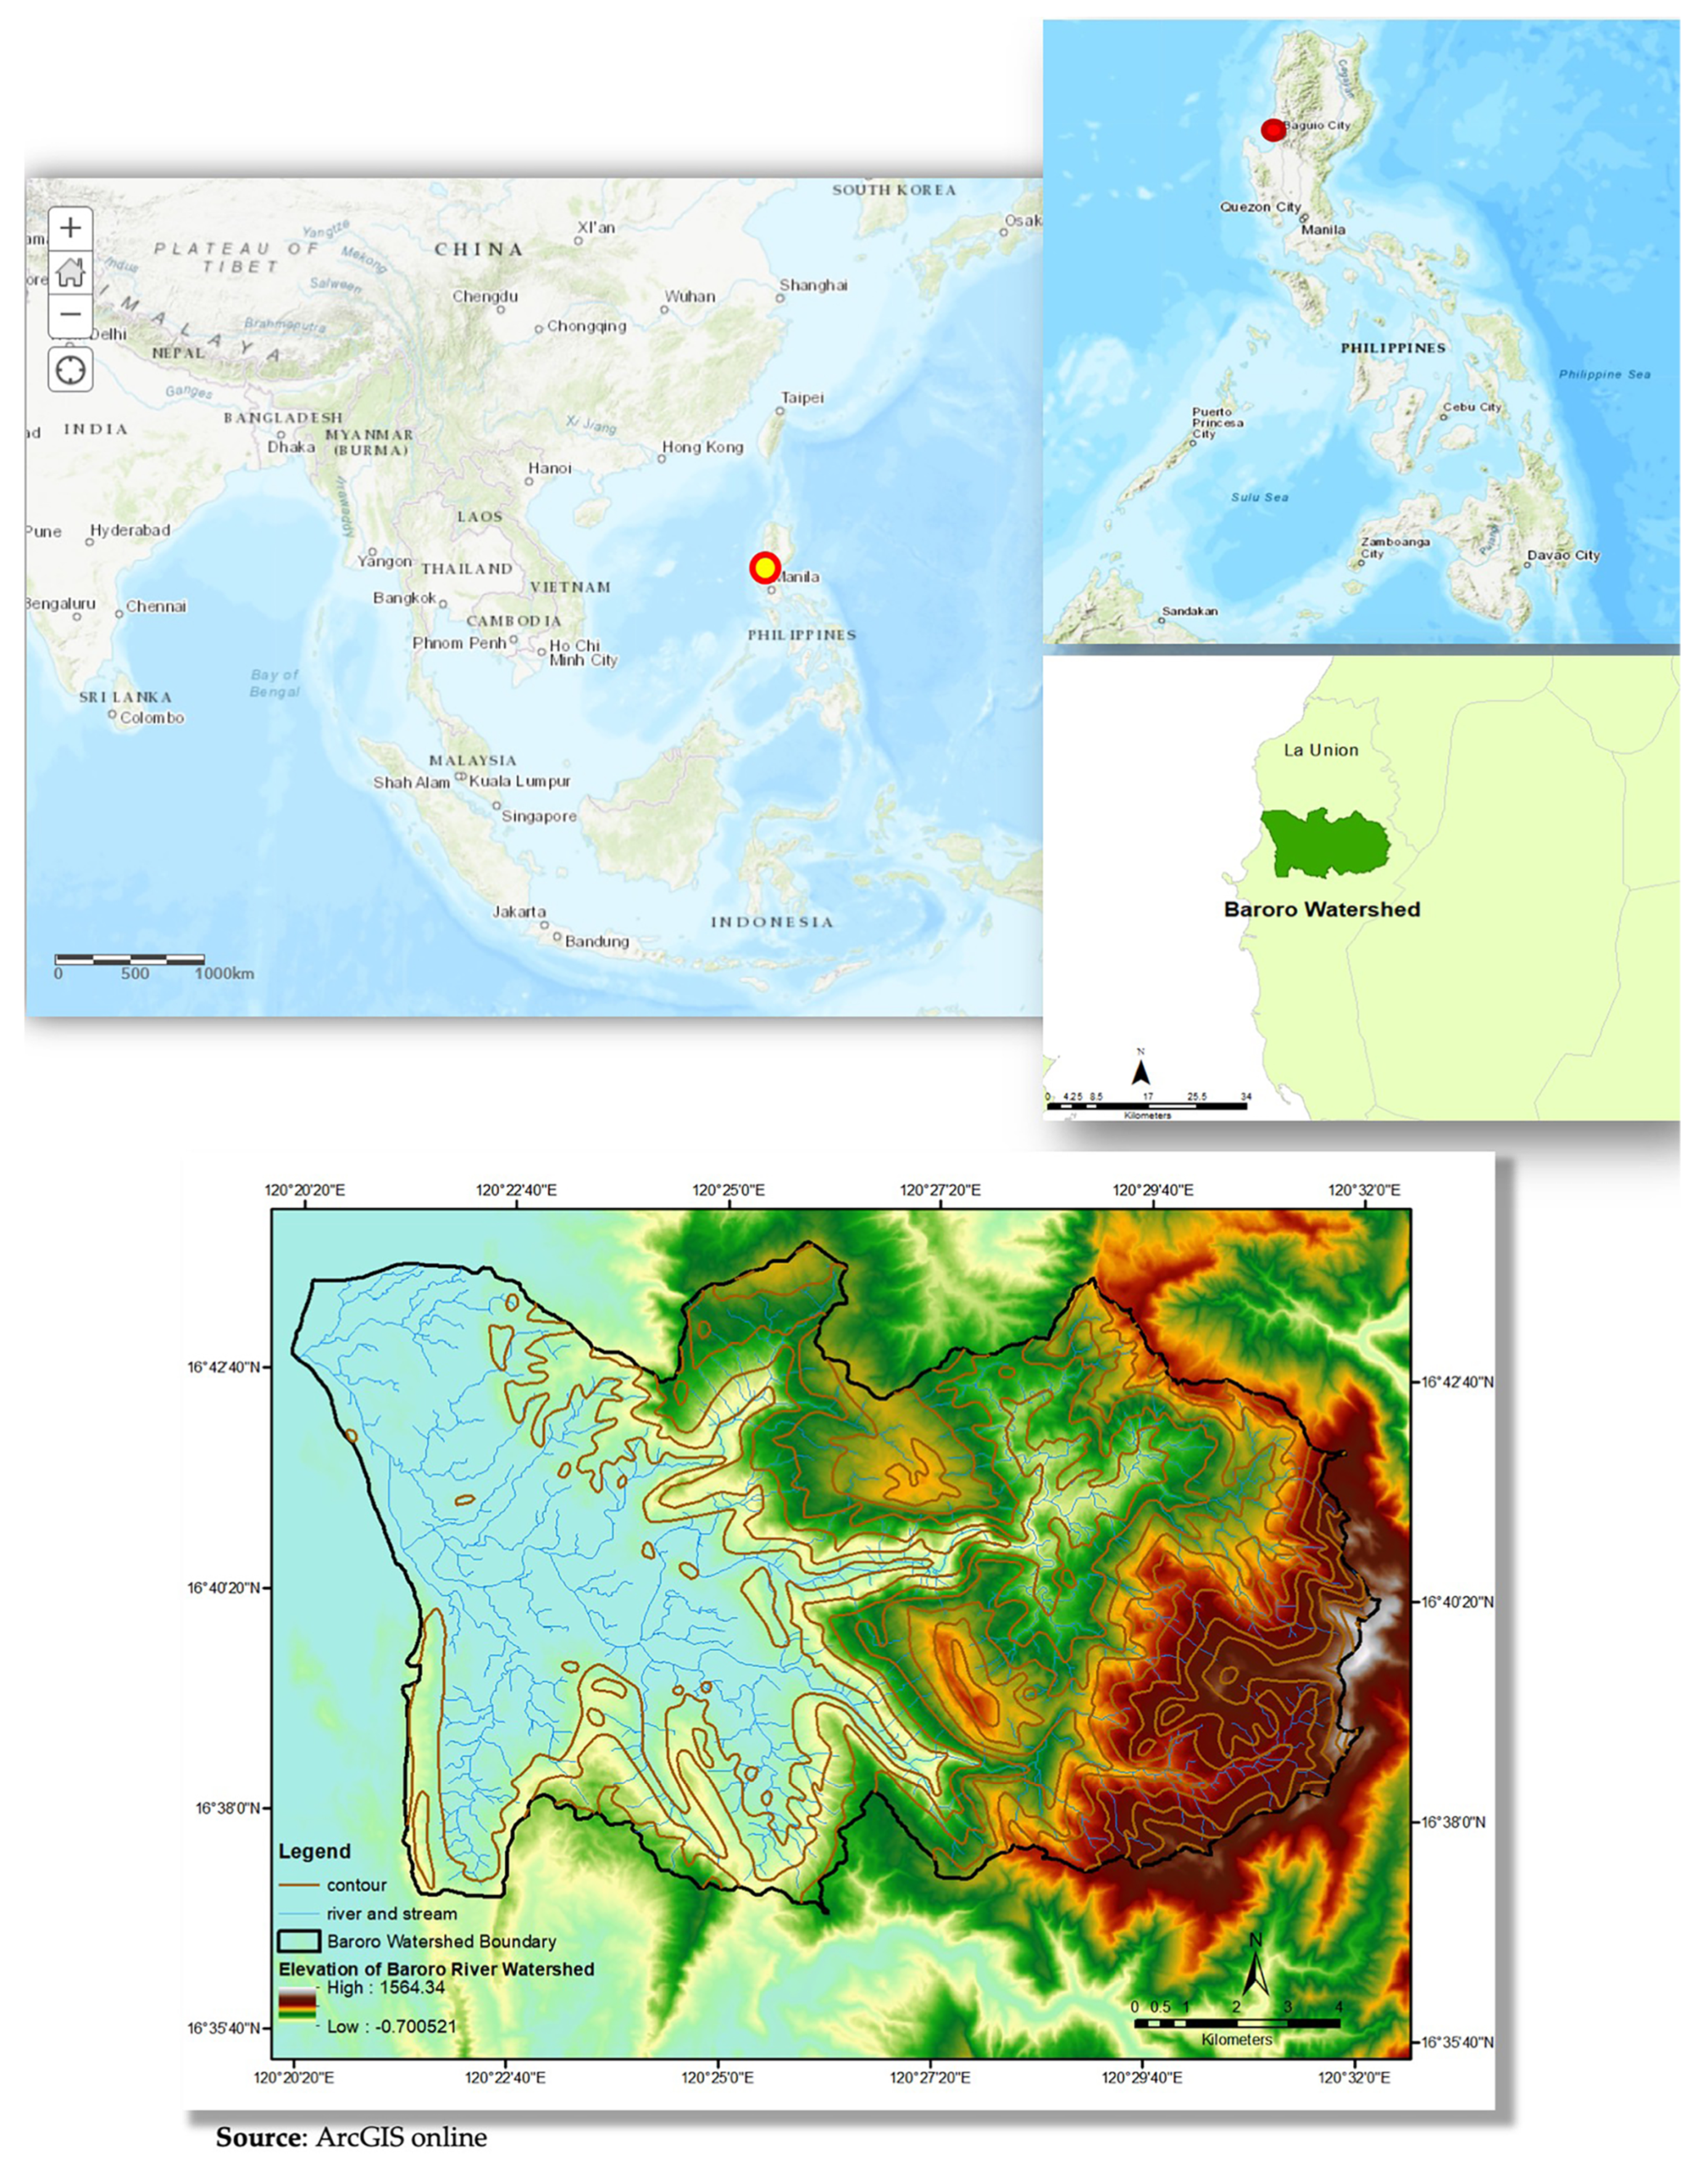
The Baroro River Watershed is located in the province of La Union (Northern Luzon, Philippines, see
Figure 1). It is composed of the municipalities of San Gabriel, Bagulin, San Juan, San Fernando, Bacnotan, and Santol. The watershed has a total land area of 19,063 hectares, which is the main source of water for both irrigation and domestic purposes in all municipalities except for Bagulin and Santol. The Baroro River Watershed represents the case of majority of watersheds in the Philippines in terms of anthropogenic pressures and changes in land use—from a contiguous forest in the early 1900s to numerous patches of mini-forests concentrated at the upper portion of the watershed at present. Agricultural areas, production forests, and protection forests constitute the present land uses in the watershed. The study further focused on three villages, which are representatives of the cross-section of the watershed namely, (1) Barangay Lon-oy in San Gabriel for the upstream; (2) Barangay Cabaroan in San Juan for the midstream; and (3) Barangay Baroro in Bacnotan for the downstream area.
Forest vegetation can still be seen in the upper and middle portions of the watershed while its downstream portion is dominated by an urban sprawl. San Juan is one of the municipalities at the receiving end of the watershed. It is also a popular tourist destination primarily because of its famous beaches for surfing. Some communities in this side of the watershed are into fishing and farming, but agricultural lands are now slowly being converted into subdivisions and business establishments due to improving economic opportunities and outcomes. Agriculture dominates the middle portion of the watershed, particularly of rice and corn varieties, interspersed with permanent and semi-permanent dwellings.
Communities that inhabit the upper watershed are composed of Kankanaeys, an indigenous people and original settlers in the area. The Kankanaeys are still practicing rice terracing, particularly in sloping areas, but commercial agriculture as compared to swidden farming is the dominant practice for the rest of the watershed. The middle and lower watersheds are occupied by migrants of Ilocano and Tagalog descents. From 55,697 individuals recorded in 1990, the population in the watershed increased to 77,166 in 2015, with an annual growth rate of 2.76 % and is expected to put more pressures on the remaining natural resources.
4.2. Research Design
The study was conducted using a two-stage research design. First, satellite images were sourced from the official land use and land cover (LULC) maps of the National Mapping and Resource Information Authority (NAMRIA). This government facility is responsible for providing mapmaking services and related information to the general public. The LULC maps represent the different land use classes of Baroro River Watershed, and correspond to the years 1988, 2003, 2010, and 2015. These four time series were the same time when NAMRIA produced the official land use cover maps of the country. The maps were then cross-referenced using available sheets from Google Earth Pro (Open Geospatial Consortium, Inc., Wayland, MA, USA). The processing and analysis of reclassification of land types were done using an ArcGIS software (ESRI, New York Street, Redlands, CA, USA). Selected landscape metrics were computed using FRAGSTATS 4.2.1 due to its accuracy in calculating fragmentation metrics and straightforwardness on raster datasets [
38,
39]. FRAGSTATS is a spatial pattern analysis program that offers a comprehensive choice of landscape metrics and have been used to quantify landscape structure. It is used to analyze fragmentation and describe the characteristics and components of landscapes [
38]. These statistics facilitate the comparison of landscapes and the evaluation of processes. The advantage of FRAGSTATS is that the calculations are applied in a fully integrated approach in a GIS platform, which can generate a patch map. The raster datasets were then processed in ArcGIS software.
For the second stage of the research design, site visits to the three selected villages were done to validate the maps and obtain additional relevant data. Land use and environmental changes in the villages were traced based on recollection of oldest inhabitants in the areas through focus group discussions (FGDs). Prior to the FGDs, key informant interviews (KIIs) with village officials were done to gather crucial information needed to craft questions for the FGDs. Information focused on reconstruction of the changes that happened at different time periods (1988, 2003, 2010, and 2015). Specifically, the timeline presented to the participants were divided into four decades to coincide with the produced maps: 1940s (pre-mapping period), 1980s (coinciding with 1988), 2000s (coinciding with 2003), and 2010s (coinciding with 2010 and 2015). This was also done to confirm whether the two types of data have overlaps. Key questions were formulated to gain a more comprehensive understanding of how local people used watershed resources, how these practices affect watershed landscape fragmentation, the ES delivery of the Baroro River Watershed, and how people in the watershed adapt to existing conditions and projected scenarios. Also, before the start of the FGDs, an introduction about the study and its objectives, definition of watershed landscape fragmentation, and presentation of fragmentation maps based on LULC were given to the participants.
In terms of ES, emphasis was placed on freshwater production, soil productivity, preservation of biodiversity, provision of food, fiber and raw materials, cultural services, and maintenance of microclimate. These were the ES that the FGD participants were most familiar with and were defined in the Millennium Ecosystem Assessment (MA). An average of eight carefully selected participants joined the FGDs, with ages that range from 35 to 83 years old representing the different age groups and gender and knowledgeable of the history of their barangays. The FGDs were conducted following the protocols set by the Overseas Development Institute (ODI) to ensure that reliable information will be generated [
40]. The older participants can recall what transpired in the 1940s through oral history and life experience, which became the study’s base year. After the FRAGSTAT results, KIIs, and FGDs, interpretations regarding the impacts of watershed landscape fragmentation to ES were made.
4.3. Satellite Imagery Classification and Accuracy Assessment
Geospatial and remote-sensing data are reliable sources for understanding and determining the drivers of LULC changes at any landscape [
41]. In this study, satellite images used for LULC maps from NAMRIA that represent land use classes of Baroro River Watershed from 1988 to 2015 were obtained. The land cover maps were generated based on a classification scheme consistent with international standards for global reporting and integration [
42]. For 1988 land cover data, Landsat TM data from 1982 to 1985 were processed and supported by ground measurement conducted by the then Bureau of Forest Development (BFD) with the assistance from German Technical Cooperation Agency (GTZ), and Food and Agriculture Organization (FAO). The 2010 land cover map was sourced from Landsat 7 ETM+ data from 2010 with 30-m resolution and classified based on FAO-FRA Project Field Inventory Manual with NAMRIA and Forest Management Bureau (FMB) collaboration; ALOS AVNIR-2 (10 m resolution), SPOT 5 (10 m resolution) and Landsat 7 ETM+ (30 m resolution). Data were validated on the ground with accuracy assessment (calculated by province through overlaying the ground validated sample data over the preliminary map and presented the success or failure of the matches in Confusion matrix with overall accuracy of 89%). Landsat operational land imager (OLI) data from 2015 was used, with 30 m resolution with reference data from Google Earth Pro, topographic maps, ground truth data and Interferometric Synthetic Aperture Radar (IFSAR) data for coastline using OBIA eCognition software for digital classification with ground validation and accuracy assessment of 93.92% [
42]. The land cover maps were validated and presented to the Department of Environmental and Natural Resources (DENR) regional and provincial offices, with local government units (LGUs), and selected stakeholders for comments, suggestions, and approval. The 1988, 2003, 2010, and 2015 LULC maps are the officially recognized maps by the Philippine Government that can be used by the national government offices, academe and other organizations/institutions.
4.4. Image Reclassification
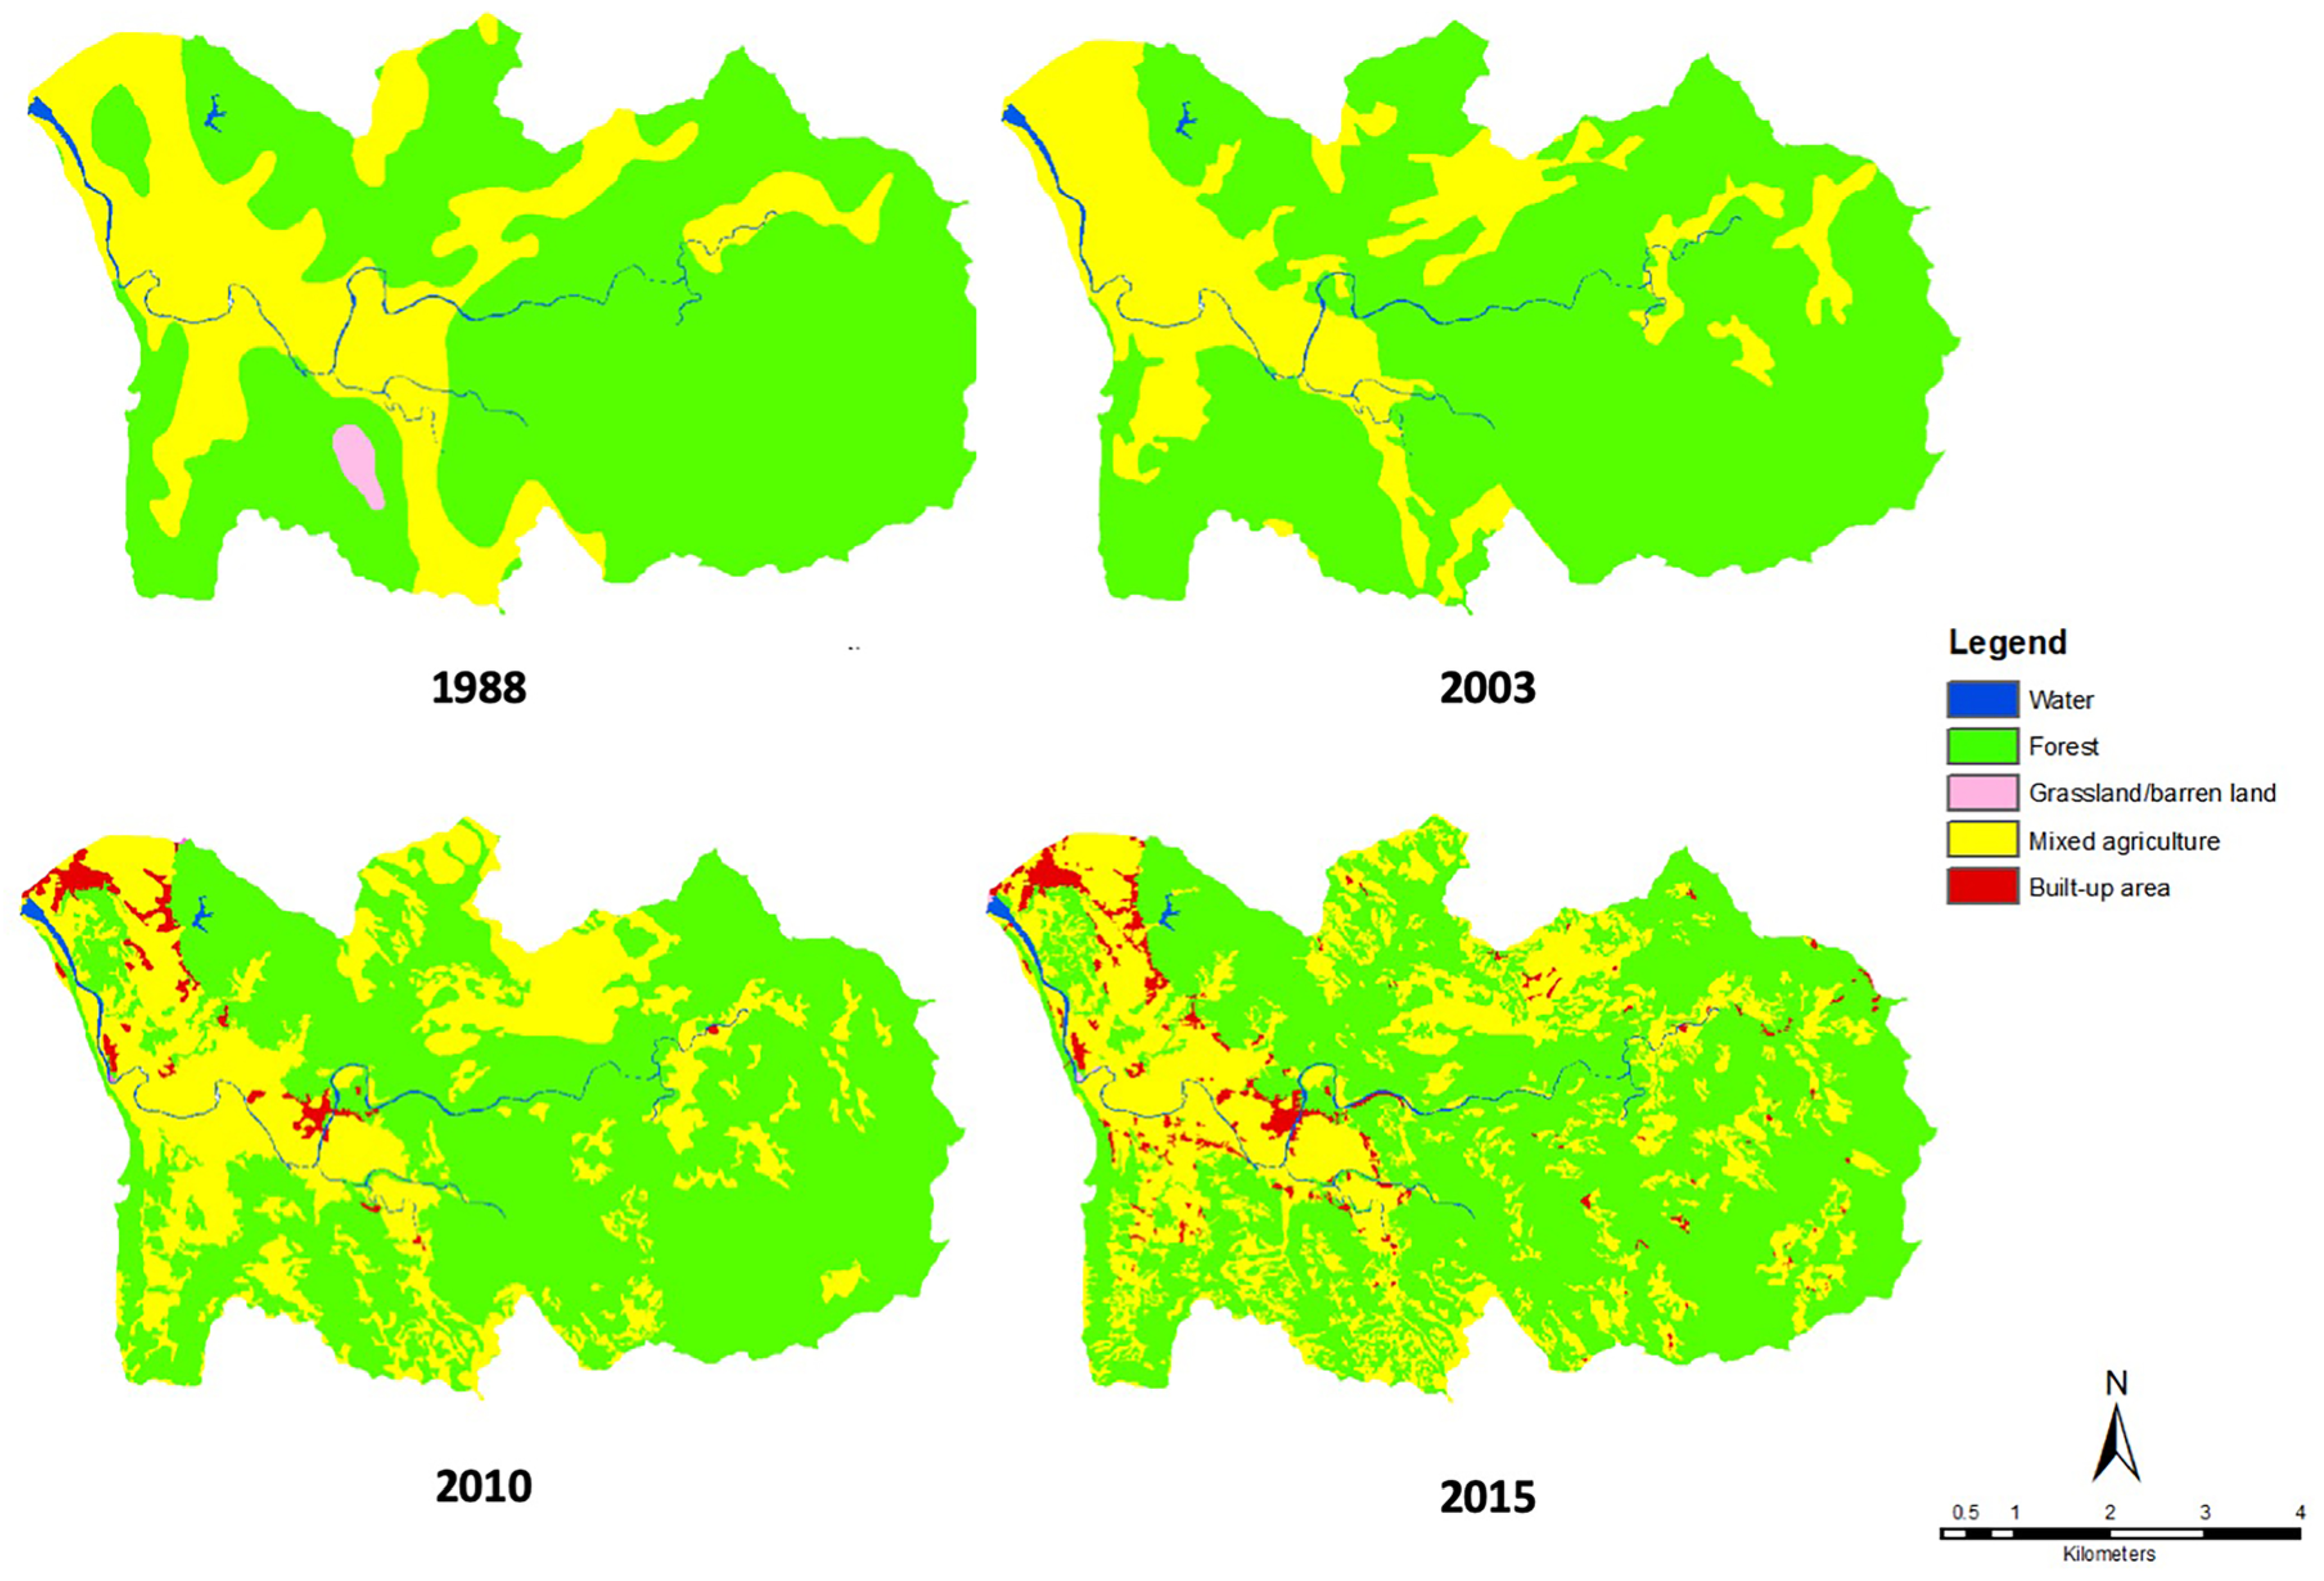
A reclassification scheme of five classes (from 12 aggregated categories) was developed based on physiographical knowledge of the study area, supporting ancillary data, researchers’ prior local knowledge, and visual interpretation using historical function of Google Earth Pro. The five LULC classes were categorized as water bodies, grassland/barren land, mixed agriculture, forest, and built-up areas (
Table 2).
4.5. Landscape Metrics
Spatial metrics were analyzed at both class and landscape levels. This means that each patch type in the landscape mosaic of the watershed was analyzed as a whole. At the class level, eight landscape metrics were selected including class area, number of patches, edge density, total edge, median patch size, area-weighted mean shape index, mean shape index, and mean perimeter-area ratio. At the landscape level, nine indices were selected, namely: (1) number of patches; (2) mean patch size; (3) edge density; (4) area-weighted means shape index; (5) perimeter-area fractal dimension; (6) contagion; (7) aggregation index; (8) largest patch index; and (9) mean shape index. These landscape metrics were chosen because it can show changes in land use activity, as demonstrated in past studies [
43,
44] and as described in
Table 3.
5. Results
5.1. Land Use and Land Cover Change Dynamics
The LULC classification from the five classes across four time periods indicate the conversion of forest and grassland/barren lands to mixed agriculture and built-up areas (
Table 4 and
Figure 2). The dominant land use/land cover that increased progressively over the study period was mixed agricultural land and built-up areas. For example, cultivated land increased by 14% from 2003 to 2010, while built-up areas increased by 100% in the same period. On the contrary, forest cover decreased by 8% from 2003 to 2010 and 5% from 2010 to 2015. Grassland/barren lands were also reduced by 94% from 1988 to 2015. In addition, grassland/barren land and forest lands were mainly converted to cultivated, built-up areas.
Land use change detection is an important process in monitoring and managing land resources because it provides quantitative analysis of spatial variation of land use pattern [
49]. As shown in
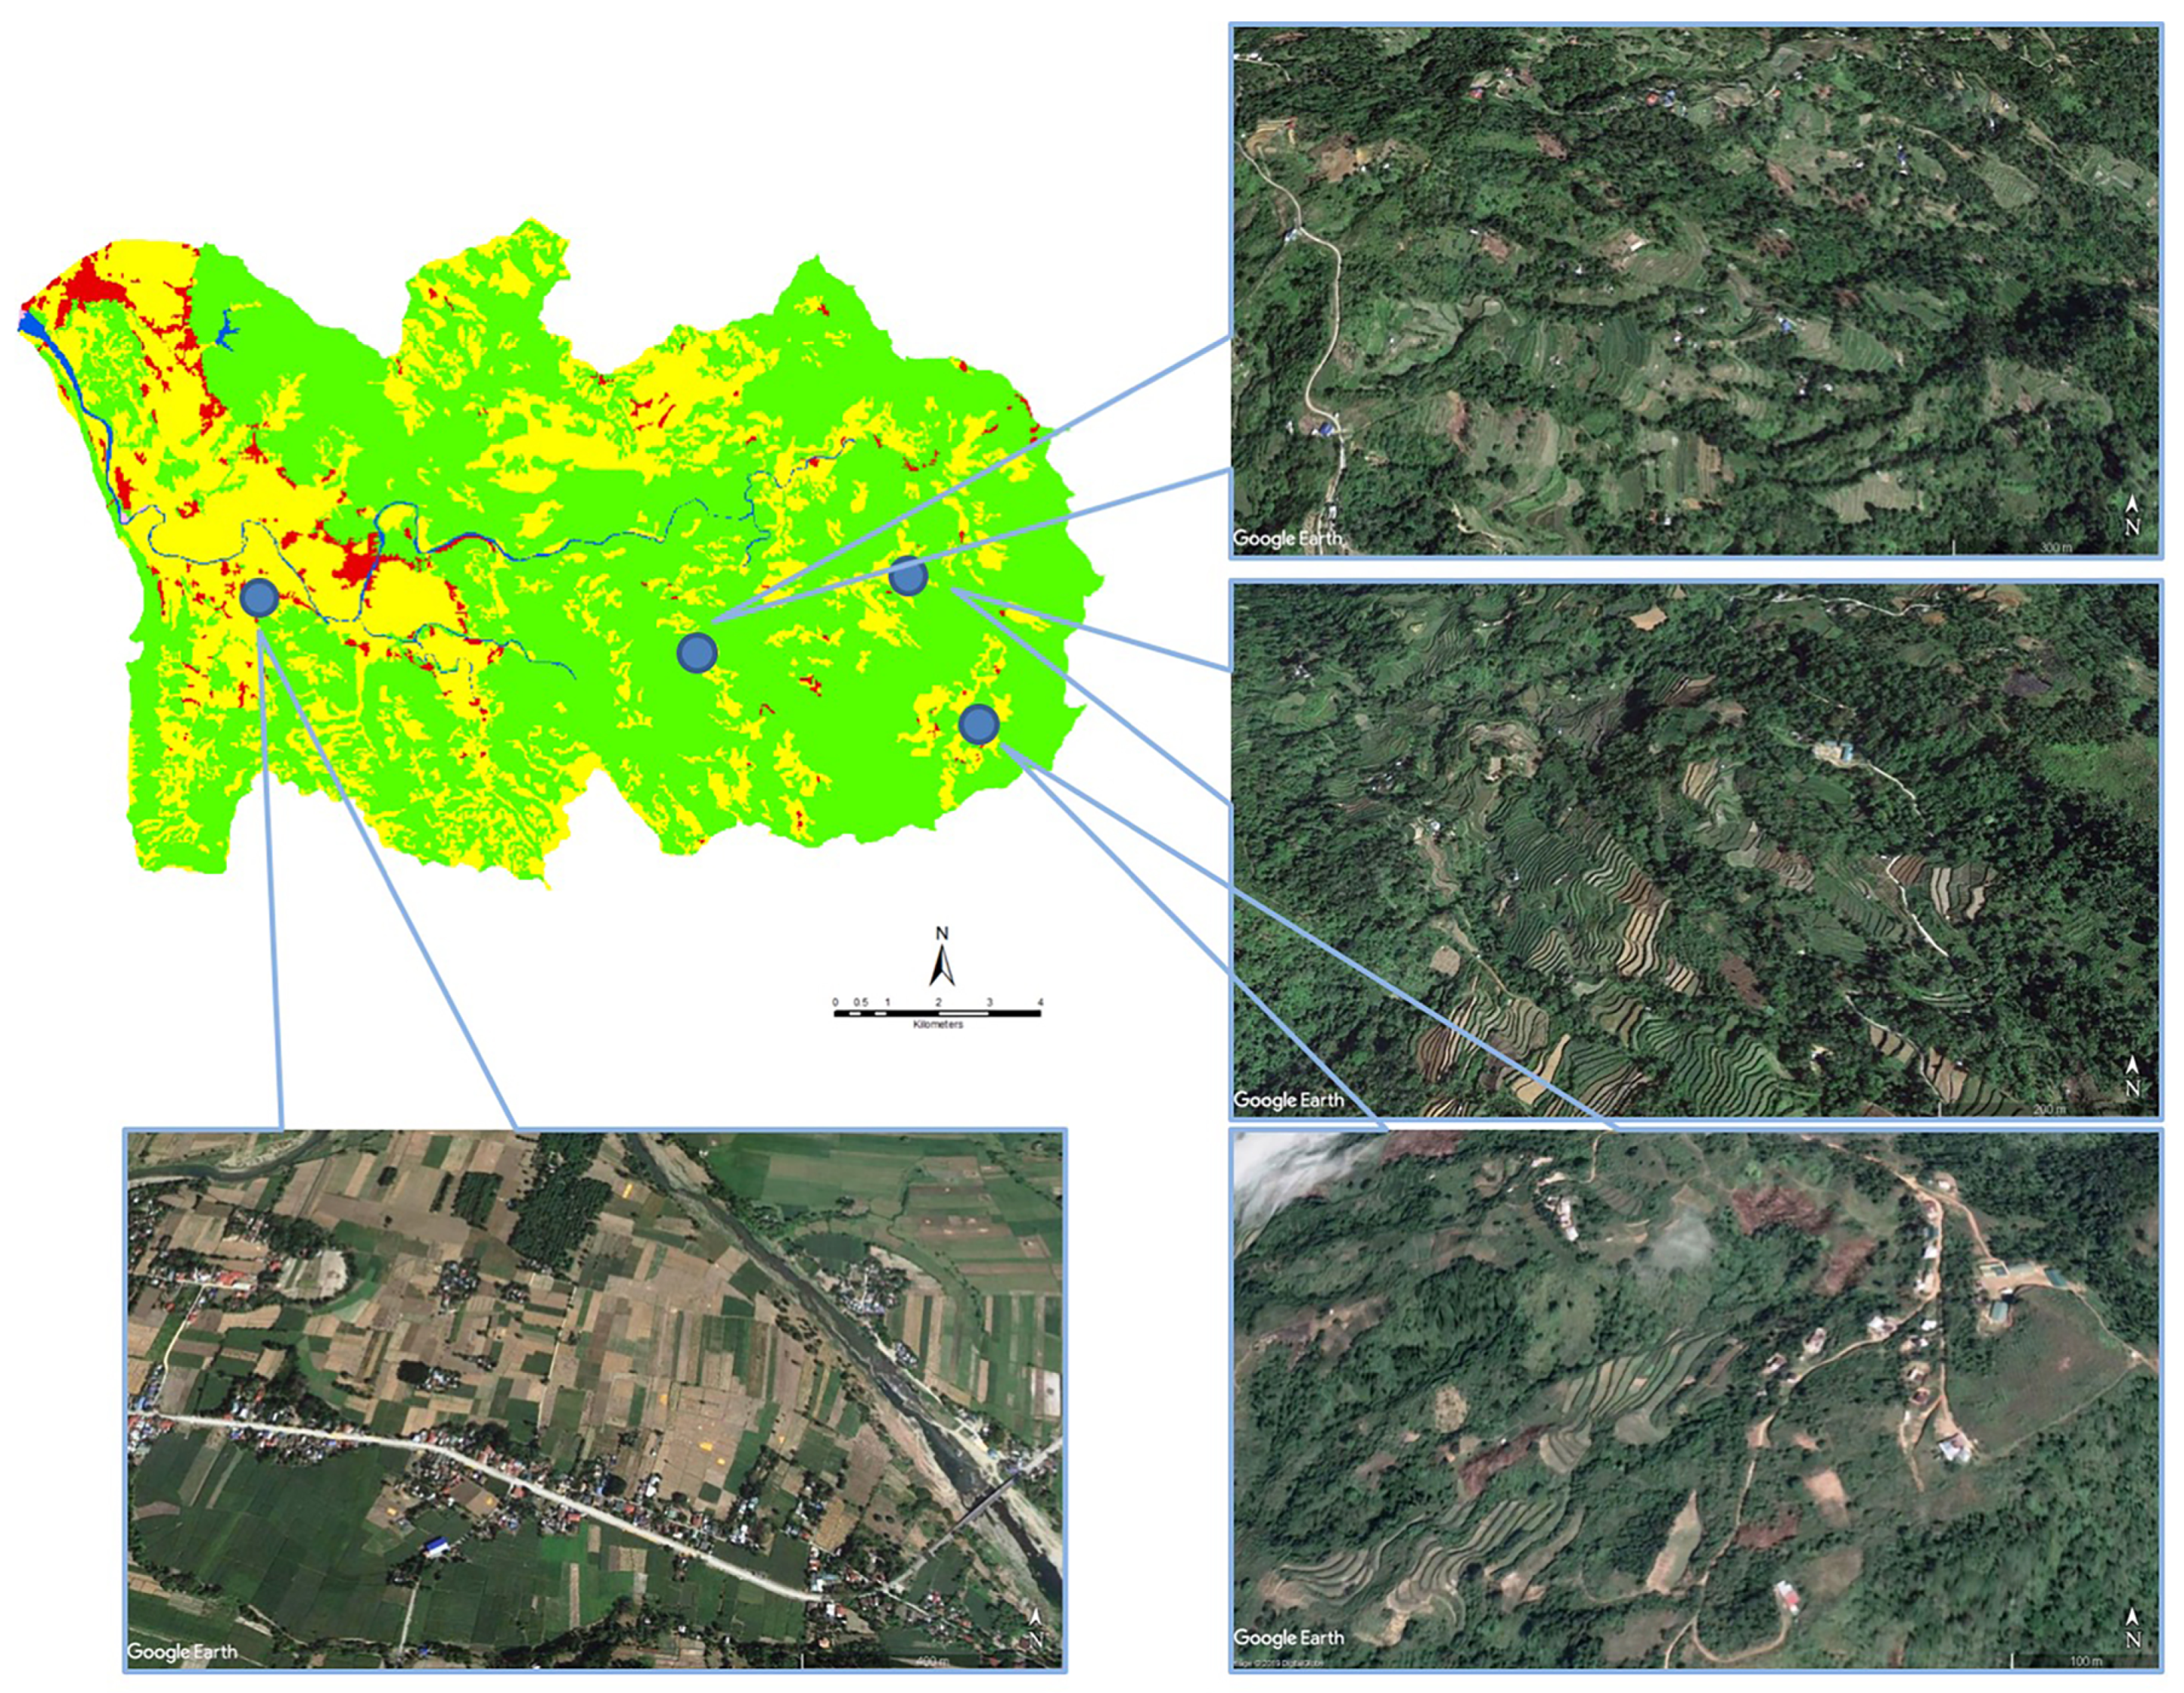
Table 4, there has been a considerable change in land use during the 17-year period. In the upper part of Baroro River Watershed, forest was the dominant land use. However, results show that dense forest cover decreased by 8% during the study period, while mixed agriculture increased by 14%. Forest areas have been converted to cultivated and built-up areas with a remarkable increase of 100% (
Figure 3).
Note that the official LULC 1998 and 2003 maps from NAMRIA did not include a category of built up areas. However, this particular category was included by NAMRIA in the 2010 and 2015 maps. Secondary documents and local interviews revealed that human activities such as increasing population and proliferation of farms in the study area occurred from 1998 to 2003.
From 1998 to 2003, forest cover registered a significant increase, which government and other sectors attribute to regrowth vegetation, plantations established through reforestation projects, and spontaneous tree growing activities on public and private lands [
56]. Correspondingly, the area for mixed agriculture also decreased as a direct effect of these efforts.
5.2. Landscape Fragmentation: Spatial Metrics at Landscape Level
Landscape metrics are used to determine structure and quantify changes in the configuration of a landscape [
57]. Also, landscape metrics are discrete and static quantitative indicators of landscape [
54]. Spatial metrics applied at landscape level were used in this study to measure the graininess of the landscape (e.g., the tendency of the landscape to exhibit fine versus coarse-grain texture). Metrics in
Table 5 help determine the structure and fragmentation of land use/land cover of the Baroro River Watershed landscape, and all mosaic structures and related information were obtained in conjunction with GIS and FRAGSTATS.
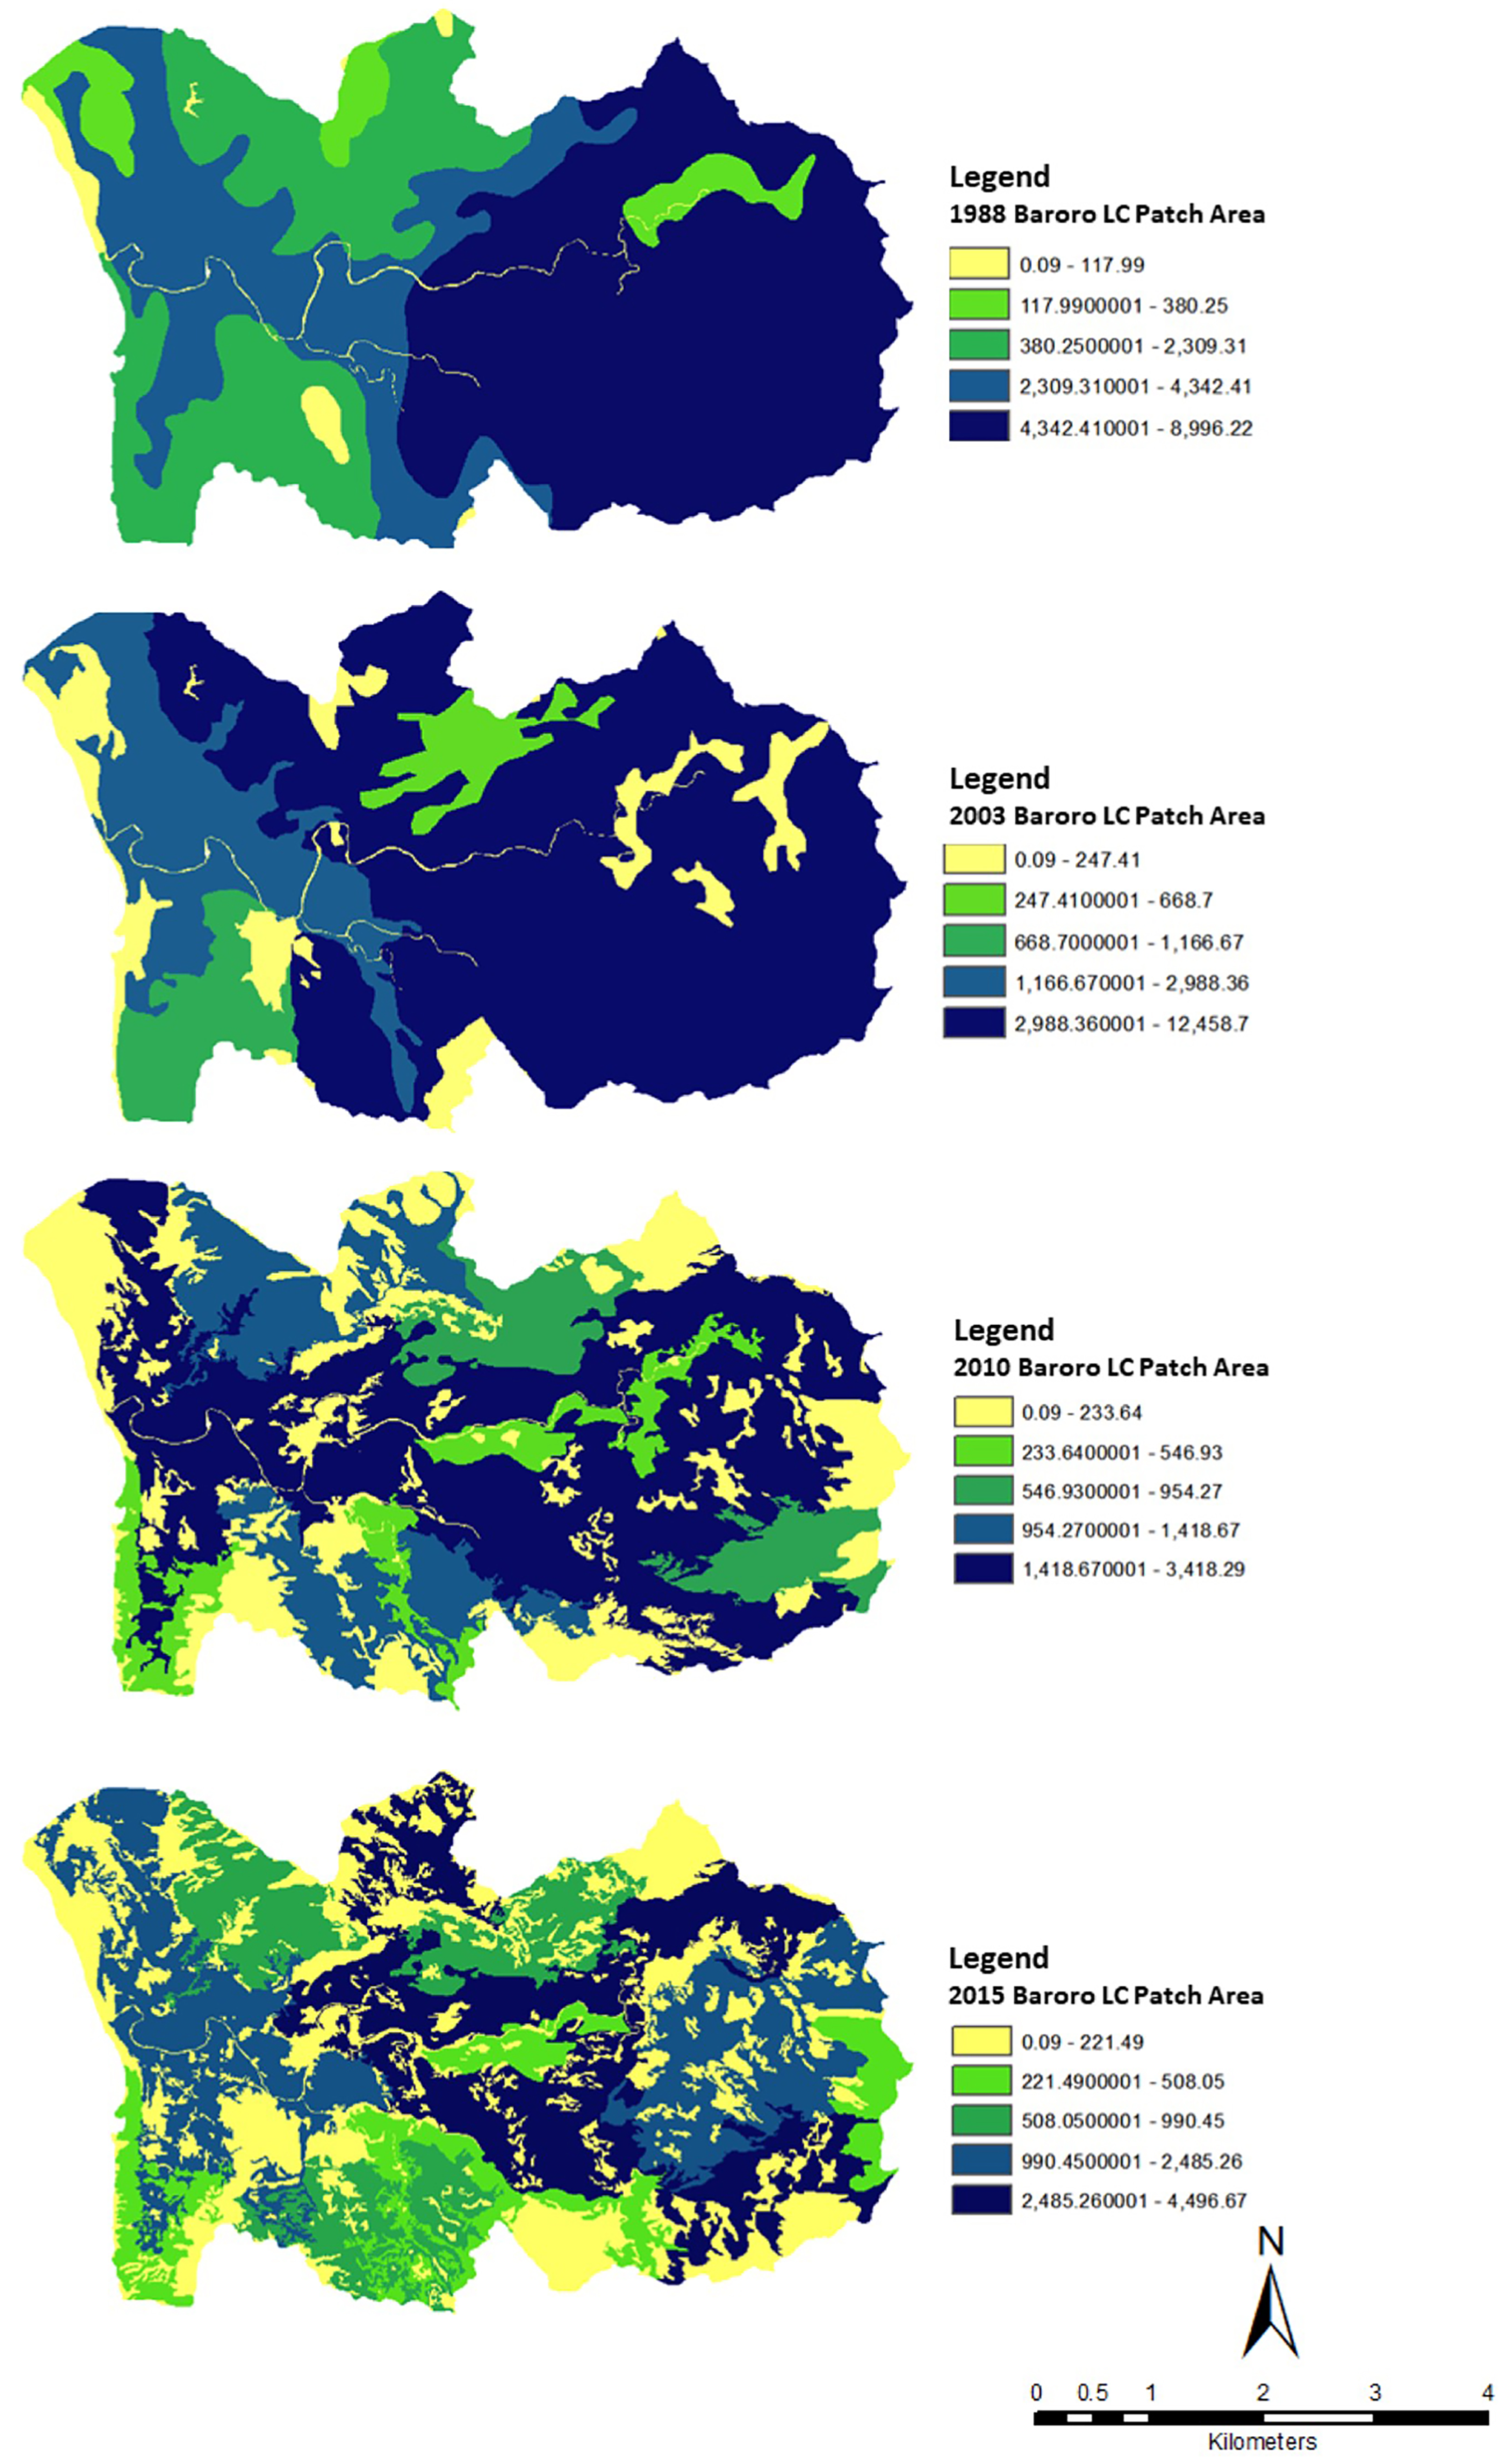
The spatial metrics at landscape level showed significant changes between four time periods (
Table 5 and
Figure 4). The number of patches increased from 101 in 1988 to 786 in 2015, and the mean patch size declined from 189.93 to 24.41, indicating that the landscape is dominated by small patches. This is supported by the area weighted mean shape index (AWMSI), where the value increased from 1988 to 2015, indicating an augmentation of the non-regularity of patches in the watershed. The ED increased significantly from 2003 to 2010 and may be a result of the rapid increase of NP during this period. The PAFRAC value continued to increase during the period and approached the critical status of 1.5, suggesting a decrease in the stability of the land use/land cover structure of the Baroro River Watershed landscape. The CONTAG analysis showed a series of decreasing values.
The results of landscape metrics show that several small forests were removed between 1988 and 2015 resulting in reduced patches and sizes. The agricultural expansion in Baroro River Watershed and conversion of forestland into different land uses during the last two decades led to fragmentation of contiguous forests affecting the watershed landscape.
5.3. Landscape Fragmentation: Spatial Metrics at Class Level
Changes in landscape metrics at class level between four time periods are presented in
Table 6. There have been changes in the size, number, and spatial distribution of fragments, with different patterns for different land uses at class level. Landscape fragmentation in the upper portion of the Baroro River Watershed increased and encroached in the natural forest cover through agricultural expansion and deforestation. The forest cover is highly dynamic in patch type. Forest area is the patch type with the largest class area (CA). The total landscape area decreased from 71% (13,595.49 ha) to 65% (12,453.48 ha), while the patch number increased from 9 to 214. The mean patch size (MPS) also drastically decreased from 1510 in 1988 to 55 in 2015 for the dense forest. The increase in number of forest patches as well as decrease in mean patch size indicate that forest cover in the watershed has been fragmented. Several forest patches have also been converted into numerous small patches and isolated in recent years. AWMSI showed changes for forest type class, indicating an increase in the shape complexity and fragmentation.
Agricultural land is one of the important land use classes in the watershed and plays an important role in fragmentation of the natural forest. During the study period, agricultural land increased from 5305.23 ha (28%) in 1988 to 6059.34 ha (32%) in 2015. The number of patches (NP), edge density (ED), total edge (TE), and area-weighted mean shape index (AWMSI) increased progressively over time with the exception of the mean patch size, which showed the reverse pattern. This suggests that mixed agriculture patches have become more complex and been broken into small sizes.
5.4. Ecosystem Services at Spatial and Temporal Scales
Examining the land use history of the Baroro River Watershed requires going back to past events that led to its current condition. These events may explain why watershed landscape fragmentation occurred and what ES were affected by changes in the land use and forest cover. To do this, three villages were selected to represent the cross-section of the watershed and accurately describe the connectivity of each section in the context of a watershed landscape. Barangay Lon-Oy depicts past and current situation in the upstream watershed section, Barangay Cabaroan for the midstream section, and Barangay Baroro for the downstream section. A timeline was established and divided according to decades corresponding to fragmentation maps. These were then used to gather temporal knowledge from the local people about the history and uses of the Baroro River Watershed.
5.4.1. Upstream Section or Headwater in Barangay Lon-Oy, San Gabriel
The earliest inhabitant arrived in Barangay Lon-Oy from the neighboring province of Benguet in the early 1920s to search for areas suitable for
kaingin or swidden farming. Stories passed orally to the next generation of Kankanaeys describe the watershed area as being covered with lush green forest, with around 90% forest cover until the 1940s. Inside the watershed were river and streams with clear water used by Kankanaeys for drinking and cooking. The FGD participants shared that the clean and steady flow of water came from the thick forest where wildlife of numerous species still existed, with some being hunted for food such as wild boars (
Sus philippensis) and wild deer (
Rusa marianna); see
Table 7). Different kinds of fish abounded in the rivers such as eel (
Anguilla marmorata), crabs (
Brachyura spp.) and
ipon or largesnout goby (
Awaous melanocephalus), an endemic species in the Baroro River Watershed. Houses were made from bamboo (
Bambusa vulgaris) and other grasses sourced from the forest and nearby areas, and there was no need to cut trees for timber. Settlers used to survive by eating root crops such as taro (
Dioscorea alata) and cassava (
Manihot esculenta) harvested from
kaingin farms, and rice from paddies. The soil back then was described as very productive since there were limited number of farms for few families and crops were only for household consumption. Kankanaeys used caves as burial grounds based on their belief system. The microclimate was generally cool throughout the year.
The forest cover started to decline in the 1980s, from the 90% in the 1940s to an estimate of 60% in the 1980s. This was attributed to the increasing number of families living inside the village. Water became polluted at this time, particularly due to use of chemical fertilizers and pesticides up to a point that it was not safe for drinking. Some farmers began to use a 60/40 ratio of organic to chemical fertilizer as the soil was not that productive. Still, food was sufficient and rice terraces were a familiar sight in the area. As population increased, so did the houses constructed using wood as primary material. Timber became for sale and trees from the forest such as narra (Pterocarpus indicus), red lauan (Shorea negrosensis), and yakal (Shorea astylosa) were cut moderately. There was an increase in hunting activities to support the growing number of families, thus the number of wildlife species began to go down. Caves were replaced by cemeteries as permanent burial place. The weather became hotter and drought was experienced by the people for the first time.
In the 2000s, people in Lon-Oy observed that the forest cover in the watershed started to increase, but this was not due to a natural occurrence. The government led reforestation activities using exotic species such as gmelina (Gmelina arborea), narra (Pterocarpus indicus), and mahogany (Swietenia macrophylla). Despite this effort, the volume of water flowing from the river was declining, especially during summer. The ratio of organic to chemical fertilizer used by farmers was recorded at 50/50 based on the estimates of the FGD respondents. Village officials also prohibited the cutting of dipterocarps during this period and encouraged families to plant fruit trees such as marang (Artocarpus odoratissimus), jackfruit (Artocarpus heterophyllus), guyabano (Anona muricate), and rambutan (Nephelium lappaceum). The number of wild animals waned as wild boar (Sus philippensis) and deer (Rusa marianna) were not sighted anymore. According to the respondents, the microclimate was hotter preventing them from using their beddings at night. Typhoons became stronger with increased gustiness that damaged roads and the mini-hydro plant in the village.
The situation worsened during the decade following 2010. While forest cover was described by local people as improving due to additional reforestation efforts by the government and the private sector such as Holcim, a cement manufacturing company in the Philippines, water volume continued to decline and its quality worsened as algal bloom was observed in some portions of the river. Diet of the people was completely replaced by livestock as boar and other wild animals cannot be found in the forest. Weather continued to be erratic and temperature soared.
5.4.2. Midstream Section in Barangay Cabaroan, San Juan
The same as with Lon-Oy, the forest cover in Barangay Cabaroan was estimated to be at 90–95% in the 1940s (see
Table 8). Water in the river was used for drinking and irrigation purposes; while different species of fish thrived due to high quality and volume. Rice farming was still limited and that the soil was described as very productive. If needed, farmers used carabao manure as fertilizer. Diet was composed of fish, vegetables, and meat—some coming from animals in the wild such as frogs (
Fejervarya limnocharis) and wild chicken (
Gallus gallus domesticus). Houses were made of bamboos and only branches of trees were cut for fuel wood. Several varieties of timber and fruit trees abound in the area such as duhat (
Syzygium cumini), guava (
Psidium guajava), mabolo (
Diospyros blancoi), and guyabano (
Anona muricate) to name a few. People used to have a picnic near the river and freshwater can easily be dug from the soil. Climate was generally colder during this period.
Reduction in the forest cover from 95% to 70% in the 1980s was observed by the participants. The river was described as in good condition and can be used for drinking, though some portions were already contaminated from the use of chemicals upstream, which coincides with what happened in Barangay Lon-Oy during this period. Farmers started to build deep wells at a depth of 10 feet. As agriculture intensified, so did the use of chemical fertilizers, especially by wealthy farmers. It was also during the later years of this period when farmers were forced to use chemical pesticides as stem borers and grasshoppers attacked crops. People were increasingly relying on the market for food as commercial livestock were available and accessible. Decreasing number of fish and absence of wild animals for food explained the shift to other food sources in the village. While some benefits were not derived from the watershed, people still go to the river for recreation. This was also the period when the climate began to become hotter.
The next period saw a steep decline in forest or tree cover, as recalled by the respondents. Data showed a decline to 30% in 2000s from the previous 70% in the 1980s due to the increasing number of farms devoted to commercial agriculture. As all farmers were completely relying on chemical fertilizers and pesticides, water quality in the river further declined. In 2009, people started to buy bottled water for drinking. The period also saw an increase in output of charcoal making to support the tourism industry in the coastal areas of San Juan, resulting to more cutting of trees. There were lesser fish in the rivers and native trees were replaced by fruit trees. Picnic was not viable along the river as the quality of the surrounding areas became degraded. People started to use air-conditioning system to get them through summer.
There was no change in the forest/tree cover in 2010 and the succeeding years from the previous period. However, 90% of the population relied on bottled water for drinking, costing the household more money to survive. Some farmers began shifting to organic agriculture, however, majority of the farmers were not convinced that the soil can support crop production naturally. Demand for charcoal still exists but authorities regulated its sale to prevent further cutting of trees. This decade also saw extreme typhoons passing the area with stronger wind and rains such as typhoons Ondoy, Pepeng, Yolanda, and Egay.
5.4.3. Downstream Section in Barangay Baroro, Bacnotan
The present physical characteristic of Barangay Baroro at the downstream section of the watershed is completely different from its situation in the 1940s (see
Table 9). Eighty percent (80%) of the area was said to be covered with trees as only 50 families were living in the village back then. Water quality in the river was clean and the volume was steady; making it ideal for different fish species to thrive. Open-dug wells were already existent during this period, but had shallow depths as compared now. While farmers used chemical fertilizers for rice (
Oryza sativa), corn (
Zea mays), tobacco (
Nicotiana tabacum L.), and other crops, this was still at the 50/50 ratio. With the village near the ocean, presence of sea grass (
Enhalus spp), seashells, and healthy coral reef abounded as households depended on the ocean for sustenance. Houses were made of natural materials such as bamboo (
Babusa vulgaris) and
pawid (Nypa fruticans). There were also several varieties of fruit-bearing trees as well as wild animals for hunting.
Ipon (
Awaous melanocephalus) was abundant during September to October. Respondents described the temperature to be cold and starts in the afternoon.
In the 1980s, tree cover started to decline due to increasing number of houses for 200 to 300 migrants coming from different parts of Ilocos Region. Water in the river was described as clean, but quality started to decline. The river’s reach was getting wider and the depth became shallower. On the other hand, deep wells depths were recorded at 20 feet, indicating over abstraction of groundwater. Farmers were heavily relying on chemical fertilizers. As soil productivity worsened, the number of farmers in the village dropped to 14. Food was sourced from farms and market and not from the watershed. Enterprising individuals began putting fish pens in the river. The number of wildlife species for both flora and fauna, including fish, continued to decrease at an alarming rate. As a sign of declining supply, the price of ipon increased during this period. The weather started to become hotter. Storm surge was experienced in 1987.
Except for some patches of trees, forest cover was almost non-existent by 2000s. Houses increased to around 400 to 500, resulting in the establishment of subdivisions. The depth of deep wells remained at 20 feet, but there was absence of groundwater during summer. This convinced the local government to put up a communal potable water supply. Drinking water was sourced through refilling stations. River reach became wider, which was particularly dangerous to people living along the riverside especially during typhoon season due to flooding. With respect to occupation, some farmers shifted to other jobs in nearby municipalities. This period also saw an increase in the number of fish pens to 16. Unregulated harvesting resulted to decreasing number of fish species in the river and ocean, particular ipon. There were limited sightings of green viper (Trimeresurus flavomaculatus), monitor lizard (Varanus indicus), dolphin (Orcaella brevirostris), and tortoise (Eretmochelys imbricata).
Beginning in 2010, salt water intrusion was experienced due to overabstraction of water. This was brought about by pressure from a burgeoning population, which increased to 500–600 households composed mostly of foreigners. Due to this, water refilling stations proliferated. The water quality in the river worsened and became brownish in color. People were experiencing extreme weather events. A fish kill was recorded in 2017.
6. Discussion
Results of this study show the connection between local knowledge and land use metrics. The increasing number of patches (NP), decreasing mean patch size (MPS) as well as increasing edge density (ED) at the landscape level corresponded to the declining quality of ES. This includes loss of biodiversity, declining soil productivity, and deteriorating water supply as experienced by people living inside the watershed over four time periods being studied. Conversion of previously vegetated land use to agriculture and built up areas continues up to the present, which contributed to the near critical status of the watershed; specifically approaching the PARFAC of 1.5 and stood at 1.45 in 2015. This implies that the stability of the land use/land cover of the Baroro River Watershed is continuously declining.
In addition, the number of agricultural patches increased and the mean patch size decreased over time. This indicates that more farms have encroached in the watershed and affected the general flow of ES. Changes in the landscape metrics over time can also be explained by the economic growth within the watershed, particularly in the middle and lower portions as it became urbanized.
The relationship between local knowledge and scientific data was distinctly manifested in the upstream section of the Baroro River Watershed. The communities within are more proximate to the forest and the people benefit from the various ES that the watershed provides on a daily basis. On the other hand. people from the middle and lower portions of the watershed benefit from specific ES such as water for irrigation and soil fertility for crop production; as these are the most visible services valued [
2,
58]. They do not recognize other ES such as maintenance of biodiversity and regulation of microclimate unlike those living in the upstream section. This is due to the fact that the people in both midstream and downstream areas have more opportunities at their disposal. They can easily get food from the market unlike those living in the upstream who rely on forests and wildlife for sustenance. Thus, knowledge about a certain ES also depends on the location, access to resources, and socioeconomic status [
17]. Historically, the conversion of forests to agricultural farms far outweighed the benefits that the watershed can provide since the value of ES coming from the watershed are less obvious and did not readily translate into monetary terms. This became the primary driver of land use conversion in the Baroro River Watershed.
Moreover, the loss of forest or tree cover in the middle section of the watershed as well as in the downstream communities coincides with the loss of knowledge about the ES from the watershed. An exception to this case are flooding and other natural disasters as people can easily relate to these adverse conditions, particularly in the upper watershed. When people experience the benefits or impacts of certain ES, they tend to put more value to a particular ES.
Tapping into this inherent knowledge may translate local knowledge into actions necessary to rehabilitate the Baroro River Watershed. Particularly, interventions to reconnect the different landscape fragments to regain what was lost in terms of species richness and other indicators of watershed health can be planned. As majority of the present generation has no recollection of what transpired in the past in terms of forest cover and landscape, which led to the current condition of the watershed, providing orientation or guidance on the benefits that one can derive from the watershed is of primary importance. In this manner, the communities can learn the importance of nature and value of the ES that it provides.
Nevertheless, the landscape fragmentation in the Baroro River Watershed did not only result from the breaking down of the watershed into patches, but also from a confluence of other factors such as fragmented governance, piecemeal policies, and unsustainable land management in the past. Lack of coordination, particularly among LGUs and community members on appropriate land uses in the watershed, has led to its current state. There was also lack of communication between national government agencies responsible for forestry and agriculture on how to manage the watershed landscape due to its varying and often overlapping mandates; as well as policies that were dysfunctional and not appropriate on the ground. This was evidenced by the increasing area of agriculture over time, particularly on inorganic farming and resulting to encroachment on forestlands. Also, as majority of the population in the watershed are migrants, land practices of indigenous groups are slowly becoming obsolete.
In addition, local knowledge about the ES in the watershed was evident from the results of the study’s FGDs, KIIs, and fragmentation analyses. Due to increased awareness based on the study’s results, there was a collective effort from the three LGUs to halt landscape fragmentation by initiating action to declare the Baroro River Watershed as a protected area. At this point, reconnection of fragments will start at the institutional level.
Lastly, this study showed that local knowledge on the history of land use in the watershed and the use of land use metrics provide complementary information in understanding the causes of fragmentation and its impacts to certain ES. Local people identified not only changes in the environment but also the time frame when these changes happened and its effect on livelihood. Land use metrics are therefore important inputs that can be used by decision makers to justify initiatives or plans, while local knowledge on ES can provide entry points for various initiatives on both watershed landscape rehabilitation and biodiversity conservation.
7. Conclusions
The current research is a preliminary attempt to establish a link between watershed landscape fragmentation and ES by integrating science and local knowledge as methods of analysis. Results provide scientific basis that the increasing fragmentation of the Baroro River Watershed highly compromised the condition of certain ES due to loss of ecosystem functions. This adds to the understanding of the relationship between watershed landscape fragmentation and its effects on the delivery of ES in the watershed, particularly in the tropics where similar studies are scant.
From 1940s to 2015, the forests of the Baroro River Watershed were lost to the expansion of agriculture and built up areas, and mostly evident in the middle and lower sections of the watershed based on land use metrics. Local knowledge from people living within the watershed confirmed this finding as they experienced the adverse impacts of land use conversion and watershed fragmentation through declining water supply, loss of biodiversity, incidence of pests and diseases, cases of floods and droughts, and worsening micro-climate. Reversing these conditions, however, requires more detailed studies on ecosystem functions as time delays govern the changes in ES [
14].
Given the increasing number of fragments in the watershed landscape, it is seemingly a daunting task to attain a contiguous and intact forest of 50,000 hectares in the near future; which is said to be the minimum requirement to ensure that watershed landscape and ecosystems are properly functioning [
59,
60]. For one, this will entail the rehabilitation of the entire Baroro River Watershed and adjacent watersheds to satisfy the area requirement. Understanding the dynamics of small patches is therefore of critical importance as it provides ES such as water quality regulation and carbon storage.
At the watershed level, “reconnecting” these fragments would allow for an increase in area where biodiversity can thrive and re-populate, creating biodiversity corridors. While local governments, farmers, and the private sector have already initiated reforestation initiatives in Baroro River Watershed, these efforts should be deliberately targeted to connect fragments and reduce edge effects. One possible solution is to have an integrated watershed landscape management plan anchored on the management of these fragments and with primary focus on sustainable land uses that address both the environment and social requirements towards a healthy watershed. To this end, the study proponents suggest the use of landscape metrics and historical land use analysis as framework for watershed management planning to help adequately explain the historical land use pattern and anticipate future impacts brought about by time lags in ES supply.
Fragmentation does not only happen at the biophysical level but also at the governance, policy, and management levels. It is not only a result of increasing population but rather of other factors such as uncoordinated watershed management between local governments and national government agencies, unsustainable land use policies and lack of awareness of stakeholders vis-à-vis the situation of the Baroro River Watershed that happened in the past. Similar with other watersheds in the country, the governance in the study area started when problems on increasing fragmentation and deforestation manifested itself through decreasing flow of ES readily felt by people. While actions had been taken by the national government, particularly the local DENR office and the communities upstream to plant trees, efforts to manage the development of midstream and downstream areas were neglected due to lack of coordinated planning. In most cases and not just in the Philippines but also in other tropical countries, forests are the main casualties of development. The challenge now is how to avert the further fragmentation of the watershed to ensure that ES will remain intact for future generations.
Results from this study posit that reconnection can happen by first addressing these institutional issues in the watershed. This is beginning to take shape in the Baroro River Watershed as different actors have realized that past actions contributed to the fragmentation of the watershed, and that they can manage their natural resources to arrest the declining levels of ES.
In addition, this proposed framework would also create social and institutional corridors that will tap existing resources coming from the different stakeholders in the watershed landscape. In this context, local knowledge on watershed resources and ES can be used as entry points for the process as well as in effectively crafting incentives and disincentives through policies at the local level. Determining the current appreciation of the various stakeholders of the watershed functions would help in crafting effective education campaign, especially among the younger generation, especially those who are seemingly detached from the natural environment.

 ,
, 


