Consumer Willingness and Acceptance of Smart Meters in Indonesia


1
Department of Operations Research, Faculty of Computer Science and Management, Wroclaw University of Science and Technology, 50-370Wrocław, Poland
2
Department of Management, Faculty of Economics and Business, University of Muhammadiyah Malang, Malang 65145, Indonesia
*
Author to whom correspondence should be addressed.
†
Current address: Wyb. Wyspianskiego 27, 50-370 Wroclaw, Poland.
Resources 2019, 8(4), 177; https://0-doi-org.brum.beds.ac.uk/10.3390/resources8040177
Submission received: 26 October 2019
/
Revised: 15 November 2019
/
Accepted: 22 November 2019
/
Published: 24 November 2019
Abstract
:Indonesia is the fourth most populous country in the world and is currently facing some challenges, such as pollution and a growing energy demand. One of the solutions to these problems is upgrading the electricity transmission and distribution system to avoid losses of energy, and encourage consumer engagement in energy saving as well as energy generation. The government of Indonesia has initiated projects for smart grids and advanced metering infrastructure (AMI), but consumer awareness and willingness to accept these new technologies is still uncertain. This study focused on analyzing consumers’ knowledge and willingness to accept one of the key components in grid modernization, being smart meters (SM). An online questionnaire was used to record responses from 518 social media users from different parts of Indonesia. The analysis shows that, among social media users who are seen as early adopters of technology, there is certainly a lack of awareness about SM, but they are largely open towards the acceptance of SM. Based on the findings, we have also drawn recommendations for energy companies, which would help in raising consumer awareness, as well as acceptance of SM in Indonesia.
1. Introduction and Literature Review
1.1. Sustainable Development of the Energy Markets and Power Systems
The 2030 Agenda for Sustainable Development was adopted by all United Nations Member States in 2015. This document provides 17 Sustainable Development Goals (SDGs), which should be implemented by all developed and developing countries, creating a global partnership (for more details, see https://sustainabledevelopment.un.org/sdgs (accessed on 29 September 2019)). Among the proposed SDGs, SDG 7 is ensure access to affordable, reliable, sustainable and modern energy for all, refers directly to the energy sector; SDG 9 is build resilient infrastructure, promote inclusive and sustainable industrialization and foster innovation; and SDG 12 is ensure sustainable consumption and production patterns, which are directly and indirectly related to the energy industry. Energy is also very important in other strategic documents, such as the 2030 Agenda for Sustainable Development and the Paris Agreement on Climate Change. Both documents emphasize that “ensuring access to affordable, reliable, sustainable and modern energy for all will open a new world of opportunities for billions of people, through new economic opportunities and jobs, empowered women, children and youth, better education and health, more sustainable, equitable and inclusive communities, and greater protections from, and resilience to, climate change” (https://sustainabledevelopment.un.org/topics/energy (accessed on 19 September 2019)). Furthermore, to achieve these ambitious goals, many of the partnering countries all over the world have proposed their own regulations and strategies, leading to increases in energy efficiency, a decrease of energy wastage and digitization of the power system [1,2,3,4,5].
The aim of those regulations is to provide a major transition of the existing power systems, traditionally based on the large power plants (nuclear or coal based), with a passive role of the consumers, towards sustainable and smart power grids, where communication among the market participants, i.e. energy generators, suppliers, sellers, and consumers, plays a major role. Within the smart grid (SG) concept, an implementation of advanced metering system (AMI) is required. This advanced IT and communication technology offers great opportunities to all market participants, leading to cost optimization and savings. AMI consists of an integrated system of smart meters (SM), communication networks, and data management systems that enables two-ways communication between utilities and customers.
The level and scope of transition of power system into smart grid, and the progress in introduction of AMI and SM is different in various countries or regions of the world. It is mainly due to the legislative and economic reasons. For example, in European Europe, based on the Directive 2012/27/EC on energy efficiency, the decision whether to exchange the traditional meters into smart ones is based on the long-term cost–benefit analysis made by the individual member states. In result, in countries such as Denmark, Sweden, or Spain, the introduction of AMI and the exchange of traditional meters into smart meters have been already finalized [3,5,6], whereas, in Ireland, Greece or the Czech Republic, it has not even started [7]. In many other countries all over the world, such as India, Indonesia, Turkey, or Brazil, this process has just begun or is going to begin soon [8,9,10].
There are many initiatives, such as the European Electricity Grid Initiative (EEGI) and European Strategic Energy Technology Plan (SETplan), Turkey Smart Grid 2023 Vision and Strategy Roadmap (TSG’2023), National Smart Grid Mission in India, or Making Indonesia 4.0, that encourage the sustainable transition of the power systems in terms of its economic, ecological, technical, and social aspects in the coming decades [8,11,12]. Each of those documents provides some milestones, hints how to achieve them, and indicators to verify the progress being made.
1.2. Indonesian Energy Sector
Within this paper, our attention is focused on Indonesia—the fourth most populated country in the world with 250 million of citizens—and its significant role as a major producer and consumer of energy in regional and international markets. The country is also the largest economy in the Association of South-East Asian Nations (ASEAN) and an active member of the G20 Summit. Indonesia is one of the world’s largest producers of natural gas and coal [13]; however, the renewable energy potential in Indonesia is also very high. Apart from solar, wind, and hydro energy, geothermal energy can also be harvested (for more details, see: https://www.nortonrosefulbright.com/en/knowledge/publications/0552a1f0/renewable-energy-snapshot-indonesia (accessed on 14 October 2019)).
The country experiences a rapid increase in electricity demand (up to 10–15% per year), which leads to the danger of blackouts, due to the insufficient energy supply and technical problems of low quality infrastructure in the Indonesian power system [14,15,16]. Indonesia belongs to those developing countries which are experiencing rapid economic growth combined with rising urbanization, and this leads to enormous pressures on the environment [13]. Nowadays, it is one of the most polluted countries in the world. Extremely poor air quality in Jakarta, the capital city of Indonesia, places Jakarta at the top of the list of most polluted places to live. According to the Energy Policy Institute at the University of Chicago, an increase in coal-fired power stations, burning of land for agriculture plantations, and a rising level of vehicle exhaustion fumes are responsible for the worsening pollution in Indonesia. If the air quality does not improve significantly, the life expectancy of Indonesians will drop drastically in the coming years.
The Ministry of Energy and the Ministry of Economic Affairs of the Indonesian government are aware of the current problems. One of the potential cures is the increase of energy efficiency in production and consumption of energy. Since 2014, the state-owned electricity company Perusahaan Listrik Negara (PLN), has been in the process of switching from the still dominating manual electricity meters to digital ones, using AMI technology. It is expected that the new system can be used by one million customers already in 2019. The installation of digital meters takes place, firstly, in big cities and tourist destinations, such as Jakarta, Bali, and Labuan Bajo in East Nusa Tenggara. The installation is free of charge, as the customers do not have to pay directly for the switch from manual to digital. The costs are borne by the PLN company. Due to the exchange of smart meters, energy wastage in generation, transmission, and consumption is expected to decrease.
Indonesia has received external support from organizations such as the Asian Development Bank (ABD) to overcome the challenges it is facing in the energy market. Since 2015, ABD has financed projects for the modernization and strengthening of electricity grids in Indonesia, such as the Sumatra Program (result-based $600 million project) (for more details, see: https://www.adb.org/projects/49080-001/main#project-overview and https://www.adb.org/sites/default/files/linked-documents/50016-001-pid.pdf). In 2017, ABD also approved a loan of $1.1 billion for strengthening and diversifying Indonesia’s energy sector, which is considered a key element to promote inclusive growth and sustainable development in the country. One of the key disbursement-linked indicators for these projects with ADB is the growth in the number of smart meters through the replacement of the current manual electricity meters. It is expected that 75% of consumers in the regions covered by the project would have SM installed by 2021. The base line taken at the time of disbursement of the load was 48% in 2016. According to the current status of the two smart grid projects in Selayar and Sangihe, 57.78% of consumers in those regions have SM already installed in their homes (for more details, see: https://www.adb.org/projects/50016-001/main#project-pds). Engaging the consumers, making them more aware about the features and uses of SM, and managing their electricity expenditures were also among the key program activities of these projects.
1.3. Indonesia 4.0 and Smart Meters
Not only in Indonesia, but all over the world, the implementation of smart grids and increase in the usage of renewable energy sources seems to be a promising cure to the current challenges of the power systems [4,17]. The role of advanced metering infrastructure (AMI) development, in general, and smart metering, in particular, may have a tremendous effect on the realization of some of the Sustainable Development Goals (SDGs) in the area of sustainable production and consumption in the energy sector through by the implementation of advanced technology that allows better control over one’s energy consumption (for more details, see: https://sustainabledevelopment.un.org/topics/energy (accessed on 20 October 2019)).
The realization of SDGs in the area of digitization of the industry, as emphasized by Hidayatno et al. [16], may also lead to a sustainable energy transition. The authors indicated that the fourth industrial revolution (Industry 4.0) is now believed to have significant relations with sustainable energy. The United Nations Industrial Development Organization (UNIDO), in its 2017 report, elaborated on the relevance between SDGs about sustainable energy and inclusive industry development. In that sense, Industry 4.0 and the sustainable energy transition share important concerns that can be interconnected to pursue a sustainable energy transition in the coming future [16].
Sustainable energy itself is defined to have two central components: renewable energy and energy efficiency. The latter is combined with the implementation of smart grids, together with the AMI system and including SM as its core component. The Indonesian government and the Ministry of Industry have released the road-map called Making Indonesia 4.0, in which they set some goals and priorities to be achieved by 2030 [18]. According to this document, Indonesia wants to become one of the Top 10 global economies by building strong manufacturing infrastructure by 2030 (see [16,18] for more details). Among the priorities mentioned in this document, National Priority Number 3 declares that Indonesia will accommodate the standards in sustainability, including that of energy consumption in industrial sectors [16].
Although the industrial sector is, without any doubt, very important, great attention must be also be paid to the residential consumers. Due to the significant changes and decentralization of energy production in most countries, this group has become an important player in the energy market [6,19,20,21,22]. Consumers’ activities in energy generation (i.e., by means of small-scale generators) and conscious control and reduction of energy consumption may bring positive effects to the whole power system. The question is, however, how to engage consumers and make them aware of the opportunities they have. Energy companies see this as one of the major challenges. In a 2017 report published by PwC, over 70% of energy companies emphasized that the management of expansion programs, including raising customer engagement and awareness, was a major impediment at that time and would still be significant even five years from then [23]. Major efforts, in this regard, are required to be undertaken, as the up-to-date literature reveals that consumers do not pay much attention to the energy market, unless they are motivated by financial, ecological, normative, or other incentives [24,25,26,27].
1.4. Current Findings from the Literature Review
The up-to-date literature reveals that, even if the idea of an energy transition into smart grids looks optimistic and brings many advantages, consumers’ engagement, interest, and acceptance are needed to achieve the ambitious goals regarding the increase of energy efficiency and reduction of environmental pollution and climate change [20,24,26,28,29]. Smart meters themselves are not very user friendly and offer much more benefits to the energy providers than the consumers. However, if SM is combined with some advanced enabling technologies, such as smart metering platforms (i.e., mobile apps or Internet widgets), in-home displays, smart plugs, or smart appliances, they automatically offer a spectrum of opportunities to the end-users of electricity. First, by offering feedback regarding energy consumption in real-time, they allow consumers to better understand their energy consumption and help them to increase their energy efficiency by lowering energy wastage [9,30,31,32]. The literature emphasizes that feedback received from SM about one’s energy consumption may create some behavioral change and lead to monitoring the amount of energy consumed and to the reduction in this consumption [28,30,31,33].
Based on the literature review, the following problems with SM deployment among consumers should be emphasized: (1) low-level of consumer awareness and knowledge [31]; (2) low level of consumer acceptance and, hence, engagement [20,34]; (3) concern regarding data privacy and security [27]; (4) lack of experience or technical feasibility regarding eco-feedback received through enabling technologies, such as smart metering platforms or in-home displays, and a lack of usefulness of SM from the consumers’ point of view [28,30,35,36,37]; and (5) improper or insufficient communication channels between the energy providers and their customers [17,32].
The current findings about the Indonesian SM deployment indicates that consumers’ expectations regarding the usefulness, ease of use, and risk of smart meters influence their attitudes and behaviors regarding smart meter adoption [14]. Moreover, as the authors of [9,14] revealed, perceived usefulness and ease of use from one side, and perceived risk from the other side, are the most important determinants of consumer acceptance of SM.
Within our study, we wanted to explore the points of view regarding SM of Indonesians even further, focusing on social media users, who are supposed to act as early adopters in further SM deployment in the energy market.
1.5. Research Questions and Aim of the Study
Taking all of that into consideration, within our study, we wanted to focus on Indonesian social media users and verify, first, their knowledge about SM and, second, their preferences and concerns, as well as their willingness to install SM under various conditions. We also aimed to explore the consumers’ communication channels in the energy market. We believe that the analysis of consumers’ preferences and communication channels may lead to constructive conclusions regarding further SM deployment.
Although SM acceptance and deployment have already been studied in various cultural and socioeconomic contexts, very few have referred or focused on the communication channels between end-users of electricity and energy companies (see, e.g., [17,38]), especially among social media users. As our study was based on the Roger’s model of innovation diffusion (DoI) [39], it paid great attention to the channels through which innovation, smart metering in this case, is spread. In the DoI model, not only do communication channels matter, but also time, the social network, and innovation attributes. We decided to explore the consumers’ acceptance of SM only among social media users, because, based on the literature, this group of consumers is predominated in usage of modern, Internet based technologies [40,41,42]. Moreover, we chose to conduct this study in Indonesia, where plenty of papers regarding the Indonesian renewable energy sector are available [15,43,44,45], but there are very few dealing with the deployment of smart meters in this region of the world [9,14].
Our survey contributes to the literature by further enriching the literature with the most recent consumer awareness levels and preferences regarding SM. In particular, our paper contributes to emphasizing that communication channels, both traditional and modern ones, cannot be neglected in the bilateral contacts between energy providers and consumers. Nowadays, consumers need to be informed, not only about the new opportunities they have in the energy market, but also must feel empowered to use them in order to make their energy consumption more efficient and sustainable.
The structure of the paper is as follows. After discussing in Section 1 the aspects of sustainable development in the context of energy transition into smart grids and presenting some current findings from the literature regarding SM adoption among consumers, the introduction of the Indonesian energy sector is provided. Then, in Section 2, the research and survey frameworks are presented, and the definitions of the variables are elaborated. In Section 3, the data collection and the sample are described. Section 4 presents and discusses the results of the analysis. Finally, Section 5 summarizes the findings.
2. Methods and Framework
2.1. Research Framework
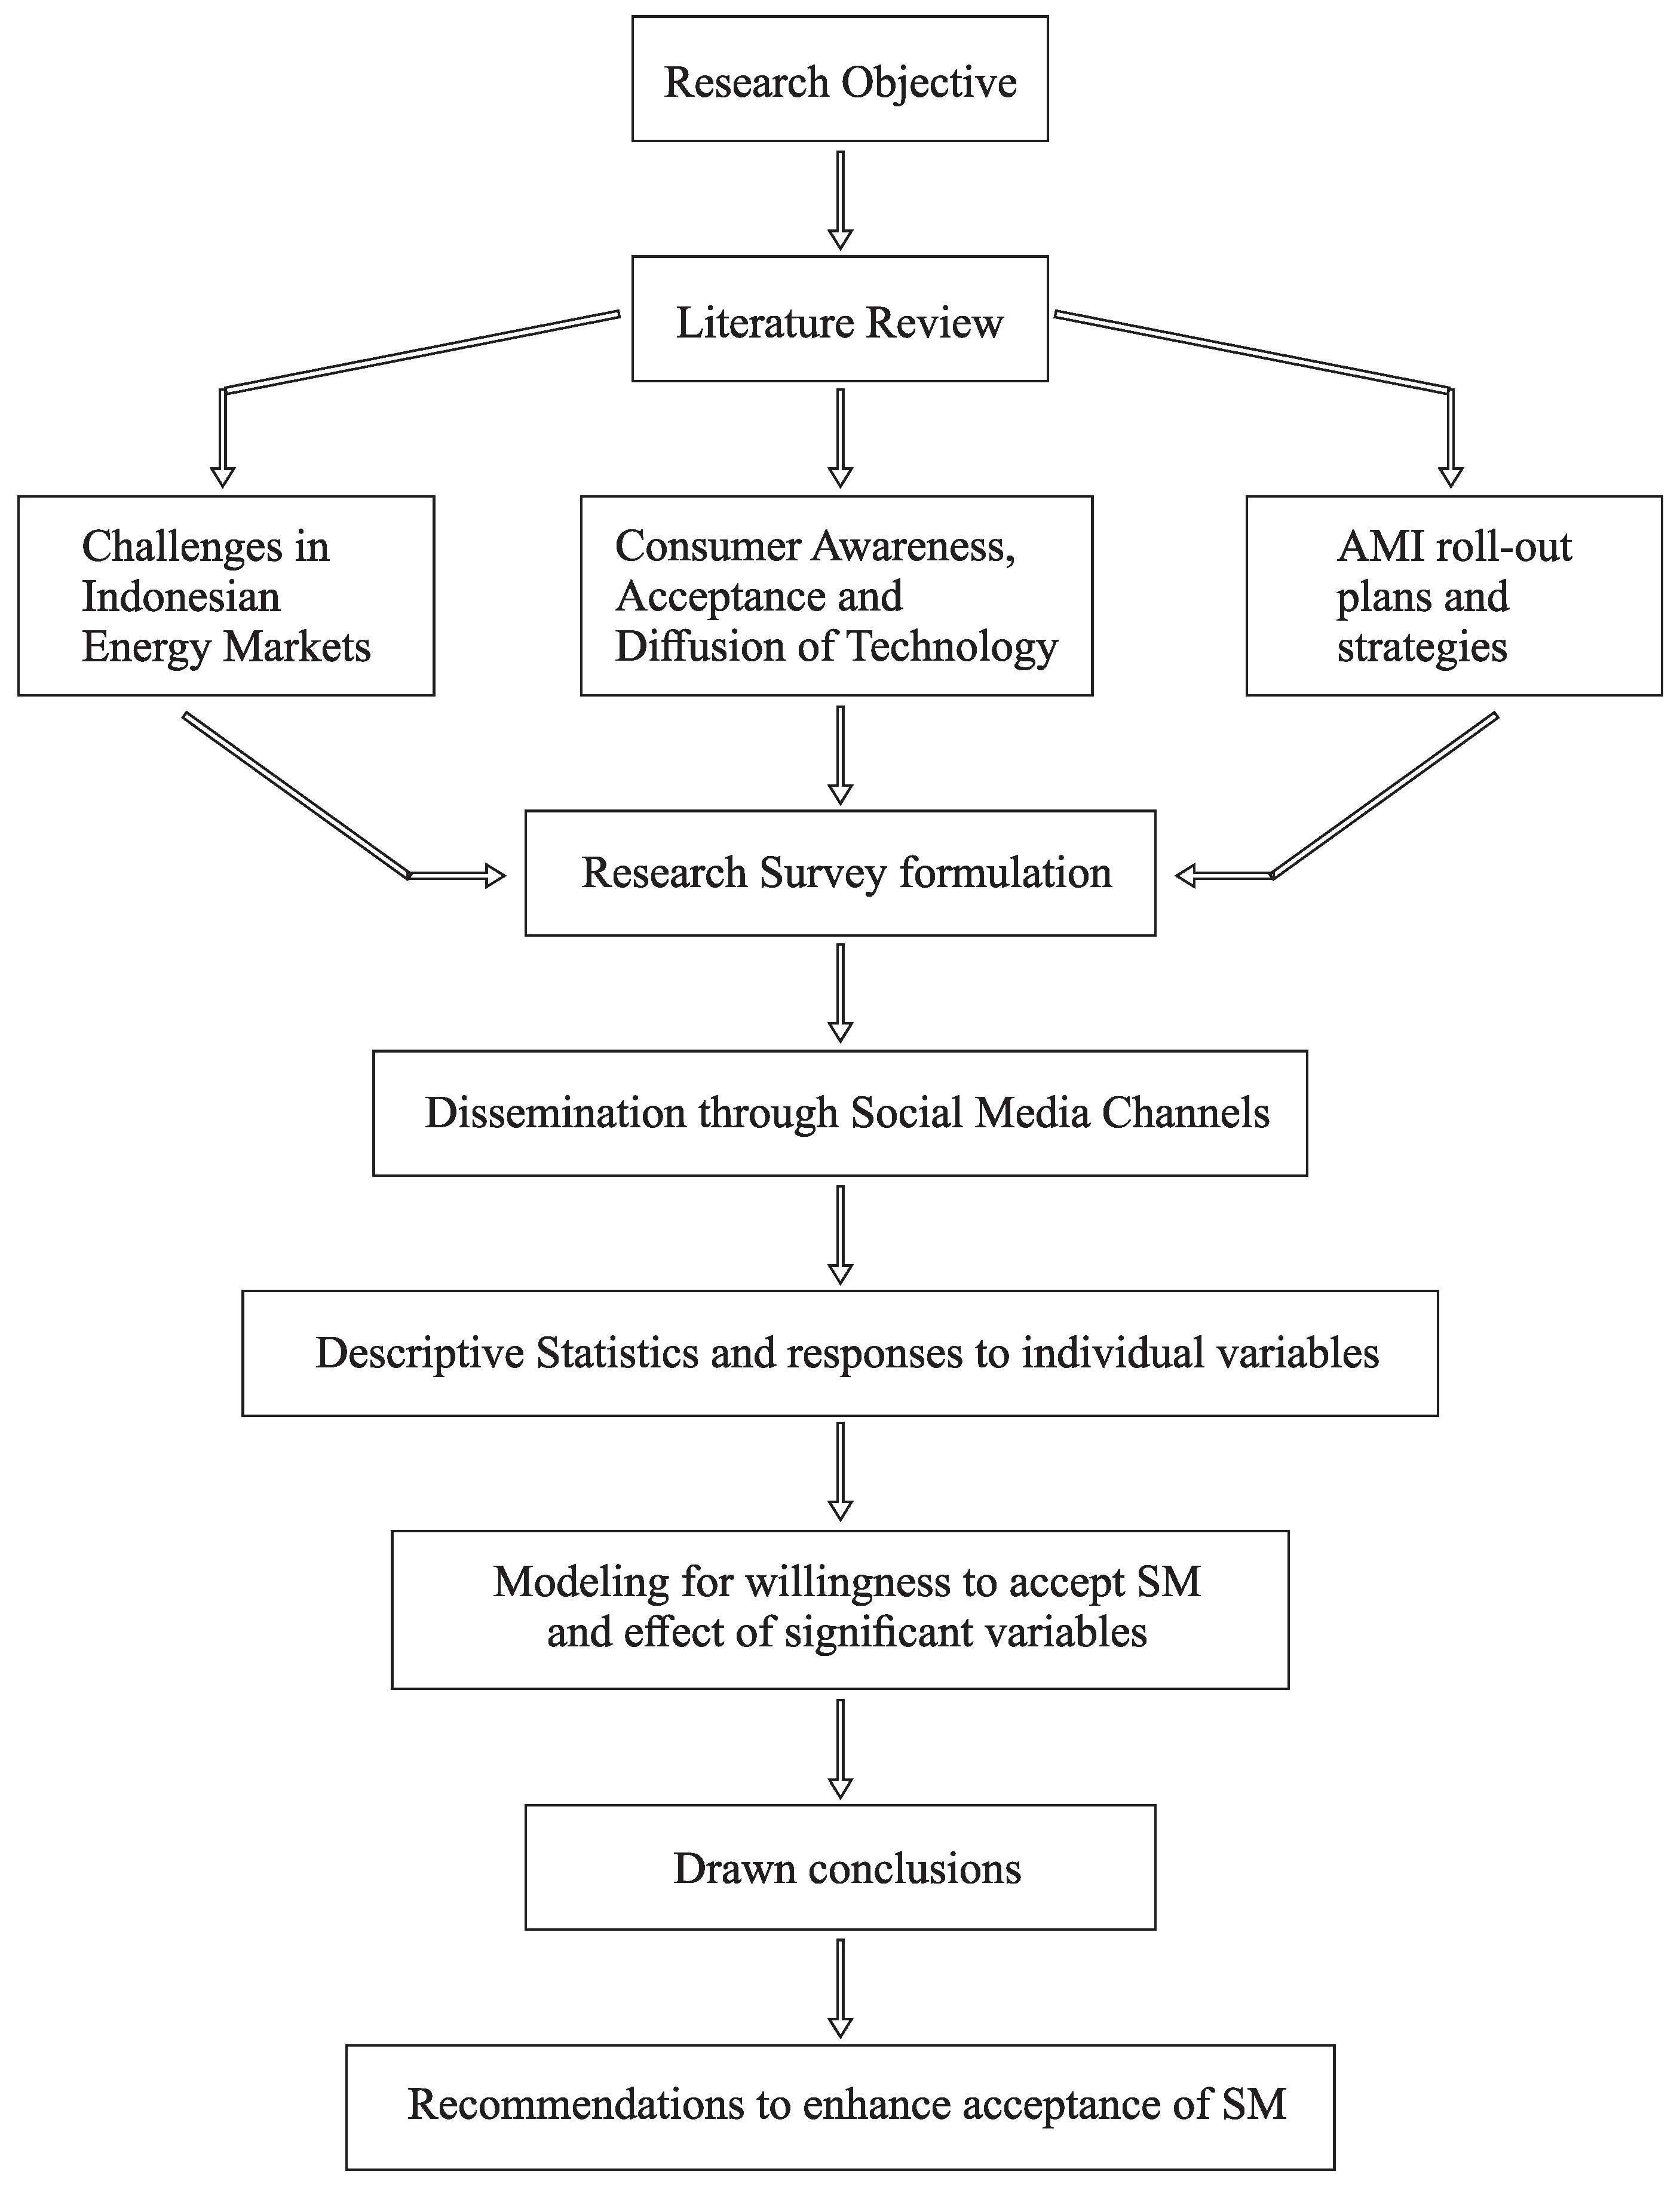
The literature analysis and the specifics of Indonesian challenges in their energy market and SM deployment allowed us to define the research objective. We aimed to investigate the consumers’ knowledge about SM and willingness to accept SM under various conditions. We also wanted to explore the consumers’ communication channels in the energy market. The findings from this study allowed us to provide some recommendations that can be used by energy companies to enhance the awareness and acceptance of SM in Indonesia.
Our research framework is shown in Figure 1. Once the objectives were decided, we carried out another extensive literature review. Several studies, reports, and new articles were studied about challenges in the Indonesian energy markets, pollution problems, consumer awareness, acceptance of technology, and AMI roll-out plans. Based on the findings from the literature and taking into account the previous studies, the framework of the survey questionnaire was formulated. The questionnaire was then disseminated through social media channels, as the opted target audience were the social media users. Once the data were collected, we conducted a descriptive analysis to gain a better understanding of our respondents. We especially paid attention to the communication channels they use (in particular, social media channels), channels through which they received information about electricity, information about SM (only for those who knew what SM was), and where they would look for information regarding SM. This was done through analyzing the independent responses to all variables, hence presenting a preliminary understanding of the consumers point-of-view. Thereafter, by using the Tobit regression models, we analyzed the willingness of the respondents to adopt SM under various conditions, followed by elaborating on the conclusions and recommendations to enhance further acceptance of SM.
From the methodological point of view, we based our study on the famous model of innovation diffusion (DoI) by Rogers [39]. DoI model pays great attention to the communication channels in spreading news about market novelties [32]. Apart from communication channels, the model takes into account: attributes of innovation, time, and a social network. Within the model, great emphasis is placed on the acceptance of innovation in society. Without such an acceptance, reaching of high adoption rates (i.e., market penetration) is not possible.
That is why, in our research framework, consumers’ awareness and acceptance are perceived as a key element of the diffusion of SM in the market.
2.2. Survey Framework
The proposed questionnaire was designed in three stages and consisted of several variables, as described in Table 1 and Table 2 respectively. The variables included in the survey were motivated by the literature and similar studies regarding consumers’ acceptance and preferences towards SM and other enabling technologies (see, e.g., [25,29,31,32,46,47]). The literature states that social and economic attributes are important for SM diffusion, but, additionally, the consumers’ knowledge, awareness, and preferences, as well as social influence, may play a role in SM diffusion. The questionnaire was divided into three stages, as shown in Table 1.
In the first stage, all respondents (N = 518) were asked about their demographic attributes, such as gender, age, educational qualification, household income, area of residence, and so on (D1–D12). Thereafter, they were asked about their preferred social media platforms (S01–S09), their possessions or belongings (B1–B7), the sources of information regarding electricity (S1–S15), potential use of renewable sources in their household (R1), and if they regularly monitored their electricity usage (R1). To check the respondents’ attitude and habits towards the conservation of the environment and energy, they were asked questions related to Variables A1, A2 and A31–A39. Further, the respondents were asked about their preferences (P1–P4), concerns (F1 and F4) and willingness to install SM under various conditions ( and ).
In the second stage, the respondents were asked if they knew what an SM was (K1). All respondents who said “No” or “Not Sure” to K1, were not asked any questions from the second stage and were directed to the third stage. Respondents who knew about SM (N1 = 129) were asked about the sources they received information about SM from (I1, I2, and I31–I35), preferences regarding the government’s role in SM roll out (G1–G3), additional concerns about SM (F2 and F3), whether they have, want to, plan to, or are in the process of installing SM in their home (K2–K4 and X1) and a verification question regarding their willingness to pay for SM (De5). In addition to the questions asked in this first stage and related to social influence, an additional question related to it (W1) was asked in this stage. These respondents (N1 = 129) were then directed to the third stage.
In the third stage, all respondents in the study (N = 518) were asked if they would want to know more details or collect more information on SM (Q1). The respondents who opted “No” or “Not sure” directly moved to submit their responses to the database. On the other hand, the respondents who showed a willingness (Q1 = 1) to know more about SM (N2 = 319) were asked about the communication channels where they would look for information regarding SM (Q21–Q25).
2.3. Data Collection and Sampling
A self-administered online anonymous questionnaire, hosted on a web page, was used to gather the primary data for carrying out this empirical quantitative study. The target pool of respondents included individuals residing in Indonesia (irrespective of nationality), who were responsible or co-responsible for making decisions in regards to managing the household. The survey was published at the beginning of August 2019 and data collection was completed with N = 518 responses a month later. We used two sampling techniques, one after the other, to recruit respondents for this study.
At first, a non-probability sampling method, convenience sampling, was used. In this phase, direct social connections via social media posts and personal messages or emails were used. In the second phase, snowball sampling was implemented, by reaching a wider range of respondents through those who participated in the first phase of the survey.
The questionnaire was made available in two languages, English and Indonesian (Bahasa). The questions, as well as the answer options, were exactly the same and had the same sequence as well. The user sessions, for the landing page from where users selected their language of choice and the webpages with the questionnaire, was tracked using Google Analytics (GA), to track the response rate. This did not effect the anonymity of the respondents, as the IP addresses of the respondents were not available to us through GA. In total, 1354 user sessions were recorded on the landing page, out of which 559 user sessions dropped out and did not continue to the questionnaire. Out of the 795 user sessions that went through to the questionnaires, 28 and 767 sessions were recorded on the web pages with English language and Indonesian language questionnaires, respectively. N = 518 valid responses were collected, 15 in English and 503 in Indonesian. While planning the survey framework, we deliberated over the number of responses that could be satisfactory for our study. From the literature, we observed that previous studies conducted through online questionnaires among social media users, had collected 300–500 responses. Hence, we aimed to get at-least 500 responses. Once the data were collected, they were translated to the English language for analysis.
3. Description of the Data
Through the questionnaire, we collected information regarding a number of variables, all of which are defined and coded in Table 2. The elaboration in regards to the variables, based on the collected responses are described in Section 3.1, Section 3.2, Section 3.3, Section 3.4, Section 3.5, Section 3.6, Section 3.7 and Section 3.8.
3.1. Demographics of the Respondents (D1–D10, D81)
Table 3 shows the statistical description of the variables, which explained the socioeconomic factors of the respondents. The majority of the sample was young, between the ages of 18 and 35 years, with a close balance between genders. Almost half of the respondents were married and the other half were single, with a small number (3.7%) of respondents being widowed or widowers. Respondents were well educated, with most possessing qualifications higher than a high school graduation or equivalent. A large part of the respondents were employed in the public/private sector or had their own business, while about a quarter of them were still students. The majority of the respondents had three or more members in their household, but 46.7% had no children. The most popular type of residence option was a house with no floors, followed by apartments or flats in a high rise building with more than four floors.
According to the annual report by “Hootsuite” and “We are Social” in 2019 (for more details, see: https://datareportal.com/reports/digital-2019-indonesia (accessed on 21 October 2019)), social media users comprise around 56% of Indonesia’s population, with an annual recorded growth rate of 15% in 2018. The demographic statistics of the collected sample were compared with the data for the whole country (for more details: https://www.cia.gov/library/publications/the-world-factbook/geos/id.html (accessed on 21 October 2019)), which yielded that the weight-age of various demographic variables in this study and their counterpart in the actual (for Indonesia) are largely similar. Due to this resemblance, this sample could be considered as representative for the country.
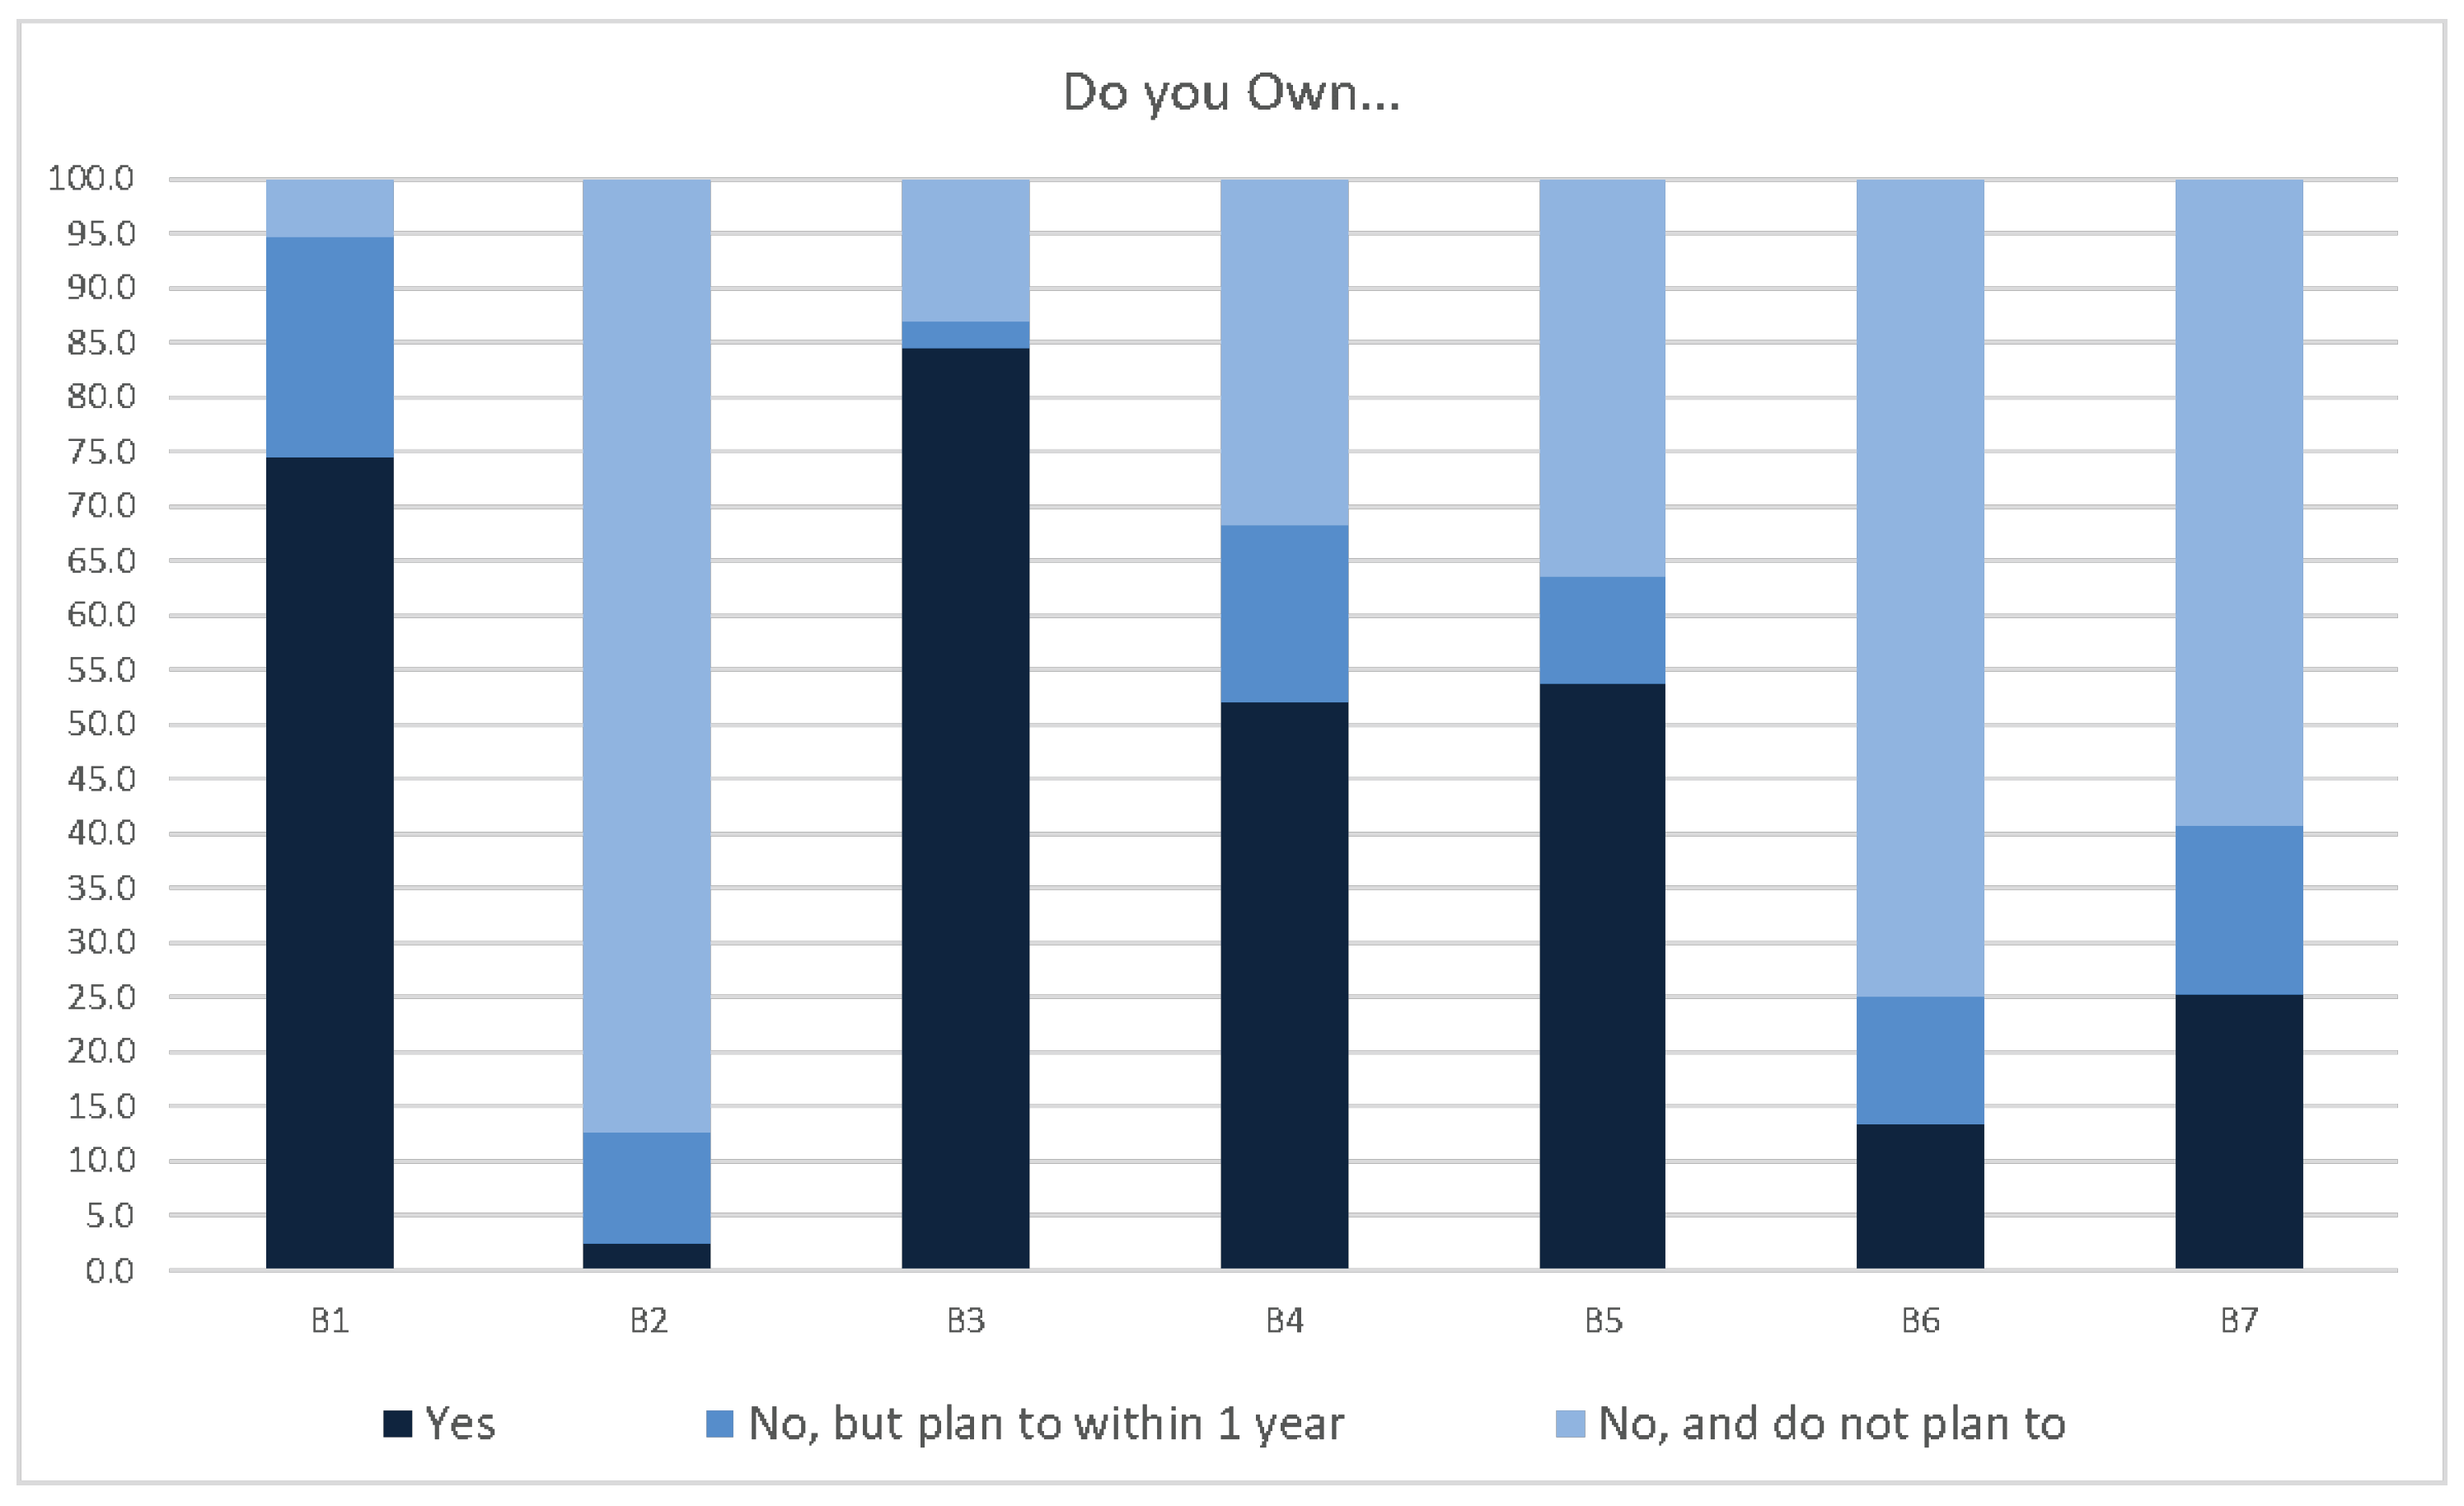
3.2. Belongings and Possessions of the Respondents (B1–B7)
Figure 2 shows the distribution of respondents’ various belongings and possessions. Among the most popular possessions were a house, laptop, WiFi/internet connection at home, and appliances that could connect to the Internet. The popularity of these possessions would still be higher in a year’s time, as a substantial number of respondents expressed a plan to buy these assets within a year. Owning a flat or apartment and electric vehicle were among the least popular, even though their numbers were also estimated to increase in a year. About 25% of respondents owned smart technologies that enabled the monitoring and control of energy consumption in the household, with around 15% of respondents having a plan to buy smart technologies within a year.
The distribution of consumers’ belongings of smart devices have been introduced in order to verify if people are already experienced with smart devices connected with Internet and enabling a real-time access via a mobile apps are also more open-minded towards SM installation [32]. Secondly, people having their own houses or apartments are usually supposed to be more eager to monitor their energy consumption, which could be done by means of the enabling technologies, such as smart metering platforms combined with SM [31]. The relation between belongings and respondents’ willingness to accept/install SM is verified in Section 4.1.
3.3. Communication Channels and Sources of Information (S01–S08, S1–S15, I1, I2, I31–I35, Q21–Q25)
Respondents were asked about various communication channels, in general, and source of information regarding electricity and SM, in particular. The recorded responses are shown in Table 4. Among the sources of information for electricity, TV news was the most popular, followed by conversations with friends, relatives, and colleagues; Whatsapp; and newspapers. For the sources regarding information about SM, the same channels were the most common. In addition, the respondents also indicated receiving some information regarding SM through Youtube and Facebook.
Out of N = 518 respondents, N2 = 319 respondents expressed a desire to look for more information regarding SM after participating in the survey (Q21–Q35). The following sources of information regarding SM were indicated by the respondents: TV news; friends, relatives, and colleagues; Facebook; WhatsApp; YouTube; and official government websites. A small number of respondents also indicated to look for information through search engines, radio, or Twitter and expressed an interest in attending workshops or educational sessions regarding SM.
The use of social media was quite popular among respondents, especially Facebook, Youtube, and Instagram. Although respondents revealed to receive some information regarding SM through Facebook and Youtube, none of the respondents indicated to get any information through Instagram, which was the most common social media platform. Additionally, the mean of the responses showed that there was further scope to extensively improve the diffusion of information regarding SM through social media. Based on the findings, we have made some recommendations regarding various perspectives to increase the knowledge and acceptance of SM in Indonesia in Section 5.
3.4. Attitudes towards Buying New Technology, the Environment and Energy Saving (A1, A2, A31–A39, R1)
The respondents were predominantly environmentally friendly, not in favor of buying new technology too frequently, and keeping track of their energy usage. Overall, 70.7% of respondents bought new technology once in over three years, while 58.9% bought a new mobile phone to keep up with the latest technology, once in over three years. This shows the trend for lasting and sustainable use of personal and home electronic gadgets. The majority of respondents regularly monitored their energy consumption (57.3%), having searched on the internet to know more about eco-friendly ways of living (67.4%), had returned home to check whether they turned off all home appliances or lights to save energy (67.8%), and have picked up trash left by someone else on the road side (79.5%). Some respondents also indicated to have paid more for energy efficient appliances (39%), to have re-used grocery bags (42.7%), and were following organizations or profiles on social media which promote energy saving (17.8%). The installation of equipment to harness renewable energy was found to be quite low, with 79.5% of respondents indicating to not have any such installation in their household.
3.5. Knowledge about SM, Stage of Installation and Social Influence (K1–K4, X1, W1)
Almost three quarters (74.9%) of respondents did not have any knowledge about SM and a small group, only 6.6%, had a SM installed in their home. The number of respondents who were in the process of installing a SM or had a plan to install a SM in their homes were also very low, 5.8% and 13.7%, respectively. At the same time, 17.4% of respondents expressed that they wanted to have SM in their homes; however, these were the respondents who knew what a SM was.
Social influence has a role to play in the dissemination of knowledge, as well as acceptance of smart meters [32] and, in this study, almost 30% of respondents who knew what a SM was indicated that their friends, relatives, or neighbors had a SM installed in their homes.
3.6. Preferences Regarding SM (P1–P4, G1–G3)
The preferences of respondents were found to be inline with the various features and benefits SM has to offer. A large majority of the respondents expressed a desire to receive more details about how they use electricity (76.3%), indicated that it would be useful for them to have real-time information about energy consumption (80.3%), and would like to have fluctuating unit rates of electricity during the day so that they can use more electricity when it is cheaper (55.8%). Almost two-thirds of the respondents (74.7%) preferred to be able to remotely turn on or off the electricity supply through their mobile phones. Respondents who knew what a SM was were asked about their preferences on government policies regarding SM. About 50% of these respondents were in favor of the government making SM installations mandatory in homes. On the other hand, a higher number of these respondents (67.7%) would prefer that the government would offer SM as an option, instead of making its installation mandatory. About 46% of these respondents also expressed that they would protest if they were not given an option to say no to SM.
3.7. Concerns and Fears about SM (F1–F4)
One of the concerns indicated by 69.7% respondents was the additional stress caused by the fluctuations in energy rates. Another concern was connected with data privacy, which was expressed by 40.7% of respondents. At the same time, 40.3% did not indicate any concern regarding it, whereas the rest were not sure if it would be a cause of concern for them. Among the respondents who had knowledge about SM, 63.7% said that SM would make the billing process more accurate and 57.8% felt that SM would not have any adverse effect on their health.
3.8. Willingness to Accept/Adopt SM (–)
Consumers’ acceptance of a certain technology is one of the main aspects of overall social acceptance of that technology. In Table 5, the willingness to install SM under various conditions, such as finance, health, face-to-face advice, and social influence, are shown. These results were further used to create models for each decision and to understand other factors affecting Decisions –.
4. Model, Results and Discussion
4.1. Modeling for Willingness and Acceptance of SM
Respondents were asked about their willingness to use or install smart meters under certain conditions (–). We assumed that the willingness expressed showed their acceptance towards the installation of SM in their household. To understand the various factors influencing the willingness expressed by the respondents in this study, we examined the regression of variables, with respect to the other variables, such as demographics, preferences, fears, and so on.
For this purpose, we constructed eight separate Tobit regression models, for each variable. These Tobit models, shown in Table 6, Table 7, Table 8, Table 9, Table 10, Table 11, Table 12 and Table 13, have a threshold of . Such a threshold emphasizes that the relation between positive (“yes”) answers to the given decision alternative and the rest of the explanatory variables is investigated. The Tobit model assumes that the class number is a linear function of some exogenous variables, as in Equation (2). As we wanted to focus on the positive answers on decision alternatives, the model became
where is a latent variable described by
where is an intercept, is a vector of exogenous variables excluding the constant, and as a residual.
The predictive capabilities of the model are as follows: for Model : Log likelihood −443.79 and Chi-square 180.63 (61) with p = 0.000; for Model : Log likelihood −408.505 and Chi-square 168.376 (61) with p = 0.000; for Model : Log likelihood −384.653 and Chi-square 168.598 (61) with p = 0.000; for Model : Log likelihood −621.393 and Chi-square 171.348 (61) with p = 0.000; for Model : Log likelihood −124.892 and Chi-square 100.148 (61) with p = 0.001; for Model : Log likelihood −522.172 and Chi-square 178.645 (61) with p = 0.000; for Model : Log likelihood −546.382 and Chi-square 192.802 (61) with p = 0.000; and for Model : Log likelihood −489.383 and Chi-square 192.286 (61) with p = 0.000. The value in the brackets accompanying the value of chi-square is the degree.
For each of Models –, only the variables which were statistically significant (p < 0.05) are show in Table 6, Table 7, Table 8, Table 9, Table 10, Table 11, Table 12 and Table 13, respectively, while the rest of the variables were discarded. The interpretations of the models are described below in Section 4.1.1, Section 4.1.2, Section 4.1.3, Section 4.1.4, Section 4.1.5, Section 4.1.6, Section 4.1.7 and Section 4.1.8.
4.1.1. Decision () to Install SM If It Would Help Save Money
When making a decision based on this condition, none of the demographic variables were found to be statistically significant. The model shows that users inclined towards spending more for energy efficient appliances and were more likely to favor the acceptance of SM if it would help save money. This indicated that they were ready to invest in energy saving appliances, expecting returns through savings, over a period of time. Preferences P3 and P4 were also found to be statistically significant for this decision, which suggested that the ability for users to turn the electricity supply on and off and fluctuating unit rates of electricity were positively co-related with this decision condition. Users expected to accept SM under this condition; however, they expressed a data privacy concern if the energy companies had access to the consumption data. Users interest to receive more information regarding SM was also positively co-related with this decision condition. Surprisingly, none of the communication channels were statistically significant for this model. The detailed statistics of this model, excluding the statistically insignificant variables, is shown in Table 6.
4.1.2. Decision () to Install SM If It Would Help Save Money but Might Have Adverse Effect on Health
According to the model, women seemed to share more concerns regarding their health, whereas men would be ready to accept SM, even if it might have adverse effects on their health. As for the communication sources, information received through energy companies would be highly positively evaluated, whereas searching on the internet was perceived negatively. One of the reasons for this might have been the lack of information suitable for the user to have a better understanding for SM, as there was a positive relation between attitudes towards searching on the internet for eco-friendly ways of living and the tendency to accept SM under this condition.
As in the model for Decision , positive attitudes towards paying more to buy higher energy efficient appliances had a positive relation with Decision but it had a higher impact and significance, as compared to Decision . The desire to look for more information regarding SM, receiving more details about electricity usage, and perceived usefulness of real-time information about energy consumption would lead to a positive decision under this condition. The detailed statistics of this model, excluding the statistically insignificant variables, is shown in Table 7.
4.1.3. Decision () to Install SM, If It Would Help Save Money, Had No Adverse Effect on Health but Companies Had Access to the Data of Energy Usage
The concern about data privacy (F1) was not found to be statistically significant, confirming the decision under the condition of this model. Moreover, this model revealed that, for such users, income and type of residence was negatively related with Decision . This suggested that consumers with lower incomes and smaller households would be more interested in accepting SM under this condition. Features of SM, such as real time information of energy consumption and the ability to remotely turn electricity on or off, contributed positively to this decision alternative. These consumers were also interested in receiving more information regarding SM. The detailed statistics of this model, excluding the statistically insignificant variables, is shown in Table 8.
4.1.4. Decision () to Install SM If Company Representatives Would Visit Homes and Explain All the Details
Table 9 shows the detailed statistics of this model, excluding the statistically insignificant variables. The model revealed the segment of consumers who were highly concerned about data privacy, which is denoted through the statically significant positive relations with the fear, F1, as well as the negative influence of using social media platforms, such as LinkedIn and SnapChat. Apart from the visitation of a company representative, these consumers also trusted newspapers as a source of information, as it had a positive relation with this alternative decision.
Consumers who owned a house were less likely to accept the installation of SM under this condition, whereas those who had a renewable energy source were more likely to accept the installation of SM, under this condition. The availability of remotely turning the electricity supply on or off also positively influenced this decision. These consumers were also interested in seeking more information regarding SM and this would increase the probability of acceptance of SM under this condition.
4.1.5. Decision () to Install SM Even If Upgrade to SM Was Not Free but Paid (N1 = 130)
This model took into account the respondents who indicated to have knowledge of SM and had the highest number of influencing factors that were statistically significant. Table 10 shows that men who were mildly educated were more likely to accept paying for SM. They used social media platforms and had a higher likelihood to accept SM from social peers. They would be less likely to attend any workshops or seminars of awareness campaigns but were interested to receive information regarding SM. A highly negative relation of this decision, with the habit of monitoring energy, indicated that, those consumers who did not have a habit of monitoring energy consumption would be willing to pay for a device such as SM, which would make it easier for them to monitor energy consumption. This was further confirmed through the positive relation with the variable P2, indicating that they perceived receiving real time usage of energy consumption to be useful. Having a renewable source of energy installed was an additional motivation to accept SM under this condition. The Indonesian consumer does not have to pay for SM in the current plan. However, the results of this model would be useful in the case that the consumer would have to pay for SM.
4.1.6. Decision () to Install SM If It Was a Free Upgrade
Consumers with a higher number of children and those owning a flat or an apartment were less likely to accept SM, even if it was free, but the likelihood increased if they had invested in energy saving appliances before. Providing more details about usage of electricity and emphasizing on the availability of real time information of energy consumption would have a positive influence for the acceptance of SM under this condition. Addressing the concern for data privacy with more details and giving reassurance would also increase the probability of SM acceptance. Providing more details through conventional marketing mediums, such as newspapers and micro-blogging platforms, such as Twitter, would also aid in enhancing the acceptance of SM. As Indonesian consumers currently do not have to pay to SM, the variable in this scenario would be more significant for them to address. The detailed statistics of this model, excluding the statistically insignificant variables, is shown in Table 11.
4.1.7. Decision () to Install SM If It Was Recommended by Friends/Relatives/Neighbors
Social influence was found to have a significant impact on the acceptance of technology. As the numbers in Table 12 show, consumers with higher household incomes were less likely to be influenced by social recommendations; however, if they possessed an attitude to pay more for energy saving appliances and were open to look for more information regarding SM, it would aid in increasing the acceptance of SM. Surprisingly, social recommendations through WhatsApp, search engines, LinkedIn, and SnapChat would have a negative influence on the acceptance of SM.
4.1.8. Decision () to Install SM If Friends/Relatives/Neighbors Installed It
Social influence, through the action of peers, would have an impact on consumers who had lower monthly expenses on electricity, were willing to pay a higher price for more energy efficient appliances, and had a tendency to upgrade their appliance after long periods. The assurance regarding data privacy would lead to a higher acceptance of SM, especially if it was communicated directly by energy companies. The perceived usefulness of real time information on energy consumption and the ability to control the flow of electricity remotely, by turning it on or off, had a positive and statistically significant impact on the acceptance of SM. Higher use of social media platforms would have a positive influence on the willingness to accept SM; however, Messenger users would be more skeptical about it. The detailed statistics of this model, excluding the statistically insignificant variables, is shown in Table 13.
5. Conclusions and Recommendations
Indonesia has abundant energy resources but still faces problems and challenges to fulfill the increasing demand for electricity. It also suffers from high pollution and enormous pressures on environmental impacts, due to the increase in the use of coal to produce electricity, as well as vehicular emissions, which is a threat to the life expectancy of Indonesians. Positive steps have been taken by the Indonesian government to counter these issues by aiming to increase energy efficiency and develop AMI.
To get the desired output, it is very important for consumers to have knowledge about smart meters—a major element of the AMI system, and to engage with interest and accept AMI applications. As per the recent studies in the literature, the outreach and communication was insufficient to increase the acceptance and awareness about SM for all segments of the population [17]. These studies also stated that the outreach and communication focusing on the benefits of SM for climate change would be particularly productive. Our study concentrated on the socioeconomic perspective for the willingness and acceptance of adopting SM by Indonesian residents. Initial descriptive statistics, regarding the willingness to accept or adopt, showed that consumers of different groups were very much in favor of accepting SM under various conditions, as shown in Table 5, with only a small number showing an unwillingness to accept SM. There were relatively high numbers of respondents who were “Not Sure” whether they were willing to accept SM.
Increasing the dissemination of detailed information regarding SM with the emphasis of its advantages and opportunities could shift the unsure consumer towards acceptance. This led us to our first recommendation, regarding creation of a briefing package for the consumers, in layman’s language, which would explain the details, features, and benefits of SM, before replacement of standard meters. The package could be through mobile applications, or a digital package, through email or even through a community briefing by a company representative. If the package addresses the statistically significant variables stated in our Models – elaborated in Section 4.1, it would help in increasing the consumers perceived usefulness of SM, as well as their acceptance and engagement. The package may also contain ready content, such as infographics or images with features/benefits of SM, that the consumers could share with their connections through the most popular messengers in Indonesia, such as, FB messenger, Line messenger, or WhatsApp (Table 4).
We were surprised to notice that respondents in this study were ready to accept SM, even if they were given a hypothetical situation where their electricity usage data could be accessed by energy companies, which was in contradiction with the finding by Chou et al. [9], stating that data privacy was one of the major concerns among consumers. The reason for this difference of opinion was that the study by Chou et al. [9] was conducted among the general population, whereas the current study was conducted among social media users. Regular social media users were seen as early adopters of new technology and the findings from this study also showed that they were more aware about privacy concerns as well.
This led us to the second recommendation, with regards to the target audience for raising the awareness and knowledge about SM. It would be fruitful to aim for dissemination to social media users first, due to the ease with which they can be reached at the relatively lower cost. This target group (i.e., social media users) includes 56% of Indonesia’s populations and is growing quickly.
We found that social influence among lower and middle class communities, which form the majority of Indonesia’s population, would have a high impact on the acceptance of SM. The snowball effect, through personal and social connections, online or offline, of social media users, would enhance the required outcome manifold. Currently, PLN—the national electricity company undertaking the roll-out of SM—has profiles/pages on social media platforms and a certain number of followers (Facebook, more than 10,000; LinkedIn, 46,279; and YouTube, more than 5680) but there are no activities or engagement with the consumers. On YouTube, certain videos have been shared, whereas, on Facebook, the last activity was in 2010 and no posts on LinkedIn were observed. Utilizing the existing network, through activities and engagement, while growing the network on other social media platforms would be quite effective for increasing the acceptance of SM.
The results from the modeling, for willingness to accept SM, revealed various factors that would play an important role in the acceptance of SM under certain conditions. As the consumer in Indonesia does not have to pay for upgrading to SM, according to the current policy, emphasis on factors, such as energy saving resulting in savings on the cost of electricity and how the consumers could achieve it, would push the consumer towards accepting SM.
The models also revealed that, for certain consumers, data privacy was still a concern but, as the responses to the Variables – indicated, even with this concern, consumers would be willing to accept SM. Addressing the data privacy concern through the visitation of a company representative or social influence through friends, family, and peers, would further enhance the acceptance of SM. Social influence was found to be a vital factor that would increase the acceptance of SM. Attitudes of the consumers towards energy efficient purchases or willingness to pay more for energy saving appliances had a major direct effect on the consumer’s acceptance of SM.
Even though the study was conducted among social media users, the importance of dissemination of information through conventional channels, such as newspapers, TV news, radio, and direct communication through energy companies, has shown itself to be highly effective. Findings from the literature (see [17]), as well as our findings, showed that there was a very low level of consumer awareness regarding AMI, in general, or SM, in particular, and communication channels had a huge role to play in this part. Social media was especially significant, as over 56% of the Indonesian population was active on social media and the dissemination of information through social media channels is relatively easier, less time consuming, and cost effective [48].
Based on these findings, our third recommendation is regarding communication channels for raising awareness and knowledge among consumers regarding SM. The use of digital media, not just social media, and conventional marketing channels would prove to be effective in reaching out to a greater number of customers. The reason for this recommendation is the choice of channels selected by the respondents in this study, which suggested that they would like to receive information by searching online, through TV news, newspapers and so on, apart from social media platforms. We also recommend having articles on the most visited news websites (Table 4), such as tribunnews.com, detik.com, liputan6.com, kompas.com, sindonews.com, okezone.com, idntimes.com and so on. These articles could compliment the briefing package we suggested in the first recommendation.
6. Limitations and Future Scope of Research
There are certain limitations to this study, although vigorous efforts were made to expand the scope of this research. Respondents were located from almost all regions of Indonesia in this study, but we did not consider the regional effect on the willingness or the knowledge of SM. Further in-depth research could be conducted independently in different regions of Indonesia and a comparative analysis of these regions would help to get more refined results of this study, specifically for individual regions. The future scope of this research also encompasses the testing of communication channels and their significance through awareness campaigns, which would show the responsiveness of the consumer to various channels.
Author Contributions
Y.C. conceived and designed the survey; A.K.-P. reviewed the design of the survey; W.W. translated the questionnaire and the collected data into Indonesian; Y.C. created and managed the online questionnaire; W.W. collected the data through the online questionnaire; Y.C. analyzed the data; A.K.-P. reviewed the literature; A.K.-P. and Y.C. drafted and edited the paper; and A.K.-P. and Y.C. reviewed the paper.
Funding
This work was supported by the Faculty of Computer Science and Management, Wrocław University of Science and Technology from funds of the Ministry of Science and Higher Education subsidy in the part devoted to conducting research activities in 2019.
Conflicts of Interest
The authors declare no conflict of interest.
Abbreviations
The following abbreviations are used in this manuscript:
| AMI | Advanced Metering Infrastructure |
| PLN | Perusahaan Listrik Negara |
| SM | Smart Meters |
| SG | Smart Grids |
| SDGs | Sustainable Development Goals |
References
- Fadaeenejad, M.; Saberian, A.; Fadaee, M.; Radzi, M.; Hizam, H.; AbKadir, M. The present and future of smart power grid in developing countries. Renew. Sustain. Energy Rev. 2014, 29, 828–834. [Google Scholar] [CrossRef]
- Barrios-O’Neill, D.; Schuitema, G. Online engagement for sustainable energy projects: A systematic review and framework for integration. Renew. Sustain. Energy Rev. 2016, 54, 1611–1621. [Google Scholar] [CrossRef]
- Crispim, J.; Braz, J.; Castro, R.; Esteves, J. Smart Grids in the EU with smart regulation: Experiences from the UK, Italy and Portugal. Util. Policy 2014, 31, 85–93. [Google Scholar] [CrossRef]
- Nizetic, S.; Djilali, N.; Papadopoulos, A.; Rodrigues, J. Smart technologies for promotion of energy efficiency, utilization of sustainable resources and waste management. J. Clean. Prod. 2019, 231, 1–10. [Google Scholar] [CrossRef]
- Zhou, S.; Brown, M. Smart meter deployment in Europe: A comparative case study on the impacts of national policy schemes. J. Clean. Prod. 2017, 144, 22–32. [Google Scholar] [CrossRef]
- Avancini, D.; Rodrigues, J.; Martins, S.; Rabêlo, R.A.L.; Al-Muhtadi, J.; Solic, P. Energy meters evolution in smart grids: A review. J. Clean. Prod. 2019, 217, 702–715. [Google Scholar] [CrossRef]
- Chawla, Y.; Kowalska-Pyzalska, A.; Silveira, P. Marketing and Communications Channels for Diffusion of Smart Meters in Portugal; Working Paper; Hugo Steinhaus Center, Wroclaw University of Technology HSC Research Reports HSC/19/; Wrocław University of Science and Technology: Wroclaw, Poland, 2020. [Google Scholar]
- Bhatt, J.; Jani, O. Smart Development of Ahmedabad-Gandhinagar Twin City Metropolitan Region, Gujarat, India; Springer: Singapore, 2019; pp. 313–356. [Google Scholar]
- Chou, J.; Kim, C.; Ung, T.; Novi Yutami, G.; Lin, G.; Son, H. Cross-country review of smart grid adoption in residential buildings. Renew. Sustain. Energy Rev. 2015, 48, 192–213. [Google Scholar] [CrossRef]
- Acharjee, P. Strategy and implementation of Smart Grids in India. Energy Strateg. Rev. 2013, 1, 193–204. [Google Scholar] [CrossRef]
- Biresselioglu, M.; Nilsen, M.; Demir, M.; Royrvik, J.; Koksvik, G. Examining the barriers and motivators affecting European decision makers in the development of smart and green energy technologies. J. Clean. Prod. 2018, 198, 417–429. [Google Scholar] [CrossRef]
- Colak, I.; Bayindir, R.; Fulli, G.; Tekin, I.; Demirtas, K.; Covrig, C.F. Smart grid opportunities and applications in Turkey. Renew. Sustain. Energy Rev. 2014, 33, 344–352. [Google Scholar] [CrossRef]
- Dutu, R. Challenges and policies in Indonesia’s energy sector. Energy Policy 2016, 98, 513–519. [Google Scholar] [CrossRef]
- Chou, J.; Novi Yutami, G. Smart meter adoption and deployment strategy for residential buildings in Indonesia. Appl. Energy 2014, 128, 336–349. [Google Scholar] [CrossRef]
- Maulidia, M.; Dargusch, P.; Ashworth, P.; Ardiansyah, F. Rethinking renewable energy targets and electricity sector reform in Indonesia: A private sector perspective. Renew. Sustain. Energy Rev. 2019, 101, 231–247. [Google Scholar] [CrossRef]
- Hidayatno, A.; Rahmawan Destyanto, A.; Arauna Hulu, C. Industry 4.0 Technology Implementation Impact to Industrial Sustainable Energy in Indonesia: A Model Conceptualization. Energia Procedia 2019, 156, 227–233. [Google Scholar] [CrossRef]
- Bugden, D.; Stedman, R. A synthetic view of acceptance and engagement with smart meters in the United States. Energy Res. Soc. Sci. 2019, 47, 137–145. [Google Scholar] [CrossRef]
- Perindustrian, K. Making Indonesia 4.0; Ministry of Industry, Republic of Indonesia: Jakarta, Indonesia, 2018.
- Frederiks, E.; Stenner, K.; Hobman, E. Household energy use. Applying behavioral economics to understand consumer decision making and behavior. Renew. Sustain. Energy Rev. 2014, 41, 1385–1394. [Google Scholar] [CrossRef]
- Ellabban, O.; Abu-Rub, H. Smart grid customers’ acceptance and engagement: An overview. Renew. Sustain. Energy Rev. 2016, 65, 1285–1298. [Google Scholar] [CrossRef]
- Geelen, D.; Reinders, A.; Keyson, D. Empowering the end-user in smart grids: Recommendations for the design of products and services. Energy Policy 2013, 61, 151–161. [Google Scholar] [CrossRef]
- Hyysalo, S.; Johnson, M.; Juntunen, J. The diffusion of consumer innovation in sustainable energy technologies. J. Clean. Prod. 2017, 162, S70–S82. [Google Scholar] [CrossRef]
- Kamarudin, Y.; Boothman, T. Powering the Nation: Indonesian Power Industry Survey. 2017. Available online: https://www.pwc.com/id/en/energy-utilities-mining/assets/power/power-survey-2017.pdf (accessed on 14 November 2019).
- Kowalska-Pyzalska, A. What makes consumers adopt to innovative energy sources in the energy market? A review of incentives and barriers. Renew. Sustain. Energy Rev. 2018, 82, 3570–3581. [Google Scholar] [CrossRef]
- Kahma, N.; Matschoss, K. The rejection of innovations? Rethinking technology diffusion and the non-use of smart energy services in Finland. Energy Resour. Soc. Sci. 2017, 34, 27–36. [Google Scholar] [CrossRef]
- Verbong, G.P.J.; Beemsterboer, S.; Sengers, F. Smart grids or smart users? Involving users in developing a low carbon electricity economy. Energy Policy 2013, 52, 117–125. [Google Scholar] [CrossRef]
- Good, N.; Ellis, K.; Mancarella, P. Review and classification of barriers and enablers of demand response in the smart grid. Renew. Sustain. Energy Rev. 2017, 16, 57–72. [Google Scholar] [CrossRef]
- Schleich, J.; Faure, C.; Klobasa, M. Persistence of the effects of providing feedback alongside smart metering devices on household electricity demand. Energy Policy 2017, 107, 225–233. [Google Scholar] [CrossRef]
- Krishnamutri, T.; Schwartz, D.; Davis, A.; Fischoff, B.; de Bruin, W.B.; Lave, L.; Wang, J. Preparing for smart grid technologies: A behavioral decision research approach to understanding consumer expectations about smart meters. Energy Policy 2012, 41, 790–797. [Google Scholar] [CrossRef]
- Foulds, C.; Robison, R.; Macrorie, R. Energy monitoring as a practice: Investigating use of the iMeasure online energy feedback tool. Energy Policy 2017, 104, 194–202. [Google Scholar] [CrossRef]
- Kowalska-Pyzalska, A.; Byrka, K. Determinants of the willingness to energy monitoring by residential consumers: A case study in the city of Wroclaw in Poland. Energies 2019, 12, 907. [Google Scholar] [CrossRef]
- Chawla, Y.; Kowalska-Pyzalska, A. Public awareness and consumer acceptance of smart meters among Polish social media users. Energies 2019, 12, 2759. [Google Scholar] [CrossRef]
- Buchanan, K.; Russo, R.; Anderson, B. Feeding back about eco-feedback: How do consumers use and respond to energy monitors? Energy Policy 2014, 73, 138–146. [Google Scholar] [CrossRef]
- Wolsink, M. Distributed generation for sustainable energy as a common pool resource: Social acceptance in rural setting of smart (micro-) grid configurations. In New Rural Spaces: Towards Renewable Energies, Multifunctional Farming, and Sustainable Tourism; Frantal, B., Martiant, S., Eds.; University of Amsterdam: Amsterdam, The Netherlands, 2014; pp. 36–37. [Google Scholar]
- Burchell, K.; Rettie, R.; Roberts, T. Householder engagement with energy consumption feedback: The role of community action and communications. Energy Policy 2016, 88, 178–186. [Google Scholar] [CrossRef]
- Ma, G.; Lin, J.; Li, N. Longitudinal assessment of the behavior-changing effect of app-based eco-feedback in residential buildings. Energy Build. 2018, 159, 486–494. [Google Scholar] [CrossRef]
- Vassileva, I.; Campillo, J. Consumers’ perspective on full-scale adoption of smart meters: A case study in Västerås, Sweden. Resources 2016, 5, 3. [Google Scholar] [CrossRef] [Green Version]
- Nachreiner, M.; Mack, B.; Matthies, E.; Tampe-Mai, K. An analysis of smart metering information systems: A psychological model of self-regulated behavioral change. Energy Res. Soc. Sci. 2015, 9, 85–97. [Google Scholar] [CrossRef]
- Rogers, E. Diffusion of Innovations, 5th ed.; Free Press: New York, NY, USA, 2003. [Google Scholar]
- Sheau-Ting, L.; Mohammed, A.; Weng-Wai, C. What is the optimum social marketing mix to market energy conservation behaviour: An empirical study. J. Environ. Manag. 2013, 131, 196–205. [Google Scholar] [CrossRef] [PubMed]
- Hudson, S.; Huang, L.; Roth, M.; Madden, T.J. The influence of social media interactions on consumer–brand relationships: A three-country study of brand perceptions and marketing behaviors. Int. J. Res. Mark. 2016, 33, 27–41. [Google Scholar] [CrossRef]
- Alalwan, A.; Rana, N.; Dwivedi, Y.; Algharabat, R. Social media in marketing: A review and analysis of the existing literature. Telemat. Inf. 2017, 34, 1117–1190. [Google Scholar] [CrossRef] [Green Version]
- Burke, P.; Widnyana, J.; Anjum, Z.; Aisbett, E.; Resosudarmo, B.; Baldwin, K. Overcoming barriers to solar and wind energy adoption in two Asian giants: India and Indonesia. Energy Policy 2019, 132, 1216–1228. [Google Scholar] [CrossRef]
- Kennedy, S. Indonesia’s energy transition and its contradictions: Emerging geographies of energy and finance. Energy Res. Soc. Sci. 2018, 41, 230–237. [Google Scholar] [CrossRef]
- Al Irsyad, M.; Halog, A.; Nepal, R. Estimating the impacts of financing support policies towards photovoltaic market in Indonesia: A social-energy-economy-environment model simulation. J. Environ. Manag. 2019, 230, 464–473. [Google Scholar] [CrossRef]
- Gerpott, T.; Paukert, M. Determinnants of willingness to pay for smart meters: An empirical analysis of household customers in Germany. Energy Policy 2013, 61, 483–495. [Google Scholar] [CrossRef]
- Paetz, A.G.; Duetschke, E.; Fichtner, W. Smart homes as a means to sustainable energy consumption: A study of consumer perceptions. J. Consum. Policy 2012, 35, 23–41. [Google Scholar] [CrossRef]
- Chodak, G.; Chawla, Y.; Dzidowski, A.; Ludwikowska, K. The Effectiveness of Marketing Communication in Social Media. In ECSM 2019 6th European Conference on Social Media; Academic Conferences and Publishing Limited: Sonning Common, UK, 2019; p. 73. [Google Scholar]
Figure 1.
Research framework and flow of the study.

Figure 2.
Distribution of respondent’s belongings of smart devices and personal assets, where: B1, a house; B2, flat or apartment; B3, a laptop; B4, a WiFi /internet connection at home; B5, home appliances that can connect to the internet; B6, electric vehicle; B7, smart technologies that enable monitoring or control of energy consumption at home.


Table 1.
Survey Framework with different variables at each stage.
| The Survey Framework | ||
|---|---|---|
| Stage 1 | D1–D12 | |
| A1–A2, A31–A39 | ||
| B1–B7 | ||
| S01–S09 | ||
| S1–S15 | ||
| R1 | ||
| P1–P4 | ||
| F1,F4 | ||
| De1–De4, De6–De8 | ||
| Stage 2 | K1: Do you know what is an “Electricity Smart Meter”? | |
| Yes | No/Not Sure | |
| I1, I2, I31–I35 | ||
| K2–K4 | ||
| G1–G3 | ||
| De5 | ||
| X1 | ||
| Stage 3 | Q1: Would you search for more information about Electricity Smart Meters ? | |
| Yes | No/Not Sure | |
| Q21–Q25 | ||
Table 2.
Definitions of the variables and coding (N = 518).
| Variable | Code | Description |
|---|---|---|
| Gender | D1 | nominal variable |
| Age | D2 | ordinal variable |
| Relationship status | D3 | nominal variable |
| Highest Educational Qualification | D4 | ordinal variable |
| Occupation/Employment | D5 | nominal variable |
| Collective Household Income (in Indonesian Rupiah per month) | D6 | interval variable |
| Range of electricity bill (in Indonesian Rupiah per month) | D7 | interval variable |
| Total members in the household | D8 | ordinal variable |
| Number of children | D81 | ordinal variable |
| Type of house | D9 | nominal variable |
| Place of living | D10 | ordinal variable |
| Belongings (of smart devices and personal assets) | B1–B7 | (1) yes/(2) no, but I plan to buy it within one year/(3) no, and I do not plan to buy it |
| Behavior towards buying new technology | A1–A2 | (1) I buy thrice or more per year/(2) I buy twice per year/(3) I buy once in a year/(4) I buy once every two years/(5) I buy once in more than three years |
| Behavior towards environment and energy saving | A31–A39 | (1) yes/ (2) no |
| Renewable energy sources installed at the household | R1 | (1) yes/(2) no/(3) uncertain |
| Social media platforms commonly used | S01–S09 | nominal variable |
| Source of information regarding electricity (prices, new offers, etc.) | S1–S15 | nominal variable |
| Knowledge about SM | K1–K4 | (1) yes/(2) no/(3) uncertain |
| Source of information regarding SM | I1, I2, I31–I45 | (1) yes/(2) no/(3) uncertain |
| Social influence | W1 | (1) yes/(2) no/(3) uncertain |
| Preferences regarding the role of the government in SM enrollment | G1–G3 | (1) yes/(2) no/(3) hard to say |
| Preferences regarding SM platforms | P1–P4 | (1) yes/(2) no/(3) uncertain |
| Concerns about SM usage | F1–F4 | (1) yes/(2) no/(3) uncertain |
| Willingness to have one’s home to be equipped with SM | X1 | (1) yes/(2) no/(3) uncertain |
| Decisions to install SM | – | (1) yes/(2) no/(3) hard to say |
| Willingness to search or collect more information regarding SM | Q1 | (1) yes/(2) no/(3) uncertain |
| Source of Information preferred to search or collect more information regarding SM | Q21–Q25 | (1) yes/(2) no |
Table 3.
Frequencies of the demographic variables (D1–D10 and D81).
| Variable | Frequencies |
|---|---|
| (D1) Gender | Male (46.3%) |
| Female (53.7%) | |
| (D2) Age | 18–25 years old (41.9%) |
| 26–35 years old (22.4%) | |
| 36–45 years old (10.2%) | |
| 46–55 years old (19.3%) | |
| 56–65 years old (5.8%) | |
| 66+ years old (0.4%) | |
| (D3) Relationship status | Single (46.5%) |
| Married (49.8%) | |
| Widowed or Widower (3.7%) | |
| (D4) Highest Educational Qualification | Elementary School (2.7%) |
| Junior High School or Equivalent (4.8%) | |
| High school graduation or equivalent (18.9%) | |
| Completed Diploma (3.7%) | |
| Graduate (44.6%) | |
| Master’s Degree (19.5%) | |
| PhD Complete (5.8%) | |
| (D5) Occupation/Employment | Job in Private Sector (37.6%) |
| Job in Public Sector (10.6%) | |
| Business (14.1%) | |
| Student (25.3%) | |
| Unemployed (10.4%) | |
| Retired (1.9%) | |
| (D6) Collective Household Income (in Indonesian Rupiah per month) | Under Rp. 1 million (14.5%) |
| Rp. 1 million to 1.5 million (14.3%) | |
| Rp. 1.5 to Rp. 2 million (10.8%) | |
| Rp. 2 million to Rp. 3 million (12.5%) | |
| Rp. 3 million to Rp. 5 million (16.2%) | |
| Rp. 5 million to Rp. 7.5 million (14.9%) | |
| More than Rp. 7.5 million (16.8%) | |
| (D7) Range of electricity bill (in Indonesian Rupiah per Month) | Not more than Rp. 50,000 (6.4%) |
| Rp. 50,000 to Rp. 100,000 (16.8%) | |
| Rp. 100,000 to Rp. 150,000 (19.7%) | |
| Rp. 200,001 to Rp. 250,000 (20.1%) | |
| Rp. 250,001 to Rp. 300,000 (8.5%) | |
| Rp. 300,001 to Rp. 350,000 (5.2%) | |
| Rp. 350,001 to Rp. 400,000 (4.4%) | |
| Rp. 400,001 to Rp. 450,000 (2.7%) | |
| Rp. 450,001 to Rp. 500,000 (5.2%) | |
| More than Rp. 500,000 (11.0%) | |
| (D8) Total members in the household | One (8.3%) |
| Two (10.4%) | |
| Three (21.4%) | |
| Four (33.6%) | |
| Five (18.1%) | |
| Six or more (8.1%) | |
| (D81) Number of children | None (46.7%) |
| One (17.6%) | |
| Two (22.2%) | |
| Three (10.6%) | |
| Four or More (2.9%) | |
| (D9) Type of house | Apartment/Flat (in a building up to 4 floors) (0%) |
| Apartment/Flat (in a building with 4+ floors) (31.9%) | |
| House (only ground floor) (67.2%) | |
| House (multiple floors) (1.0%) | |
| (D10) Place of living | City with population less than 50,000) (12.7%) |
| City with population between 50,000 and 100,000 (28.0%) | |
| City with population between 100,000 and 500,000 (16.6%) | |
| City with population more than 500,000 (16.6%) | |
| Village (26.1%) |
Table 4.
Communication channels.
| Var | Mean (N = 518) | Var | Mean (N = 518) | Var | Mean (N1 = 130) | Var | Mean (N2 = 319) |
|---|---|---|---|---|---|---|---|
| S01 | 0.47 | S1 | 0.67 | I31 | 0.67 | Q21 | 0.58 |
| S02 | 0.15 | S2 | 0.04 | I32 | 0.09 | Q22 | 0.07 |
| S03 | 0.06 | S3 | 0.17 | I33 | 0.27 | Q23 | 0.2 |
| S04 | 0.17 | S4 | 0.23 | I34 | 0.29 | Q24 | 0.24 |
| S05 | 0.9 | S5 | 0.12 | I35 | 0.24 | Q25 | 0.16 |
| S06 | 0.42 | S6 | 0.01 | I36 | 0.02 | Q26 | 0.04 |
| S07 | 0.64 | S7 | 0.03 | I37 | 0.1 | Q27 | 0.07 |
| S08 | 0.04 | S8 | 0.18 | I38 | 0.33 | Q28 | 0.26 |
| S09 | 0.03 | S9 | 0.01 | I39 | 0.02 | Q29 | 0.02 |
| S10 | 0.08 | I40 | 0.49 | Q30 | 0.32 | ||
| S11 | 0.03 | I41 | 0.15 | Q31 | 0.08 | ||
| S12 | 0.12 | I42 | 0.12 | Q32 | 0.14 | ||
| S13 | 0 | I43 | 0.09 | Q33 | 0.06 | ||
| S14 | 0.05 | I44 | 0.02 | Q34 | 0.02 | ||
| S15 | 0.06 | I45 | 0 | Q35 | 0.05 |
Table 5.
Willingness to accept/adopt SM under various conditions (N = 518).
| Code | Question | Mean | Std Dev | Yes % | No % | Not Sure % |
|---|---|---|---|---|---|---|
| Accept if SM would help save money | 1.57 | 0.838 | 66.2 | 11 | 22.8 | |
| Accept if SM would help save money but might have adverse effect on health | 1.51 | 0.808 | 69.5 | 10.4 | 20.1 | |
| Accept if SM would help save money, have no have adverse effect on health but companies have access to data of energy usage | 1.47 | 0.796 | 71.6 | 9.3 | 19.1 | |
| Accept if company representative visit home and explains all details about SM | 1.95 | 0.938 | 46.5 | 12 | 41.5 | |
| Accept even if upgrade to SM was not free but paid (N1 = 130) | 1.92 | 0.886 | 43.1 | 21.5 | 35.4 | |
| Accept if upgrade of SM was free | 1.7 | 0.885 | 58.5 | 12.9 | 28.6 | |
| Accept if friends/relatives/neighbors recommends SM | 1.79 | 0.915 | 54.8 | 11.8 | 33.4 | |
| Accept if friends/relatives/neighbors installs SM | 1.65 | 0.874 | 61.4 | 11.8 | 26.8 |
Table 6.
Estimation results of Tobit model for Variable (N = 518).
| Coefficient | Std. Error | z | p-Value | |
|---|---|---|---|---|
| A38 | 0.459298 | 0.201398 | 2.281 | 0.0226 |
| P3 | 0.301042 | 0.147649 | 2.039 | 0.0415 |
| P4 | 0.368473 | 0.121833 | 3.024 | 0.0025 |
| F1 | 0.378323 | 0.127808 | 2.960 | 0.0031 |
| Q1 | 0.416144 | 0.104268 | 3.991 | 0.0001 |
| const | −3.98193 | 1.36675 | −2.913 | 0.0036 |
Table 7.
Estimation results of Tobit model for Variable (N = 518).
| Coefficient | Std. Error | z | p-Value | |
|---|---|---|---|---|
| D1 | −0.426938 | 0.207638 | −2.056 | 0.0398 |
| S11 | 1.07450 | 0.527156 | 2.038 | 0.0415 |
| S15 | −1.26069 | 0.527275 | −2.391 | 0.0168 |
| A32 | 0.558343 | 0.217264 | 2.570 | 0.0102 |
| A38 | 0.604122 | 0.220646 | 2.738 | 0.0062 |
| P1 | 0.486778 | 0.199553 | 2.439 | 0.0147 |
| P2 | 0.360111 | 0.178394 | 2.019 | 0.0435 |
| Q1 | 0.439514 | 0.112342 | 3.912 | 0.0001 |
| const | −2.00271 | 1.37239 | −1.459 | 0.1445 |
Table 8.
Estimation results of Tobit model for Variable (N = 518).
| Coefficient | Std. Error | z | p-Value | |
|---|---|---|---|---|
| D6 | −0.131180 | 0.0668288 | −1.963 | 0.0497 |
| D9 | −0.566800 | 0.212691 | −2.665 | 0.0077 |
| P2 | 0.364382 | 0.182679 | 1.995 | 0.0461 |
| P3 | 0.351821 | 0.161554 | 2.178 | 0.0294 |
| Q1 | 0.571528 | 0.117001 | 4.885 | 0.0000 |
| const | −2.79852 | 1.46845 | −1.906 | 0.0567 |
Table 9.
Estimation results of Tobit model for Variable (N = 518).
| Coefficient | Std. Error | z | p-Value | |
|---|---|---|---|---|
| S03 | −0.651626 | 0.317034 | −2.055 | 0.0398 |
| S08 | −0.878655 | 0.408831 | −2.149 | 0.0316 |
| B1 | −0.277428 | 0.125653 | −2.208 | 0.0273 |
| S3 | 0.397866 | 0.190581 | 2.088 | 0.0368 |
| R1 | 0.396932 | 0.177439 | 2.237 | 0.0253 |
| P3 | 0.252233 | 0.121232 | 2.081 | 0.0375 |
| F1 | 0.350940 | 0.0997990 | 3.516 | 0.0004 |
| Q1 | 0.346318 | 0.0821941 | 4.213 | 0.0000 |
| const | −2.09742 | 1.01987 | −2.057 | 0.0397 |
Table 10.
Estimation results of Tobit model for Variable (N = 130).
| Coefficient | Std. Error | z | p-Value | |
|---|---|---|---|---|
| D1 | −0.526502 | 0.266806 | −1.973 | 0.0485 |
| D4 | −0.299052 | 0.133785 | −2.235 | 0.0254 |
| S08 | 1.99339 | 0.906438 | 2.199 | 0.0279 |
| S09 | 1.97660 | 0.588132 | 3.361 | 0.0008 |
| B5 | −0.398364 | 0.169221 | −2.354 | 0.0186 |
| S4 | 0.602266 | 0.303052 | 1.987 | 0.0469 |
| S8 | −0.609118 | 0.287638 | −2.118 | 0.0342 |
| S14 | −1.68988 | 0.747223 | −2.262 | 0.0237 |
| A35 | −0.951932 | 0.322951 | −2.948 | 0.0032 |
| R1 | 1.15989 | 0.349880 | 3.315 | 0.0009 |
| P2 | 0.738628 | 0.316637 | 2.333 | 0.0197 |
| Q1 | 0.549663 | 0.153058 | 3.591 | 0.0003 |
| const | 11.9877 | 882.376 | 0.01359 | 0.9892 |
Table 11.
Estimation results of Tobit model for Variable (N = 518).
| Coefficient | Std. Error | z | p-Value | |
|---|---|---|---|---|
| D81 | −0.215990 | 0.109612 | −1.970 | 0.0488 |
| S04 | 0.570765 | 0.248447 | 2.297 | 0.0216 |
| S08 | −1.14777 | 0.489555 | −2.345 | 0.0191 |
| B2 | −0.399133 | 0.192045 | −2.078 | 0.0377 |
| S3 | 0.468690 | 0.220941 | 2.121 | 0.0339 |
| S8 | −0.484939 | 0.244529 | −1.983 | 0.0474 |
| A34 | 0.593223 | 0.245430 | 2.417 | 0.0156 |
| P1 | 0.365108 | 0.174351 | 2.094 | 0.0363 |
| P2 | 0.363549 | 0.158399 | 2.295 | 0.0217 |
| F1 | 0.492495 | 0.117634 | 4.187 | 0.0000 |
| Q1 | 0.441846 | 0.0964924 | 4.579 | 0.0000 |
| const | −3.15554 | 1.20167 | −2.626 | 0.0086 |
Table 12.
Estimation results of Tobit model for Variable (N = 518).
| Coefficient | Std. Error | z | p-Value | |
|---|---|---|---|---|
| D6 | −0.111553 | 0.0495975 | −2.249 | 0.0245 |
| S03 | −0.907934 | 0.391621 | −2.318 | 0.0204 |
| S08 | −1.61036 | 0.509745 | −3.159 | 0.0016 |
| S8 | −0.461269 | 0.222007 | −2.078 | 0.0377 |
| S15 | −1.27823 | 0.405237 | −3.154 | 0.0016 |
| A38 | 0.421198 | 0.170078 | 2.476 | 0.0133 |
| F1 | 0.338865 | 0.109706 | 3.089 | 0.0020 |
| Q1 | 0.524352 | 0.0889067 | 5.898 | 0.0000 |
| const | −2.47158 | 1.13916 | −2.170 | 0.0300 |
Table 13.
Estimation results of Tobit model for Variable (N = 518).
| Coefficient | Std. Error | z | p-Value | |
|---|---|---|---|---|
| D7 | −0.0675710 | 0.0342000 | −1.976 | 0.0482 |
| S02 | −0.623260 | 0.281593 | −2.213 | 0.0269 |
| S04 | 0.576861 | 0.253421 | 2.276 | 0.0228 |
| S11 | 1.29209 | 0.441498 | 2.927 | 0.0034 |
| A1 | 0.246666 | 0.0782935 | 3.151 | 0.0016 |
| A38 | 0.483869 | 0.184021 | 2.629 | 0.0086 |
| P2 | 0.333437 | 0.160555 | 2.077 | 0.0378 |
| P3 | 0.645629 | 0.138027 | 4.678 | 0.0000 |
| F1 | 0.429969 | 0.117665 | 3.654 | 0.0003 |
| Q1 | 0.205751 | 0.0968163 | 2.125 | 0.0336 |
| const | −3.10468 | 1.21801 | −2.549 | 0.0108 |
© 2019 by the authors. Licensee MDPI, Basel, Switzerland. This article is an open access article distributed under the terms and conditions of the Creative Commons Attribution (CC BY) license (http://creativecommons.org/licenses/by/4.0/).
Share and Cite
MDPI and ACS Style
Chawla, Y.; Kowalska-Pyzalska, A.; Widayat, W. Consumer Willingness and Acceptance of Smart Meters in Indonesia. Resources 2019, 8, 177. https://0-doi-org.brum.beds.ac.uk/10.3390/resources8040177
AMA Style
Chawla Y, Kowalska-Pyzalska A, Widayat W. Consumer Willingness and Acceptance of Smart Meters in Indonesia. Resources. 2019; 8(4):177. https://0-doi-org.brum.beds.ac.uk/10.3390/resources8040177
Chicago/Turabian StyleChawla, Yash, Anna Kowalska-Pyzalska, and Widayat Widayat. 2019. "Consumer Willingness and Acceptance of Smart Meters in Indonesia" Resources 8, no. 4: 177. https://0-doi-org.brum.beds.ac.uk/10.3390/resources8040177
Note that from the first issue of 2016, this journal uses article numbers instead of page numbers. See further details here.