Article

Assessment of Valuable and Critical Elements Recovery Potential in Ashes from Processes of Solid Municipal Waste and Sewage Sludge Thermal Treatment

by
Monika Kasina
1,*,
Piotr Rafał Kowalski
2,
Bartłomiej Kajdas
3 and
Marek Michalik
1
1
Institute of Geological Sciences, Jagiellonian University, Gronostajowa 3a, 30-387 Kraków, Poland
2
INŻ-GEO Sp. z o.o. Sp.k., Zatorska 46, 51-215 Wrocław, Poland
3
Centre for Environmental Education, Jagiellonian University, Gronostajowa 5, 30-387 Kraków, Poland
*
Author to whom correspondence should be addressed.
Submission received: 29 September 2020 / Revised: 23 October 2020 / Accepted: 4 November 2020 / Published: 6 November 2020

Abstract

:
Due to the increasing amount of produced and accumulated wastes, a potential source of elements might be the global waste stream coming from the waste incineration process. As a result of this process, bottom ash, fly ash and air pollution control residues are produced. The goal of this study was to evaluate the raw material potential of the anthropogenic materials which are fly ashes from municipal waste incineration and municipal sewage sludge incineration, and the possibility for the recovery of metallic or other economically valuable elements by comparison of their chemical composition with the chemical composition of Earth materials (ultramafic, mafic and felsic igneous rocks, various sedimentary rocks), and with their lowest content in currently exploited ores. Fly ashes contain more valuable and critical elements when compared to Earth materials; however, they are less concentrated in comparison to the content in currently exploited ores. Since natural resources are becoming depleted, the costs of exploitation, mineral processing and related operations are increasing and the fly ashes are easily accessible. Cheap materials do not demand complicated treatment which might be considered as a future source of P, Zn, Sn, Cr, Pb, Au and Ag, and thus fulfilling the assumptions of close-loop economy and to maximize natural resources protection.

1. Introduction

Raw material and energy needs are increasing due to population growth, and industrial and technological development. Anthropogenic impact on the environment has been marked strongly during the industrial era, however it reached its biggest peak after World War II, when the population increase threefold and the consumption of resources increased drastically [1,2]. On one hand, there is the increasing consumption of everyday goods still going on, that require raw materials for their production, while on the other we observe a constant decrease in natural raw material resources, which is one of the likely problems in the Anthropocene. We are obliged to protect natural resources and manage them rationally and efficiently to fulfil requirements of the closed-loop economy.
In order to maintain economic growth and improve the quality of life for European Union (EU) citizens, raw materials are indispensable for the European economy [3]. Meanwhile, the demand for industrially important elements will increase, as suggested by [4]. It is thus essential to secure these elements to follow the principles of sustainable development, where industrial growth is obtained by the reasonable management of natural resources and the reuse of raw materials.
According to the Report on Critical Raw Materials for the EU [5,6], EU countries were only able to supply 9% of the raw materials required for the manufacture of all goods. In addition, the prices of industrially important metals fluctuate depending on the policy of the country that owns the resources, as well as market forces and demand for the metals [4]. According to Critical Raw Materials for the EU [7], demand for raw materials in the EU in 2010 was approximately 3 billion Mg/yr and it was expected to increase. Almost 90% of these materials are sourced from natural resources, whereas only 10% come from recycled materials and industrial processes. Growing concerns about the security of raw material supply has led to the development of studies on the supply risk of industrial metals and the criticality of raw materials e.g., [3,5,8,9,10,11].
The principles of a sustainable economy force us to protect natural resources and to search for alternative sources. The question thus arises of whether the waste stream can be a source of raw materials and valuable elements for industrial use. The answer seems to be simple. As suggested by [2], earth is no longer capable of absorbing our landfilled waste; therefore, rational waste management requires paying attention to the resource potential of waste materials. Storage of increasing amounts of waste that cannot be recycled not only takes up a large surface area and can leads to the immobilisation of elements which are economically important, or even critical from an industrial point of view outside the circular economy, but can also have a negative influence on the environment by releasing potentially toxic elements and organic substances. The presence of valuable elements, including those that are critical for the EU, has been demonstrated in the incineration ashes of various wastes, including sewage sludge, municipal solid waste, food scraps, animal waste, horticulture waste and others e.g., [4,12], metallurgical slags e.g., [13] and electronic waste e.g., [14].
In [15], the authors suggested that we are able to use waste as a secondary source of raw materials in sufficient amounts by combining metal recovery from waste (e.g., Fe, Cu, Al) together with energy recovery during waste thermal utilisation and energy production obtained by urban mining.
An alternative method to waste landfilling is its thermal treatment. Incineration allows for waste sanitisation, mass and volume reduction, and the production of excess energy not consumed in the incineration facility. As a result of waste incineration, bottom ash (BA), fly ash (FA) and air pollution control (APC) residues are produced.
BA accounts for 90 wt% of the solid residues produced during municipal waste incineration, with the remaining 10 wt% belonging to phases removed with flue gases from the furnace: FA and APC residues [16]. Therefore, we can estimate that if the annual production of BA in the EU is ca. 16 million tonnes (Mt) [17], the production of FA is approximately 1.8 Mt per year. In the case of sewage sludge, incineration residues of ca. 85% are affiliated to FA, whereas 15% belongs to APC residues and BA is not produced when a fluidised bed furnace is used [18]. The combined total production of FA from sewage sludge incineration in the United States (US) and the EU is estimated at 1.2 Mt annually [19]. FAs are known to contain toxic metals that can easily leach out, as well as organic components and soluble salts that can negatively influence the surrounding environment [20]; thus, they need to be treated in a manner that prevents any contamination [21], on the one hand, while allowing the recovery of as many valuable components as possible before they are permanently excluded from circulation, by developing more efficient recycling methods.
The goal of the present paper was not only to evaluate the raw material potential of FA produced in the thermal treatment of sewage sludge and municipal waste (i.e., wastes typical of the urban environment) by comparison of their averaged chemical composition with the averaged chemical compositions of Earth materials such as continental crust, ultramafic, mafic, felsic igneous and sedimentary rocks, but also to compare the content of selected elements in FA to the lowest content in currently exploited ores. It is important not only to know how much of the material is available for treatment, but also to determine their detailed characteristics, both chemical and mineralogical. Through awareness of the composition of the FA, it is possible to estimate potential applications for them without the specific treatment of ashes, which often require additional financial expense or planning for the most effective means of recycling. In particular, we must keep in mind that the amount of FA, even if lower than BA, increases every year and is expected to continue to increase. Because of elements fractionation during the waste incineration process, the degree of concentration of various elements in FA and BA differs significantly. The form of occurrence of BA and FA imply different methods of their processing.
A proper evaluation of the possible recovery of metals or other valuable elements from FA is important before they are used for other applications (e.g., soil treatment, production of building materials and road construction) to avoid their dispersion. It also supports one of the other strategies of the circular economy, which is urban mining, in which as little waste as possible is generated in the Earth system [22].

2. Materials and Methods

For the comparison, three different FAs produced in three waste-to-energy (WtE) incineration plants in Poland where different technologies are used were taken into consideration. Samples were collected from two municipal waste incineration plants (equipped with grate furnaces) and one sewage sludge incineration plant (equipped with a fluidised bed boiler).

2.1. Sewage Sludge Incineration Technology

Sludge from the wastewater treatment plant is transported to the node and the sludge membrane drying system, where the sludge is dried to 36% of the dry mass. The dried sludge is incinerated in the fluidised bed boiler (Pyrofluid™), which provides high turbulence of the fluidised bed at a constant intensity and a stable operating temperature in the range of 850–900 °C to ensure the complete incineration of organic matter. A thermal utilisation station is equipped with a heat exchanger, responsible for pre-cooling the flue gases and the production of saturated steam to both power the drying node and to produce electricity for use in the facility to reduce the cost of operation. Dewatered sludge pumped into the boiler is dried out. As a consequence of the turbulence streams in the fluidised bed, the sludge disintegrates, the organic matter is burnt and heat-resistant and volatile components are released. Heavier components and the incombustible fraction are separated in a multicyclone, captured on an electrostatic precipitator and transported in the form of FA into the ash silo, whereas lighter components and the products of flue gas cleaning (APC residues) are caught up in a bag filter after reactant addition and subjected to further processing. For the purification process of flue gases, NaHCO3 is added (for more details, see [18]. The annual production of FA in the plant comprises 4452 tonnes [18]. Six samples of FA (referred to as FA1), each with an average weight of 10 kg, were collected during six sampling campaigns.

2.2. Municipal Waste Incineration Plant 1

In this municipal waste thermal treatment plant, waste collected from a city of a population of almost 2 million inhabitants is mechanically mixed prior to the incineration and transported directly to the furnace where it is thermally treated for 30–120 min on the grate in the shaft furnace (Krüger, Denmark; W-MARK 5 shaft type) at 850–1150 °C (usually >950 °C). BAs are captured at the end of the grate system, cooled with water, processed and stored on a heap for ageing. Flue gas from the furnace resides for 2 sec at 1050 °C in the afterburner chamber just before its transportation to the recovery boiler, where after the non-catalytic reduction of NOx, the thermal energy is recovered, and the gas is cooled to ~150 °C. At this stage of the flue gas cleaning system, the first portion of ash is separated (FA). In the next step, in the flue gas collector, fine-grained Ca(OH)2 is added (10–13 kg/t of waste) to neutralise the SOx, HCl and HF from the fumes. Subsequently, the APC residues are captured using bag filters. In the last stage, toxic metals, dioxins, furans and organic components are absorbed from the flue gases using activated coke in a counter-current adsorber. The annual production of FA in this facility comprises 225 tonnes Four samples of FA (referred to as FA2), each with an average weight of 10 kg, were collected during four sampling campaigns.

2.3. Municipal Waste Incineration Plant 2

The thermal treatment of municipal waste collected from a city of a population of ca. 1 million inhabitants is performed in a grate furnace. In the initial zone of the grate, the waste is heated by radiation or convection to a temperature slightly above 100 °C. This process leads to moisture evaporation. Then, the waste is heated to above 250 °C, while volatile components such as moisture and gases are released. In the third zone of the grate, complete waste incineration occurs. The loss on ignition in this zone is lower than 0.5% of the mass. In the gasification process, volatile products are oxidised by molecular oxygen. Most of the waste is oxidised at 1000 °C in the upper zone of the incineration chamber. In the post-combustion zone, the unburned CO in the exhaust gas is minimised. In this zone, secondary air is provided for complete combustion. The residence time of the flue gas is around 2 s at a minimum temperature of 850 °C. Residues from the APC system were collected from the post-combustion ash after the selective non-catalytic reduction (SNCR) system that contains an economiser, a reactor after hydrated lime and activated carbon injection, and from bag filters. The annual production of FA comprises 15,400 tonnes; however, it is important to mention that in this incineration plant FA and APC residues are mixed together and treated as FA. Therefore, its volume is much larger than in other municipal waste incineration plants where these products are gathered separately. Ten samples of FA (referred to as FA3), with an average weight of 10 kg, were collected during three sampling campaigns. It is important to mention that during the first sampling, the samples were collected after the selective non-catalytic reduction system, the economiser, the reactor after hydrated lime and activated carbon injection, and from the bag filters from two independent production lines; whereas for the two other samplings, four types of ashes were mixed together and stored in a silo.

2.4. Analytical Methods

To determine the chemical composition of the FA, inductively coupled plasma mass spectrometry (ICP-MS) and inductively coupled plasma atomic emission spectroscopy (ICP-AES) were performed in Bureau Veritas Minerals (formerly AcmeLabs Analytical Laboratories) in Vancouver, Canada. Analyses allowed the determination of the content of major and trace elements, respectively using LF2000 and AQ200 analyses set. In addition, the total carbon content (Ctot) and total sulphur content (Stot) content were measured using LECO combustion analyses based on infrared spectroscopy (using TC000 analyses set). Loss on ignition was obtained using thermal methods. The results of the chemical analyses of the minimum, maximum and average composition of FA1, FA2 and FA3 (based on 6, 4 and 8 samples, respectively) are listed in Table 1.
The grain size distribution of FA was performed using a Mastersizer 3000 laser diffractometer with a Hydro EV dispersion unit (Malvern, UK). The time of a single measurement was set to 60 s (3 × 10 s for red light with wavelength λ = 632.8 nm and 3 × 10 s for blue light with λ = 470 nm). For calculating the particle size, the Mie theory was used with refractive index = 1.543 and absorption index = 0.01 for quartz as the reference material. Water with refractory index = 1.330 was used as a diffuser. The results were based on the volume distribution at obscurance within the range of 0.1–20% (average 10%).
The results of the chemical analyses were averaged for each FA material and compared to the average composition of ultramafic rock, basalt, high Ca-granite, low Ca-granite, average continental crust composition, tonalite, sandstone, greywacke, shale, carbonate rock and deep-sea clay. The chemical composition of Earth materials was based on the literature [23,24,25]. In addition, the results of the chemical analyses of the averaged FA compositions were compared to the minimum concentrations of ores currently exploited worldwide [26,27] and references therein.
In order to describe the mineral composition of the FA samples, X-ray diffraction (XRD) analyses were applied using a Philips X’Pert (APD type) diffractometer with a PW 3020 vertical goniometer equipped with a curved graphite crystal monochromator (CuKα radiation, analytical range 2–64° 2Θ, step 0.02°, counting time 2 s/step). Phase compositions were identified using Philips X’Pert software (associated with the ICDD database).

3. Results and Discussion

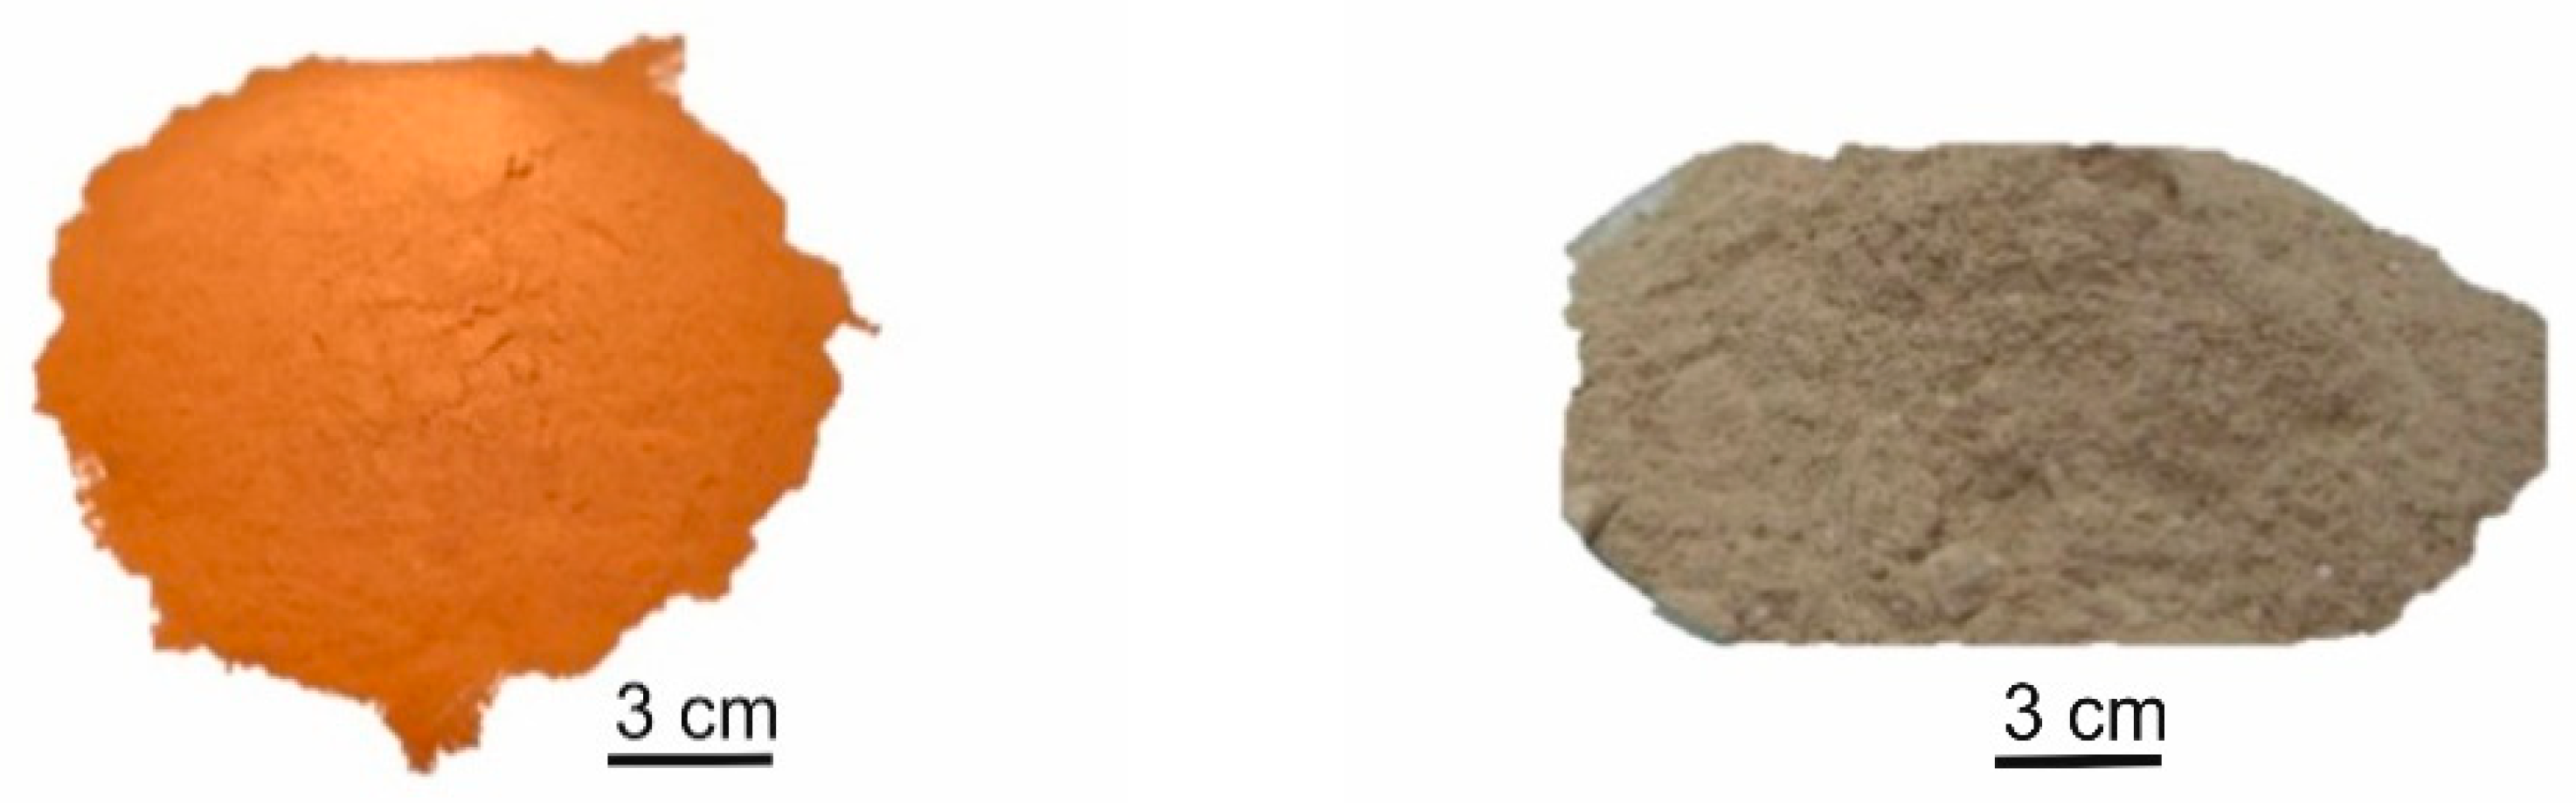
3.1. Grain Size Distribution and Mineral Composition

FA1 is reddish in colour and fine-grained (Figure 1), where 63 vol.% of the particles are <100 µm. The unimodal size distribution shows modes at 98 µm and between 46 µm and 67 µm for subsequent samples. The FAs from the municipal waste incineration (FA2 and FA3) are greyish and beige in colour (Figure 1), and vary in grain size from a single micrometre up to several millimetres. FA2 are fine-grained, where 55–75 vol.% of the grains are in the 20–200 µm range (~65 vol.% are <100 µm in size). The unimodal size distribution shows modes in the range of 50–100 µm. Whereas the FA3 is coarse and fine-grained, where 72 vol.% and 34 vol.% of the particles, respectively, are <100 µm. The unimodal but heterogeneous size distribution shows modes at 21 µm, 58 µm, 163 µm and 272 µm for subsequent samples.
The main minerals in FA1 determined in the XRD analyses were quartz, feldspar, hematite, whitlockite and Fe-PO4 [18]; while anhydrite, calcite, quartz, and minor amounts of halite, periclase, melilite group minerals and larnite [28] were present in FA2; and in FA3, quartz, feldspar, calcite, anhydrite, gypsum, portlandite and mullite were found. Apart from the crystalline phases in all of the FA samples, a high amount of amorphous phase was also present.
The averaged concentration of major and minor elements in the ashes varied in a wide range between samples (Table 1); the variation range for individual samples in each group is however not so wide. Variation of the composition of individual samples from different sampling periods indicates significant temporal variation of the composition of incinerated wastes. The variation in the chemical composition of municipal waste incineration residues from the two towns is probably related to differences in waste collection and segregation processes, and to differences in living standards and consumption habits. Both of these factors make the potential recovery of elements from incineration residues troublesome.
Calculation of the CIPW norms [29] from bulk chemical analyses for comparison with typical rocks indicated the presence of normative apatite, quartz, feldspar and hematite in FA1. In the municipal waste FA (FA2 and FA3), larnite and feldspathoids were calculated as the main normative components. This difference between the normative and modal composition of samples could be related to the fact that the Stot and Ctot contents were excluded from the CIPW calculations, resulting in a lack of carbonates and sulphates that are the main minerals present in municipal waste incineration ashes, in combination with excess Ca with Si (normative larnite), and therefore a lack of normative quartz.

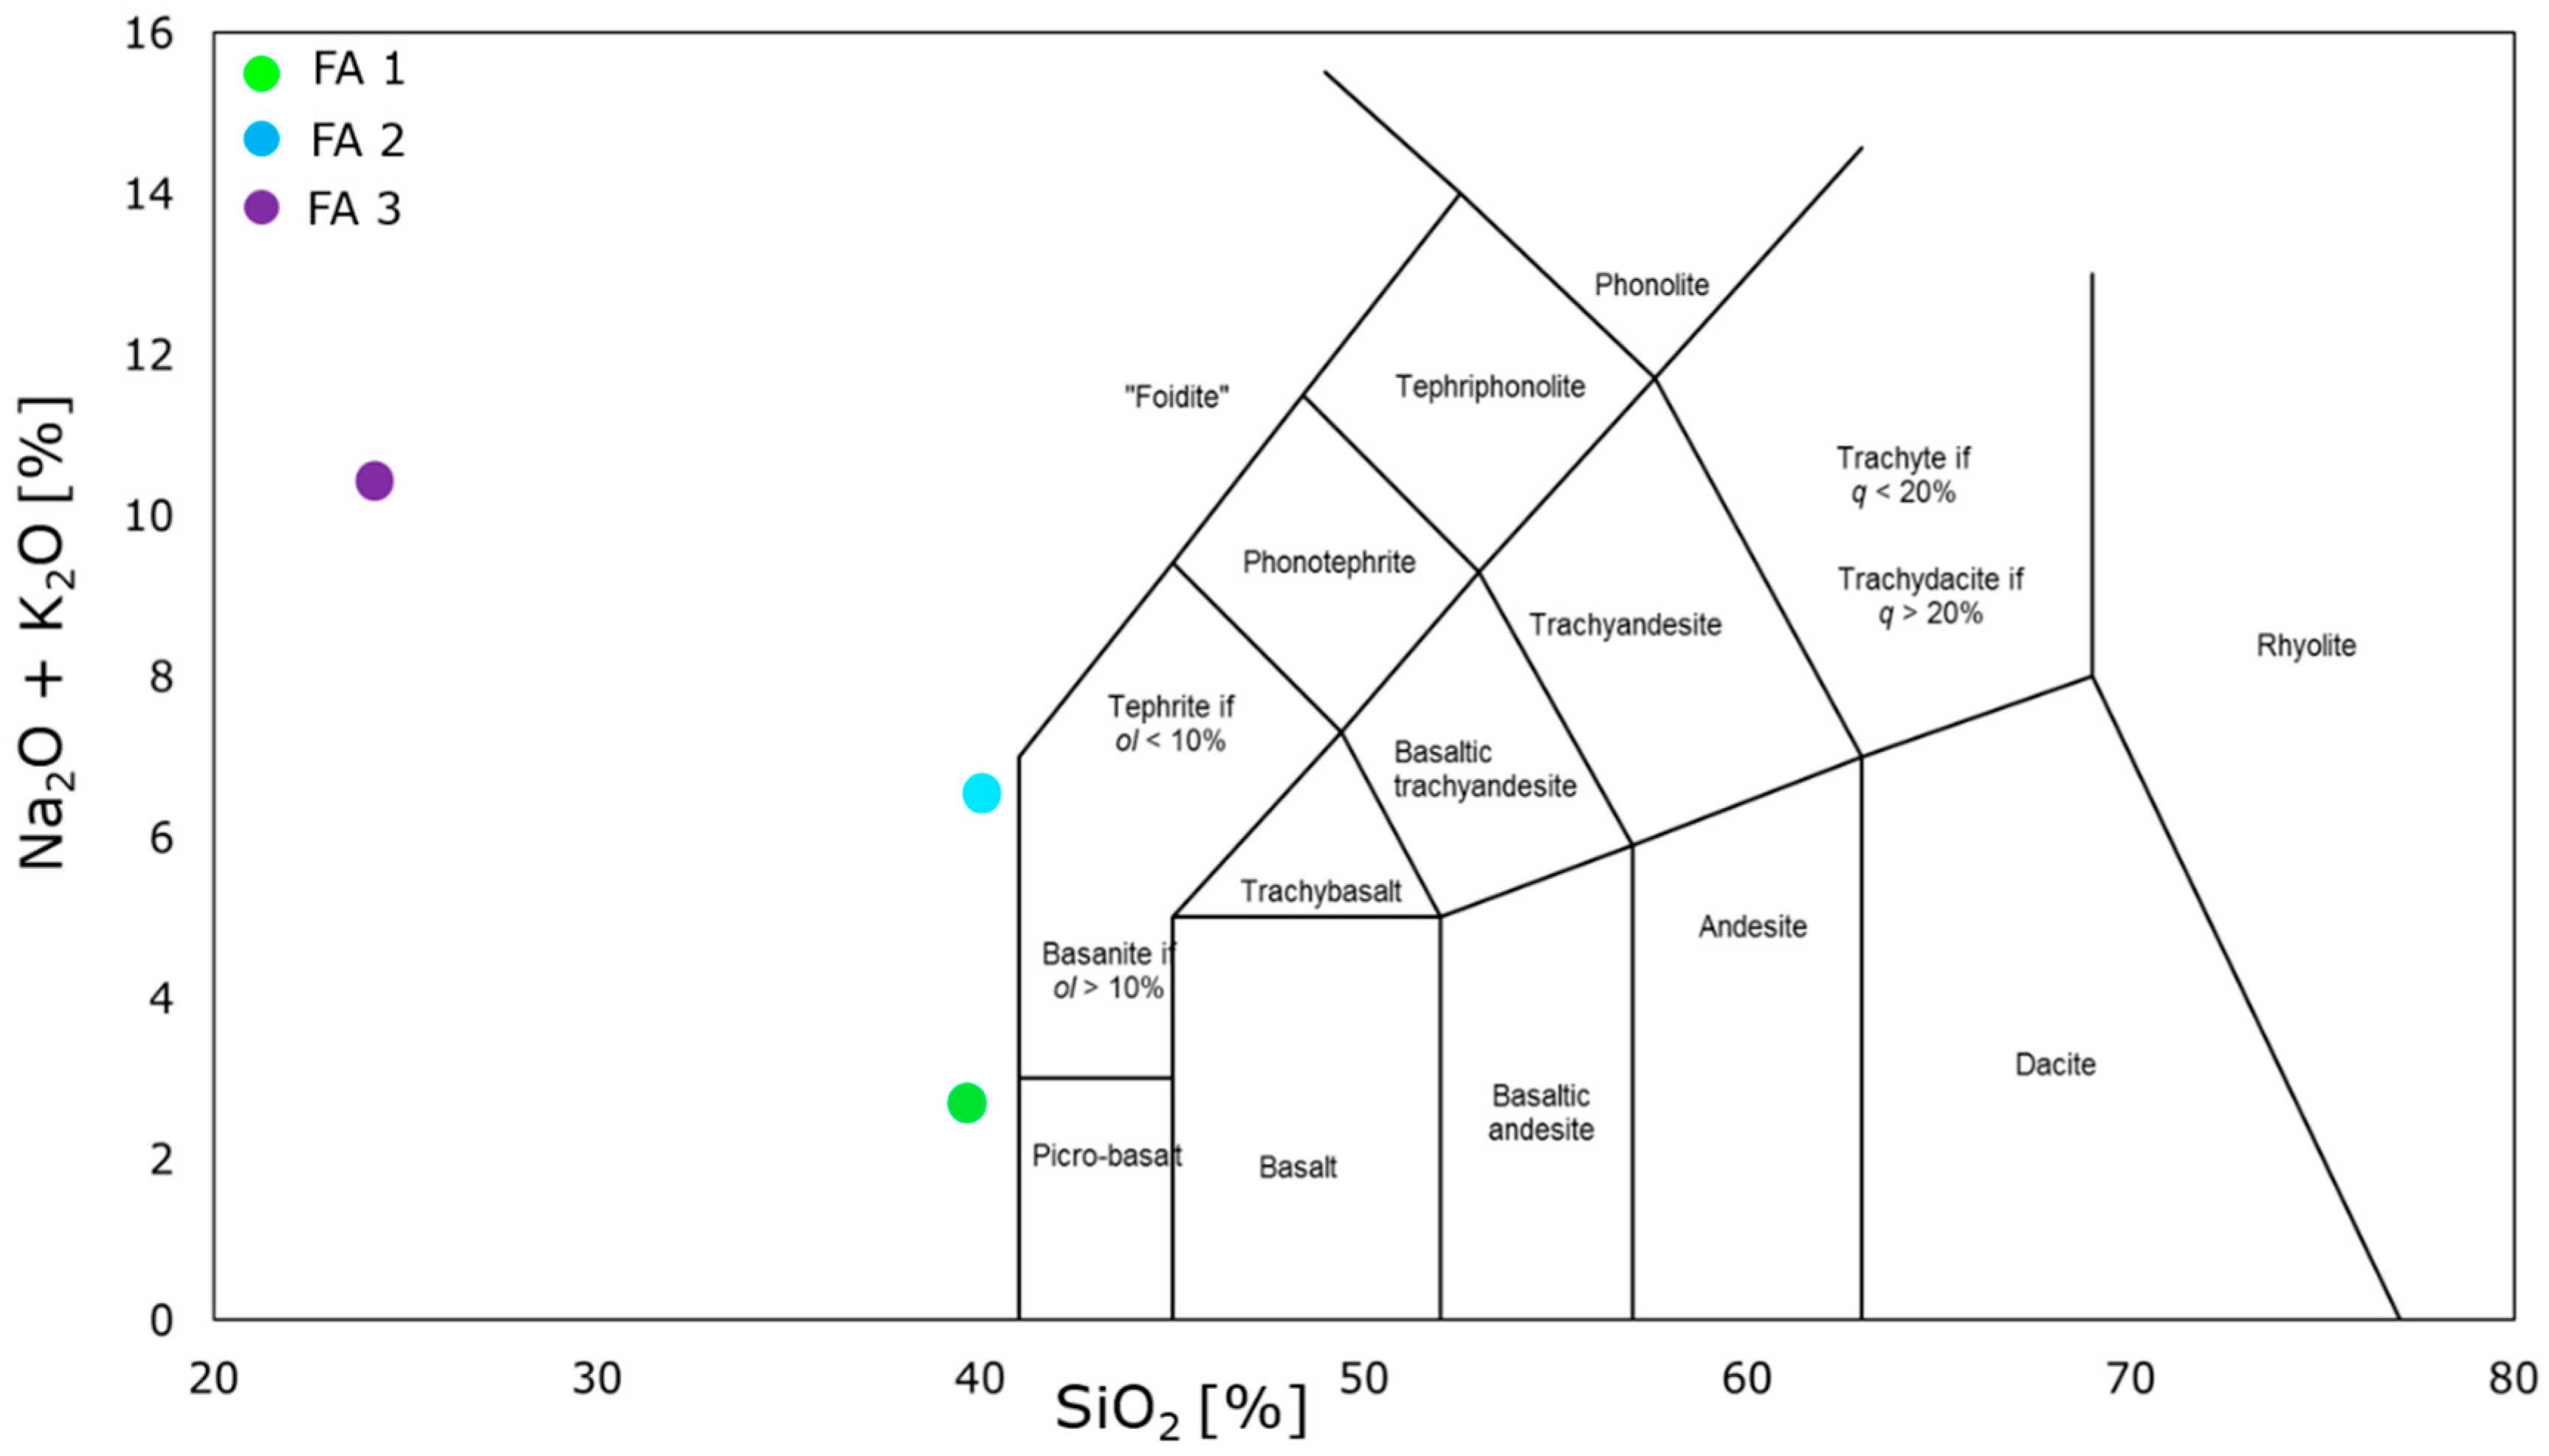
3.2. FA in the Rock Classification Scheme

Due to the fact that the FA are characterised by unusual-to-natural rock chemical composition (low SiO2 content), high Ca content in all samples, and very high P content in FA1 that were not included in the calculation, it was impossible to classify them using the total-alkali-silica (TAS) diagram (Figure 2). Thus, it was not possible using the main rock classification commonly used in geological studies to classify the FA in any field affiliated to the common igneous rocks. The molar ratio of CaO to the sum of Na2O and K2O for all samples is between 6.69 and 6.80.

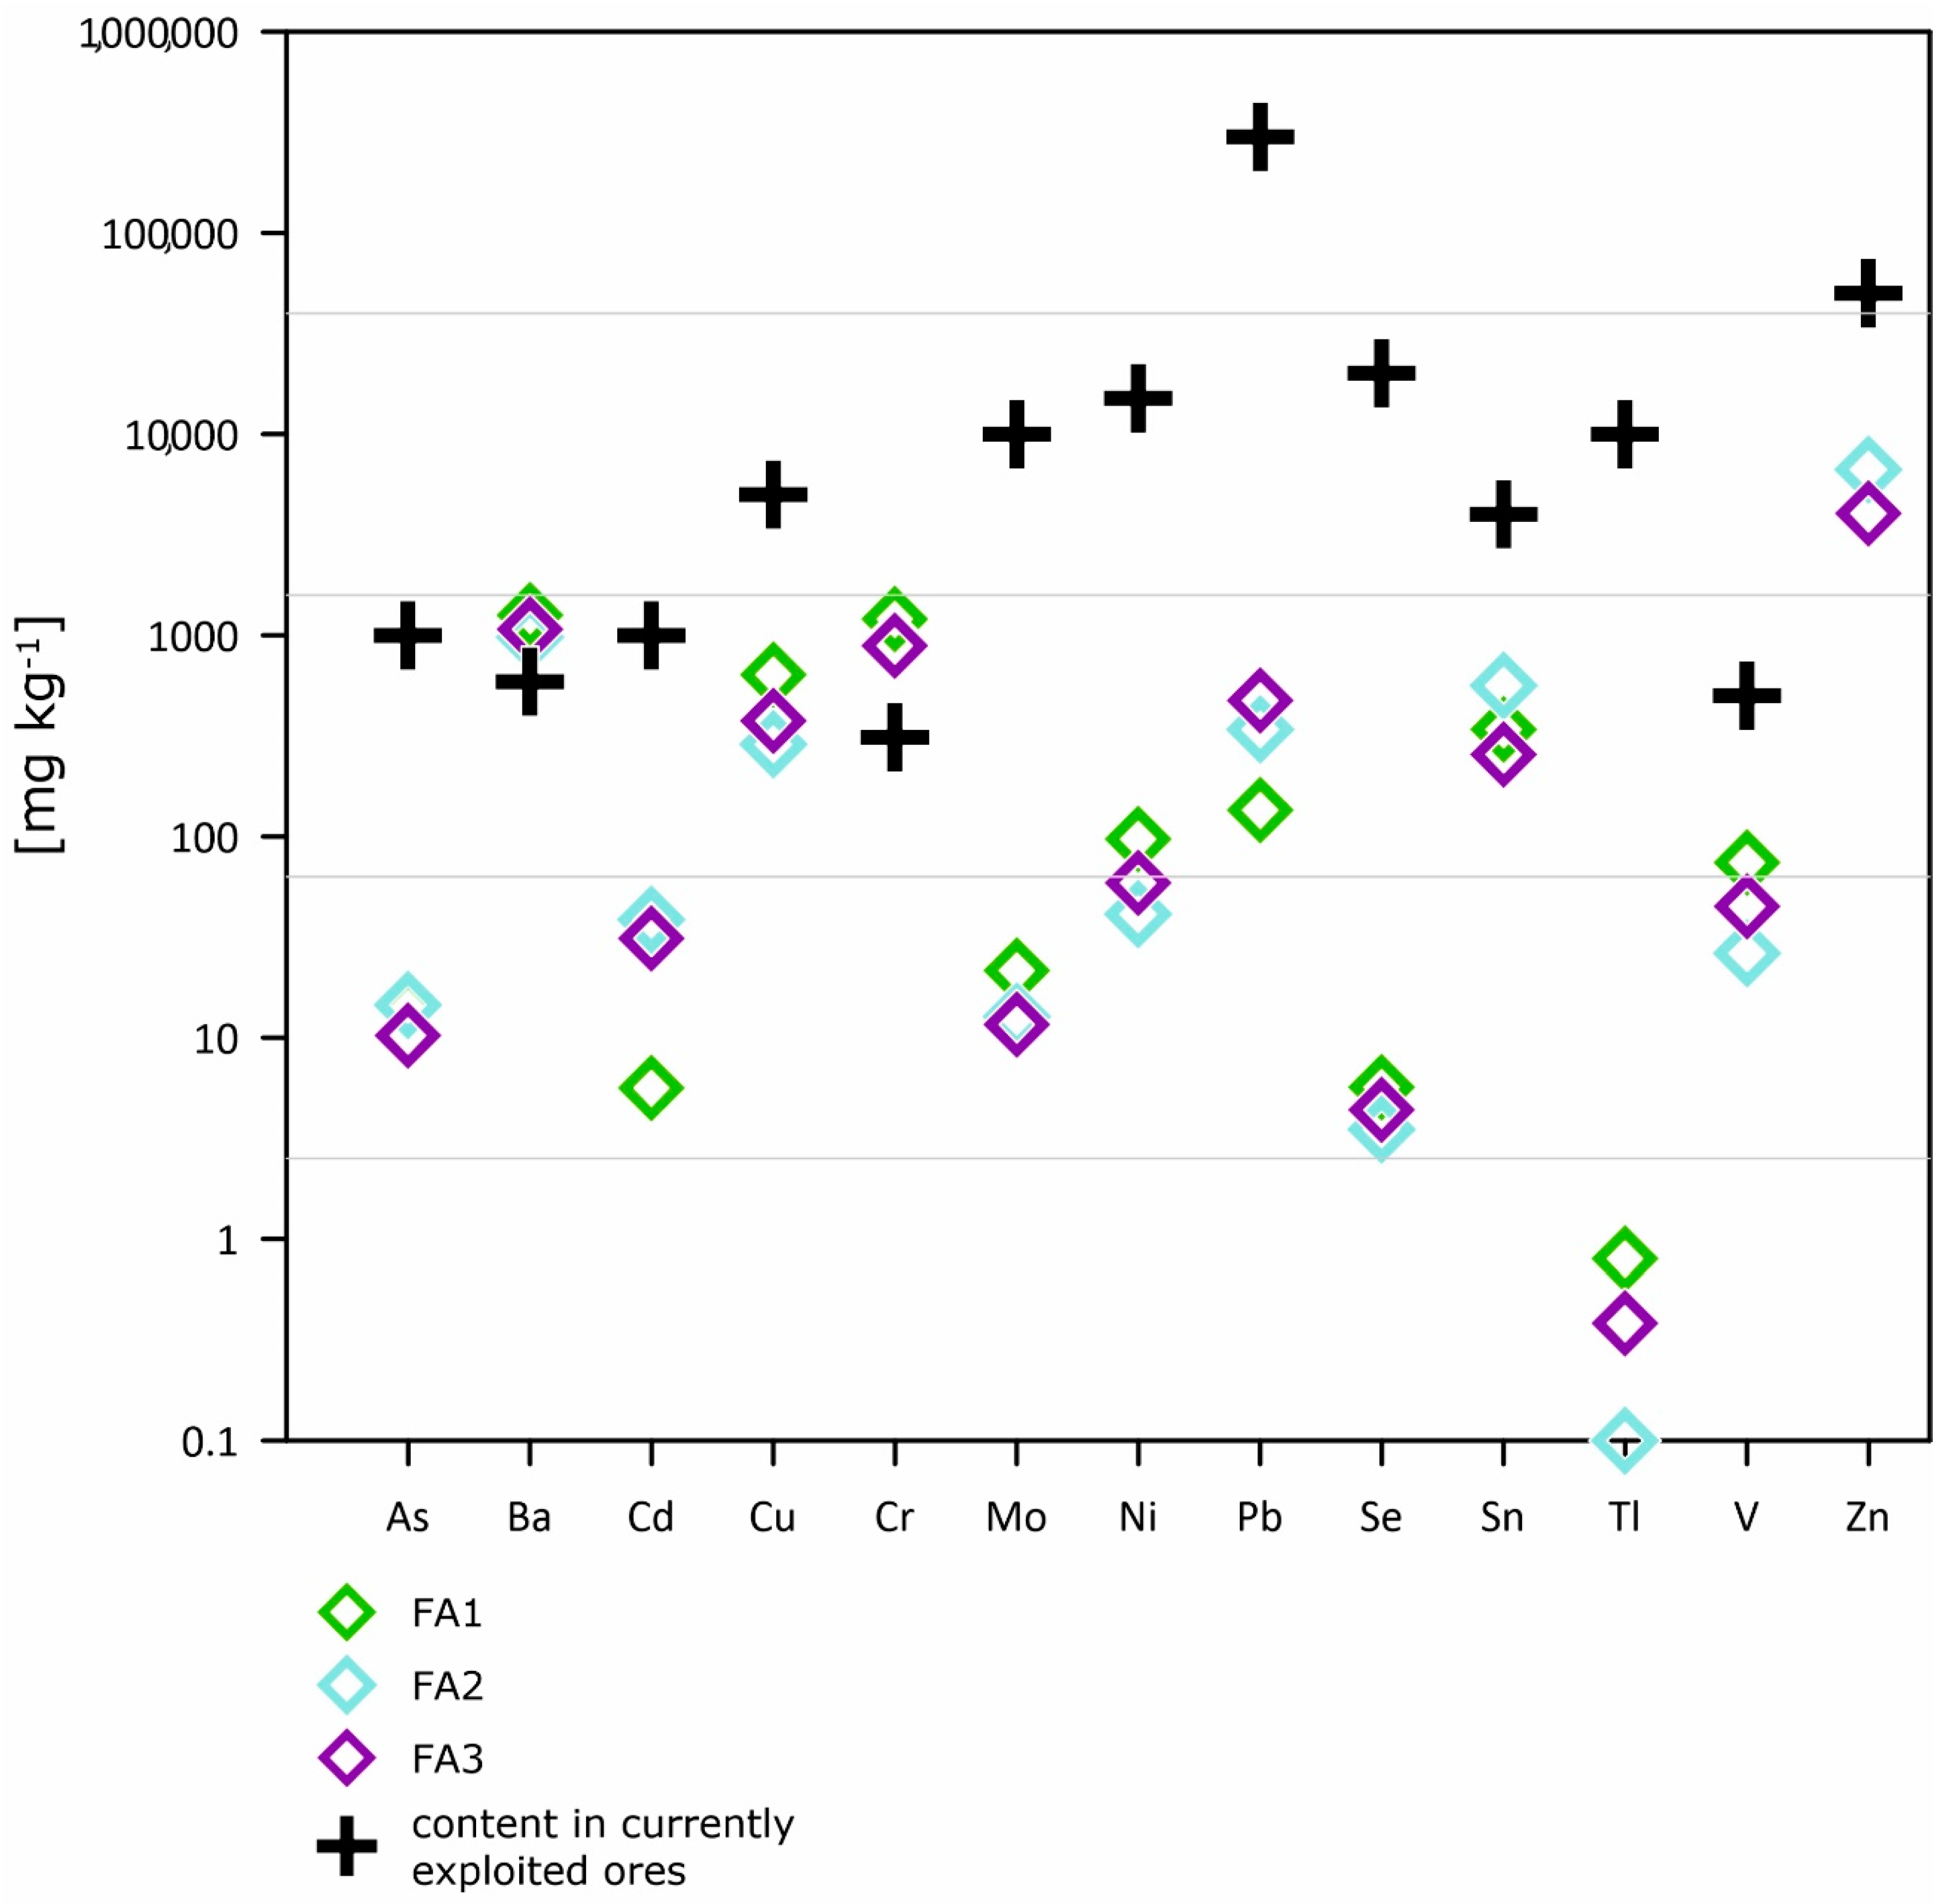
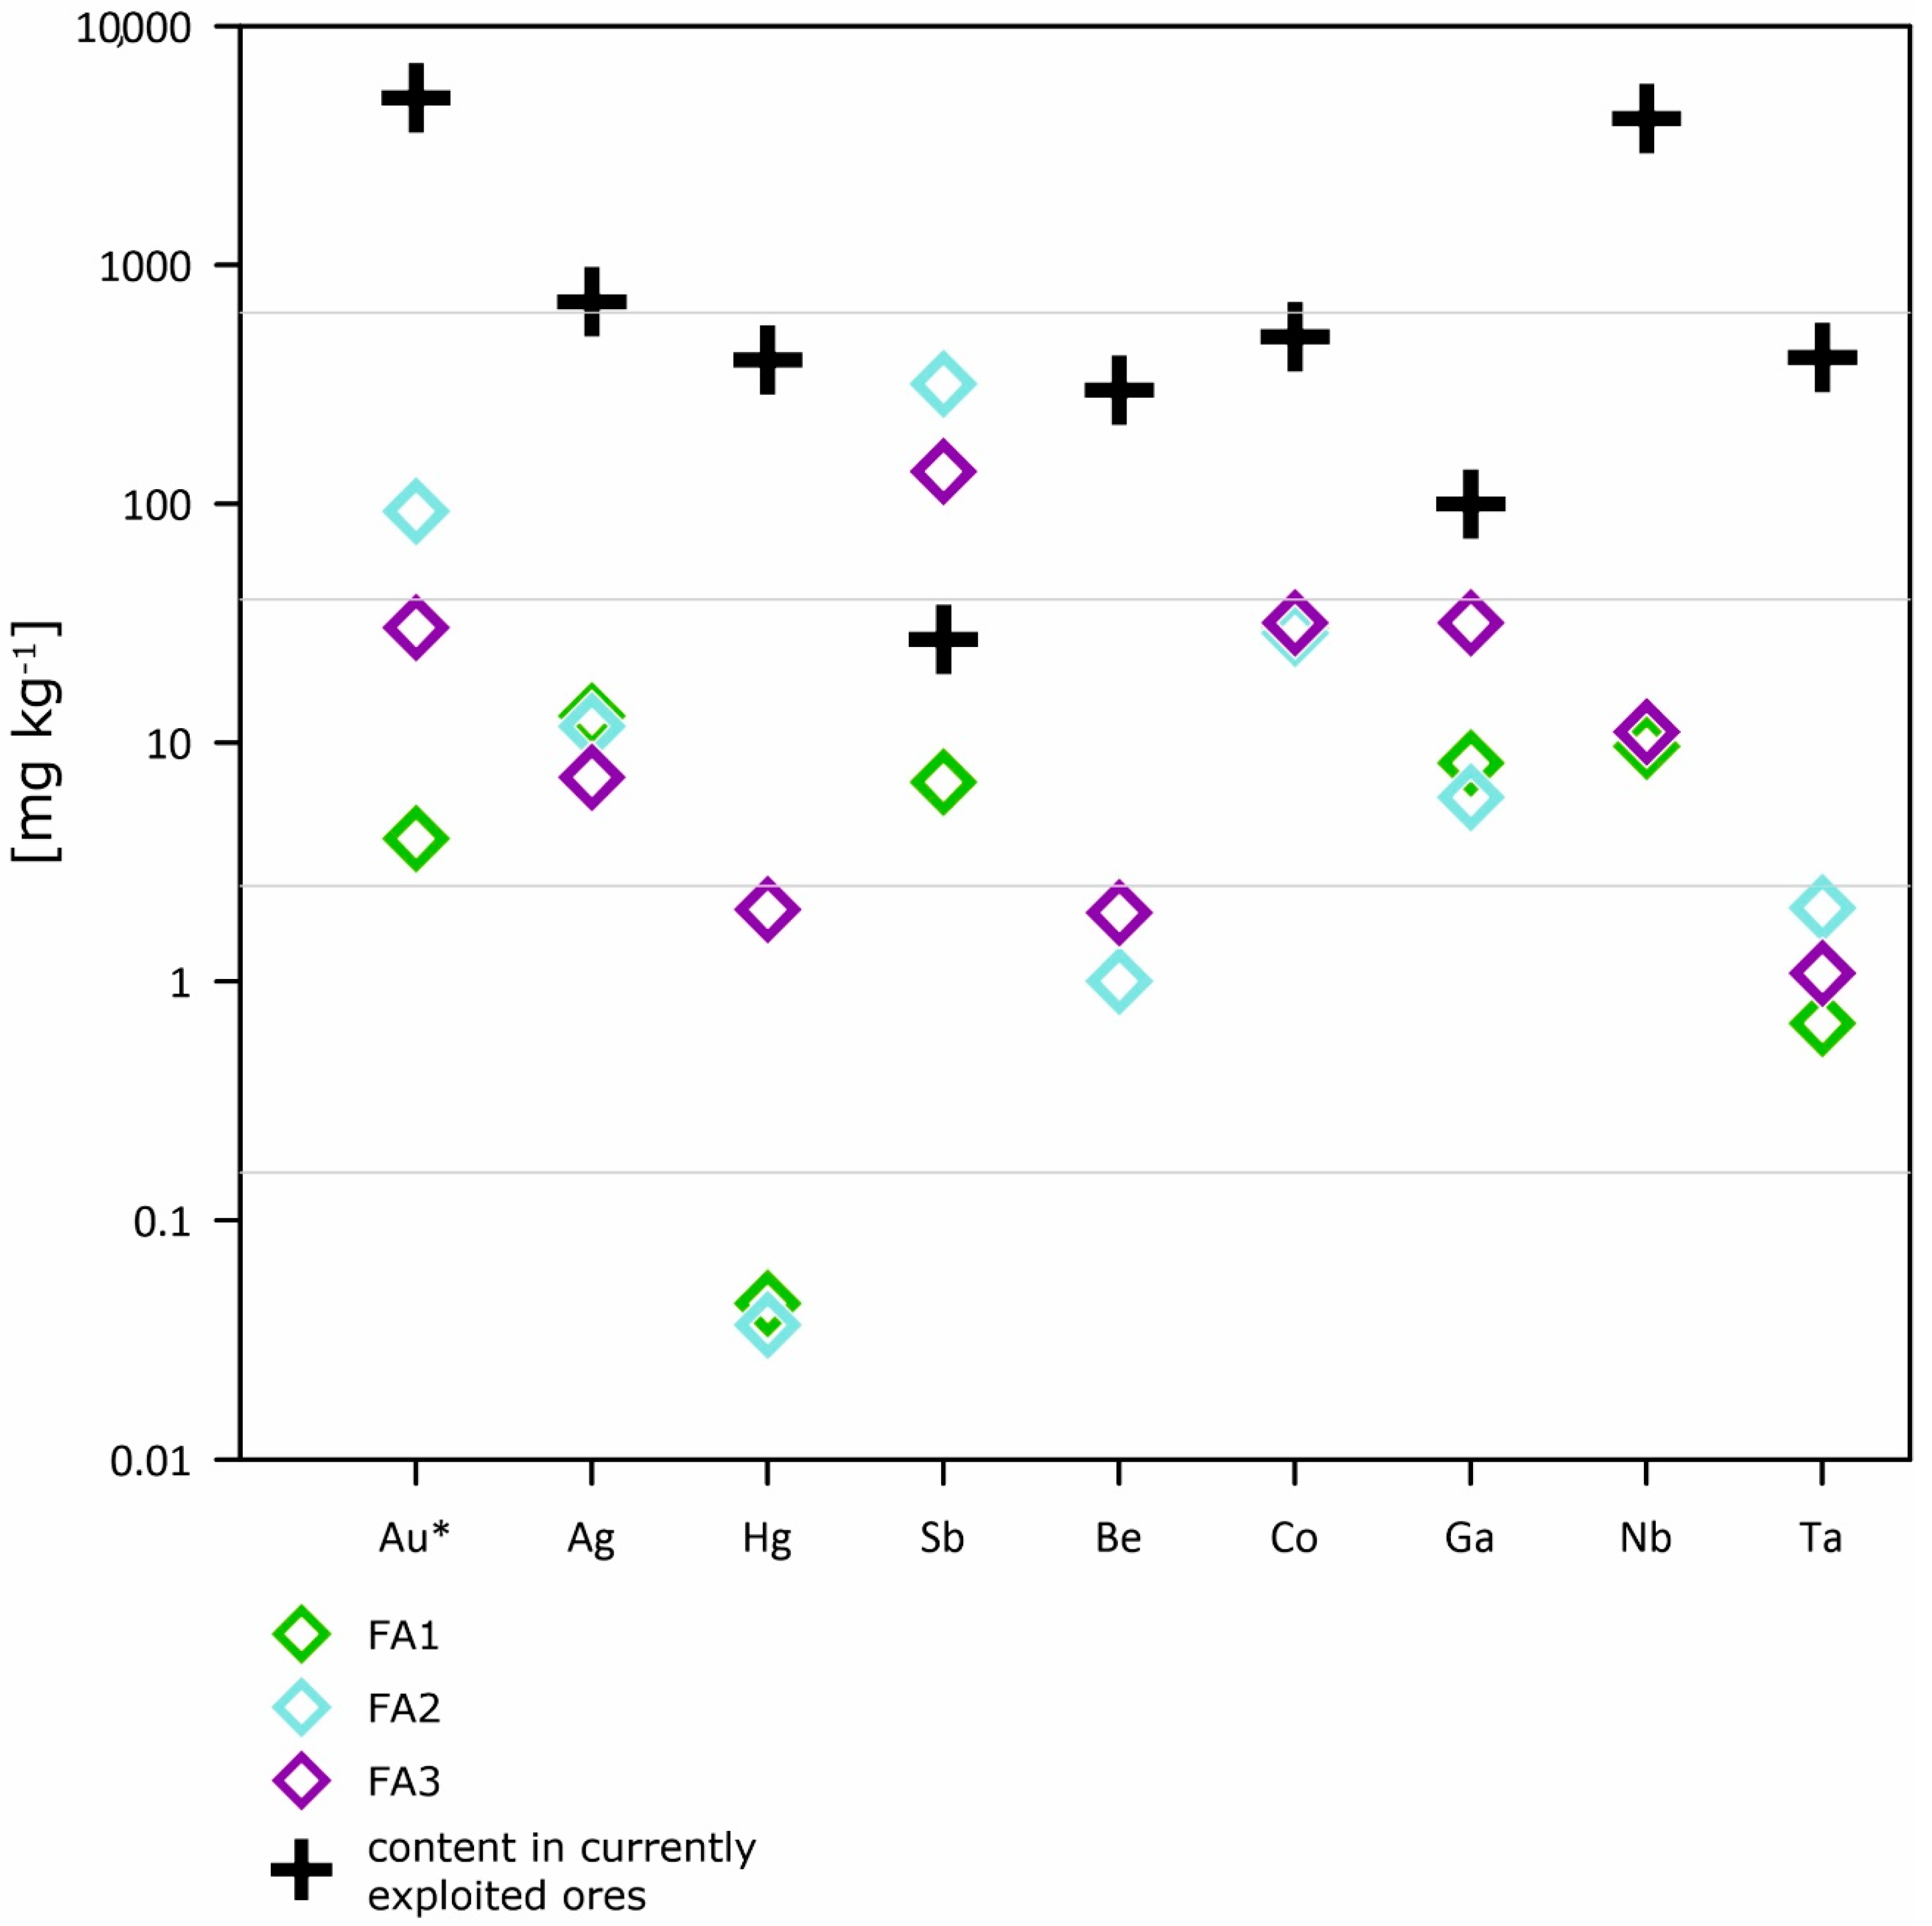
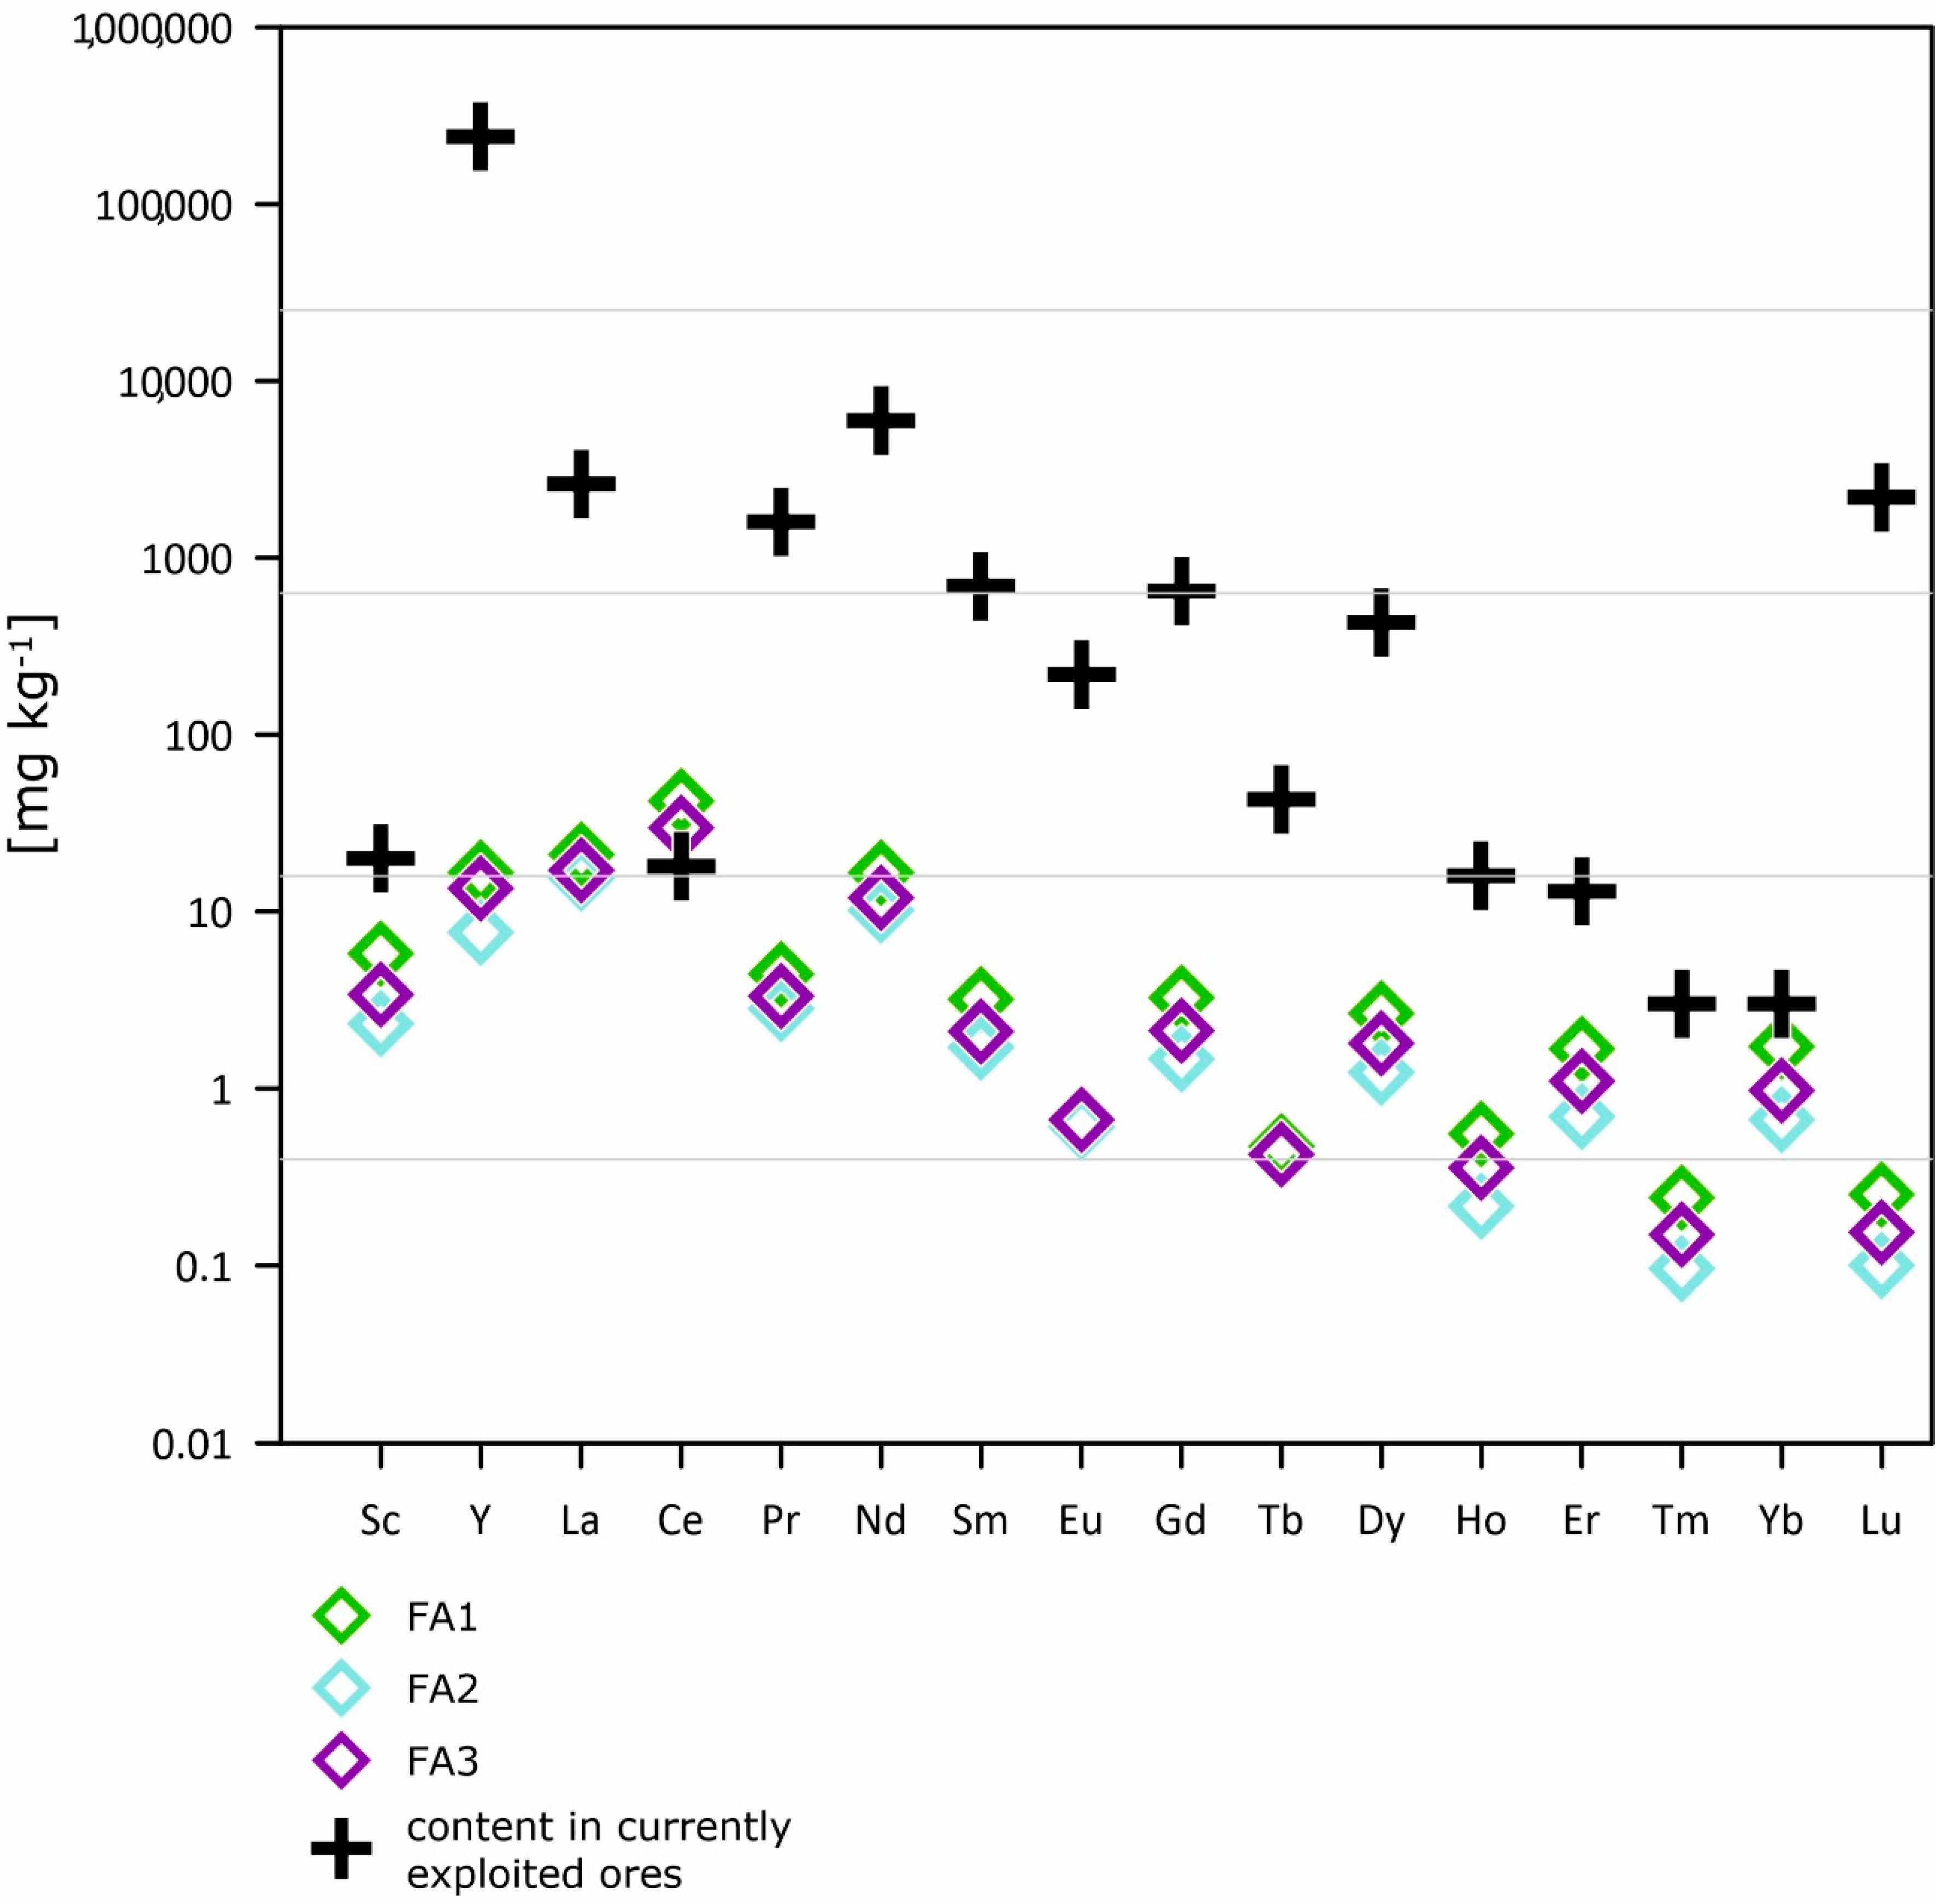
3.3. Chemical Composition of FA in Comparison with Rocks And ores

The average content of the SiO2 in FA (37.5 wt%, 18.2 wt% and 30.9 wt% for FA1, FA2 and FA3, respectively) is lower than in most of the rocks (Table 2). The lower concentrations were only observed for carbonate rocks and shales. The MgO, MnO, Na2O and K2O average concentrations in FAs are low, and within the range of the average concentration in the rocks. The Al2O3 concentration is approximately 8 wt% for each FA. The content of Fe2O3 is much higher in the municipal waste FA than in most of the considered rocks, whereas in the sewage sludge FA, the iron concentration (14.3 wt%) is as high as that found in ultramafic rocks and basalts, and three times higher than in the FA from municipal waste incineration. Moreover, [30] suggested that Fe and Al oxides present in FA bind potentially toxic elements such as Sb, As, Be, Cd, Pb, Hg and Se, which can have a negative environmental impact due to mobilisation. Furthermore, the TiO2 average content is higher than in most rocks, and close to the average content in basalts, even though the overall content is 1 wt%, 1.9 wt% and 1.4 wt% for FA1, FA2 and FA3, respectively. CaO content in the FA is high (12.1 wt% in FA1, 36.6 wt% in FA2, and 28.3 wt% in FA3), lower only than the Ca concentration in carbonate rocks (42.3 wt%). The P2O5 content is four times higher in the FA2 and FA3 than in the rocks, whereas in the FA1, this concentration is 20 times higher.
The average concentrations of industrially important metals and elements of typical environmental concerns are higher in the FA than in the rocks, except for Ba, Ni, V, Tl, Co, Ga, Nb, Ta and Hg, where the average concentrations are within the range of the average in different rocks (Table 3). A high proportion of Hg was measured in FA3, which was 100-fold higher than in the ores (Figure 3). Elevated concentrations of Hg can be related to the presence of used or broken thermometers, batteries or electronic components [31] not being separated from the municipal waste before incineration.
Ten times higher concentrations were measured for Cr, Mo, Pb and Be in the FA compared to the rocks, and elevated concentrations of As in comparison to the rocks except for the deep-sea clay and shell. The Au and Sb concentrations vary for different FA but are 10–100 times higher than in the rocks. Cd, Cu, Se, Sn and Ag concentrations are 100 times higher in the FA than in the rocks, whereas the Zn content is 1000 times higher than in the rocks (Table 3). Zn is not only used as a corrosion protection layer covering metal products [32], but it is also one of the main alloy components in brass [33], a commonly used household material. Besides the usages of metallic zinc, zinc oxide is used for various purposes, such as animal feed, ceramics, chemicals, pharmaceuticals (in particular, sunscreens and ointment), pneumatic tyres, and so forth [33].
The concentration of rare earth elements (REE) in the FA is quite low. The total content of these elements in municipal waste incineration does not exceed 75 ppm in FA3 and 107 ppm in FA2 (Table 4). The highest total content of REE was measured in FA1 at over 120 ppm, with these concentrations only higher in the deep-sea clays, carbonate rocks and ultramafic and mafic rocks. Since the main components of FA are aluminium silicates (glass), silicates (zircon), phosphates (apatite, monazite, xenotime) and (hydr)oxides (Fe-(hydr)oxides), we can assume that these phases are the main carriers for REE. Additionally, [34] found a positive correlation between P2O5, SiO2, Al2O3 and Fe2O3 and the occurrence of REE in municipal waste incineration products, which supports this assumption.
The average content of metals and critical elements were also compared to the minimal profitable content in the currently exploited ores. As seen in Figure 3, Figure 4 and Figure 5, in the studied FA, only the content of Ba, Cr, Sb and Ce are above values typical for ores. For the other elements, the average concentrations in the studied FA are much lower, indicating that their recovery is problematic. Nevertheless, their fine-grained nature allows us to consider their direct use in the enrichment process, which might raise the content of valuable elements in the concentrates. In addition, easy access to already produced material, which will cause no additional production or preparation costs, makes it reasonable to consider them for direct usage.
The phosphorus content is very high in the sewage sludge ash (~17 wt% of P2O5), not only in comparison to the average rock composition, but also in comparison to the minimal profitable content and maximal content in the currently exploited raw materials (Figure 6). The P2O5 content in phosphate ores varies from 2–6% to 25–34%, depending on the processing methods, mining and geological conditions, and other factors that place sewage sludge ash at the level of the medium grade ores if used directly without processing for enrichment.

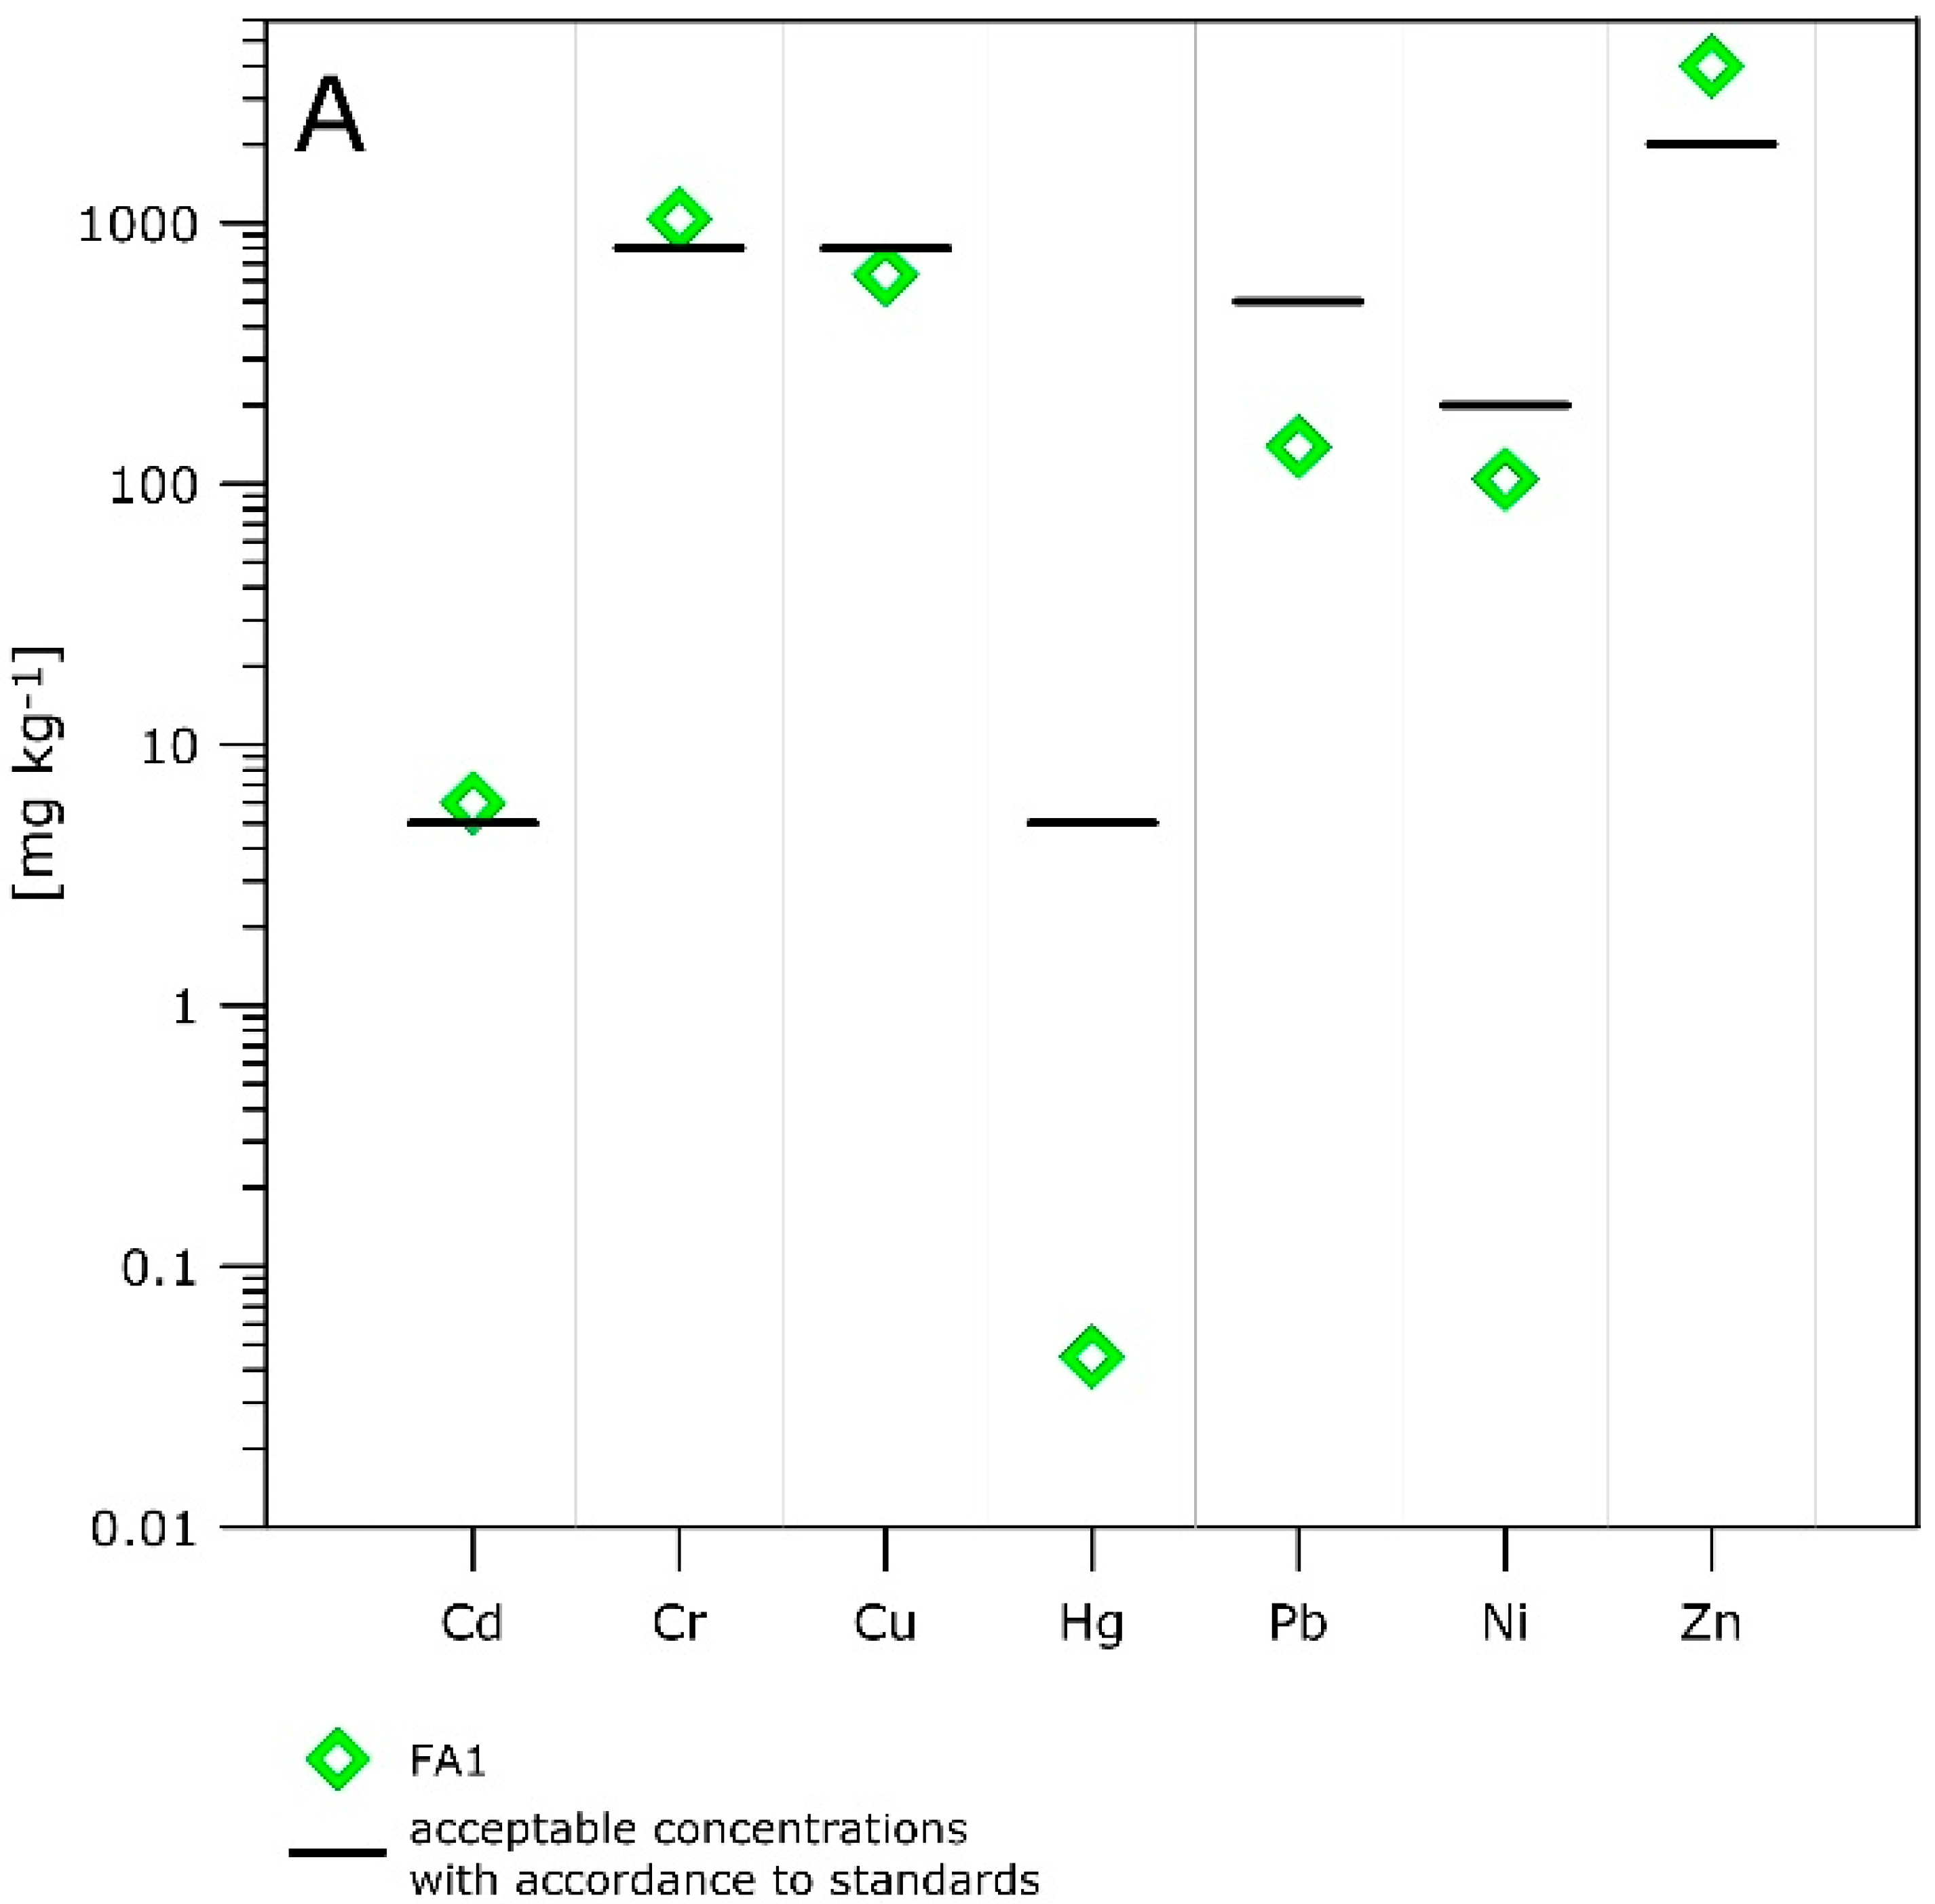
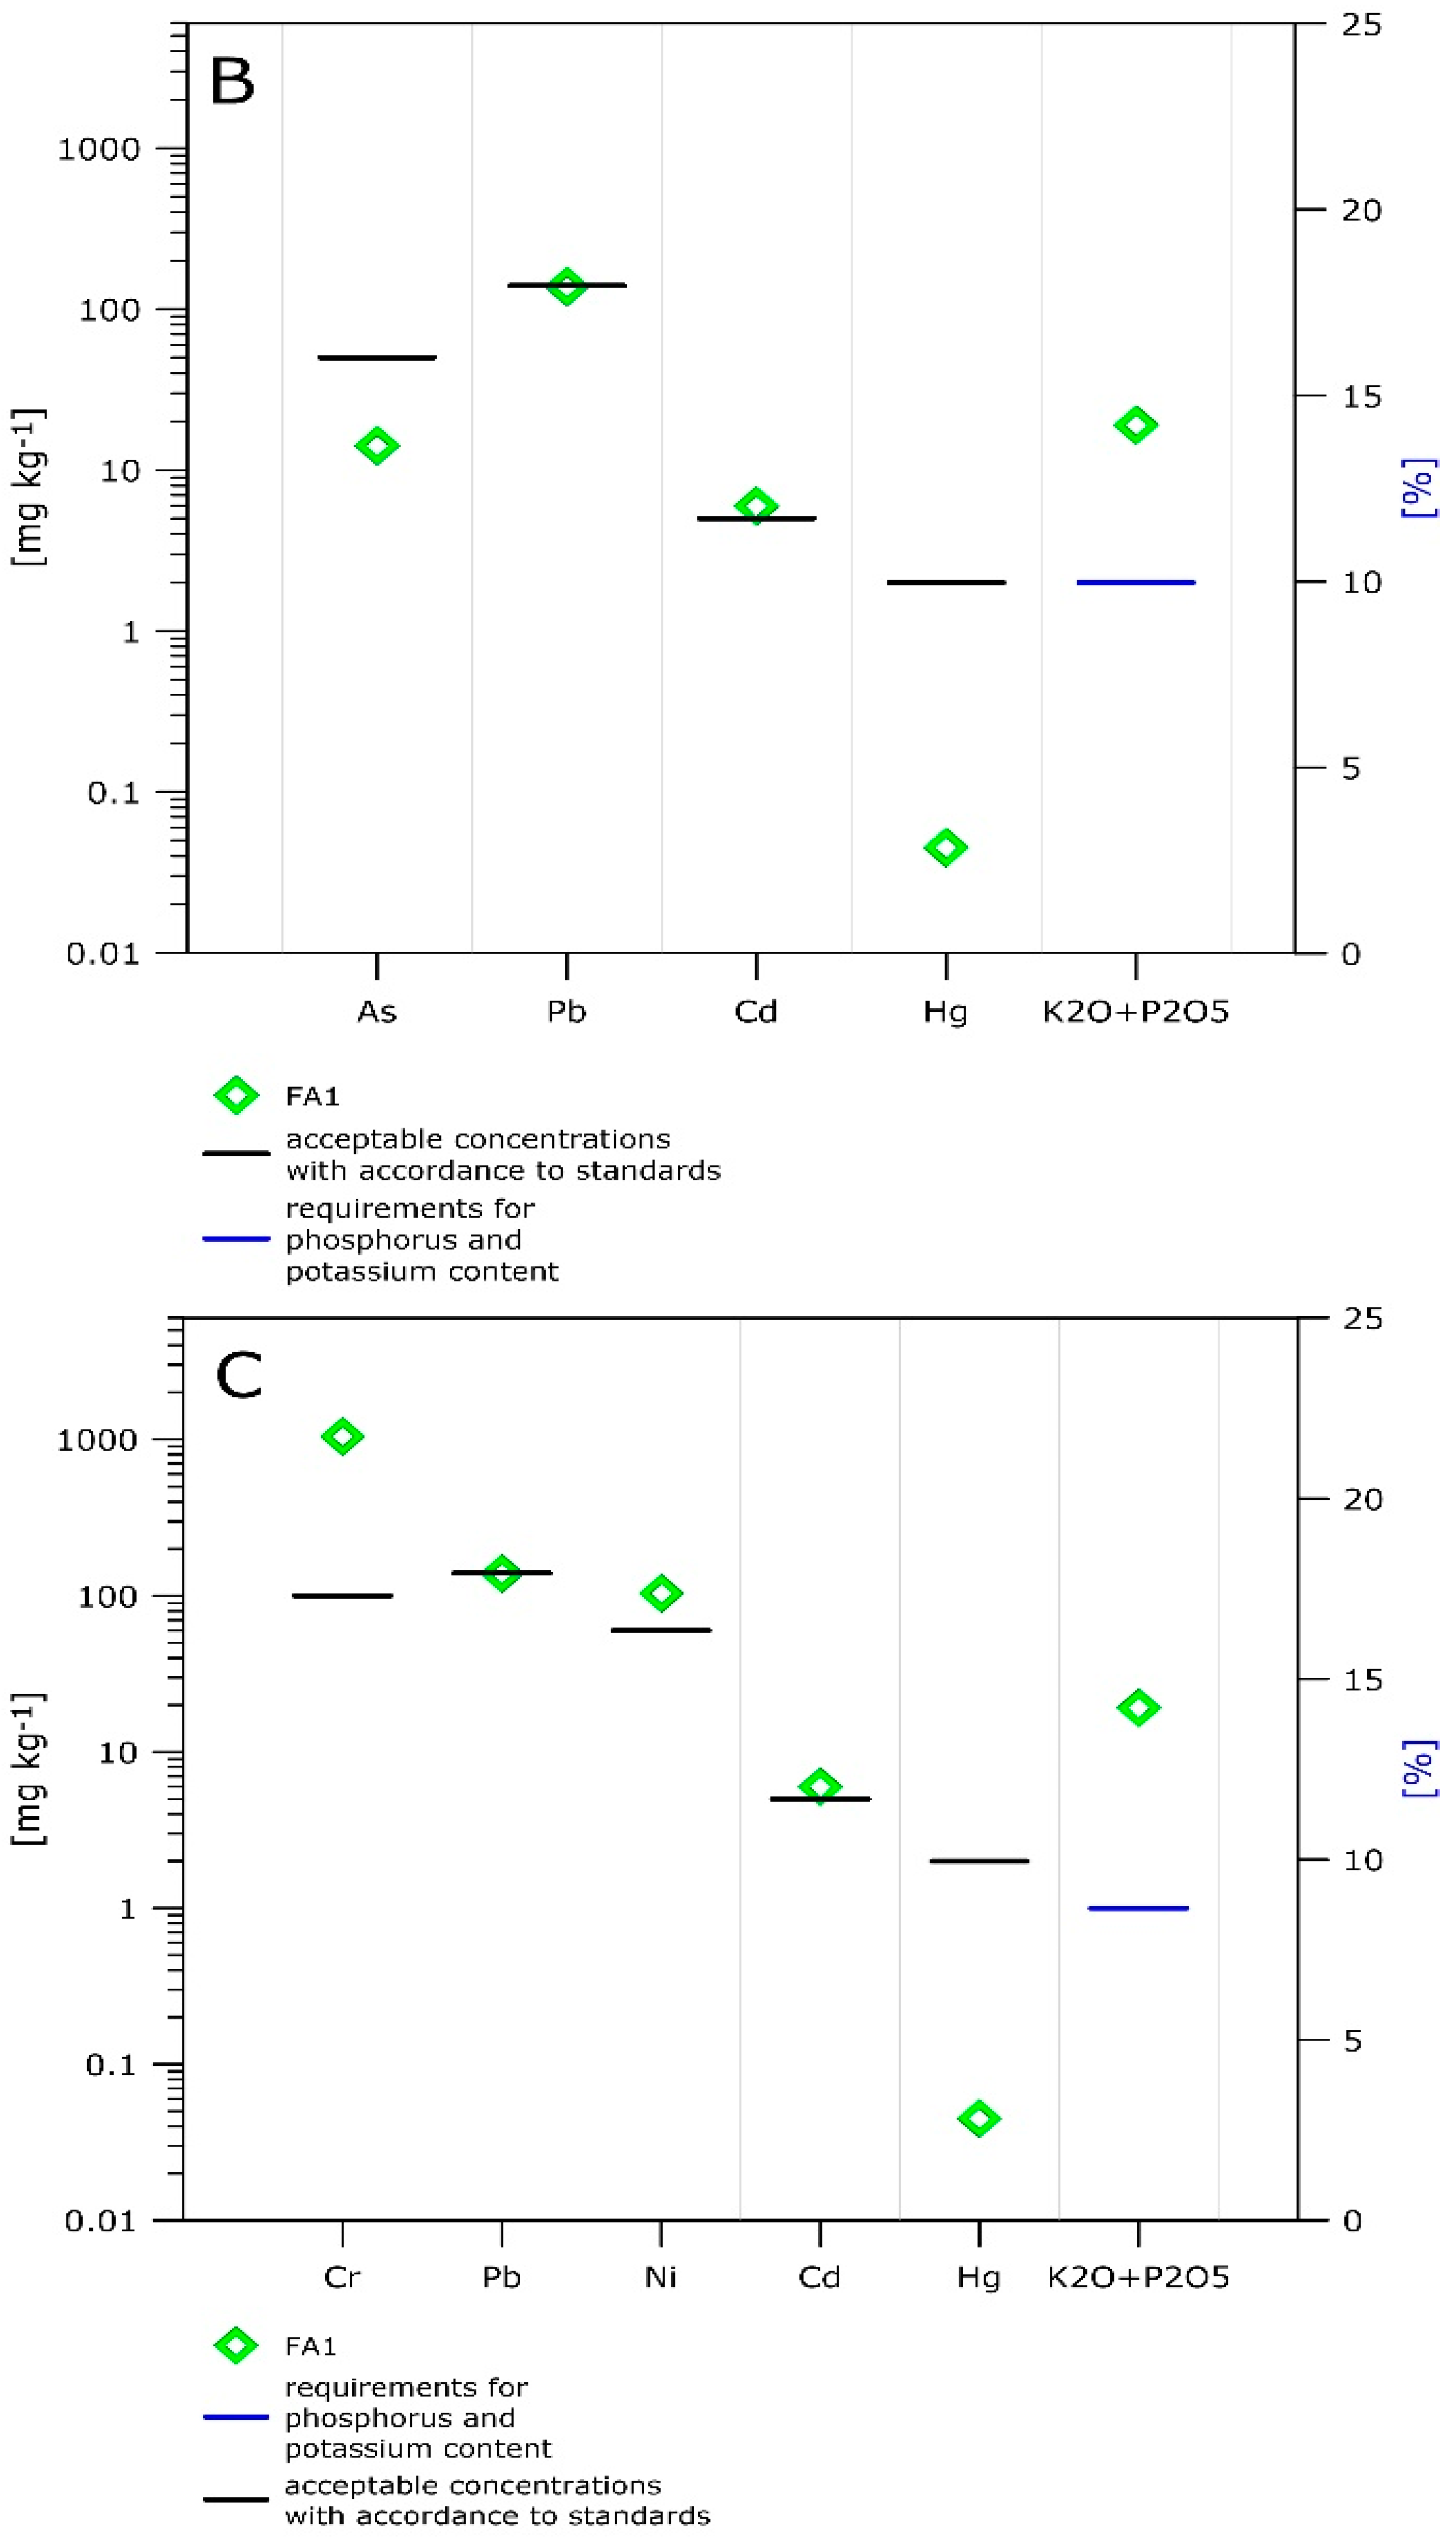
3.4. Possible Applications of FA

Due to the fact that FA, and especially those from sewage sludge incineration, contain elements which are micro- (e.g., Fe) and macro-nutrients (P, Ca, Mg, K, Al), these could be utilised for plant growth [35]. However, exceeding the concentration limits of Cr and Zn excludes this material from direct use in agriculture, in accordance with the requirements of the EU directive (Figure 7A; Table 5 [36]). For solid organic–mineral fertilisers, the standards for Cr and Ni are exceeded (Figure 7C, Table 5 [37]), but all standards for solid mineral fertilisers are fulfilled in the case of FA in accordance with Polish legislation (Figure 7B; Table 5 [37]).
The high content of Fe2O3 and Al2O3 enables us to consider them as a base material for zeolite synthesis [38]. The chemical composition (major components) and the particle size allow FA to be treated as sorbents [35]. Moreover, their application in cement production, road construction and brick material is possible [39], although the utilisation of FA in the aforementioned applications may be limited because of the content of minor components with a negative environmental impact or which influence the properties of the products. The recovery of valuable elements or other applications for FA could be competitive and the method of FA utilisation should be based on a comprehensive evaluation of the benefits.

4. Conclusions

  • Chemical composition of FA exhibits strong variation related to the localisation of incinerators.
  • FA contains more valuable and critical elements in comparison to the Earth materials, but less in comparison to the content of currently exploited ores; thus, the recovery of elements from FA seems to be unprofitable or unreasonable as direct extraction from unprocessed materials.
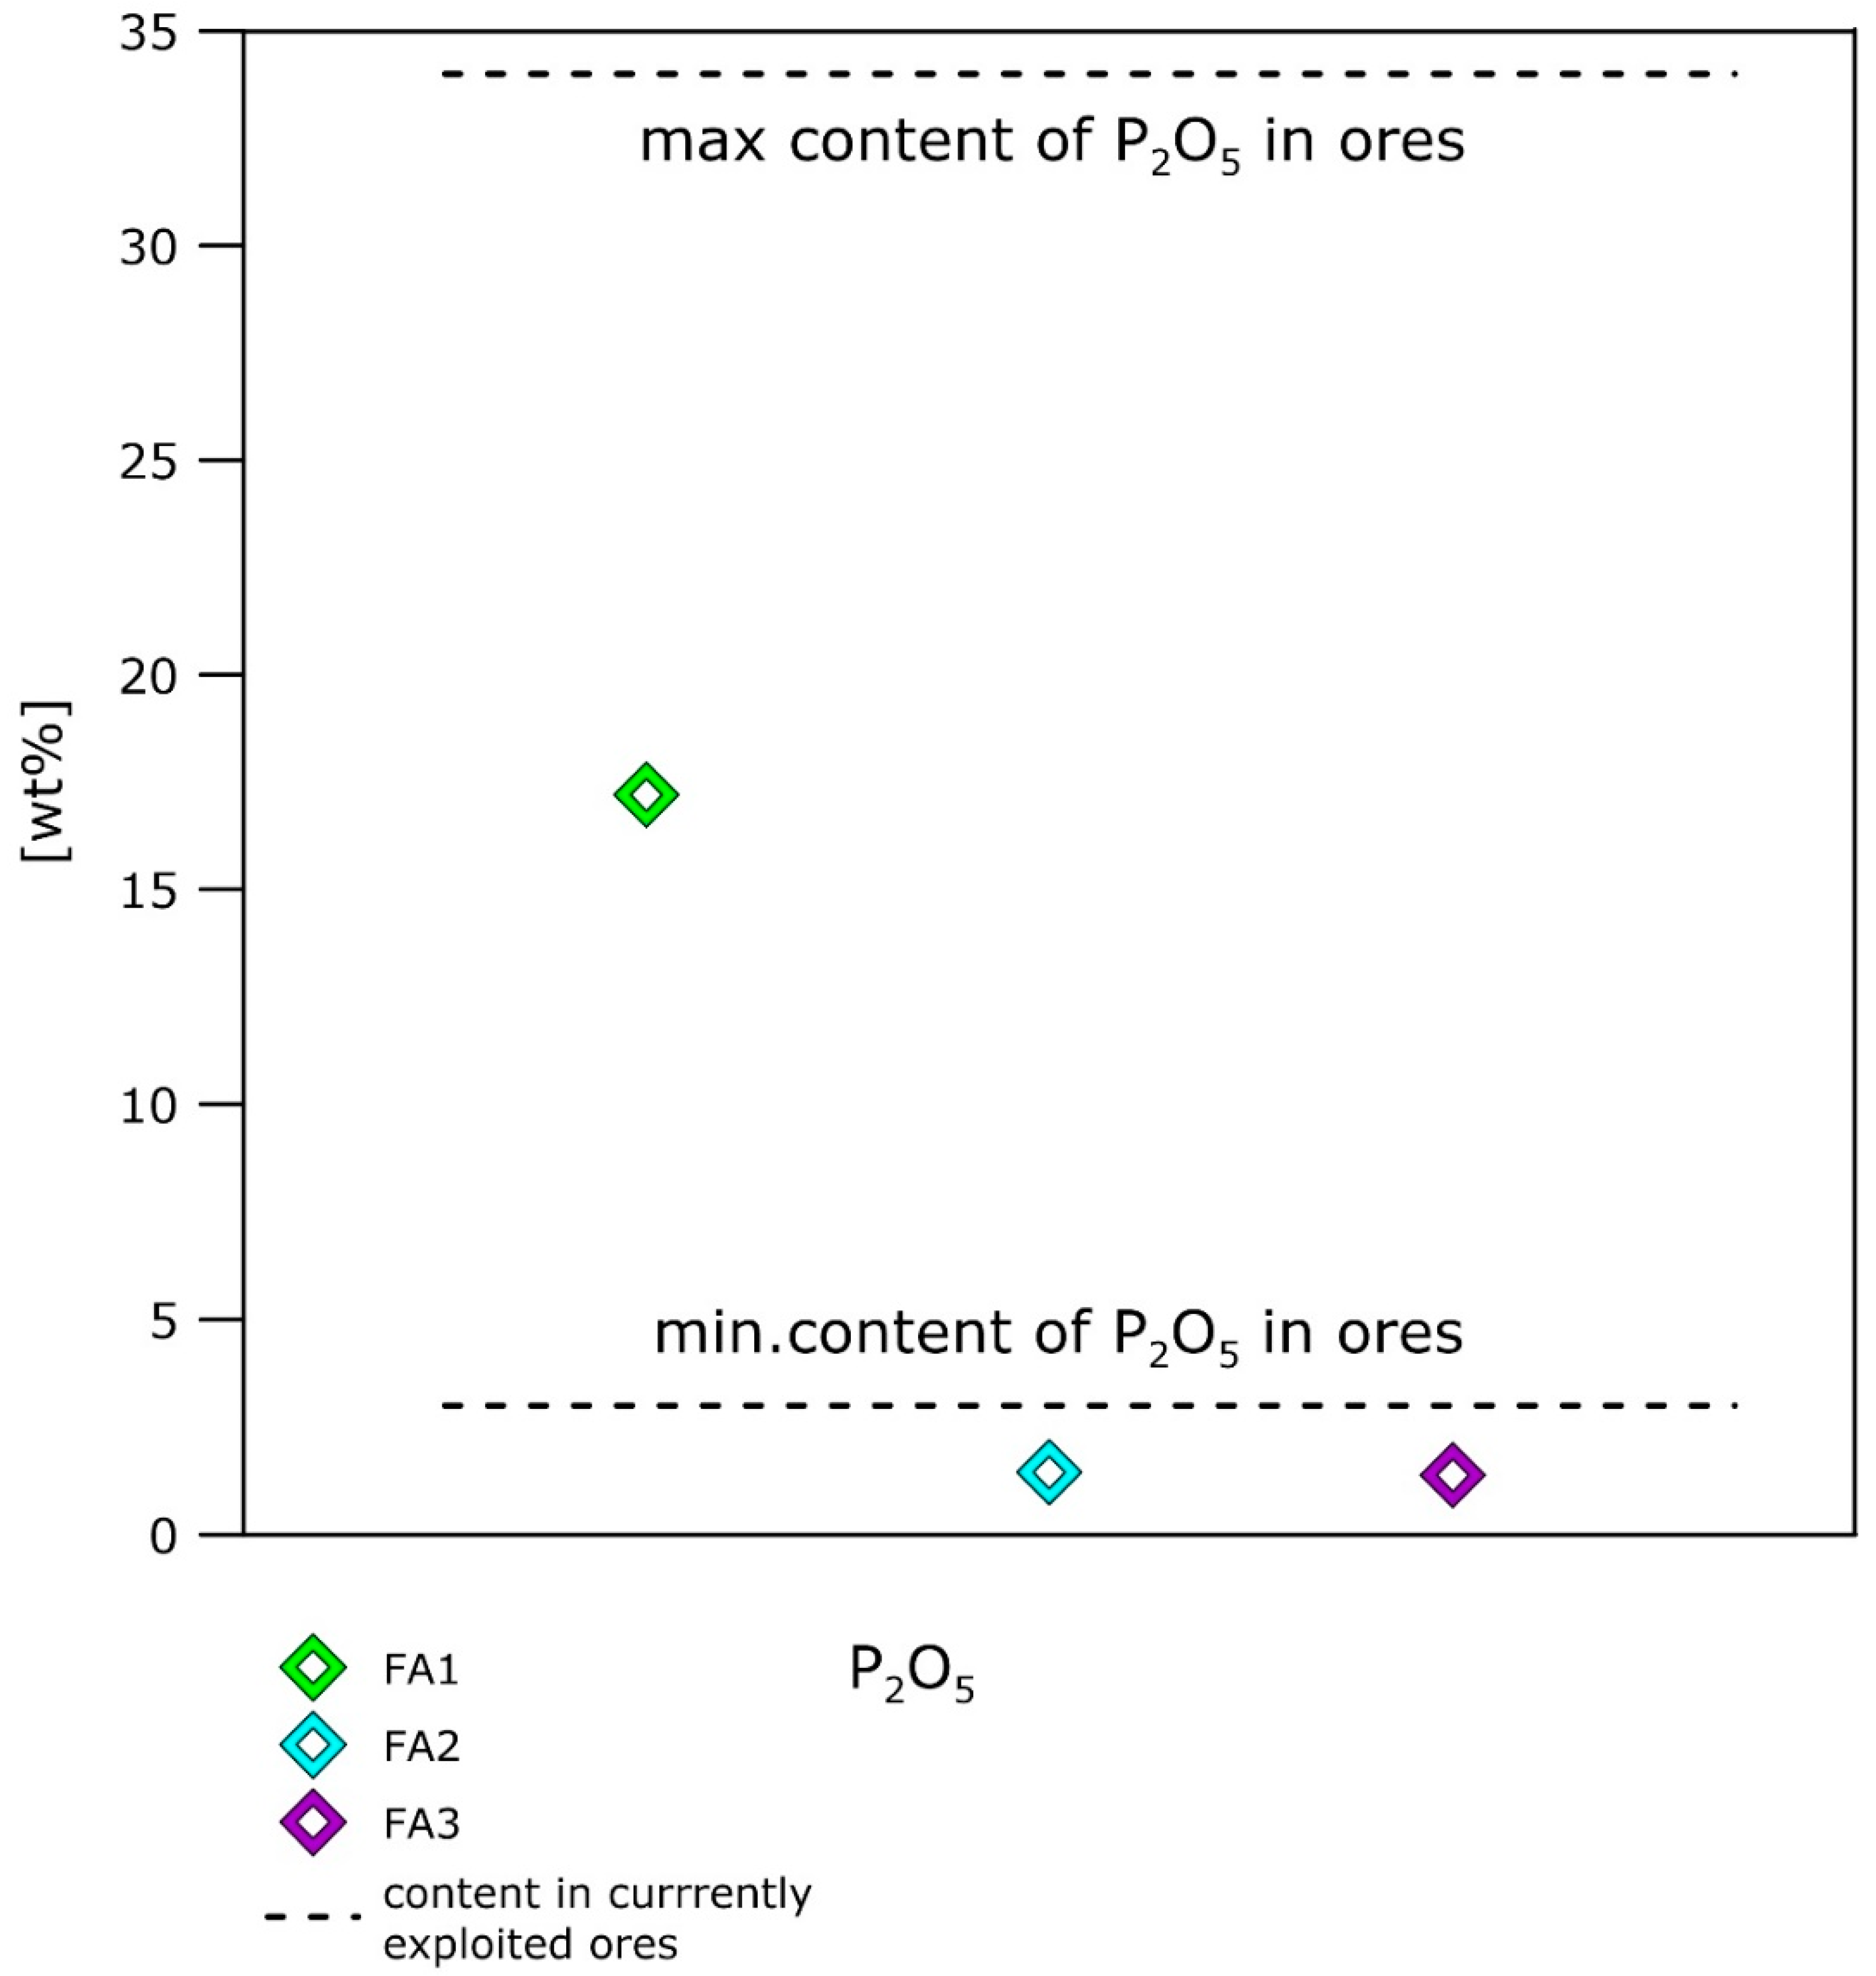
  • The high phosphorus content in the sewage sludge FA (~17 wt% of P2O5), where the concentration is close to medium grade ores, enables us to consider this material as a source of this element.
  • The decrease and exploitation of natural resources, mineral processing, and other technical costs such as building and maintaining infrastructure result in increasing environmental and social costs, whereas FA are easily accessible, cheap materials that do not require complicated processing methods due to the small fraction; therefore, FA can be considered as a future waste-based source of economically important elements (i.e., P, Zn, Sn, Cr, Pb, Au and Ag).

Author Contributions

Conceptualization, structure and methodology, M.K., M.M.; data curation, case study analysis, M.K., B.K.; writing—original draft preparation, M.K.; writing—review and editing, M.K., M.M., B.K., P.R.K.; visualization, M.K., B.K.; supervision, M.M. All authors have read and agreed to the published version of the manuscript.

Funding

This research was supported by the Polish National Science Centre (NCN) grant no. UMO-2014/15/B/ST10/04171.

Acknowledgments

The study was supported by the Polish National Science Centre (NCN) grant no. UMO-2014/15/B/ST10/04171. The publication was funded by the Priority Research Area Anthropocene under the program “Excellence Initiative—Research University” at the Jagiellonian University in Krakow. Piotr Kowalski and Bartłomiej Kajdas were hired within the project during its duration. Special thanks to Katarzyna Maj-Szeliga for technical support with the Mastersizer analyses.

Conflicts of Interest

The authors declare no conflict of interest.

References

  1. Steffen, W.; Grinevald, J.; Crutzen, P.; McNeill, J. The Anthropocene: Conceptual and historical perspectives. Phil. Trans. R. Soc. A 2011, 369, 842–867. [Google Scholar] [CrossRef] [PubMed]
  2. Steffen, W.; Persson, Å.; Deutsch Zalasiewicz, J.; Williams, M.; Richardson, K.; Crumley, C.; Crutzen, P.; Folke, C.; Gordon, L.; Molina, M.; et al. The Anthropocene: From Global Change to Planetary Stewardship. Ambio 2011, 40, 739–761. [Google Scholar] [CrossRef] [PubMed] [Green Version]
  3. Blengini, G.A.; Blagoeva, D.; Dewulf, J.; Torres de Matos, C.; Nita, V.; Vidal-Legaz, B.; Latunussa, C.; Kayam, Y.; Talens Peirò, L.; Baranzelli, C.E.L. Assessment of the Methodology for Establishing the EU List of Critical Raw Materials. Background Report; Joint Research Centre (JRC); Publications Office of the European Union: Luxembourg, 2017; ISSN 1831-9424. [Google Scholar] [CrossRef]
  4. Morf, L.S.; Gloor, R.; Haag, O.; Haupt, M.; Skutan, S.; Di Lorenzo, F.; Böni, D. Precious metals and rare earth elements in municipal solid waste—Sources and fate in a Swiss incineration plant. Waste Manag. 2013, 33, 634–644. [Google Scholar] [CrossRef] [PubMed]
  5. European Commission. Report on Critical Raw Materials for the EU 2014. In Report of the Ad-Hoc Working Group on Defining Critical Raw Materials; Raw Materials Supply Group: Brussels, Belgium, 2014. [Google Scholar]
  6. Communication from the Commission to the European Parliament, the Council, the European Economic and Social Committee and the Committee of the Regions on the 2017 list of Critical Raw Materials for the EU. Available online: https://ec.europa.eu/transparency/regdoc/rep/1/2017/EN/COM-2017-490-F1-EN-MAIN-PART-1.PDF (accessed on 13 September 2017).
  7. European Commission. Critical Raw Materials for the EU. 2010. In Report of the Ad-Hoc Working Group on Defining Critical Raw Materials; Raw Materials Supply Group: Brussels, Belgium, 2010. [Google Scholar]
  8. Achzet, B.; Helbig, C. How to evaluate raw material supply risks-an overview. Resour. Policy 2013, 38, 435–447. [Google Scholar] [CrossRef]
  9. Chapman, A.; Arendorf, J.; Castella, T.; Thompson, P.; Willis, P.; Tercero Espinoza, L.; Klug, S.; Wichmann, E. Study on Critical Raw Materials at EU Level. In Final Report Prepared by Oakdene Hollins and Fraunhofer ISI for EU COM DG Enterprise and Industry; Oakdene Hollins and Fraunhofer ISI: Aylesbury, UK, 2013. [Google Scholar]
  10. Glöser, S.; Tercero, L.; Gandenberger, C.M. Raw material criticality in the context of classical risk assessment. Resour. Policy 2015, 44, 35–46. [Google Scholar] [CrossRef]
  11. Helbig, C.; Wietschel, L.; Thorenz, A.; Tuma, A. How to Evaluate Raw Material Vulnerability—An Overview. Resour. Policy. 2016, 48, 13–24. [Google Scholar] [CrossRef]
  12. Zhang, F.-S.; Yamasaki, S.-I.; Nanzyo, M. Application of waste ashes to agricultural land—Effect of incineration temperature on chemical characteristics. Sci. Total Environ. 2001, 264, 205–214. [Google Scholar] [CrossRef]
  13. Binnemans, K.; Jones, P.T.; Blanpain, B.; Van Gerven, T.; Yang, Y.; Walton, A.; Buchert, M. Recycling of rare earths: A critical review. J. Clean Prod. 2013, 51, 1–22. [Google Scholar] [CrossRef]
  14. Mueller, S.R.; Wäger, P.A.; Widmer, R.; Williams, I.D. A geological reconnaissance of electrical and electronic waste as a source for rare earth metals. Waste Manag. 2015, 45, 226–234. [Google Scholar] [CrossRef] [Green Version]
  15. Brunner, P.H. Urban Mining A Contribution to Reindustrializing the City. J. Ind. Ecol. 2011, 15, 339–341. [Google Scholar] [CrossRef]
  16. Chandler, A.J.; Eighmy, T.T.; Hartlén, J.; Hjelmar, O.; Kosson, D.S.; Sawell, S.E.; van der Sloot, H.A.; Vehlow, J. Municipal Solid Waste Incineration Residues. In Studies in Environmental Science; Elsevier Science: Amsterdam, The Netherlands, 1997; Volume 67, ISBN 978-0-444-82563-6. [Google Scholar]
  17. Lynn, C.J.; Ghataora, G.S.; Dhir, O.B.E.R.K. Municipal incinerated bottom ash (MIBA) characteristics and potential for use in road pavements. Int. J. Pavement Res. Technol. 2017, 10, 185–201. [Google Scholar] [CrossRef]
  18. Kasina, M.; Wendorff-Belon, M.; Kowalski, P.R.; Michalik, M. Characterization of incineration residues from wastewater treatment plant in Polish city: A future waste based source of valuable elements? J. Mater. Cycles Waste Manag. 2019, 21, 885–896. [Google Scholar] [CrossRef] [Green Version]
  19. Cyr, M.; Coutand, M.; Clastres, P. Technological and environmental behaviour of sewage sludge ash (SSA) in cement-based materials. Cem. Concr. Res. 2007, 37, 1278–1289. [Google Scholar] [CrossRef]
  20. Alba, N.; Gasso, S.; Lacorte, T.; Baldasano, J.M. Characterization of municipal solid waste incineration residues from facilities with different air pollution control systems. J. Air Waste Manag. Assoc. 1997, 47, 1170–1179. [Google Scholar] [CrossRef]
  21. Shi, H.S.; Kan, L.L. Leaching behavior of heavy metals from municipal solid wastes incineration (MSWI) fly ash used in concrete. J. Hazard Mater. 2009, 164, 750–754. [Google Scholar] [CrossRef]
  22. Cheng, K.-L.; Hsu, S.-C.; Li, W.-M.; Ma, H.-W. Quantifying potential anthropogenic resources of buildings through hot spot analysis. Resour. Conserv. Recycl. 2018, 133, 10–20. [Google Scholar] [CrossRef]
  23. Wedepohl, K.H. The composition of the continental crust. Geochim. Cosmochim. Acta 1995, 59, 1217–1232. [Google Scholar] [CrossRef]
  24. Faure, G. Principles and Applications of Geochemistry; Prentice Hall: Pearson, NJ, USA, 1998; ISBN 0023364505. [Google Scholar]
  25. Rudnick, R.L.; Gao, S. The Composition of the Continental Crust; Holland, H.D., Turekian, K.K., Eds.; Elsevier-Pergamon: Oxford, UK, 2003; Volume 3, pp. 1–64. [Google Scholar]
  26. Laznicka, P. Giant Metallic Deposits; Springer-Verlag: Berlin Heidelberg, Germany, 2006; eBook; ISBN 978-3-540-33092-9. [Google Scholar] [CrossRef]
  27. Allegrini, E.; Maresca, A.; Olsson, M.E.; Holtze, M.S.; Boldrin, A.; Astrup, T.F. Quantification of the resource recovery potential of municipal solid waste incineration bottom ashes. Waste Manag. 2014, 34, 1627–1636. [Google Scholar] [CrossRef]
  28. Kowalski, P.R.; Kasina, M.; Michalik, M. Metallic Elements Fractionation in Municipal Solid Waste Incineration Residues. Energy Procedia 2016, 97, 31–36. [Google Scholar] [CrossRef] [Green Version]
  29. Hughes, C.J. Igneous Petrology, v. 7, 1st ed.; Elsevier: Amsterdam, The Netherlands, 2003; p. 96. ISBN1 9780444420114. ISBN2 9781483289694. [Google Scholar]
  30. Jaiswal, S.; Das, M.; Maiti, S.K. Environmental impact of flyash and its management: An overview. Indian J. Environ. Prot. 2006, 26, 68–275. [Google Scholar]
  31. Youcai, Z.; Lijie, S.; Guojian, L. Chemical stabilization of MSW incinerator fly ashes. J. Hazard Mater. 2002, 95, 47–63. [Google Scholar] [CrossRef]
  32. Colling, D.; Vasilos, T. Industrial Materials: Vol. 1, Metals and Alloys; Prentice Hall: Englewood Cliffs, NJ, USA, 1995. [Google Scholar]
  33. Preiss, M.K. Method Development to Recover Zinc from Fly Ash Originating from Municipal Solid Waste Incineration in Sweden. Master’s Thesis, University of Borås, Borås, Sweden, 2013. [Google Scholar]
  34. Funari, V.; Mäkinen, J.; Salminen, J.; Braga, R.; Dnelli, E.; Revitzer, H. Metal removal from Municipal Solid Waste Incineration fly ash: A comparison between chemical leaching and bioleaching. Waste Manag. 2017, 60, 397–406. [Google Scholar] [CrossRef]
  35. Ahmaruzzaman, M. A review on the utilization of fly ash. Prog. Energy Combust. Sci. 2010, 36, 327–363. [Google Scholar] [CrossRef]
  36. Van de Velden, M.; Dewil, R.; Baeyens, J.; Josson, L.; Lanssens, P. The distribution of heavy metals during fluidized bed combustion of sludge (FBSC). J Hazard Mater. 2008, 151, 96–102. [Google Scholar] [CrossRef] [PubMed]
  37. Rozporządzenie Ministra Rolnictwa i Rozwoju Wsi z dnia 18 czerwca 2018 r. w sprawie wykonania niektórych przepisów ustawy o nawozach i nawożeniu. Dziennik Ustaw Rzeczypospolitej Polskiej nr 2008, 119, Poz. 765. (In Polih)
  38. Querol, X.; Moreno, N.; Umana, J.C.; Alastuey, A.; Hernandez, E.; Lopez-Soler, A.; Plana, F. Synthesis of zeolites from coal fly ash: An overview. Int. J. Coal Geol. 2002, 50, 413–423. [Google Scholar] [CrossRef]
  39. Bhattacharjee, U.; Kandpal, T.C. Potential of fly utilization in India. Energy 2002, 27, 151–166. [Google Scholar] [CrossRef]
Figure 1. The photograph of sewage sludge incineration ash (FA1; on the left) and FA from incineration of municipal solid waste (on the right).
Resources 09 00131 g001
Figure 2. Total-alkali-silica classification diagram for the FA samples.
Resources 09 00131 g002
Figure 3. Average content of metals and potentially toxic elements in currently exploited ores.
Resources 09 00131 g003
Figure 4. Average content of other elements in currently exploited ores and in FA.
Resources 09 00131 g004
Figure 5. Average content of REE in currently exploited ores and in FA.
Resources 09 00131 g005
Figure 6. Average content of P2O5 in currently exploited ores and in FA.
Resources 09 00131 g006
Figure 7. Possible usage of FA1 as fertiliser. (A): direct use in agriculture, in accordance with the requirements of the EU directive; (B): use as solid mineral fertilisers in accordance with Polish legislation [37]; (C): use as organic–mineral fertilisers in accordance with Polish legislation [37].
Resources 09 00131 g007aResources 09 00131 g007b
Table 1. The minimum, maximum and mean concentrations of major and minor elements in the fly ash (FA) from the three studied localities.
FA1 (n = 6)FA2 (n = 4)FA3 (n = 10)
Min. ContentMax. ContentAverageMin. ContentMax. ContentAverageMin. ContentMax. ContentAverage
%
SiO235.0440.5637.6515.9920.7517.9929.4232.7331.64
Al2O37.418.768.267.298.077.727.3110.468.35
Fe2O312.4615.8514.181.242.021.702.354.833.09
MgO3.353.783.562.212.372.272.052.142.10
CaO9.9113.4511.7035.1539.4437.2327.4228.8627.95
Na2O0.630.740.693.214.473.932.513.312.86
K2O1.721.931.862.543.913.382.402.812.56
TiO20.850.980.941.801.971.921.341.851.57
P2O516.1017.9217.201.391.501.451.231.581.39
MnO0.100.120.110.080.100.080.080.110.10
LOI2.306.003.285.0010.807.939.2017.0814.87
Ctot0.120.190.1424.6043.3032.2726.6835.4330.30
Stot0.610.790.69194.00339.60318.50112.30169.63136.65
mg kg−1
Ag12.0014.4012.97846.001039.00913.67932.001108.001047.56
As11.6016.2014.231.001.001.001.003.001.94
Au*0.6380.9060.7740.0200.0390.0280.0200.0470.031
Ba1015.001446.001186.831.202.702.002.502.702.65
Be1.003.002.004.108.105.908.109.508.63
Bi7.2010.509.173.504.103.834.656.005.17
Cd4.807.005.9710.8011.6011.2010.2011.7011.06
Ce39.0044.4042.6532.3050.4043.9332.0038.5535.41
Co26.0041.5030.40398.00595.00515.33169.00266.75226.31
Cr770.001530.001040.00570.00700.00626.6756.5069.0062.88
Cs4.106.905.15466.30550.70498.57349.00422.18393.54
Cu570.30666.60632.581.702.702.030.901.231.08
Dy2.452.972.743.704.504.134.604.854.73
Er1.571.901.701.401.601.501.801.901.84
Eu0.610.730.6621.0030.0025.6739.2551.0043.31
Ga7.408.908.205.2073.0034.336.80134.0865.19
Gd3.033.683.28140.50161.00153.17182.30249.00205.40
Hf6.408.607.3511.8012.3011.2710.5013.6012.41
Hg0.010.060.0514.6017.0015.9316.4017.4316.95
Ho0.510.640.5725.8030.8027.9029.0830.3830.16
La19.0022.9021.582.682.882.772.793.453.10
Lu0.230.280.269.5010.4010.0710.1012.3311.20
Mo18.3025.5021.721.331.551.471.642.141.95
Nb8.5010.709.650.520.640.570.460.700.59
Nd15.3018.6016.731.341.581.511.682.171.92
Ni79.30119.50103.970.300.410.370.300.430.37
Pb125.90151.60138.781.151.321.191.321.831.64
Pr4.034.884.420.190.230.220.240.370.31
Rb50.1057.8054.030.640.770.650.901.161.00
Sb5.907.806.820.040.100.080.110.150.13
Sc6.006.005.830.640.710.640.741.010.91
Se2.408.505.620.050.110.080.110.160.13
Sm2.833.513.210.221.380.781.652.572.14
Sn147.00473.00333.005.166.475.752.163.932.93
Sr491.70548.10519.8211.3014.4011.679.8012.8010.71
Ta0.600.700.67258.70300.90284.20362.98407.10388.72
Tb0.450.510.48119.70461.60227.73404.131423.50762.27
Th5.706.606.105002.008067.005698.003729.254489.004198.06
Tl0.701.100.8836.9058.2045.2047.9062.8354.76
Tm0.220.280.257.9019.3010.808.8010.659.74
U7.709.408.6313.6021.1016.737.209.658.02
V62.0089.0071.6710.0013.6011.675.308.607.16
W7.50137.2050.9864.10134.6093.2711.0045.0530.44
Y15.2018.8016.950.010.060.040.063.391.99
Yb1.601.881.750.100.100.100.100.350.23
Zn3550.004472.003975.831.504.202.601.903.052.59
Zr246.60344.70290.872.003.002.003.003.753.19
n—number of samples analysed.
Table 2. Average content of the main elements in FA compared to the average content of the main elements in rocks.
SiO2Al2O3Fe2O3MgOCaONa2OK2OTiO2P2O5MnO
FA 137.468.0214.323.6612.090.701.830.9317.180.11
FA 218.237.531.582.3136.644.093.741.861.440.09
FA 330.927.323.802.1028.342.552.491.401.250.10
Ultramafic rocks42.362.2713.7838.472.240.660.020.050.040.20
Basalt50.2715.6512.307.5410.072.521.001.900.260.23
High-Ca granites67.1715.494.231.563.543.833.040.570.210.07
Low-Ca granites74.2313.602.030.270.713.485.060.200.140.05
Continental crust66.6215.405.042.483.593.272.800.640.150.10
Tonalites61.9016.306.302.604.903.901.900.770.260.09
Sandstone78.724.721.401.165.470.441.290.250.040.00
Greywackes69.1013.505.902.302.603.002.000.720.130.10
Shale15.6215.126.752.493.091.293.200.770.160.11
Carbonate rocks5.130.790.477.7942.300.050.330.070.090.14
Deep-sea clay53.4815.879.293.484.065.393.010.770.340.87
Table 3. Average content of other metals and semimetals in FA compared to the average content in rocks and currently exploited ores.
AgAsAuBaBeCdCoCrCuHgGa
mg kg−1mg kg−1µg kg−1mg kg−1mg kg−1mg kg−1mg kg−1mg kg−1mg kg−1mgkg−1mg kg−1
FA 112.8513.98737.581262.251.755.6332.351200.00639.300.038.05
FA 212.8714.6074.27978.0028.2738.501.00910.00286.230.046.23
FA 38.2610.2438.931075.1339.8431.052.00887.00374.343.718.45
Ultramafic0.050.806.000.700.200.05175.001800.0015.000.011.80
Basalt0.112.204.00315.000.700.2147.00185.0094.000.0918.00
High-Ca granites0.051.904.00420.002.000.137.0022.0030.000.0817.00
Low-Ca granites0.041.504.00840.003.000.131.004.1010.000.0817.00
Continental crust53.004.801.50624.002.100.0917.3092.0028.000.0517.50
Tonalitesn.dn.dn.d608.00n.dn.d16.0038.0019.00n.d19.00
Sandstone0.011.00n.d10.00n.dn.d0.3035.00n.d0.0312.00
Greywackesn.dn.d4.80426.00n.dn.d15.0088.0024.00n.d16.00
Shale0.0713.00n.d580.003.000.3019.0090.0045.000.4019.00
Carbonate rocks0.011.00n.d10.00n.d0.040.1011.004.000.044.00
Deep-sea clay0.1113.00n.d2300.002.600.4274.0090.00250.000.1020.00
currently exploited ores700.001000.005000.00590.00300.001000.00500.00310.005000.00400.00100.00
MoNbNiPbSbSeSnTaTlVZn
mg kg−1mg kg−1mg kg−1mg kg−1mg kg−1mg kg−1mg kg−1mg kg−1mg kg−1mg kg−1mg kg−1
FA 121.487.9397.00135.736.935.68340.750.730.8074.503969.50
FA 212.7011.2741.27341.70287.533.50561.332.230.1026.336669.67
FA 311.5811.1858.96472.24151.104.38255.631.160.3845.134038.13
Ultramafic0.309.002000.000.500.100.050.500.500.0440.0040.00
Basalt1.5020.00145.007.000.600.051.500.800.21225.00118.00
High-Ca granites1.0020.0015.0015.000.200.051.503.600.7288.0060.00
Low-Ca granites1.3021.004.5019.000.200.053.004.202.3044.0039.00
Continental crust1.1012.0047.0017.000.400.092.100.900.9097.0067.00
Tonalitesn.d8.8019.0014.20n.dn.d2.401.10n.d103.0061.00
Sandstone0.20n.d2.007.000.010.050.100.010.8220.0016.00
Greywackesn.d8.4024.0014.20n.dn.dn.dn.dn.d98.0076.00
Shale2.6011.0068.0020.001.500.606.000.801.40130.0095.00
Carbonate rocks0.400.3020.009.000.200.080.100.010.0120.0020.00
Deep-sea clay27.0014.00225.0080.001.000.171.500.100.80120.00225.00
currently exploited ores10,000.004100.0015,000.00300,000.0027.0020,000.004000.00410.0010,000.00500.0050,000.00
n.d.—no data in the cited references.
Table 4. Average content of rare earth elements (REE) in FA compared to the average content in rocks and currently exploited ores.
ScYLaCePrNdSmEu
mg kg−1mg kg−1mg kg−1mg kg−1mg kg−1mg kg−1mg kg−1mg kg−1
FA 15.7516.5320.9542.204.4116.633.190.65
FA 22.337.6515.4728.872.8210.131.710.61
FA 33.4013.5617.1029.733.3411.902.110.67
Ultramafic10.00n.d1.303.500.491.900.420.14
Basalt27.0021.006.1016.002.7014.004.301.50
High-Ca granites14.00335.0045.0081.007.7033.008.801.40
Low-Ca granites7.0040.0055.0092.008.8037.0010.001.60
Continental crust14.0021.0031.0063.007.1027.004.701.00
Tonalites11.0022.0023.0053.008.5025.004.901.40
Sandstone1.0040.0030.0092.008.8037.0010.001.60
Greywackes16.0026.0034.0058.006.1025.004.601.20
Shale13.0026.0092.0059.005.6024.006.401.00
Carbonate rocks1.0030.001.0011.501.104.701.300.20
Deep-sea clay19.0090.00115.00345.0033.00140.0038.006.00
currently exploited ores20.00240,000.002600.0018.001600.006000.00690.00220.00
GdTbDyHoErTmYbLu
mg kg−1mg kg−1mg kg−1mg kg−1mg kg−1mg kg−1mg kg−1mg kg−1
FA 13.250.472.650.561.680.241.730.25
FA 21.460.411.230.220.700.100.670.10
FA 32.120.421.790.361.100.150.980.15
Ultramafic rocks0.540.120.770.120.300.040.380.04
Basalt6.201.105.901.403.600.603.200.55
High-Ca granites8.801.406.301.803.500.303.501.10
Low-Ca granites10.001.607.202.004.000.304.001.20
Continental crust4.000.703.900.832.300.302.000.31
Tonalites4.200.753.500.901.90n.d2.400.37
Sandstone10.001.607.202.004.000.304.001.20
Greywackes4.000.633.400.782.20n.d2.100.37
Shale6.401.004.601.202.500.202.600.70
Carbonate rocks1.300.200.900.300.500.040.500.20
Deep-sea clay38.006.0027.007.5015.001.2015.004.50
currently exploited ores650.0043.00430.0016.0013.003.003.002200.00
n.d.—no data in the cited references.
Table 5. Standards for direct use of FA in agriculture, for solid mineral and solid organic-mineral fertilizer.
EU Dirrective [36]Solid Mineral Fertilisers [37] Solid Organic–Mineral Fertilisers [37]
mg/kg Dry Mass
Asn.d50n.d
Cr800n.d100
Cu800nd.n.d
Pb500505
Ni200n.d60
Zn2000n.dn.d
Cd5140140
Hg522
n.d—no data.
Publisher’s Note: MDPI stays neutral with regard to jurisdictional claims in published maps and institutional affiliations.

