
Quality Control of Vitamins A and E and Coenzyme Q10 in Commercial Anti-Ageing Cosmetic Products


Faculty of Pharmacy, University of Ljubljana, Aškerčeva cesta 7, 1000 Ljubljana, Slovenia
*
Author to whom correspondence should be addressed.
Cosmetics 2021, 8(3), 61; https://0-doi-org.brum.beds.ac.uk/10.3390/cosmetics8030061
Submission received: 14 May 2021
/
Revised: 11 June 2021
/
Accepted: 21 June 2021
/
Published: 25 June 2021
(This article belongs to the Special Issue Current and Evolving Practices in the Quality Control of Cosmetics)
Abstract
:Vitamins A and E and coenzyme Q10 are common ingredients in anti-ageing cosmetic products. Within this study, we evaluated the quality of commercial cosmetics with vitamin A (35 products), vitamin E (49 products), and coenzyme Q10 (27 products) by using validated HPLC–UV methods. Vitamin A was determined as retinol, retinyl palmitate, retinyl propionate, β carotene, and hydroxypinacolone retinoate in concentrations ranging from 950 ng/g to 19 mg/g. Total vitamin A contents, expressed with retinol equivalents, ranged from 160 ng/g to 19 mg/g, and were above the maximum concentration recommended by the SCCS in six of the 35 tested cosmetics. The content-related quality control of 10 cosmetics with specified vitamin A content revealed significant deviations (between 0% and 400%) of the label claim. Vitamin E was determined as both tocopherol and tocopheryl acetate in concentrations between 8.5 µg/g and 16 mg/g. Coenzyme Q10 was determined as ubiquinone in 24 tested cosmetics, which labelled it, in concentrations between 4.2 µg/g and 100 µg/g. Labelling irregularities were observed in all three active compound groups, resulting in a significant share (42%) of improperly labelled cosmetic products. The results of this study reveal the need for stricter cosmetics regulation and highlight the importance of their quality control, especially by evaluating the contents of the active compounds, in their efficacy and safety assurance.
Keywords:
active compounds; assay; cosmeceutics; functional cosmetics; HPLC–UV; labelling; retinoids; tocopherol; ubiquinone; β carotene1. Introduction
The topical application of fat-soluble vitamins A and E and coenzyme Q10 has various beneficial effects on the skin. Therefore, these three groups are important ingredients in the cosmetic industry [1,2]. The widespread use of vitamin E over the past several decades is mostly associated with its antioxidant activity [3]. Vitamin E is used in cosmetics as a cosmetically active ingredient (occlusive, humectant, emollient, and miscellaneous agent) [4] or as a stabilizer of other, unstable components of the cosmetic product [5,6]. Because of its antioxidant activity, topically applied vitamin E is effective in the treatment of skin conditions and diseases caused by oxidative stress, including UV-induced erythema and edema, sunburns, and lipid peroxidation [1,2]. It is also an effective anti-ageing agent [7,8]. Vitamin E is most commonly found in cosmetics in its active form, α-tocopherol, or more stable esterified form, tocopheryl acetate, which requires hydrolysis to the active form upon skin penetration [4]. Despite differing data on the extent of this conversion in the skin, most studies disclose the higher antioxidant activity of α-tocopherol compared to its esters [4,9,10,11,12]. Vitamin E may be found in a wide range of concentrations, from 0.0001% to 36% in cosmetic products on the market [13].
Retinoids are effective in the topical treatment of acne, hyperpigmentation, psoriasis, and skin-aging, and are therefore active ingredients in a variety of cosmetic products, especially as anti-ageing agents. The most common vitamin A forms found in cosmetics include retinol and its esters, retinyl palmitate and acetate, as well as β carotene. Analogously to vitamin E esters, vitamin A esters also require hydrolytic conversion to retinol, which is further metabolized to retinal and then to the active form—retinoic acid. Therefore, retinoid activity after topical application depends on the metabolic closeness to the active form and decreases in the following order: retinoic acid > retinal > retinol > retinyl esters [14]. Due to the possible risk of teratogenicity, retinoic acid is banned in cosmetic products in the EU [15]. Despite their poor activity, retinyl esters, especially retinyl palmitate, are commonly used in cosmetics due to their stability [14,16]. Due to safety reasons, the Scientific Committee on Consumer Safety, Secretariat at the European Commission, Directorate General for Health and Food Safety recommends a maximum retinoid concentration of 0.05% retinol equivalents (RE) in body lotions and 0.3% RE in hand and face creams, as well as other leave-on or rinse-off products for cosmetics in the EU [14]. However, cosmetics with significantly higher retinoid contents are found on the EU market.
Coenzyme Q10 is an endogenous nonvitamin lipophilic antioxidant, which is often analytically evaluated alongside fat-soluble vitamins, due to its lipophilic structure and activities in the human body [17]. Coenzyme Q10 is also an important antioxidant in the skin [1,18]. However, its skin levels decline with age and exposure to UV irradiation [19]. Topical coenzyme Q10 application is effective in the replenishment of its skin levels and thus provides skin protection and prevents skin inflammation, UV-induced erythema, and skin cancer [18,20,21]. Coenzyme Q10, in its ubiquinone form, is a popular ingredient in anti-ageing cosmetics, in which it is usually found in concentrations ≤ of 0.05% [22].
The efficacy of cosmetic products is directly associated with their quality. As discussed above, the efficacy depends on the form of the active ingredient (e.g., vitamin A or E esters), and also on their content, which is generally low (<1%). Another important challenge is the instability of these compounds, causing possible losses during manufacture and storage, leading to their even lower contents or complete loss [8,23,24]. Therefore, a prerequisite for their quality control is appropriate analytical methodology. Several analytical methods for the determination of a single retinoid [25,26,27,28,29,30] or retinoids in different forms [31,32,33] in topical formulations may be found in the literature, including two methods [34,35] for the quality control of specific vitamin A forms commonly found in cosmetics. The simultaneous determination of coenzyme Q10 and vitamin E (mostly in the form of tocopheryl acetate) in pharmaceutical products has been described in the literature [17,36], but to our knowledge has not been applied in the field of cosmetics. Within this study, we aimed to evaluate the quality of a significant number of commercial anti-ageing leave-on cosmetic products with vitamin A and E and coenzyme Q10 by applying appropriate analytical methodologies, including a novel method for the quality control of coenzyme Q10 and vitamin E, as tocopherol or tocopheryl acetate. We approached their quality control following the principles of the quality control of pharmaceuticals—by evaluation of the accuracy of their labelling, content determination, and comparison to the quantitative label claims in some cosmetics.
2. Materials and Methods
2.1. Chemicals and Reagents
The following vitamins were obtained from Sigma-Aldrich (Steinheim, Germany): all-trans-retinol (R) (≥99%), all-trans-retinyl palmitate (R-palm) (≥99%), β carotene (β-car) (≥99%), (±)-α-tocopherol (E) (≥96%), and DL-α-tocopherol acetate (E-ac) (≥96%). Retinyl acetate (R-ac) (≥97%) and coenzyme Q10 as ubiquinone (Q10) (≥99%) were purchased from Carbosynth (Berkshire, UK). Butylated hydroxytoluene (BHT) and HPLC-grade acetonitrile (ACN), tetrahydrofuran (THF), and n-hexane were obtained from Sigma-Aldrich (Steinheim, Germany). Ultra-pure water (MQ) was obtained through a Milli-Q water purification system A10 Advantage (Millipore Corporation, Bedford, MA, USA).
2.2. Instrumentation and Chromatographic Conditions
An Agilent 1100/1200 series HPLC system (Agilent Technologies, Santa Clara, CA, USA) equipped with a UV–VIS detector and ChemStation data acquisition system was utilized. The analysis was performed on a reversed-phase Luna C18 (2) 150 mm × 4.6 mm, 3 μm particle size column (Phenomenex, Torrance, CA, USA) at 40 °C using MQ (mobile phase A), ACN (mobile phase B), and ACN:THF (50:50, v/v) (mobile phase C) at a flow-rate of 1 mL/min.
Vitamin E (tocopherol and tocopheryl acetate) and coenzyme Q10 (ubiquinone) were analyzed using a gradient elution with the following gradient for their chromatographic separation: (time (min); % A; % B; % C): (0; 10; 10; 80), (5.5; 10; 10; 80), (7.0; 3; 5; 92), (10.0; 3; 5; 92), (10.1; 10; 10; 80). The detection wavelength was 280 nm. The injection volume was adjusted to the content of the examined analytes in the samples and was between 10 μL and 20 μL.
The examined retinoids (retinol, retinyl palmitate, retinyl acetate, β carotene, hydroxypinacolone retinoate, and retinyl propionate) were analyzed according to a validated method [34] using the following gradient program: (time (min); % A; % B; % C): (0; 10; 5; 85), (4; 5; 5; 90), (8; 5; 5; 90), (8.1; 10; 5; 85). Detection was carried out at 325 nm for retinol, retinyl acetate, retinyl palmitate, hydroxypinacolone retinoate, and retinyl propionate, and at 450 nm for β carotene. Injection volume was adjusted to the amount of retinoids in the tested products and was between 5 μL and 40 μL.
2.3. Preparation of Standard Solutions
Retinol, retinyl acetate, retinyl palmitate, β carotene, tocopherol, tocopheryl acetate, and coenzyme Q10 stock standard solutions were prepared fresh daily by dissolving appropriate amounts of the individual standard in a mixture of ACN and THF (50:50, v/v) in the case of vitamin E and coenzyme Q10, and n-hexane containing 500 mg/L BHT in the case of retinoids. Calibration standards and quality control (QC) solutions (in triplicate) were prepared by dilution of the individual stock standard solutions with the same solvent (Table 1). The retinoid solutions were evaporated to dryness under a stream of nitrogen at 40 °C (TurboVap LV, Caliper, Hopkinton, MA, USA) and reconstituted with a mixture of ACN and THF (50:50, v/v) with 150 mg/L BHT to obtain calibration standards and QC solutions as presented in Table 1. Standard solutions with lower concentrations than those presented in Table 1 were also prepared for confirmation of the limit of determination (LOD) and limit of quantification (LOQ). The prepared standard solutions were immediately analyzed.
2.4. Method Validation
Both utilized HPLC–UV methods were validated following the ICH guidelines Q2(R1) [37] in terms of specificity, linearity, precision, accuracy, LOD, LOQ, sample stability, sample preparation repeatability, and recovery. Specificity was assessed in both standard solutions (individual standards, their mixtures, all used solvents, some common ingredients in cosmetics-purified water, white petroleum jelly, liquid paraffin, cetyl and stearyl alcohol, macrogol cetostearyl ether, and benzyl alcohol) and in chromatograms of the tested cosmetic products, which were evaluated for interferences.
Linearity was assessed by a linear regression model of the individual analyte calibration standards, which were prepared and analyzed during three consecutive days (Table 1). The acceptance criterion was coefficient of determination (R2) > 0.999. The injection volumes during validation were 10 μL for retinol, retinyl acetate, and retinyl palmitate, and 20 μL for β carotene, tocopherol, tocopheryl acetate, and coenzyme Q10.
Accuracy and precision were evaluated intra- and inter-day on three QC levels, during three consecutive days (Table 1). Accuracy was determined as a ratio between the concentration calculated from the regression line and the actual concentration and was set to 100 ± 10%. Precision was determined as a relative standard deviation (RSD) of the three QC solutions on each concentration level and was set at ≤5%. Injection repeatability was determined by six consecutive injections of the medium QC solution and was set to ≤2%.
The LOD and LOQ were determined by a signal-to-noise ratio of 3:1 and 10:1, respectively, and were evaluated in chromatograms of standard solutions with known low concentrations and blank samples. Both values were confirmed by the analysis of standard solutions with comparable concentrations. LOD and LOQ values are provided as ng of the analyte per one gram of cosmetic product and were calculated for the most concentrated samples according to the sample preparation procedures (see Section 2.6. Analysis of the commercial cosmetic products).
The stability of the evaluated analytes was assessed in QC solutions on all three levels, which were stored at 8 °C for up to 24 h. Sample stability was calculated as a share of the initial response and was expected to be within 100 ± 5%.
Sample preparation repeatability was assessed by preparation of all tested products in triplicate and calculating the RSD between them, which was set at ≤5%.
Method recovery was assessed by the addition of the evaluated analyte to a cosmetic product with its significant amounts and separate analysis of the cosmetic product without addition and of the standard solution containing the added analyte amount in the extraction solvent. All samples were prepared in triplicate. Average recoveries were calculated by the following equation: recovery (%) = 100 × (concentration found in spiked sample−concentration found in the non-spiked sample)/added concentration. They were set at 100 ± 10%.
2.5. Selection and Overview of the Analyzed Commercial Cosmetic Products
Within this study, we evaluated anti-ageing leave-on facial cosmetic products, containing vitamin A, E, and/or coenzyme Q10. The cosmetic products were purchased between 2015 and 2021. All products were obtained locally on the Slovenian market, including grocery stores, drug stores, pharmacies, and on the Internet. To provide representative samples, products in various formulations (day and night creams, serums, eye creams, anti-ageing concentrates, and face tonics) and labelled with different forms of vitamin A and E were correspondingly included. One of the selection criteria was also the quantitative declaration of the content of the evaluated active ingredients on the cosmetic products. The obtained cosmetic products were categorized into five price ranges, considering their retail price in Slovenia, calculated to a uniform volume of 50 mL. An overview of the tested products, indicating the labelled forms of vitamins A and E and coenzyme Q10, as well as their forms and the price ranges, are provided in Table 2. Five cosmetic products (5, 6, 23, 40, and 54 in Table 2) have been previously analyzed [34].
2.6. Analysis of the Commercial Cosmetic Products
All tested cosmetic products were analyzed within their shelf-life, immediately after opening, in triplicate. Due to a time-lapse between the establishment of both analytical methods and the time of analysis, vitamin A, E, and coenzyme Q10 were not evaluated in 2 of the 37 cosmetics, 5 of the 53 cosmetics, and 4 of the 31 cosmetics, respectively, which labelled their presence. To accurately evaluate the content of vitamins A and E and coenzyme Q10, preliminary testing was initially performed, based on which the sample preparation procedure was adjusted to the individual cosmetic product.
2.6.1. Sample Preparation for the Analysis of Vitamin E and Coenzyme Q10
Samples for the analysis of tocopherol, tocopheryl acetate, and coenzyme Q10 were prepared by weighing a certain amount (between 200 and 1000 mg of the cosmetic product) into a plastic tube. A predefined amount (2, 5, or 10 mL) of a mixture of ACN and THF (75:25, v/v %) was added to the cosmetic product, followed by vortex mixing (3 min), sonication (15 min), additional vortex mixing (2 min), and centrifuging (4130× g, 25 °C, 10 min). The samples were filtered through a 0.45 μm Minisart® RC filter (Sartorious, Göttingen, Germany) before analysis.
2.6.2. Sample Preparation for the Analysis of Vitamin A
Samples for evaluation of vitamin A content were prepared according to a validated procedure for their analysis and quantification [34]. Samples from the tested semi-solid cosmetic products were prepared by initial weighing of the cosmetic product (75–1000 mg) into a plastic tube. Acetonitrile (2 mL) was added to the samples, followed by their sonication (5 min). Then, n-hexane (8 mL) with 500 mg/L BHT was added to the samples, which were further vortexed (5 min) and centrifuged (4130× g, 25 °C, 10 min). Part of the supernatant (0.5 mL–2.0 mL) was evaporated to dryness under a stream of nitrogen at 40 °C (TurboVap LV, Caliper, Tokyo, Japan). Dry residues were reconstituted with a mixture of ACN and THF (50:50, v/v %) with 150 mg/L BHT (0.5 mL–2.0 mL), sonicated (10 min), and vortexed (1 min). If needed, the samples were centrifuged (16 200× g, 25 °C, 5 min) before analysis.
Samples of the tested liquid cosmetic products were prepared by their dilution by 5- to 500-fold with a mixture of ACN and THF (50:50, v/v %) with 150 mg/L BHT. The samples were homogenized by sonication (10 min) and vortex mixing (5 min). If needed, the samples were centrifuged (16,200× g, 25 °C, 5 min) before analysis.
2.6.3. Quantification of Vitamins A and E and Coenzyme Q10
The contents of vitamins A and E and coenzyme Q10 in the tested cosmetic products were calculated from their linear regression lines. Due to the lack of hydroxypinacolone retinoate and retinyl propionate standards, their content was assessed based on retinyl acetate, which is structurally their most similar retinoid based on previous confirmation of their structural identity by LC-MS.
The analytically determined contents are presented as an average (AV) ± standard error of the mean (SEM), n = 3. Vitamin E contents are provided as a mass percentage (% m/m). The contents of vitamin A and coenzyme Q10 are provided as a mass percentile (‰ m/m), due to their lower contents. The tested cosmetic products were numbered consecutively within the specific categories (e.g., cosmetic products with vitamin E). The numbers in Table 2 and Figures 3–7 are not correlated between different figures and Table 2, and do not represent identification numbers for the individual products.
3. Results
3.1. Validation of the HPLC–UV Methods
The utilized HPLC–UV methods were validated following the ICH guidelines Q2(R1) in terms of specificity, linearity, precision, accuracy, LOD, LOQ, sample stability, sample preparation repeatability, and recovery. The specificity of the method was confirmed for all evaluated analytes as no interferences derived from the used solvents and the evaluated reagents, other evaluated analytes, or the cosmetic products were detected at their retention times and detection wavelength. A representative chromatogram of a standard mixture of retinol, retinyl acetate, and retinyl palmitate at 325 nm, β carotene standard solution at 450 nm, and standard mixture of tocopherol, tocopheryl acetate, and coenzyme Q10 at 280 nm, as well as some of the analyzed cosmetic products are provided in the Supplementary Materials (Figures S1–S7). Linearity was confirmed over the evaluated concentration ranges (Table 3). The methods’ LOD and LOQ were determined based on the signal-to-noise ratio. The methods were found sufficiently sensitive for the determination of the evaluated analytes in cosmetic products (Table 3). The sensitivity may be additionally increased by adjustments in the sample preparation procedure (mass of the cosmetic product, solvent volume, volume of the supernatant, and reconstitution solvent). The remaining validation parameters, including intra- and inter-day accuracy and precision, injection repeatability, and stability were within the acceptance criteria (Table 3).
The sample preparation procedure was found repeatable, as the RSD between the triplicates of the same cosmetic product was <5% for all tested cosmetic products (Figures 3, 5 and 6). The average recoveries for all evaluated analytes, except for retinyl acetate, which was not found in any cosmetic product, were also within the acceptance criterion 100 ± 10%.
3.2. Overview of the Tested Cosmetics
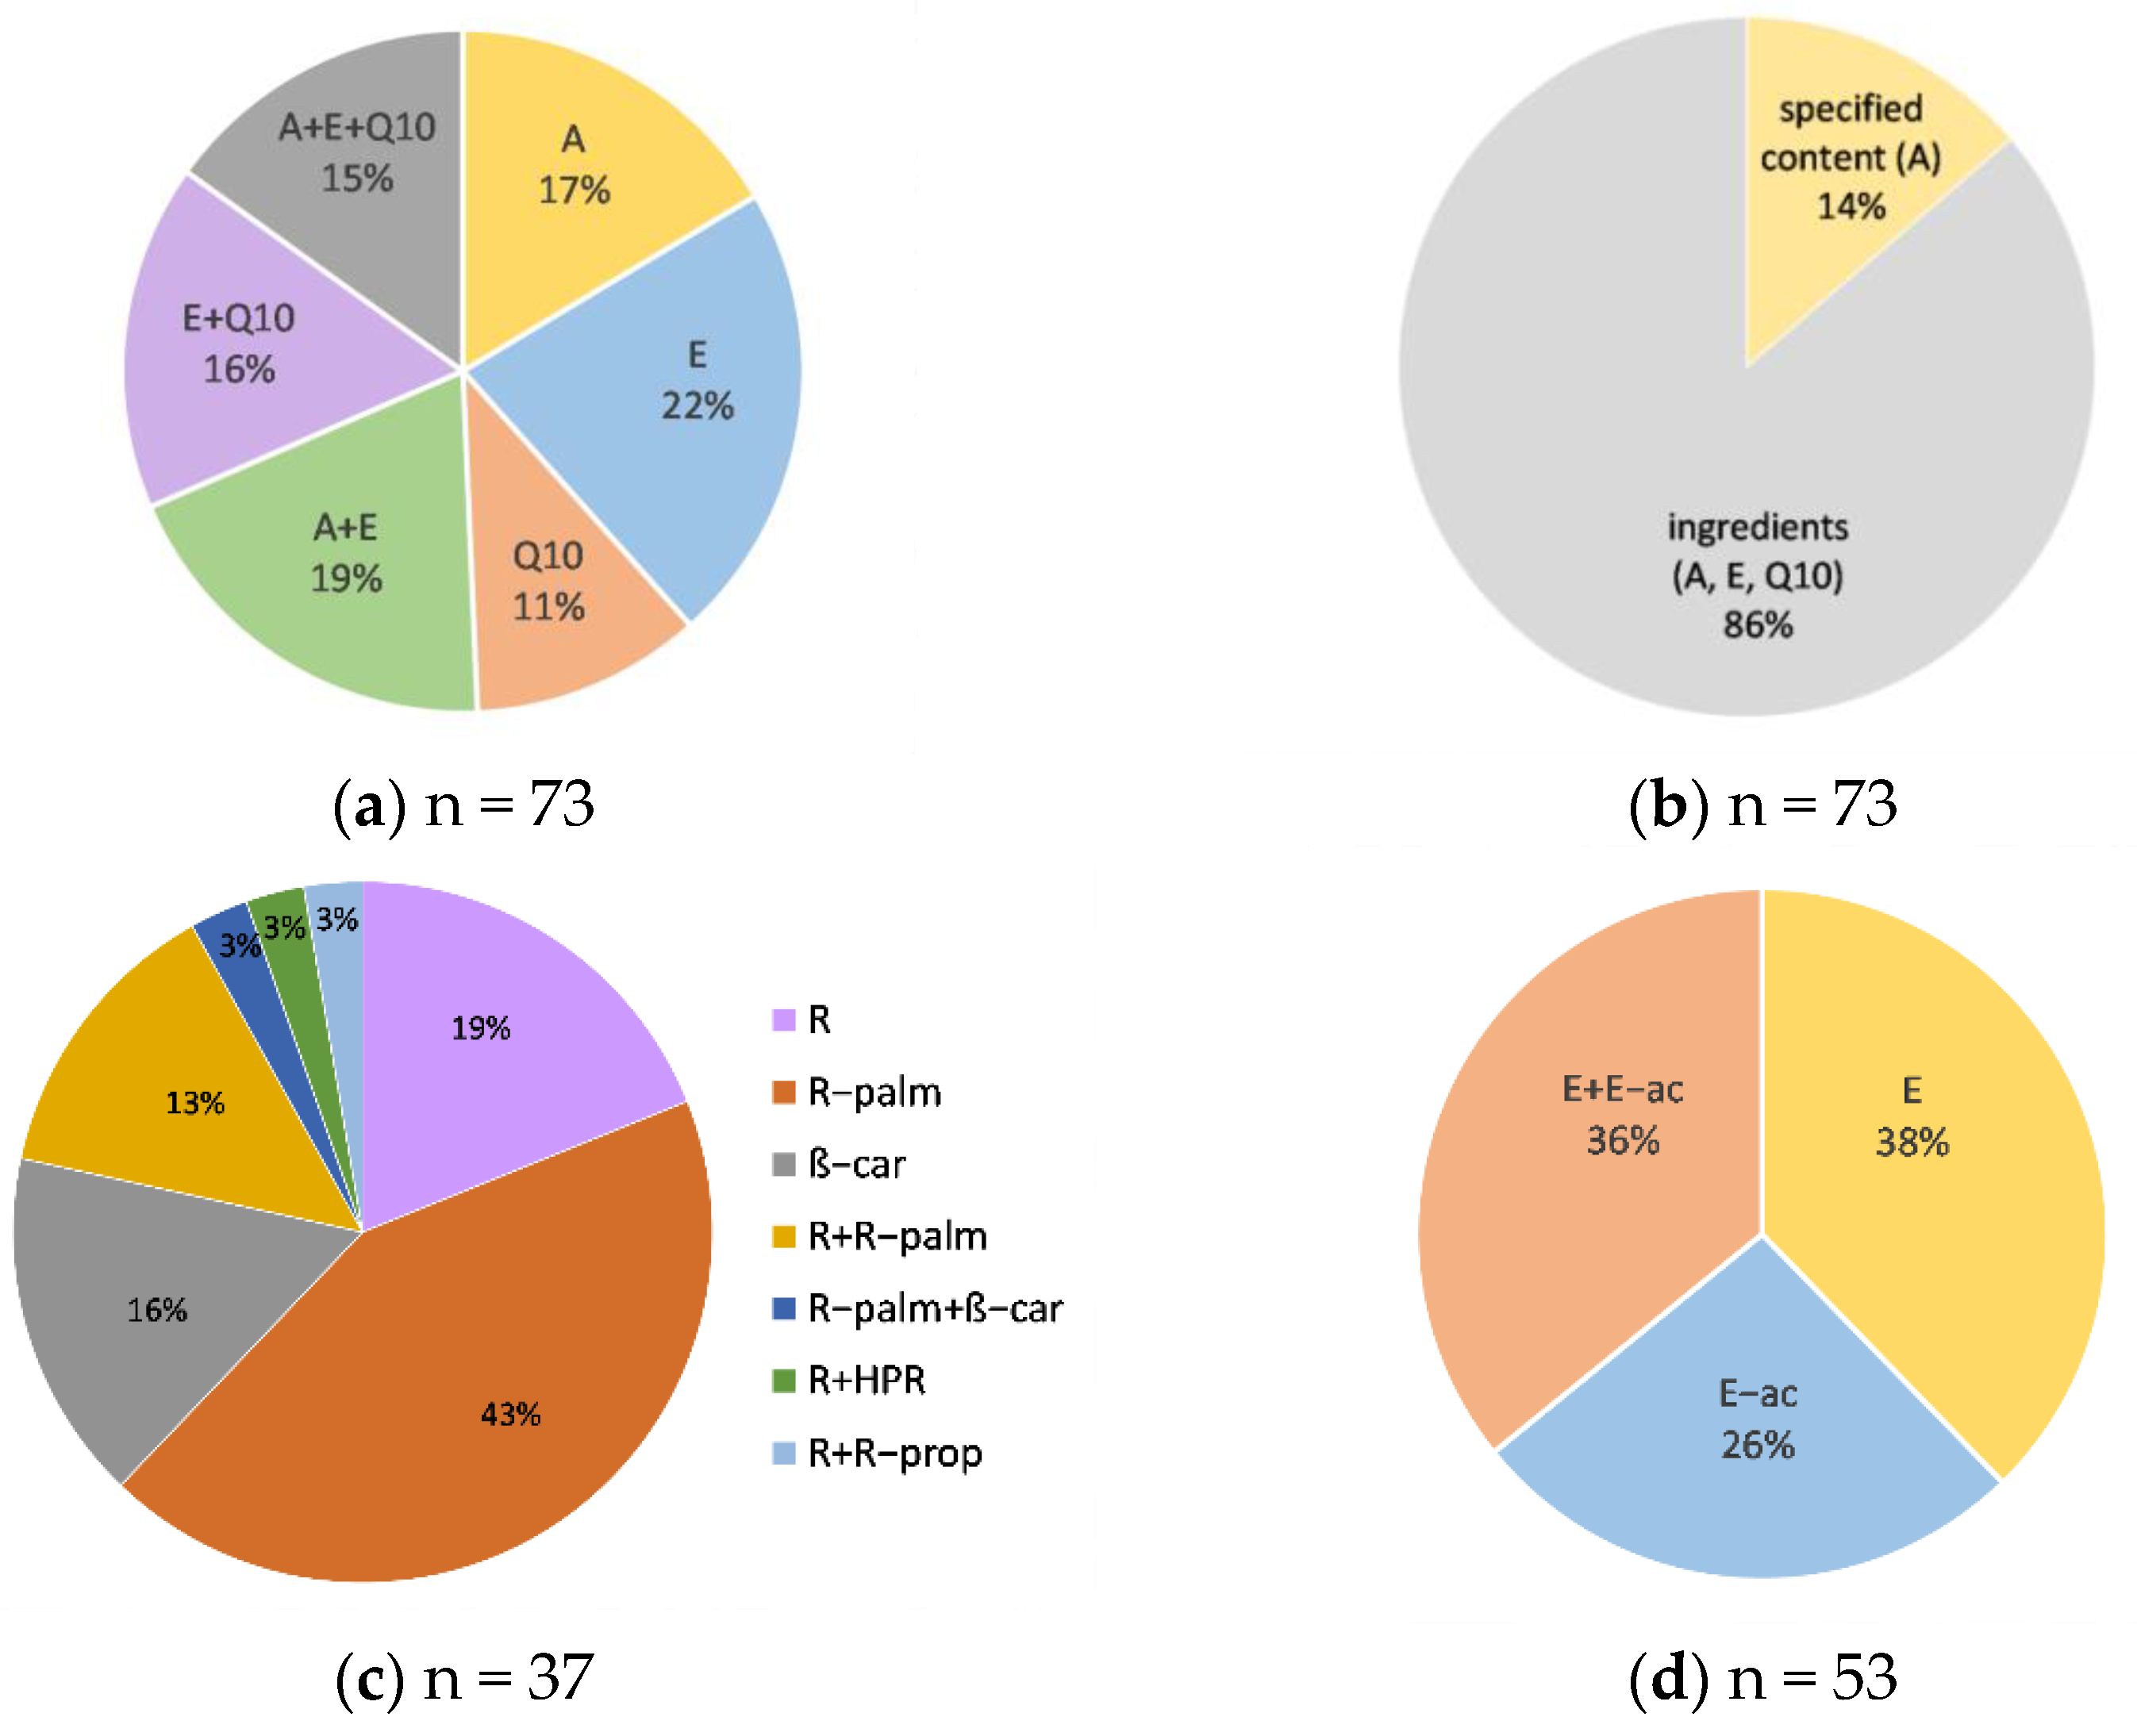
Within this study, we evaluated a total of 73 anti-ageing facial cosmetic products, with vitamin A, E, and/or coenzyme Q10. Cosmetics in various formulations (day and night creams, serums, eye creams, anti-ageing concentrates, and a face tonic) and price ranges (Table 2) were included in this study. Among the three evaluated active compounds, vitamin E was the most common ingredient, labelled in ≈73% of the tested products, followed by vitamin A (≈51%) and coenzyme Q10 (≈42%). Approximately half of the tested products included only one of the tested active compounds in the ingredients list, ≈35% included two (vitamin A and E or vitamin E and coenzyme Q10), and ≈15% included all three evaluated active compounds (Figure 1). In total, 10 cosmetic products with quantitatively declared content (vitamin A in all cases) were included in the study (Figure 1). Cosmetic products with quantitatively declared vitamin E and coenzyme Q10 contents were not found on the Slovenian market. The analyzed cosmetic products labelled the presence of different vitamin A forms (retinol, retinyl palmitate, β carotene, hydroxypinacolone retinoate, retinyl propionate) and vitamin E forms (tocopherol or tocopheryl acetate) (Figure 1). Coenzyme Q10 was labelled in its oxidized form, ubiquinone, in all tested cosmetics. Different forms of the same active compound were also labelled in some tested cosmetic products. Both vitamin E forms were labelled in 19 cosmetic products, and two vitamin A forms (mostly retinol and retinyl palmitate) in 7 products.
3.3. Accuracy of the Labeling of Vitamins A and E and Coenzyme Q10
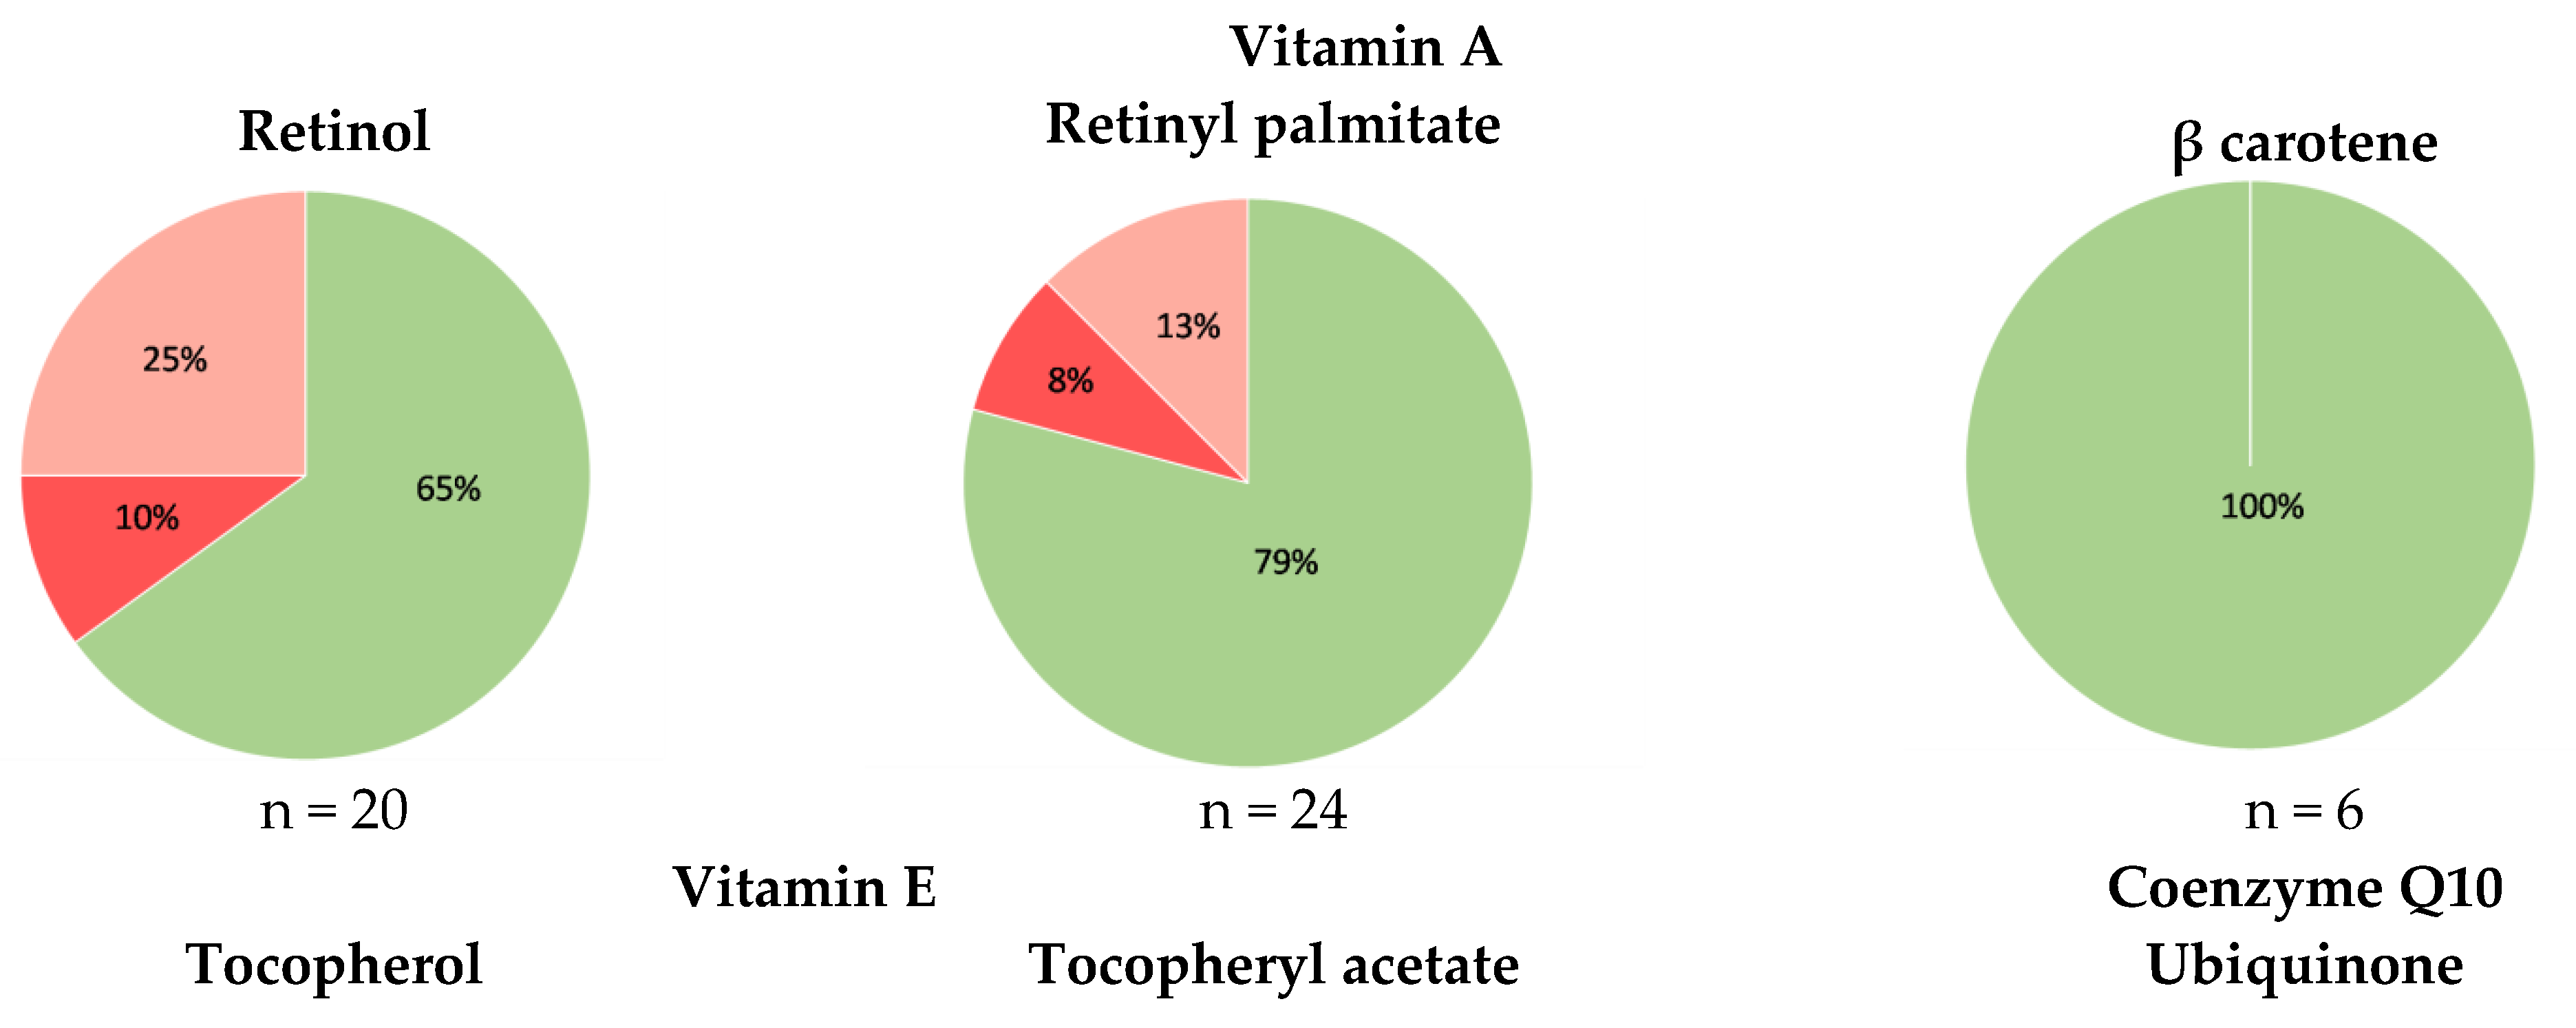
Within quality control of the tested cosmetics, we evaluated the accuracy of the labelling of vitamins A and E and coenzyme Q10. More specifically, we evaluated whether the labelled coenzyme Q10 and specific vitamin A and/or E forms are present in the cosmetics and whether the detected vitamin A and E forms are properly labelled. The results for all evaluated active compounds are summarized in Figure 2. Hydroxypinacolone retinoate was labelled and detected in one cosmetic product, as well as retinyl propionate. The accuracy of the labelling was also evaluated more comprehensively, considering the detected labelling errors in each of the tested cosmetic products. In total, at least one labelling error was observed in 31 cosmetic products (Figure 2). The observed labelling errors were uniformly distributed in cosmetic products purchased in different repositories and were observed in ≈40% of the cosmetics from pharmacies; ≈43% of the cosmetics from grocery stores and the Internet; and ≈44% of the cosmetics from drug stores.
3.4. Quantitative Evaluation of Vitamins A and E and Coenzyme Q10 in the Tested Cosmetics
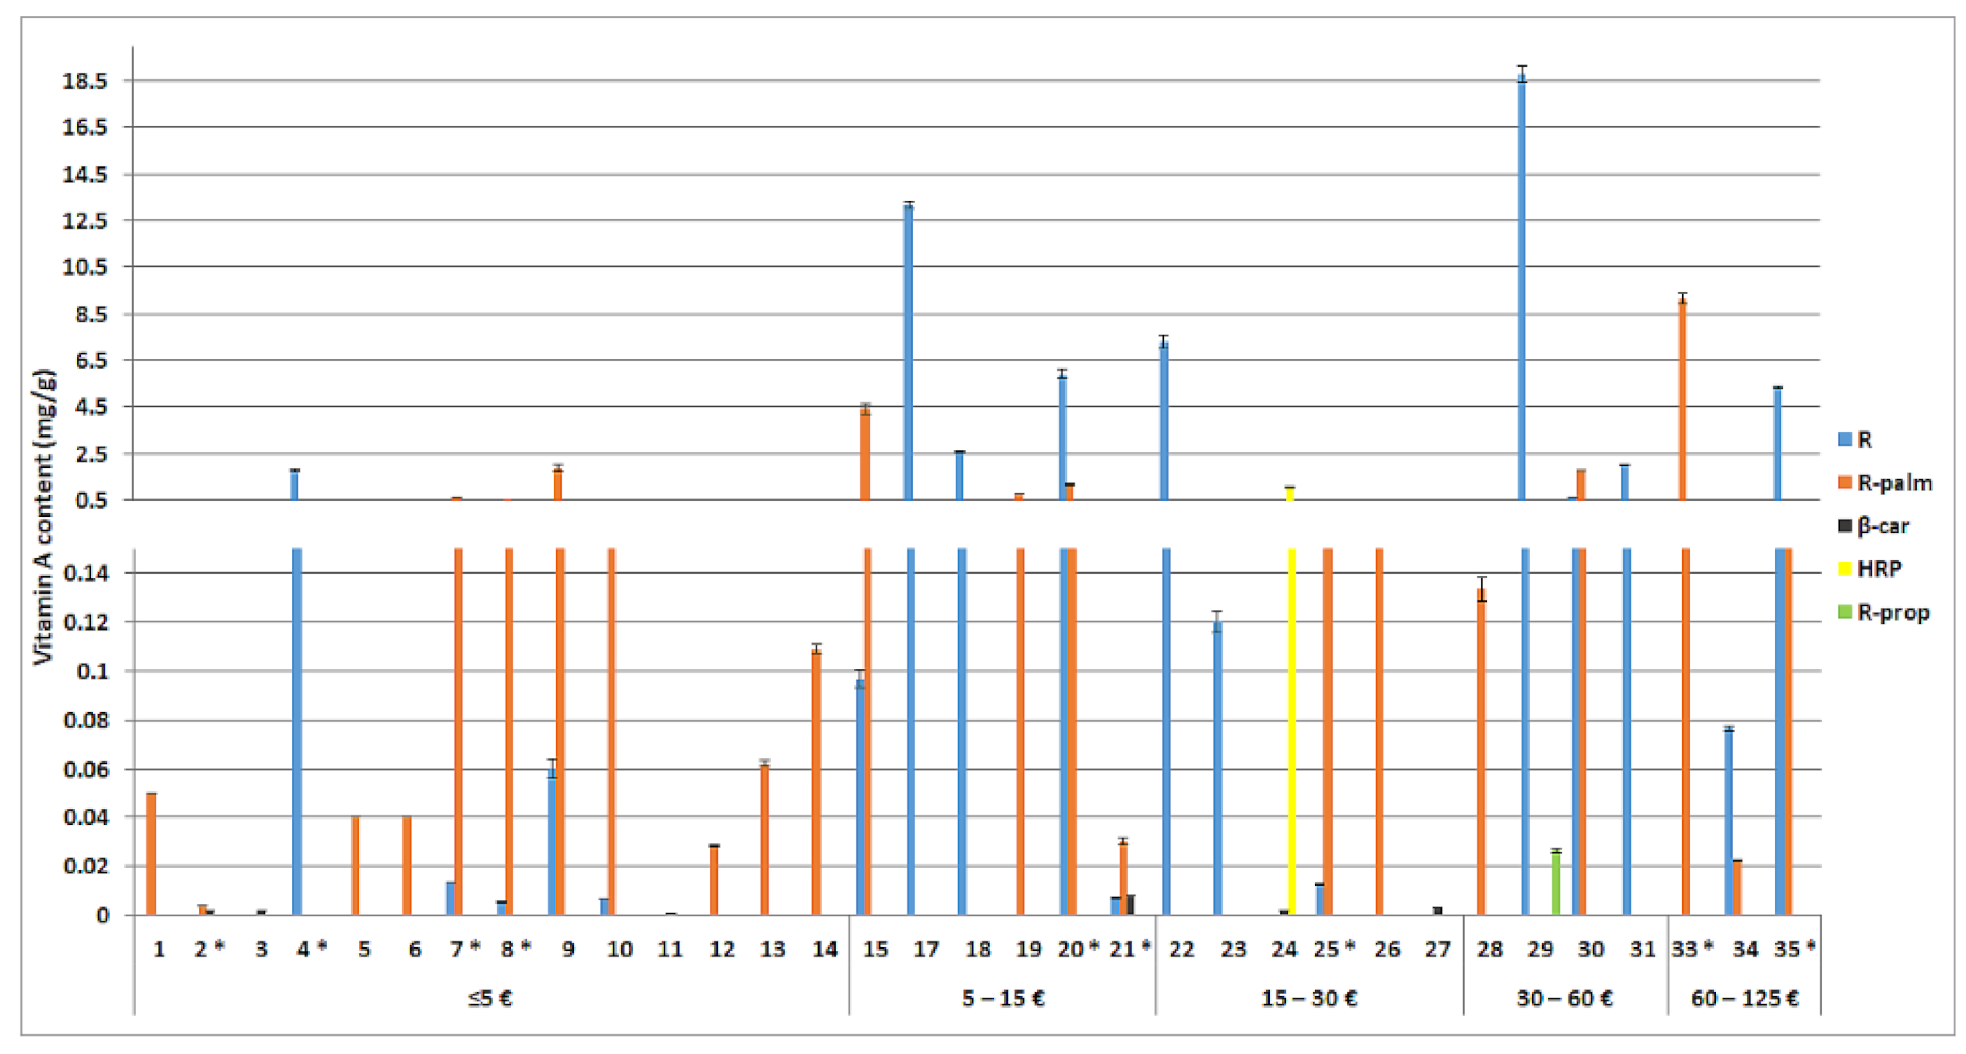
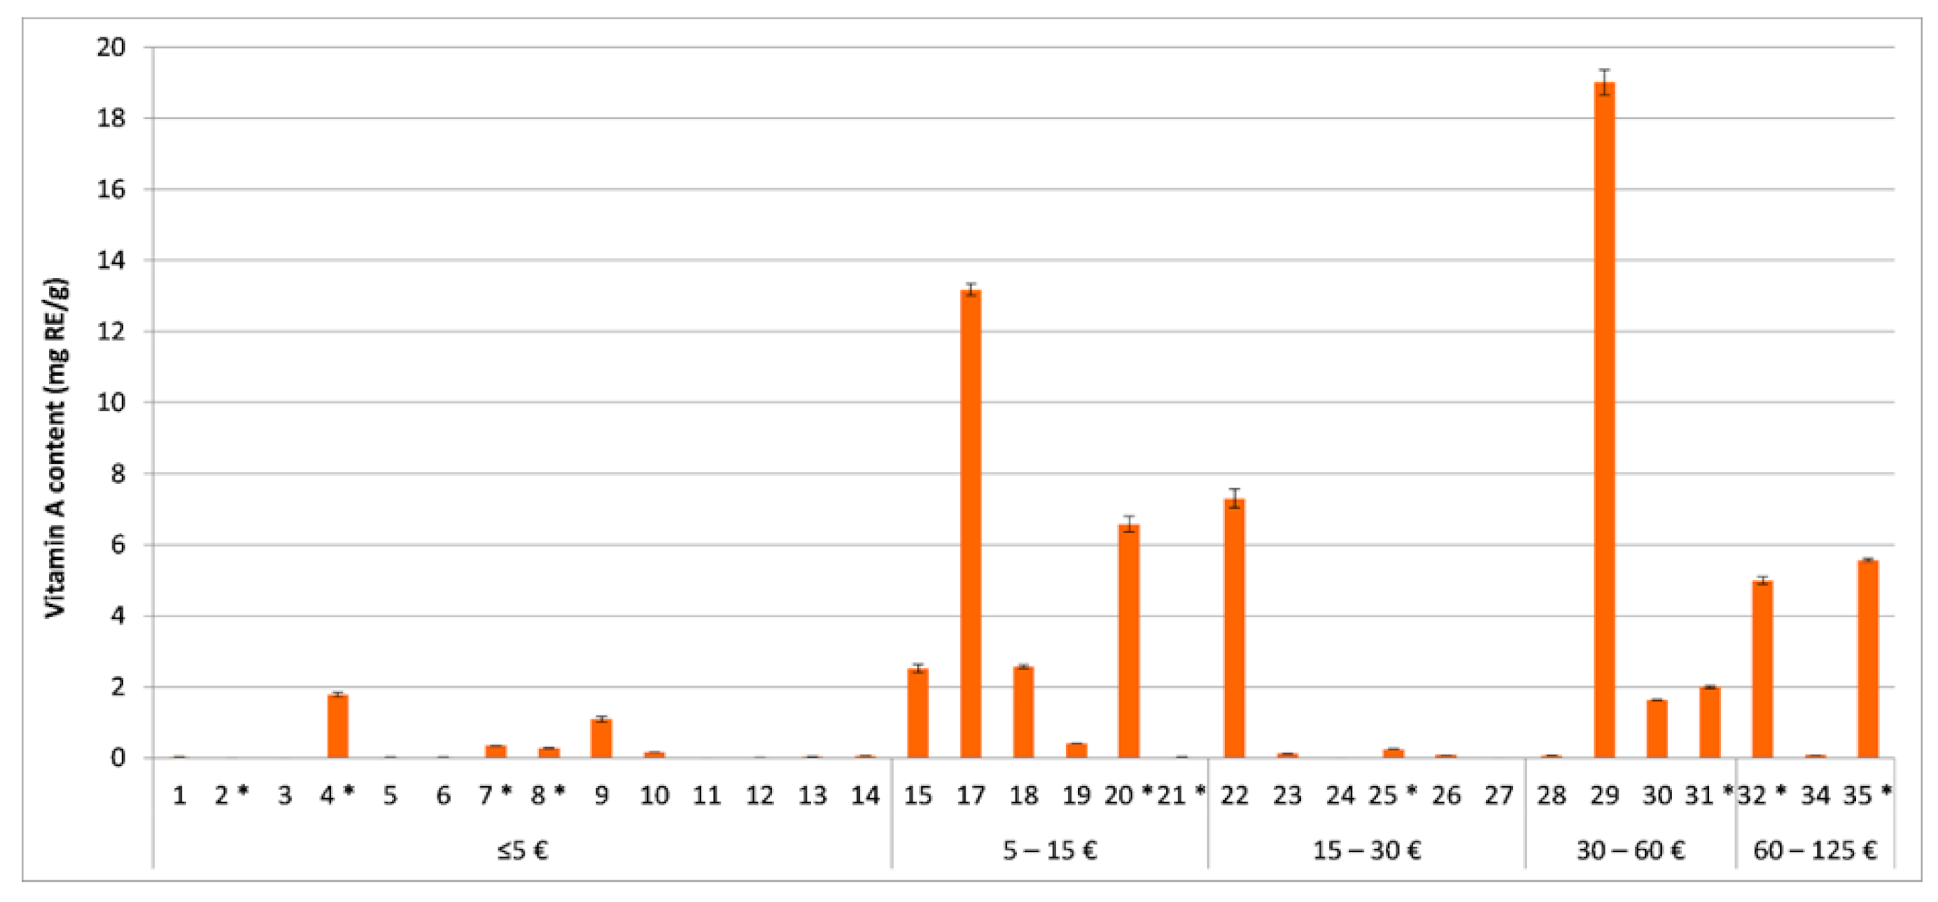
The quality control of the tested cosmetic products also included quantification of the active compounds. The individual vitamin A forms (retinol, retinyl palmitate, β carotene, hydroxypinacolone retinoate, and retinyl propionate) were quantitatively determined in 35 different cosmetics which claimed their presence (Figure 3). The determined retinol concentrations ranged between 5.5 µg/g and 19 mg/g, with an average of 3.2 mg/g and a median of 390 µg/g. Retinyl palmitate was determined in concentrations between 4.0 µg/g and 9.2 mg/g, with an average of 1.0 mg/g and a median of 230 µg/g. The determined contents of β carotene ranged from 950 ng/g to 8.0 µg/g, with an average of 3.1 µg/g and a median of 2.1 µg/g. Hydroxypinacolone retinoate and retinyl propionate were each detected only once, both in cosmetic products which declared their presence. In cosmetics containing vitamin A not (only) in its retinol form, total vitamin A content, expressed with retinol equivalents (RE), was also determined (Figure 4).
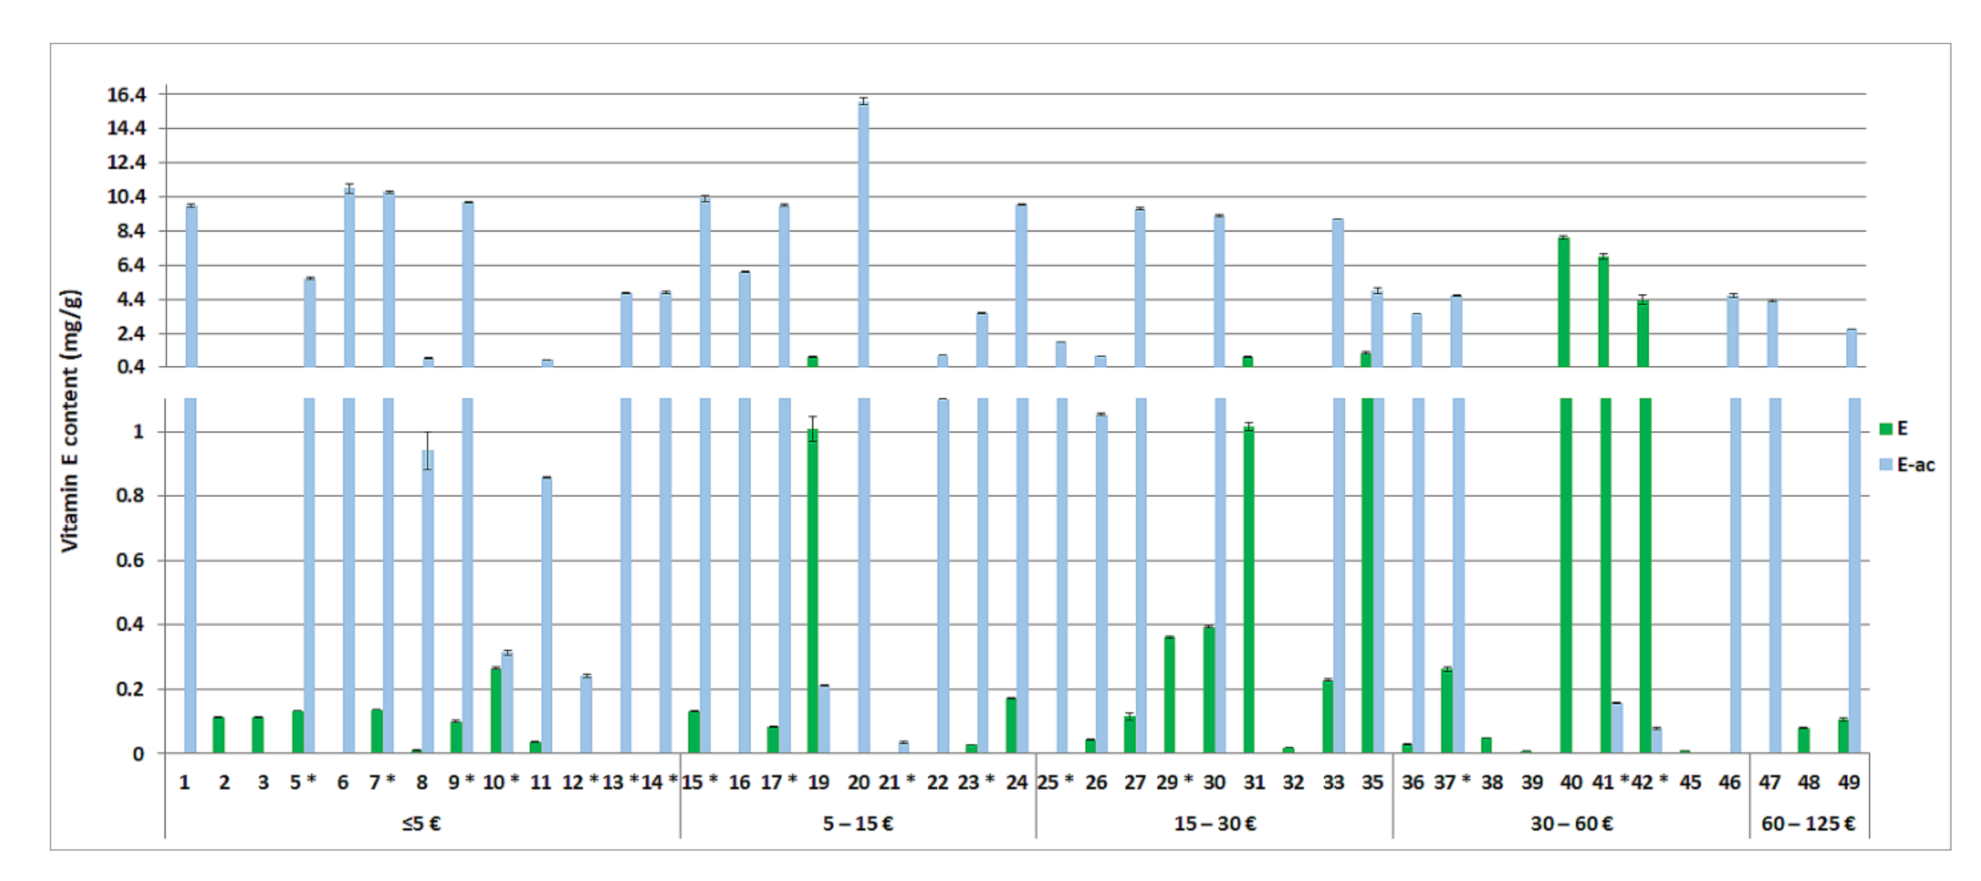
The contents of tocopherol and tocopheryl acetate were determined in 49 cosmetics (Figure 5). Vitamin E as tocopherol or tocopheryl acetate was labelled as an ingredient in 48 evaluated cosmetics. One additional cosmetic product contained vitamin E which was not labelled. None of the tested cosmetics quantitatively declared the concentration of vitamin E. The determined tocopheryl acetate concentrations ranged between 35 µg/g and 16 mg/g, with an average of 5.5 mg/g and a median of 4.8 mg/g. Significantly lower tocopherol concentrations were generally determined in the tested cosmetics, ranging from 8.5 µg/g to 8.0 mg/g, with an average of 810 µg/g and a median of 120 µg/g.
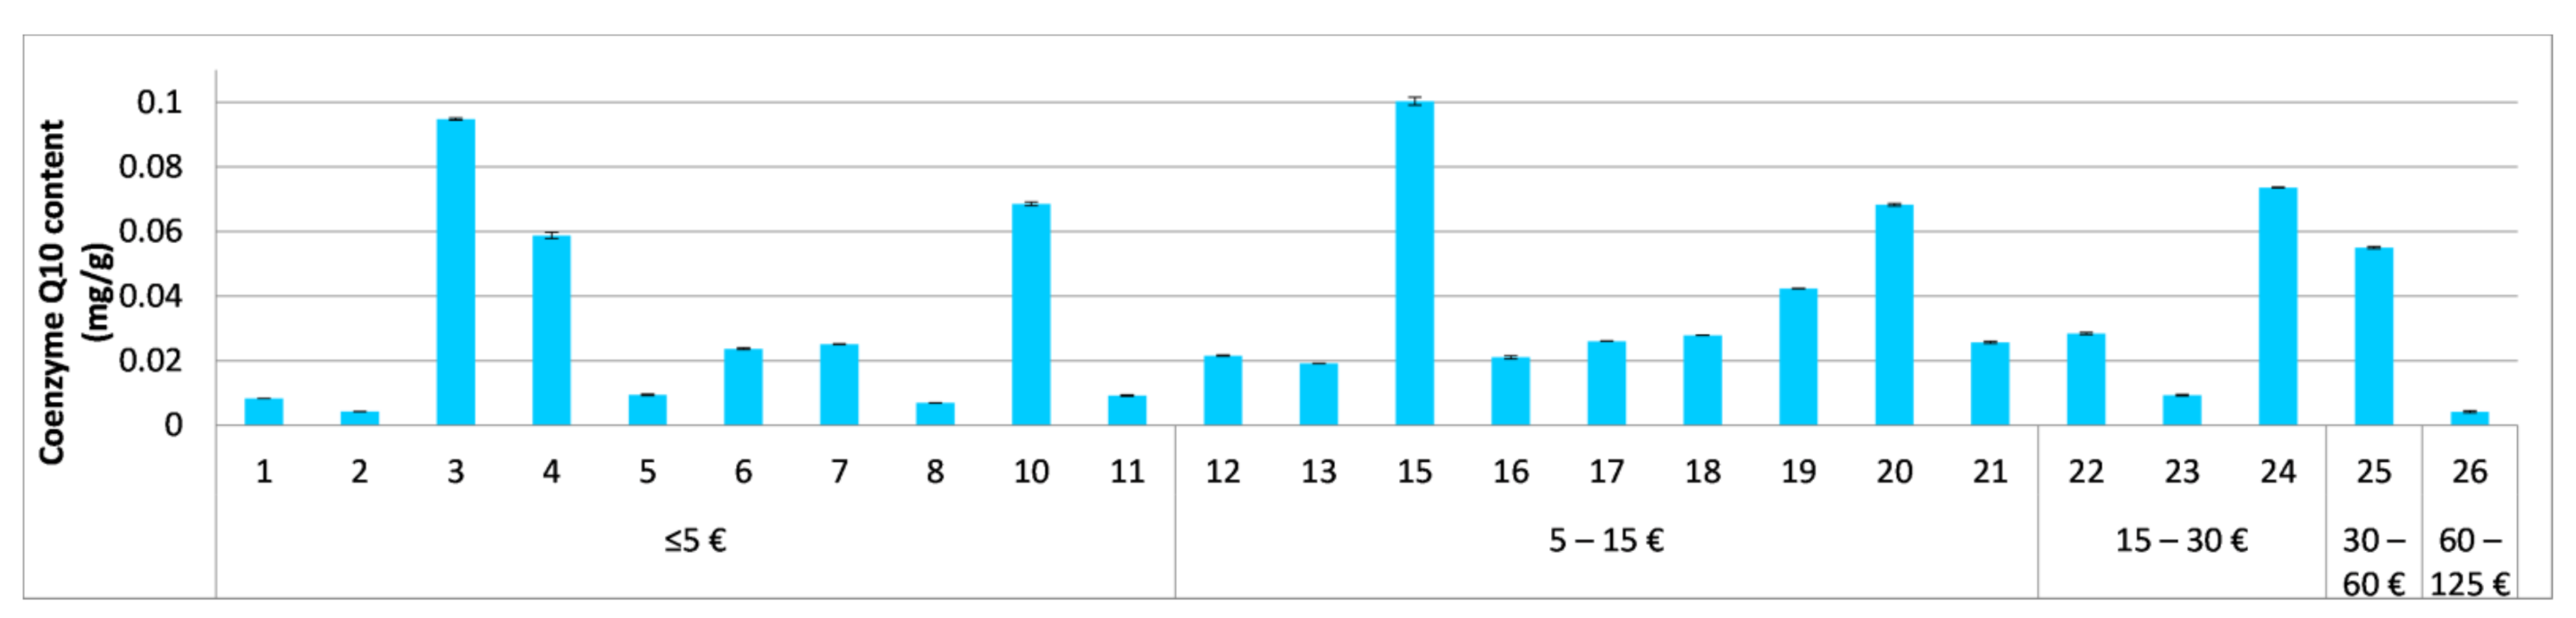
Coenzyme Q10, in its oxidized form, ubiquinone, was evaluated in 27 cosmetics which included it in the ingredients list. The content of ubiquinone was not stated in any of the tested cosmetics. The labelled ubiquinone was not detected in three cosmetics. The determined ubiquinone concentrations in the remaining 24 products ranged between 4.2 µg/g and 100 µg/g (Figure 6), with an average of 35 µg/g and a median of 25 µg/g.
3.5. Content-Related Quality Control of Vitamin A in the Tested Cosmetics
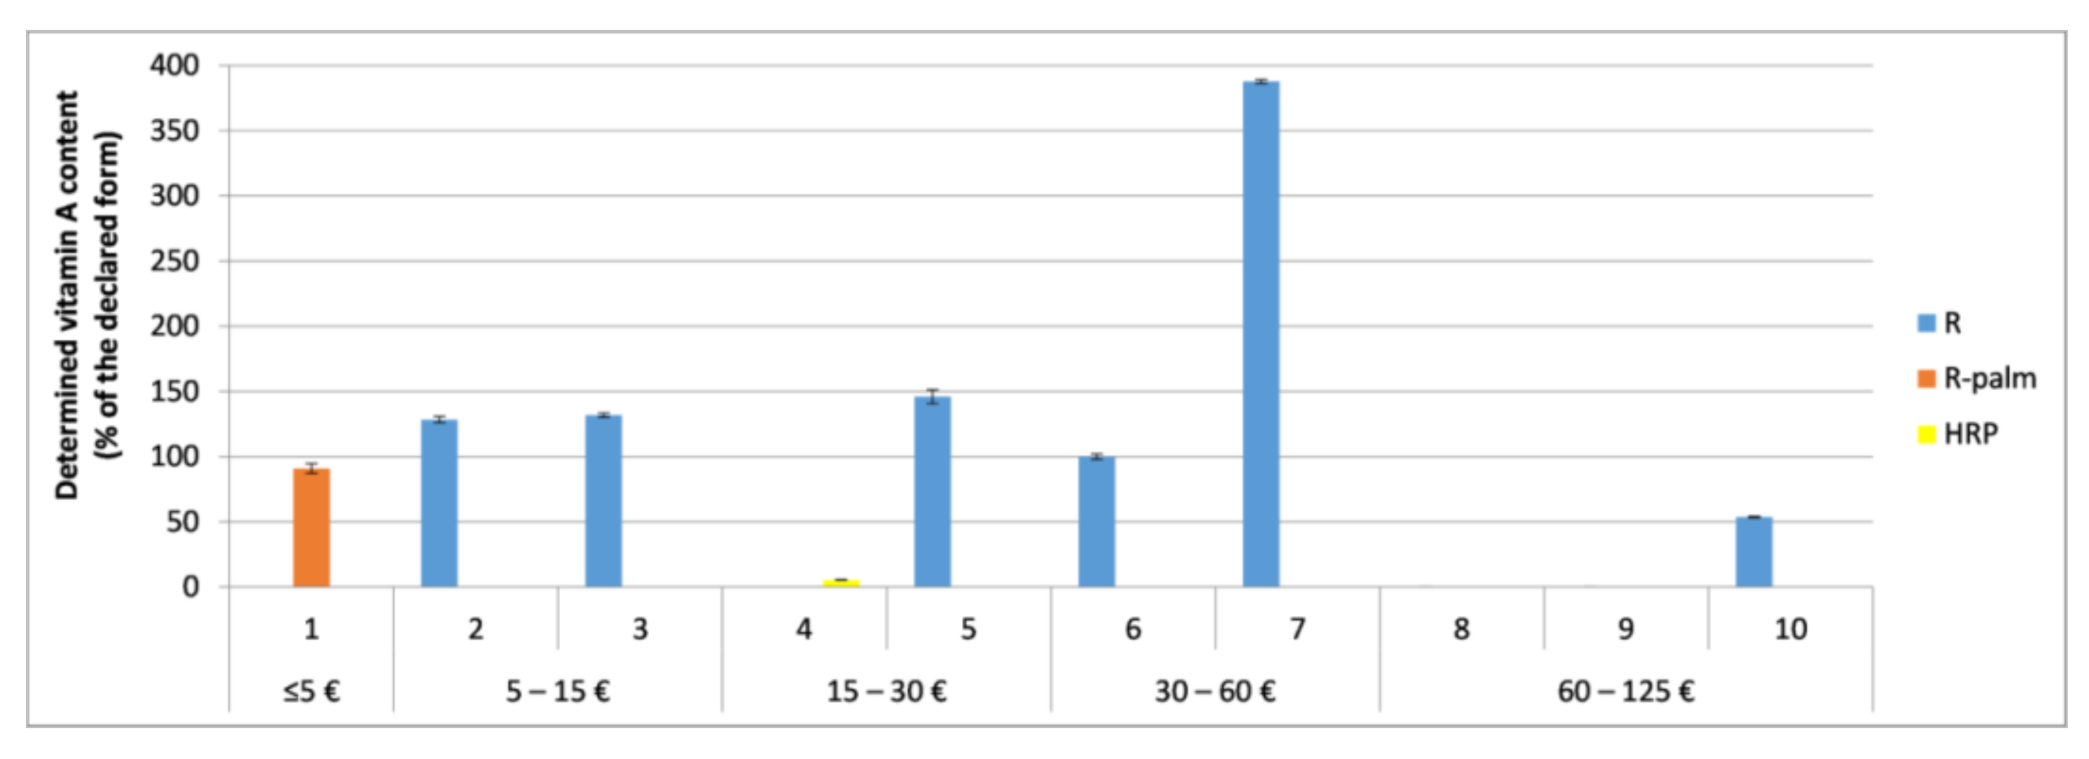
Ten of the tested cosmetic products quantitatively specified the content of a particular vitamin A form, which was most commonly retinol (eight products), as well as retinyl palmitate and hydroxypinacolone retinoate, each in one product. The obtained results on retinoid contents were compared to the label claims (Figure 7). Retinoid contents deviated significantly (by >20%) from the label claims in eight of the ten tested cosmetics. Retinoid contents ranged from 0% up to almost 400% of the label claims, with an average of 104% and a median of 95%.
4. Discussion
Within this study, we evaluated the quality of 73 cosmetic products with vitamin A, E, and/or coenzyme Q10. Considering their beneficial effects against signs of photo ageing and intrinsic skin ageing [2,7], we focused on anti-ageing leave-on cosmetic products designed for facial use. Cosmetics in various formulations and with different labelled vitamin A and E forms (Table 2) were tested to provide representative samples for each of the three groups of active compounds and to obtain diversity in the prices, marketing, and accessibility of the products. The market survey confirmed that vitamin A, E, and coenzyme Q10 are widespread in cosmetic products. Among them, vitamin E was most commonly labelled in a variety of cosmetics products. Combinations of vitamin E and vitamin A and/or coenzyme Q10 were also commonly found on the market, while the combination of vitamin A and coenzyme Q10 without vitamin E was not found. This is also evident from the range of tested cosmetic products (Table 2 and Figure 1). The evaluated commercial cosmetics labelled the presence of different forms of vitamin A (mostly retinyl palmitate, retinol, and β carotene) and vitamin E (tocopherol and tocopheryl acetate), while coenzyme Q10 was only labelled in its oxidized form (ubiquinone) (Figure 1). Despite the lower activity than retinol [14,16], the more stable vitamin A form, retinyl palmitate [24], was the most frequently labelled vitamin A form. Newer vitamin A forms with higher activity and reduced incidence and intensity of irritation side effects are emerging on the market. Such examples are hydroxypinacolone retinoate [38] and retinyl propionate [39], each labelled in one cosmetic product. Vitamin E was more frequently labelled in the active form tocopherol, despite its lower stability [4]. However, tocopheryl acetate, individually or in combination with tocopherol, was also commonly found (Figure 1). An important selection criterion was also the specification of the active compounds’ contents, which is less common in the cosmetic industry and was only found for vitamin A in 14% of the tested products (Table 2 and Figure 1). The quantitative specification of the active compounds’ contents is a developing practice in recent years, especially in functional cosmetics, which promote different effects on the skin.
An appropriate, selective, and accurate methodology is a prerequisite for the quality control of cosmetics. The analysis of different vitamin A forms within this study was performed by a previously published HPLC–UV method for their quality control [34], which was selected for the comprehensive analysis of more retinoids. The simultaneous analysis of coenzyme Q10 and vitamin E, as tocopherol or tocopheryl acetate, was performed by a novel method for their quality control, comprising a simple sample preparation procedure and an HPLC–UV method for their quantification. Both methods utilized within this study were properly validated following the ICH guidelines [37] and proven suitable for the quality control of vitamins A and E and coenzyme Q10 in cosmetic products.
The quality control of the selected cosmetic products initially comprised the accuracy of the labelling of the evaluated active compound groups (different forms of vitamin A and E as well as coenzyme Q10). In general, the majority of the 35 evaluated vitamin A cosmetics contained some vitamin A form, except for two products. More inconsistencies were detected regarding the labelling of individual vitamin A forms. Retinol was not properly labelled in 35% and retinyl palmitate in 21% of the tested products (Figure 2). The labelling inconsistencies were mostly on account of their presence, which was not stated on the packaging, although their absence and replacement of the labelled retinyl palmitate with retinol were also noticed. No labelling inconsistencies were observed in the case of the less frequently found forms—β carotene, hydroxypinacolone retinoate, and retinyl propionate. These results are supported by our previous preliminary study on a smaller sample of retinoid cosmetics [34]. More labelling inconsistencies were observed in the case of vitamin E, which was not detected in ≈12% of the evaluated vitamin E cosmetics, and was present in one additional cosmetic product, which did not state it. Incorrect labelling of tocopheryl acetate was observed in 17% of the tested cosmetics, mostly due to its unlabeled presence (Figure 2). Contrary findings were obtained in the case of tocopherol, for which labelling inconsistencies were more frequently determined—in 42% of the tested cosmetics (Figure 2). The observed coenzyme Q10 labelling inconsistencies in 11% of the tested cosmetics were a consequence of its absence. Although proper labelling of the ingredients is essential for quality assurance, there is a lack of studies researching the labelling accuracy of commercial cosmetics, including cosmetics with vitamin E and coenzyme Q10.
Further on, we evaluated the contents of different vitamin A and E forms, as well as coenzyme Q10 in the examined cosmetics. The determined vitamin A contents in the 35 tested cosmetic products varied greatly by a >4300-fold difference between the lowest and highest determined content for retinol, >2300-fold for retinyl palmitate, and >840-fold for β carotene (Figure 3). According to the literature, a significant facial anti-ageing effect may be achieved with topical formulations containing 0.075% [40] retinol or more (0.1% [41], 0.15% [42], 0.4% [43], 0.5% [44], and 1% [43]), whereas lower retinol concentration (0.04%) showed less prominent improvements of fine wrinkles, and no improvements of deep wrinkles [40]. Retinol contents near or above 0.075% were determined in half of the tested retinol cosmetics.
A more feasible approximation and prediction of the retinoid effects may be achieved by the determination of total vitamin A content expressed with retinol equivalents (Figure 4). Twelve (34%) of the tested cosmetics contained vitamin A in concentrations which are likely to achieve a significant anti-ageing effect (>0.075% RE). The efficacy of the tested cosmetics with >10-fold lower vitamin A contents (23% of the cosmetics) and >100-fold lower contents (23% of the cosmetics) is questionable. The remaining 20% of the tested vitamin A cosmetics contained >1000-fold less vitamin A than what is considered effective and are unlikely to achieve the desired anti-ageing effect. Most of these products belong to the lower price range (≤ EUR 5/50 mL). However, considering their occurrence in each price range, except between EUR 30 and 60/50 mL, and the absence of a correlation between vitamin A content and the cosmetic products’ price (Figure 4), we conclude that the price is not a determining factor for higher vitamin A content nor efficacy of the cosmetics. Another important aspect of vitamin A cosmetics is their safety, associated with their local adverse effects (potential retinoid-associated irritation and photo toxicity [14,45]) and systemic adverse effects (potential headaches, abdominal pain, nausea, liver or kidney damage, hypercalcemia, bone abnormalities, and teratogenicity [14,46]). Therefore, the Scientific Committee on Consumer Safety (SCCS), at the European Commission, recommends the use of vitamin A at maximum use concentrations of 0.3% RE in hand and face creams and other leave-on products [14]. The significantly higher total vitamin A content than the maximum recommended concentration by the SCCS in six of the 35 tested cosmetic products (Figure 4) is a cause of concern and reveals the need for (stricter) content-related quality control.
The determined vitamin E (tocopherol and tocopheryl acetate) contents showed lower variability than vitamin A contents by up to 500-fold for tocopheryl acetate and up to 1000-fold for tocopherol. The determined contents of tocopheryl acetate mostly gravitated towards 1% and were generally higher than the determined tocopherol contents, which were <0.1% in 90% of the tested products (Figure 5). The determined tocopherol and tocopheryl acetate contents were mostly within the expected range for facial leave-on cosmetics (0.03–2% for tocopherol and 0.003–6% for tocopheryl acetate), based on industry data on cosmetic products formulations [13] and research data (0.107–0.670% tocopheryl acetate in four commercial cosmetics on the Kuwait market [47]). Despite the differing information on tocopheryl acetate conversion to tocopherol (from 0% to 50%) found in the literature [10,48,49], the determined tocopherol and tocopheryl acetate contents were generally lower than the minimal effective tocopherol concentration of 1.0%, as recommended by Nada et al. [48]. A trend of increasing vitamin E content among the higher-priced products was not observed (Figure 5). Instead, vitamin E contents were more uniformly distributed between the different price ranges.
The tested commercial cosmetics showed the lowest variability, with only a 23-fold difference between the lowest and highest determined coenzyme Q10 content (Figure 6). The determined coenzyme Q10 contents are consistent with the survey data from the Voluntary Cosmetic Registration Program (VCRP) for 2020 on a greater range of coenzyme Q10 leave-on cosmetics (387 products), with concentrations ranging between 0.00075% and 0.05% [22]. Coenzyme Q10 in concentrations ≥0.01% has shown beneficial anti-ageing effects on the skin [50], and were determined in <20% of the tested cosmetics. Additional research on the lowest effective coenzyme Q10 concentration in leave-on cosmetics is required to evaluate the efficacy of the remaining 80% of the tested coenzyme Q10 cosmetics. In three examined products, the labelled coenzyme Q10 was not detected. As previously observed for vitamins A and E, the expected correlation between the product prices and coenzyme Q10 content was not observed (Figure 6).
An important aspect within quality control is content-related quality control in relation to label claims, which is a generally accepted principle in the pharmaceutical industry, but has not yet been adopted in the cosmetics industry. One of the reasons, besides the looser regulation, is the fact that the active ingredients’ contents in cosmetic products are rarely specified. This is also evident from Figure 1 as, despite being among the selection criteria, only 10 of the 73 tested cosmetics specified the content. The obtained results on the content in relation to the label claims (Figure 7) revealed significant deviations in both directions—from an absence or significantly lower content than declared up to 4-fold higher contents. Possible explanations for such deviations of the labelled vitamin A contents and the commonly determined active compounds contents below 0.01% include inappropriate formulation or their inappropriate stabilization and degradation during the manufacturing or storage [24]. Regardless, such results are concerning and support our recommendation for their stricter control and regulation, especially as the most significant deviations were observed in the higher-priced cosmetics (Figure 7).
5. Conclusions
Our work focused on the quality control of a significant number of cosmetic products with vitamins A and E and coenzyme Q10, which are common ingredients in anti-ageing cosmetics. On the example of these three groups of active compounds, we demonstrated an approach for the quality control of cosmetics, including evaluation of the labelling accuracy of different forms of active compounds, their content determination, and the content-related quality control in relation to the label claims. Based on the revealed labelling inconsistencies for all three groups of active compounds in 42% of the tested cosmetics, vitamin A contents above the maximum recommended concentration by the SCCS, and significant deviations in the contained and labelled vitamin A amounts, we recommend their stricter regulation and quality control. The development of suitable assay methods and progress in the field of functional cosmetics, which specify the content of active compounds, are essential steps towards their proper quality control following the principles of the pharmaceutic industry and the provision of quality, safe, and efficient cosmetics.
Supplementary Materials
The following are available online at https://0-www-mdpi-com.brum.beds.ac.uk/article/10.3390/cosmetics8030061/s1, Figure S1: Representative chromatogram of a standard mixture of retinol (retention time 2.5 min), retinyl acetate (retention time 2.9 min), and retinyl palmitate (retention time 6.9 min) at detection wavelength 325 nm, Figure S2: Representative chromatogram of β carotene standard solution (retention time 6.8 min) at detection wavelength 450 nm, Figure S3: Representative chromatograms of a standard mixture of tocopherol (retention time 6.0 min), tocopheryl acetate (retention time 6.4) and coenzyme Q10 (ubiquinone) (retention time 10.8) at detection wavelength 280 nm, Figure S4. Representative chromatograms of a cosmetic product with retinol (retention time 2.4) at detection wavelength 325 nm, Figure S5. Representative chromatograms of a cosmetic product with retinyl palmitate (retention time 6.9) at detection wavelength 325 nm, Figure S6. Representative chromatograms of a cosmetic product with β carotene (retention time 6.8) at detection wavelength 450 nm, Figure S7. Representative chromatograms of a cosmetic product with tocopherol (retention time 6.0 min), tocopheryl acetate (retention time 6.3) and coenzyme Q10 (ubiquinone) (retention time 10.7) at detection wavelength 280 nm.
Author Contributions
Conceptualization, R.R.; methodology, R.R.; validation, R.R. and Ž.T.R.; formal analysis, Ž.T.R.; resources, R.R.; data curation, Ž.T.R.; writing—original draft preparation, Ž.T.R.; writing—review and editing, Ž.T.R. and R.R.; visualization, Ž.T.R.; supervision, R.R.; project administration, R.R.; funding acquisition, R.R. All authors have read and agreed to the published version of the manuscript.
Funding
This research was funded by Slovenian Research Agency (ARRS), grant number P1-0189.
Institutional Review Board Statement
Not applicable.
Informed Consent Statement
Not applicable.
Data Availability Statement
Data is contained within the article or supplementary material.
Conflicts of Interest
The authors declare no conflict of interest.
References
- Lupo, M.P. Antioxidants and Vitamins in Cosmetics. Clin. Dermatol. 2001, 19, 467–473. [Google Scholar] [CrossRef]
- Bissett, D.L. Common Cosmeceuticals. Clin. Dermatol. 2009, 27, 435–445. [Google Scholar] [CrossRef] [PubMed]
- Thiele, J.J.; Hsieh, S.N.; Ekanayake-Mudiyanselage, S. Vitamin E: Critical Review of Its Current Use in Cosmetic and Clinical Dermatology. Dermatol. Surg. 2005, 31, 805–813. [Google Scholar] [CrossRef] [PubMed]
- Thiele, J.J.; Ekanayake-Mudiyanselage, S. Vitamin E in Human Skin: Organ-Specific Physiology and Considerations for Its Use in Dermatology. Mol. Asp. Med. 2007, 28, 646–667. [Google Scholar] [CrossRef]
- Afonso, S.; Horita, K.; Sousa e Silva, J.P.; Almeida, I.F.; Amaral, M.H.; Lobão, P.A.; Costa, P.C.; Miranda, M.S.; Esteves da Silva, J.C.G.; Sousa Lobo, J.M. Photodegradation of Avobenzone: Stabilization Effect of Antioxidants. J. Photochem. Photobiol. B 2014, 140, 36–40. [Google Scholar] [CrossRef]
- Farris, P.; Yatskayer, M.; Chen, N.; Krol, Y.; Oresajo, C. Evaluation of Efficacy and Tolerance of a Nighttime Topical Antioxidant Containing Resveratrol, Baicalin, and Vitamin e for Treatment of Mild to Moderately Photodamaged Skin. J. Drugs Dermatol. 2014, 13, 1467–1472. [Google Scholar]
- Masaki, H. Role of Antioxidants in the Skin: Anti-Aging Effects. J. Dermatol. Sci. 2010, 58, 85–90. [Google Scholar] [CrossRef]
- Burke, K.E. Interaction of Vitamins C and E as Better Cosmeceuticals. Dermatol. Ther. 2007, 20, 314–321. [Google Scholar] [CrossRef]
- Alberts, D.S.; Goldman, R.; Xu, M.J.; Dorr, R.T.; Quinn, J.; Welch, K.; Guillen-Rodriguez, J.; Aickin, M.; Peng, Y.M.; Loescher, L.; et al. Disposition and Metabolism of Topically Administered Alpha-Tocopherol Acetate: A Common Ingredient of Commercially Available Sunscreens and Cosmetics. Nutr. Cancer 1996, 26, 193–201. [Google Scholar] [CrossRef]
- Baschong, W.; Artmann, C.; Hueglin, D.; Roeding, J. Direct Evidence for Bioconversion of Vitamin E Acetate into Vitamin E: An Ex Vivo Study in Viable Human Skin. J. Cosmet. Sci. 2001, 52, 155–161. [Google Scholar]
- Rangarajan, M.; Zatz, J.L. Kinetics of Permeation and Metabolism of Alpha-Tocopherol and Alpha-Tocopheryl Acetate in Micro-Yucatan Pig Sin. J. Cosmet. Sci. 2001, 52, 35–50. [Google Scholar]
- Nabi, Z.; Tavakkol, A.; Dobke, M.; Polefka, T.G. Bioconversion of Vitamin E Acetate in Human Skin. Curr. Probl. Dermatol. 2001, 29, 175–186. [Google Scholar]
- Zondlo Fiume, M. Final Report on the Safety Assessment of Tocopherol, Tocopheryl Acetate, Tocopheryl Linoleate, Tocopheryl Linoleate/Oleate, Tocopheryl Nicotinate, Tocopheryl Succinate, Dioleyl Tocopheryl Methylsilanol, Potassium Ascorbyl Tocopheryl Phosphate, and Tocophersolan. Int. J. Toxicol. 2002, 21, 51–116. [Google Scholar]
- Rousselle, C. Opinion of the Scientific Committee on Consumer Safety (SCCS)—Final Version of the Opinion on Vitamin A (Retinol, Retinyl Acetate and Retinyl Palmitate) in Cosmetic Products. Regul. Toxicol. Pharmacol. 2017, 84, 102–104. [Google Scholar] [CrossRef]
- European Parliament and of the Council. Regulatution (EC) No 1223/2009 of the European Parliament and of the Council of 30 November 2009 on Cosmetic Products. Off. J. Eur. Union 2009, 52, L 342/83–L 342/127. [Google Scholar]
- Zasada, M.; Budzisz, E. Retinoids: Active Molecules Influencing Skin Structure Formation in Cosmetic and Dermatological Treatments. Postepy Dermatol. Alergol. 2019, 36, 392–397. [Google Scholar] [CrossRef] [Green Version]
- Temova Rakuša, Ž.; Srečnik, E.; Roškar, R. Novel HPLC-UV Method for Simultaneous Determination of Fat-Soluble Vitamins and Coenzyme Q10 in Medicines and Supplements. Acta Chim. Slov. 2017, 64, 523–529. [Google Scholar] [CrossRef] [Green Version]
- Vinson, J.; Anamandla, S. Comparative Topical Absorption and Antioxidant Effectiveness of Two Forms of Coenzyme Q10 after a Single Dose and after Long-Term Supplementation in the Skin of Young and Middle-Aged Subjects. Int J. Cosmet. Sci. 2006, 28, 148. [Google Scholar] [CrossRef]
- Knott, A.; Achterberg, V.; Smuda, C.; Mielke, H.; Sperling, G.; Dunckelmann, K.; Vogelsang, A.; Krüger, A.; Schwengler, H.; Behtash, M.; et al. Topical Treatment with Coenzyme Q10-Containing Formulas Improves Skin’s Q10 Level and Provides Antioxidative Effects. Biofactors 2015, 41, 383–390. [Google Scholar] [CrossRef]
- Hoppe, U.; Bergemann, J.; Diembeck, W.; Ennen, J.; Gohla, S.; Harris, I.; Jacob, J.; Kielholz, J.; Mei, W.; Pollet, D.; et al. Coenzyme Q10, a Cutaneous Antioxidant and Energizer. Biofactors 1999, 9, 371–378. [Google Scholar] [CrossRef]
- Kaci, M.; Belhaffef, A.; Meziane, S.; Dostert, G.; Menu, P.; Velot, É.; Desobry, S.; Arab-Tehrany, E. Nanoemulsions and Topical Creams for the Safe and Effective Delivery of Lipophilic Antioxidant Coenzyme Q10. Colloids Surf. B Biointerfaces 2018, 167, 165–175. [Google Scholar] [CrossRef] [PubMed]
- Expert Panel for Cosmetic Ingredient Safety Members. Safety Assessment of Ubiquinone Ingredients as Used in Cosmetics. Cosmetic Ingredient Review. Available online: https://www.cir-safety.org/supplementaldoc/safety-assessment-ubiquinone-ingredients-used-cosmetics (accessed on 10 April 2021).
- Temova Rakuša, Ž.; Kristl, A.; Roškar, R. Stability of Reduced and Oxidized Coenzyme Q10 in Finished Products. Antioxidants 2021, 10, 360. [Google Scholar] [CrossRef] [PubMed]
- Rakuša, Ž.T.; Škufca, P.; Kristl, A.; Roškar, R. Retinoid Stability and Degradation Kinetics in Commercial Cosmetic Products. J. Cosmet. Dermatol. 2021, 20, 2350–2358. [Google Scholar] [CrossRef] [PubMed]
- Benevenuto, C.G.; Guerra, L.O.; Gaspar, L.R. Combination of Retinyl Palmitate and UV-Filters: Phototoxic Risk Assessment Based on Photostability and in Vitro and in Vivo Phototoxicity Assays. Eur. J. Pharm. Sci. 2015, 68, 127–136. [Google Scholar] [CrossRef]
- Carlotti, M.E.; Rossatto, V.; Gallarate, M.; Trotta, M.; Debernardi, F. Vitamin A Palmitate Photostability and Stability over Time. J. Cosmet. Sci. 2004, 55, 233–252. [Google Scholar] [CrossRef]
- Guaratini, T.; Gianeti, M.D.; Campos, P.M.B.G.M. Stability of Cosmetic Formulations Containing Esters of Vitamins E and A: Chemical and Physical Aspects. Int. J. Pharm. 2006, 327, 12–16. [Google Scholar] [CrossRef]
- Gianeti, M.D.; Gaspar, L.R.; Bueno de Camargo Júnior, F.; Campos, P.M.B.G.M. Benefits of Combinations of Vitamin A, C and E Derivatives in the Stability of Cosmetic Formulations. Molecules 2012, 17, 2219–2230. [Google Scholar] [CrossRef]
- Moyano, M.A.; Segall, A. Vitamin a Palmitate and α-Lipoic Acid Stability in O/W Emulsions for Cosmetic Application. J. Cosmet. Sci. 2011, 62, 405–415. [Google Scholar]
- Akhavan, A.; Levitt, J. Assessing Retinol Stability in a Hydroquinone 4%/Retinol 0.3% Cream in the Presence of Antioxidants and Sunscreen under Simulated-Use Conditions: A Pilot Study. Clin. Ther. 2008, 30, 543–547. [Google Scholar] [CrossRef]
- Ceugniet, C.; Lepetit, L.; Viguerie, N.L.D.; Jammes, H.; Peyrot, N.; Rivière, M. Single-Run Analysis of Retinal Isomers, Retinol and Photooxidation Products by High-Performance Liquid Chromatography. J. Chromatogr. A 1998, 810, 237–240. [Google Scholar] [CrossRef]
- Wang, L.-H.; Huang, S.-H. Determination of Vitamins A, D, E, and K in Human and Bovine Serum, and B-Carotene and Vitamin A Palmitate in Cosmetic and Pharmaceutical Products, by Isocratic HPLC. Chromatographia 2002, 55, 289–296. [Google Scholar] [CrossRef]
- Gatti, R.; Gioia, M.G.; Cavrini, V. Analysis and Stability Study of Retinoids in Pharmaceuticals by LC with Fluorescence Detection. J. Pharm. Biomed. Anal. 2000, 23, 147–159. [Google Scholar] [CrossRef]
- Temova Rakuša, Ž.; Škufca, P.; Kristl, A.; Roškar, R. Quality Control of Retinoids in Commercial Cosmetic Products. J. Cosmet. Dermatol. 2021, 20, 1166–1175. [Google Scholar] [CrossRef]
- Hubinger, J.C. Determination of Retinol, Retinyl Palmitate, and Retinoic Acid in Consumer Cosmetic Products. J. Cosmet. Sci. 2009, 60, 485–500. [Google Scholar] [CrossRef]
- Grace, A.C.; Prabha, T.; Jagadeeswaran, M.; Srinivasan, K.; Sivakumar, T. Analytical Method Development for Simultaneous Determination of Ubidecarenone and Vitamin E Acetate in Capsule Dosage Form by HPLC. Int. J. Pharm. Pharm. Sci. 2019, 79–84. [Google Scholar] [CrossRef]
- ICH Q2(R1). Validation of Analytical Procedures: Text and Methodology. ICH Harmonised Tripartite Guideline Harmonised Tripartite Guideline. 2005. Available online: http://www.ich.org/products/guidelines/quality/quality-single/article/validation-of-analytical-procedures-text-and-methodology.html (accessed on 11 June 2018).
- Ruth, N.; Mammone, T. Anti-Aging Effects of Retinoid Hydroxypinacolone Retinoate on Skin Models. J. Invest. Dermatol. 2018, 138, S223. [Google Scholar] [CrossRef] [Green Version]
- Bjerke, D.L.; Li, R.; Price, J.M.; Dobson, R.L.M.; Rodrigues, M.; Tey, C.; Vires, L.; Adams, R.L.; Sherrill, J.D.; Styczynski, P.B.; et al. The Vitamin A Ester Retinyl Propionate Has a Unique Metabolic Profile and Higher Retinoid-Related Bioactivity over Retinol and Retinyl Palmitate in Human Skin Models. Exp. Dermatol. 2021, 30, 226–236. [Google Scholar] [CrossRef]
- Kikuchi, K.; Suetake, T.; Kumasaka, N.; Tagami, H. Improvement of Photoaged Facial Skin in Middle-Aged Japanese Females by Topical Retinol (Vitamin A Alcohol): A Vehicle-Controlled, Double-Blind Study. J. Dermatol. Treat. 2009, 20, 276–281. [Google Scholar] [CrossRef]
- Kong, R.; Cui, Y.; Fisher, G.J.; Wang, X.; Chen, Y.; Schneider, L.M.; Majmudar, G. A Comparative Study of the Effects of Retinol and Retinoic Acid on Histological, Molecular, and Clinical Properties of Human Skin. J. Cosm. Dermatol. 2016, 15, 49–57. [Google Scholar] [CrossRef] [Green Version]
- Zasada, M.; Budzisz, E. Randomized Parallel Control Trial Checking the Efficacy and Impact of Two Concentrations of Retinol in the Original Formula on the Aging Skin Condition: Pilot Study. J. Cosmet. Dermatol. 2020, 19, 437–443. [Google Scholar] [CrossRef]
- Kafi, R.; Kwak, H.S.R.; Schumacher, W.E.; Cho, S.; Hanft, V.N.; Hamilton, T.A.; King, A.L.; Neal, J.D.; Varani, J.; Fisher, G.J.; et al. Improvement of Naturally Aged Skin with Vitamin A (Retinol). Arch. Dermatol. 2007, 143, 606–612. [Google Scholar] [CrossRef] [Green Version]
- Gold, M.H.; Kircik, L.H.; Bucay, V.W.; Kiripolsky, M.G.; Biron, J.A. Treatment of Facial Photodamage Using a Novel Retinol Formulation. J. Drugs. Dermatol. 2013, 12, 533–540. [Google Scholar]
- Tolleson, W.; Cherng, S.-H.; Xia, Q.; Boudreau, M.; Yin, J.; Wamer, W.; Howard, P.; Yu, H.; Fu, P. Photodecomposition and Phototoxicity of Natural Retinoids. Int. J. Environ. Res. Public Health 2005, 2, 147–155. [Google Scholar] [CrossRef] [Green Version]
- Rutkowski, M.; Grzegorczyk, K. Adverse Effects of Antioxidative Vitamins. Int. J. Occup. Med. Environ. Health 2012, 25, 105–121. [Google Scholar] [CrossRef]
- Nada, A.; Krishnaiah, Y.S.R.; Zaghloul, A.-A.; Khattab, I. Analysis of Vitamin E in Commercial Cosmetic Preparations by HPLC. J. Cosmet. Sci. 2010, 61, 353–365. [Google Scholar]
- Nada, A.; Krishnaiah, Y.S.R.; Zaghloul, A.-A.; Khattab, I. In Vitro and in Vivo Permeation of Vitamin E and Vitamin E Acetate from Cosmetic Formulations. Med. Princ. Pract. 2011, 20, 509–513. [Google Scholar] [CrossRef]
- Trevithick, J.R.; Mitton, K.P. Topical Application and Uptake of Vitamin E Acetate by the Skin and Conversion to Free Vitamin E. Biochem. Mol. Biol. Int. 1993, 31, 869–878. [Google Scholar]
- Prahl, S.; Kueper, T.; Biernoth, T.; Wöhrmann, Y.; Münster, A.; Fürstenau, M.; Schmidt, M.; Schulze, C.; Wittern, K.-P.; Wenck, H.; et al. Aging Skin Is Functionally Anaerobic: Importance of Coenzyme Q10 for Anti Aging Skin Care. Biofactors 2008, 32, 245–255. [Google Scholar] [CrossRef]
Figure 1.
Distribution of the tested cosmetic products according to: (a) the labeled vitamins A and E and coenzyme Q10; (b) the quantitative specification of their content; (c) labeled vitamin A forms; (d) labeled vitamin E forms; n—number of the cosmetic products within each category.
Figure 1.
Distribution of the tested cosmetic products according to: (a) the labeled vitamins A and E and coenzyme Q10; (b) the quantitative specification of their content; (c) labeled vitamin A forms; (d) labeled vitamin E forms; n—number of the cosmetic products within each category.

Figure 2.
Accuracy of the labelling of vitamins A and E and coenzyme Q10 in the tested cosmetics (green—labelled and contained; pink—contained and not labelled; red—labelled and not contained) and the distribution of the tested products according to the detected labelling errors; n—number of tested cosmetic products within each category; labelling errors include the absence of the labelled (form of) compound and presence of a compound (in a form) which is not labelled.


Figure 3.
Determined content of retinol (R), retinyl palmitate (R-palm), β carotene (β-car), hydroxypinacolone retinoate (HRP), and retinyl propionate (R-prop) in the tested cosmetics (1–35), expressed in mg per g of the cosmetic product (average ± SEM, n = 3) in relation to the product’s price (per 50 mL). In the tested cosmetics numbered 16 and 33, the labelled vitamin A was not detected. In the tested cosmetics marked with *, a labelling error was observed.

Figure 4.
Determined total retinoid content, expressed in mg of retinol equivalents (RE) per g of the tested cosmetics (1–35) in relation to the product’s price (per 50 mL). In the tested cosmetics numbered 16 and 33, the labelled vitamin A was not detected. In the tested cosmetics marked with *, a labelling error was observed.

Figure 5.
Determined content of tocopherol (E) and tocopheryl acetate (E-ac) in the tested cosmetics (1–49) in mg per g of the cosmetic product (average ± SEM, n = 3) in relation to the product’s price (per 50 mL). In the tested cosmetics numbered 4, 18, 28, 34, 43, and 44, the labelled vitamin E was not detected. In the tested cosmetics marked with *, a labelling error was observed.

Figure 6.
Determined content of coenzyme Q10 in the tested cosmetics (1–27) in mg per g of the cosmetic product (average ± SEM, n = 3) in relation to the product’s price (per 50 mL). In the tested cosmetics numbered 9, 14, and 27, the labelled coenzyme Q10 was not detected.
Figure 6.
Determined content of coenzyme Q10 in the tested cosmetics (1–27) in mg per g of the cosmetic product (average ± SEM, n = 3) in relation to the product’s price (per 50 mL). In the tested cosmetics numbered 9, 14, and 27, the labelled coenzyme Q10 was not detected.

Figure 7.
Determined vitamin A contents in relation to the label claim (%) in the 10 tested cosmetic products.
Figure 7.
Determined vitamin A contents in relation to the label claim (%) in the 10 tested cosmetic products.


Table 1.
Concentrations (mg/L) of calibration standards and QC solutions.
| R | R-palm | R-ac | β-car | E | E-ac | Q10 | |
|---|---|---|---|---|---|---|---|
| Calibration standards | 0.25 | 0.38 | 0.25 | 0.25 | 8.00 | 8.00 | 2.50 |
| 1.00 | 1.50 | 1.00 | 1.00 | 40.0 | 40.0 | 12.5 | |
| 10.0 | 15.0 | 10.0 | 10.0 | 80.0 | 80.0 | 25.0 | |
| 25.0 | 37.5 | 25.0 | 25.0 | 320 | 320 | 100 | |
| 75.0 | 113 | 75.0 | 75.0 | 480 | 480 | 150 | |
| 100 | 150 | 100 | 100 | 800 | 800 | 250 | |
| QC solutions | 5.00 | 7.50 | 5.00 | 5.00 | 16.0 | 16.0 | 5.00 |
| 15.0 | 22.5 | 15.0 | 15.0 | 160 | 160 | 50.0 | |
| 50.0 | 75.0 | 50.0 | 50.0 | 640 | 640 | 200 |
Table 2.
Overview of the tested cosmetic products—their form, price range, and labelled vitamin A, vitamin E, and coenzyme Q10.
Table 2.
Overview of the tested cosmetic products—their form, price range, and labelled vitamin A, vitamin E, and coenzyme Q10.
| No. | Form | Vitamin A | Vitamin E | Coenzyme Q10 | Price (€/50 mL) |
|---|---|---|---|---|---|
| 1 | C | 0.0055% R-palm | ≤5 | ||
| 2 | DC | β-car | E | ubiquinone | ≤5 |
| 3 | NC | β-car | E | ubiquinone | ≤5 |
| 4 | DC | R-palm | E | ubiquinone | ≤5 |
| 5 | C | R-palm | E | ubiquinone | ≤5 |
| 6 | C | R-palm | E | ubiquinone | ≤5 |
| 7 | C | R-palm | ≤5 | ||
| 8 | C | R-palm | E | ≤5 | |
| 9 | NC | R | E-ac | ≤5 | |
| 10 | DC | R, R-palm | ≤5 | ||
| 11 | DC | E-ac | ubiquinone | ≤5 | |
| 12 | DC | E-ac | ubiquinone | ≤5 | |
| 13 | S | E-ac | ubiquinone | ≤5 | |
| 14 | NC | E, E-ac | ubiquinone | ≤5 | |
| 15 | DC | E-ac | ubiquinone | ≤5 | |
| 16 | S | E-ac | ubiquinone | ≤5 | |
| 17 | NC | β-car | E | ubiquinone | ≤5 |
| 18 | C | R-palm | E, E-ac | ubiquinone | ≤5 |
| 19 | C | R-palm | E, E-ac | ≤5 | |
| 20 | DC | E, E-ac | ubiquinone | ≤5 | |
| 21 | C | E, E-ac | ubiquinone | ≤5 | |
| 22 | T | R-palm | ≤5 | ||
| 23 | S | 1% R | 5–15 | ||
| 24 | S | 0.2% R | 5–15 | ||
| 25 | DC | R-palm | E-ac | 5–15 | |
| 26 | C | R-palm, β-car | E, E-ac | 5–15 | |
| 27 | EC | ubiquinone | 5–15 | ||
| 28 | AC | E-ac | ubiquinone | 5–15 | |
| 29 | DC | R-palm | E, E-ac | ubiquinone | 5–15 |
| 30 | S | R, R-palm | E, E-ac | 5–15 | |
| 31 | S | E-ac | ubiquinone | 5–15 | |
| 32 | C | R-palm | E | ubiquinone | 5–15 |
| 33 | DC | ubiquinone | 5–15 | ||
| 34 | NC | E-ac | ubiquinone | 5–15 | |
| 35 | C | ubiquinone | 5–15 | ||
| 36 | C | ubiquinone | 5–15 | ||
| 37 | C | E-ac | 5–15 | ||
| 38 | S | R-palm | E,E-ac | ubiquinone | 5–15 |
| 39 | S | 0.5%R | 15–30 | ||
| 40 | C | 2%HRP, R | 15–30 | ||
| 41 | C | E, E-ac | 15–30 | ||
| 42 | AC | R-palm | E, E-ac | 15–30 | |
| 43 | DC | β-car | E, E-ac | ubiquinone | 15–30 |
| 44 | NC | ubiquinone | 15–30 | ||
| 45 | C | E, E-ac | ubiquinone | 15–30 | |
| 46 | C | E | 15–30 | ||
| 47 | C | E | 15–30 | ||
| 48 | S | R-palm | E, E-ac | 15–30 | |
| 49 | DC | E | 15–30 | ||
| 50 | C | β-car | E, E-ac | 15–30 | |
| 51 | C | β-car | E, E-ac | 15–30 | |
| 52 | C | E, E-ac | 15–30 | ||
| 53 | C | 0.5% R, R-prop | E, E-ac | 30–60 | |
| 54 | C | 0.2% R | 30–60 | ||
| 55 | AC | ubiquinone | 30–60 | ||
| 56 | C | R-palm | E-ac | 30–60 | |
| 57 | C | E | 30–60 | ||
| 58 | S | E | 30–60 | ||
| 59 | EC | E | 30–60 | ||
| 60 | NC | E | 30–60 | ||
| 61 | S | E | 30–60 | ||
| 62 | AC | R, R-palm | E | 30–60 | |
| 63 | S | E | 30–60 | ||
| 64 | S | E | 30–60 | ||
| 65 | DC | E-ac | 30–60 | ||
| 66 | S | 0.03% R, R-palm | 60–125 | ||
| 67 | C | 1% R | 60–125 | ||
| 68 | S | 2.5% R | 60–125 | ||
| 69 | C | E-ac | 60–125 | ||
| 70 | C | R, R-palm | E | 60–125 | |
| 71 | EC | ubiquinone | 60–125 | ||
| 72 | C | ubiquinone | 60–125 | ||
| 73 | C | E, E-ac | 60–125 |
AC—anti-ageing concentrate; C—cream; DC—day cream; E—tocopherol; E-ac—tocopheryl acetate; EC—eye cream; HRP—hydroxypinacolone retinoate; NC—night cream; R—retinol; R-palm—retinyl palmitate; R-prop—retinyl propionate; S—serum; T—face tonic; β-car—β carotene.
Table 3.
Validation data.
| R | R-palm | R-ac | β-car | E | E-ac | Q10 | |
|---|---|---|---|---|---|---|---|
| Range (mg/L) | 0.25–100 | 0.38–150 | 0.25–100 | 0.25–100 | 8.00–800 | 8.00–800 | 2.50–250 |
| R2 | 0.9996 | 1.0000 | 0.9998 | 0.9998 | 0.9999 | 0.9999 | 0.9999 |
| LOD (ng/g) | 1.88 | 2.12 | 1.52 | 55.0 | 97.6 | 85.8 | 12.3 |
| LOQ (ng/g) | 6.20 | 7.00 | 5.02 | 182 | 322 | 283 | 40.7 |
| Intra-day accuracy (%) | 101.5 ± 1.1 | 101.4 ± 0.7 | 101.4 ± 0.9 | 100.2 ± 1.7 | 100.6 ± 2.5 | 101.2 ± 2.0 | 100.3 ± 3.3 |
| Inter-day accuracy (%) | 99.8 ± 3.7 | 100.5 ± 4.3 | 102.2 ± 2.8 | 98.2 ± 3.2 | 96.9 ± 3.0 | 97.2 ± 2.4 | 107.0 ± 0.1 |
| Intra-day precision (%) | 0.88 ± 0.64 | 0.92 ± 0.70 | 0.90 ± 0.65 | 1.67 ± 0.72 | 1.48 ± 0.68 | 1.46 ± 0.75 | 1.31 ± 0.78 |
| Inter-day precision (%) | 1.46 ± 1.02 | 1.66 ± 0.56 | 3.40 ± 1.54 | 1.97 ± 1.08 | 1.39 ± 0.59 | 1.62 ± 0.82 | 1.24 ± 0.85 |
| Injection repeatability (%) | 0.20 | 0.08 | 0.12 | 0.11 | 0.09 | 0.15 | 0.35 |
| Stability (%) | 100.8 ± 0.4 | 100.5 ± 0.7 | 100.9 ± 0.4 | 101.0 ± 0.5 | 96.3 ± 2.5 | 101.8 ± 0.3 | 103.0 ± 0.8 |
The results for accuracy, precision, and stability are presented as an average of the three QC in triplicate ± standard deviation.
Publisher’s Note: MDPI stays neutral with regard to jurisdictional claims in published maps and institutional affiliations. |
© 2021 by the authors. Licensee MDPI, Basel, Switzerland. This article is an open access article distributed under the terms and conditions of the Creative Commons Attribution (CC BY) license (https://creativecommons.org/licenses/by/4.0/).
Share and Cite
MDPI and ACS Style
Temova Rakuša, Ž.; Roškar, R. Quality Control of Vitamins A and E and Coenzyme Q10 in Commercial Anti-Ageing Cosmetic Products. Cosmetics 2021, 8, 61. https://0-doi-org.brum.beds.ac.uk/10.3390/cosmetics8030061
AMA Style
Temova Rakuša Ž, Roškar R. Quality Control of Vitamins A and E and Coenzyme Q10 in Commercial Anti-Ageing Cosmetic Products. Cosmetics. 2021; 8(3):61. https://0-doi-org.brum.beds.ac.uk/10.3390/cosmetics8030061
Chicago/Turabian StyleTemova Rakuša, Žane, and Robert Roškar. 2021. "Quality Control of Vitamins A and E and Coenzyme Q10 in Commercial Anti-Ageing Cosmetic Products" Cosmetics 8, no. 3: 61. https://0-doi-org.brum.beds.ac.uk/10.3390/cosmetics8030061
Note that from the first issue of 2016, this journal uses article numbers instead of page numbers. See further details here.