
HPLC Method for Separation of Cannabidiol Hemp Seed Oil with Skin Lipids and Tandem HRMS Technology for Characterization of a Chemical Marker

Abstract
:1. Introduction
2. Materials and Methods
2.1. Apparatus
2.2. Reagents and Samples
2.3. Chemical Standard Preparation
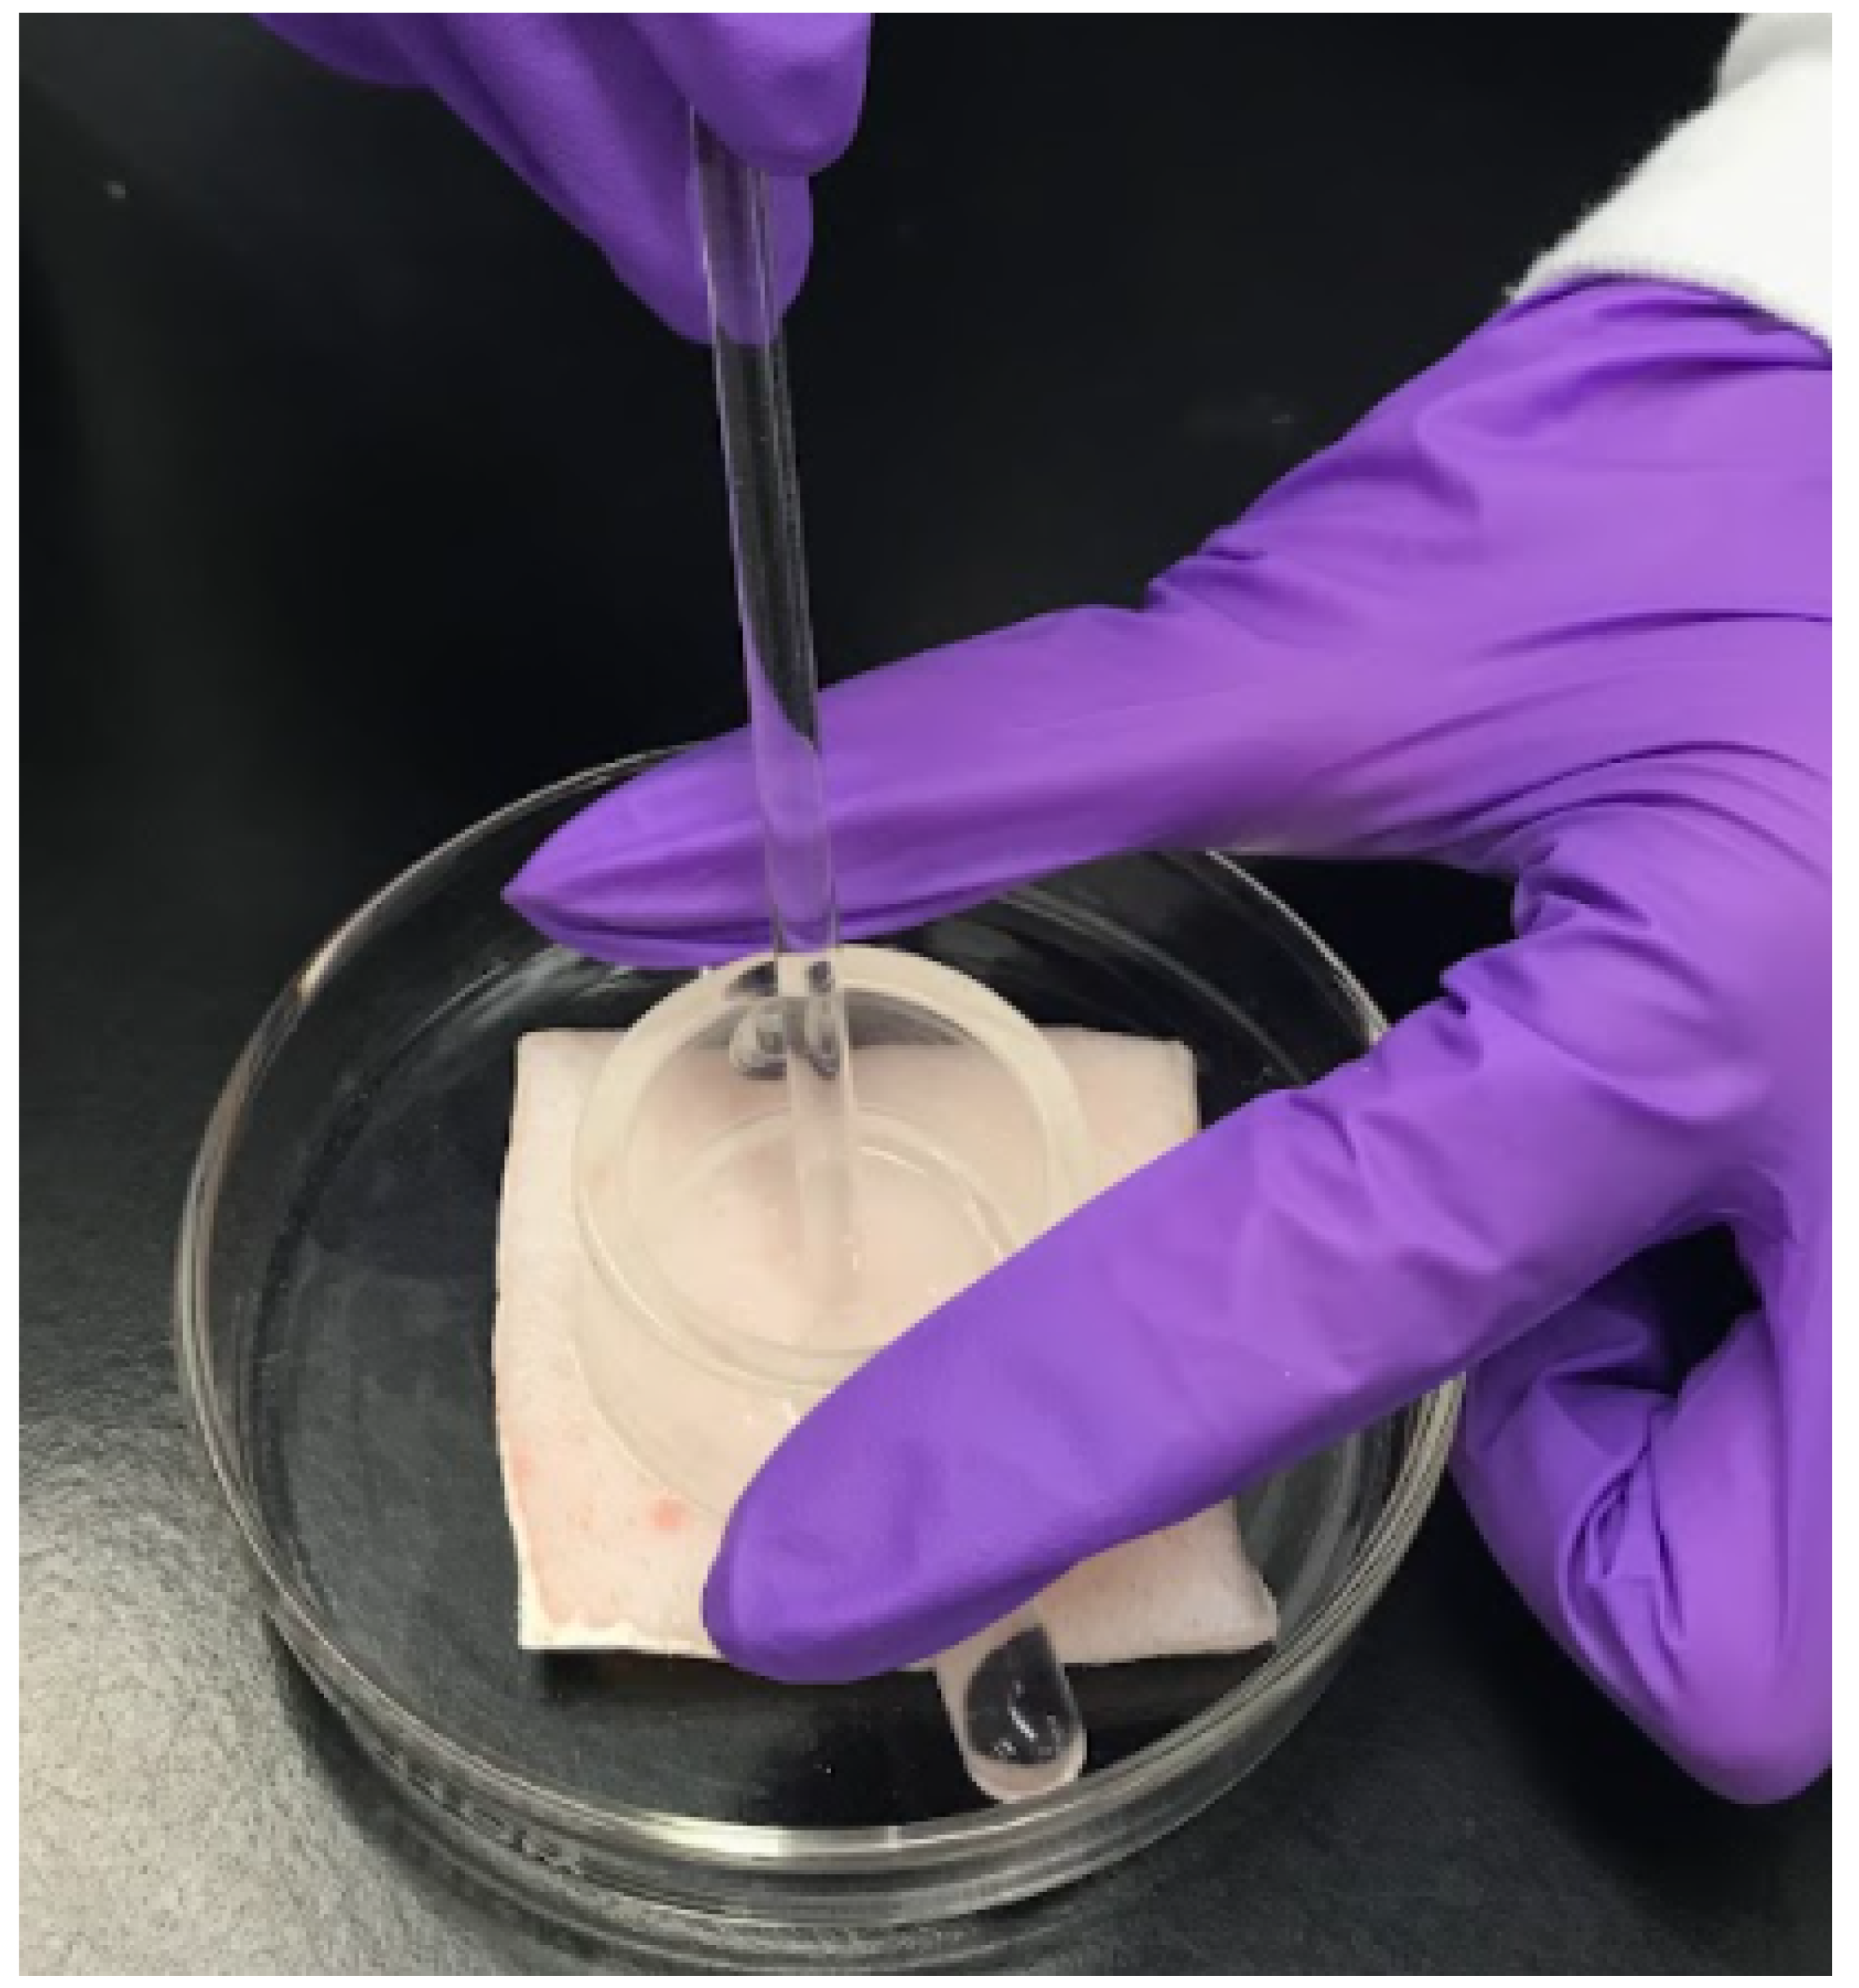
2.4. Skin Sample Preparation
2.5. High Performance Liquid Chromatography-Mass Spectrometry Analysis
3. Results and Discussion
3.1. Chemical Standard Preparation
3.2. Skin Sample Preparation
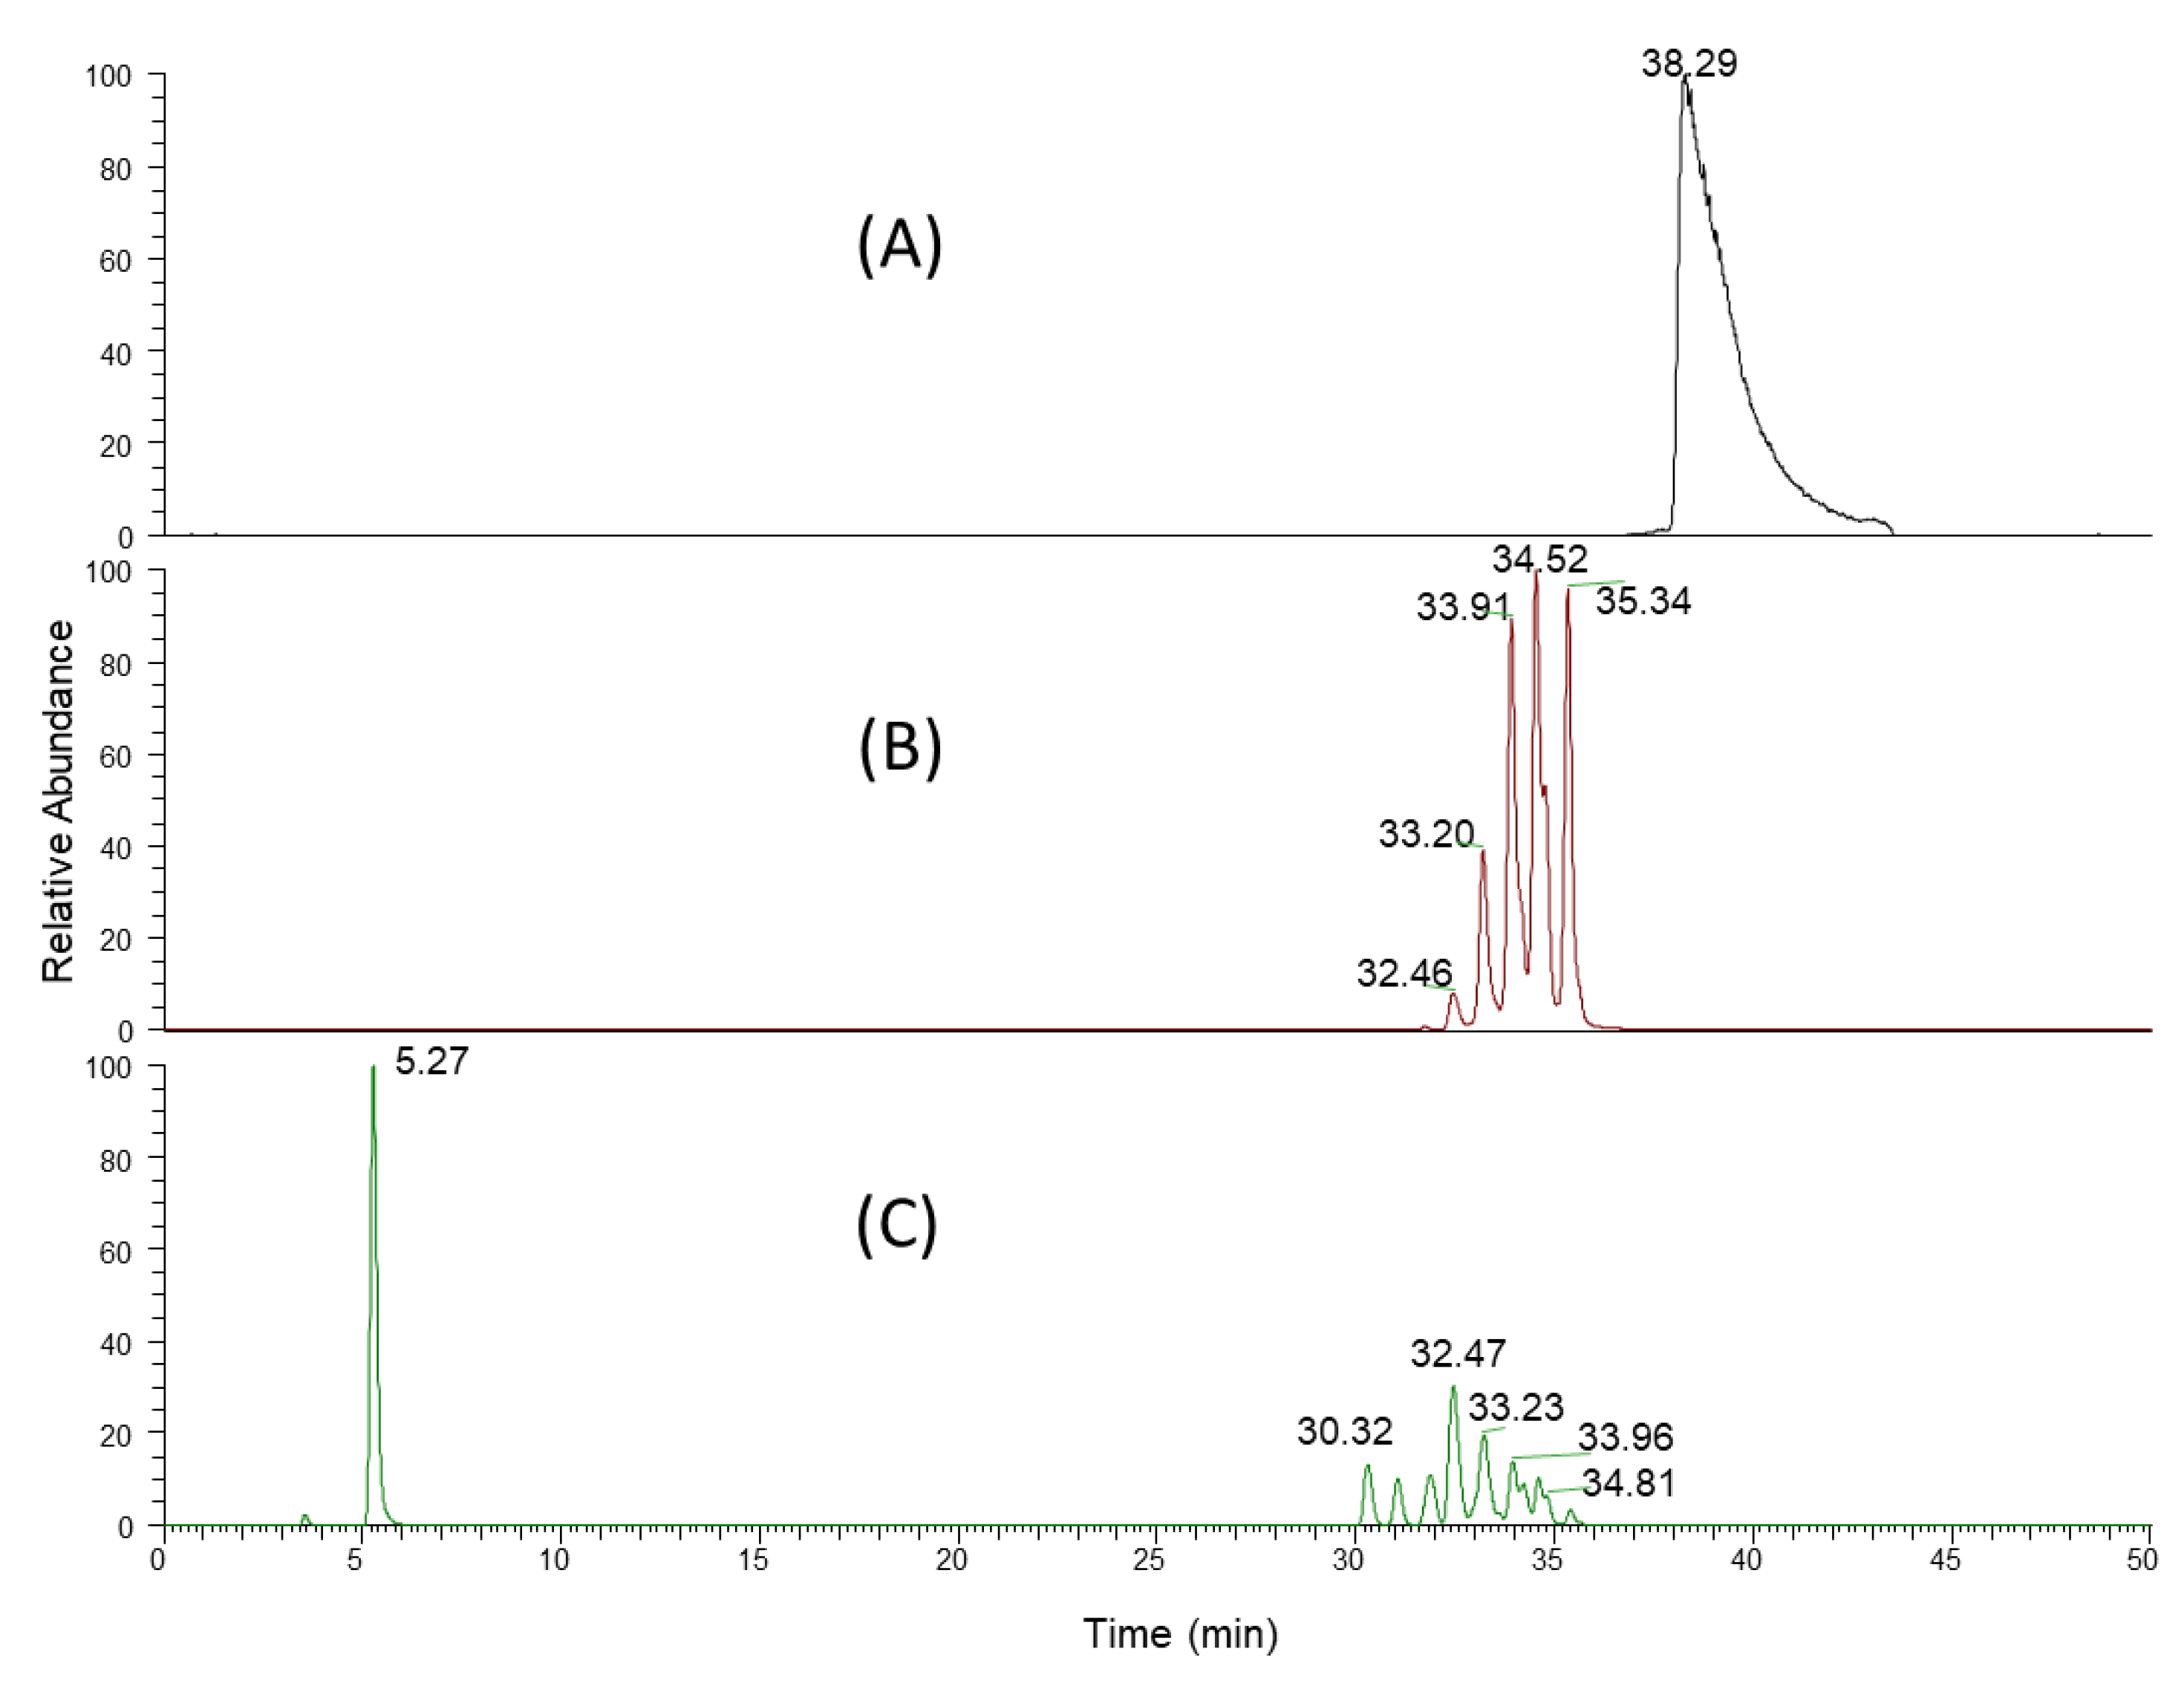
3.3. Liquid Chromatographic Conditions
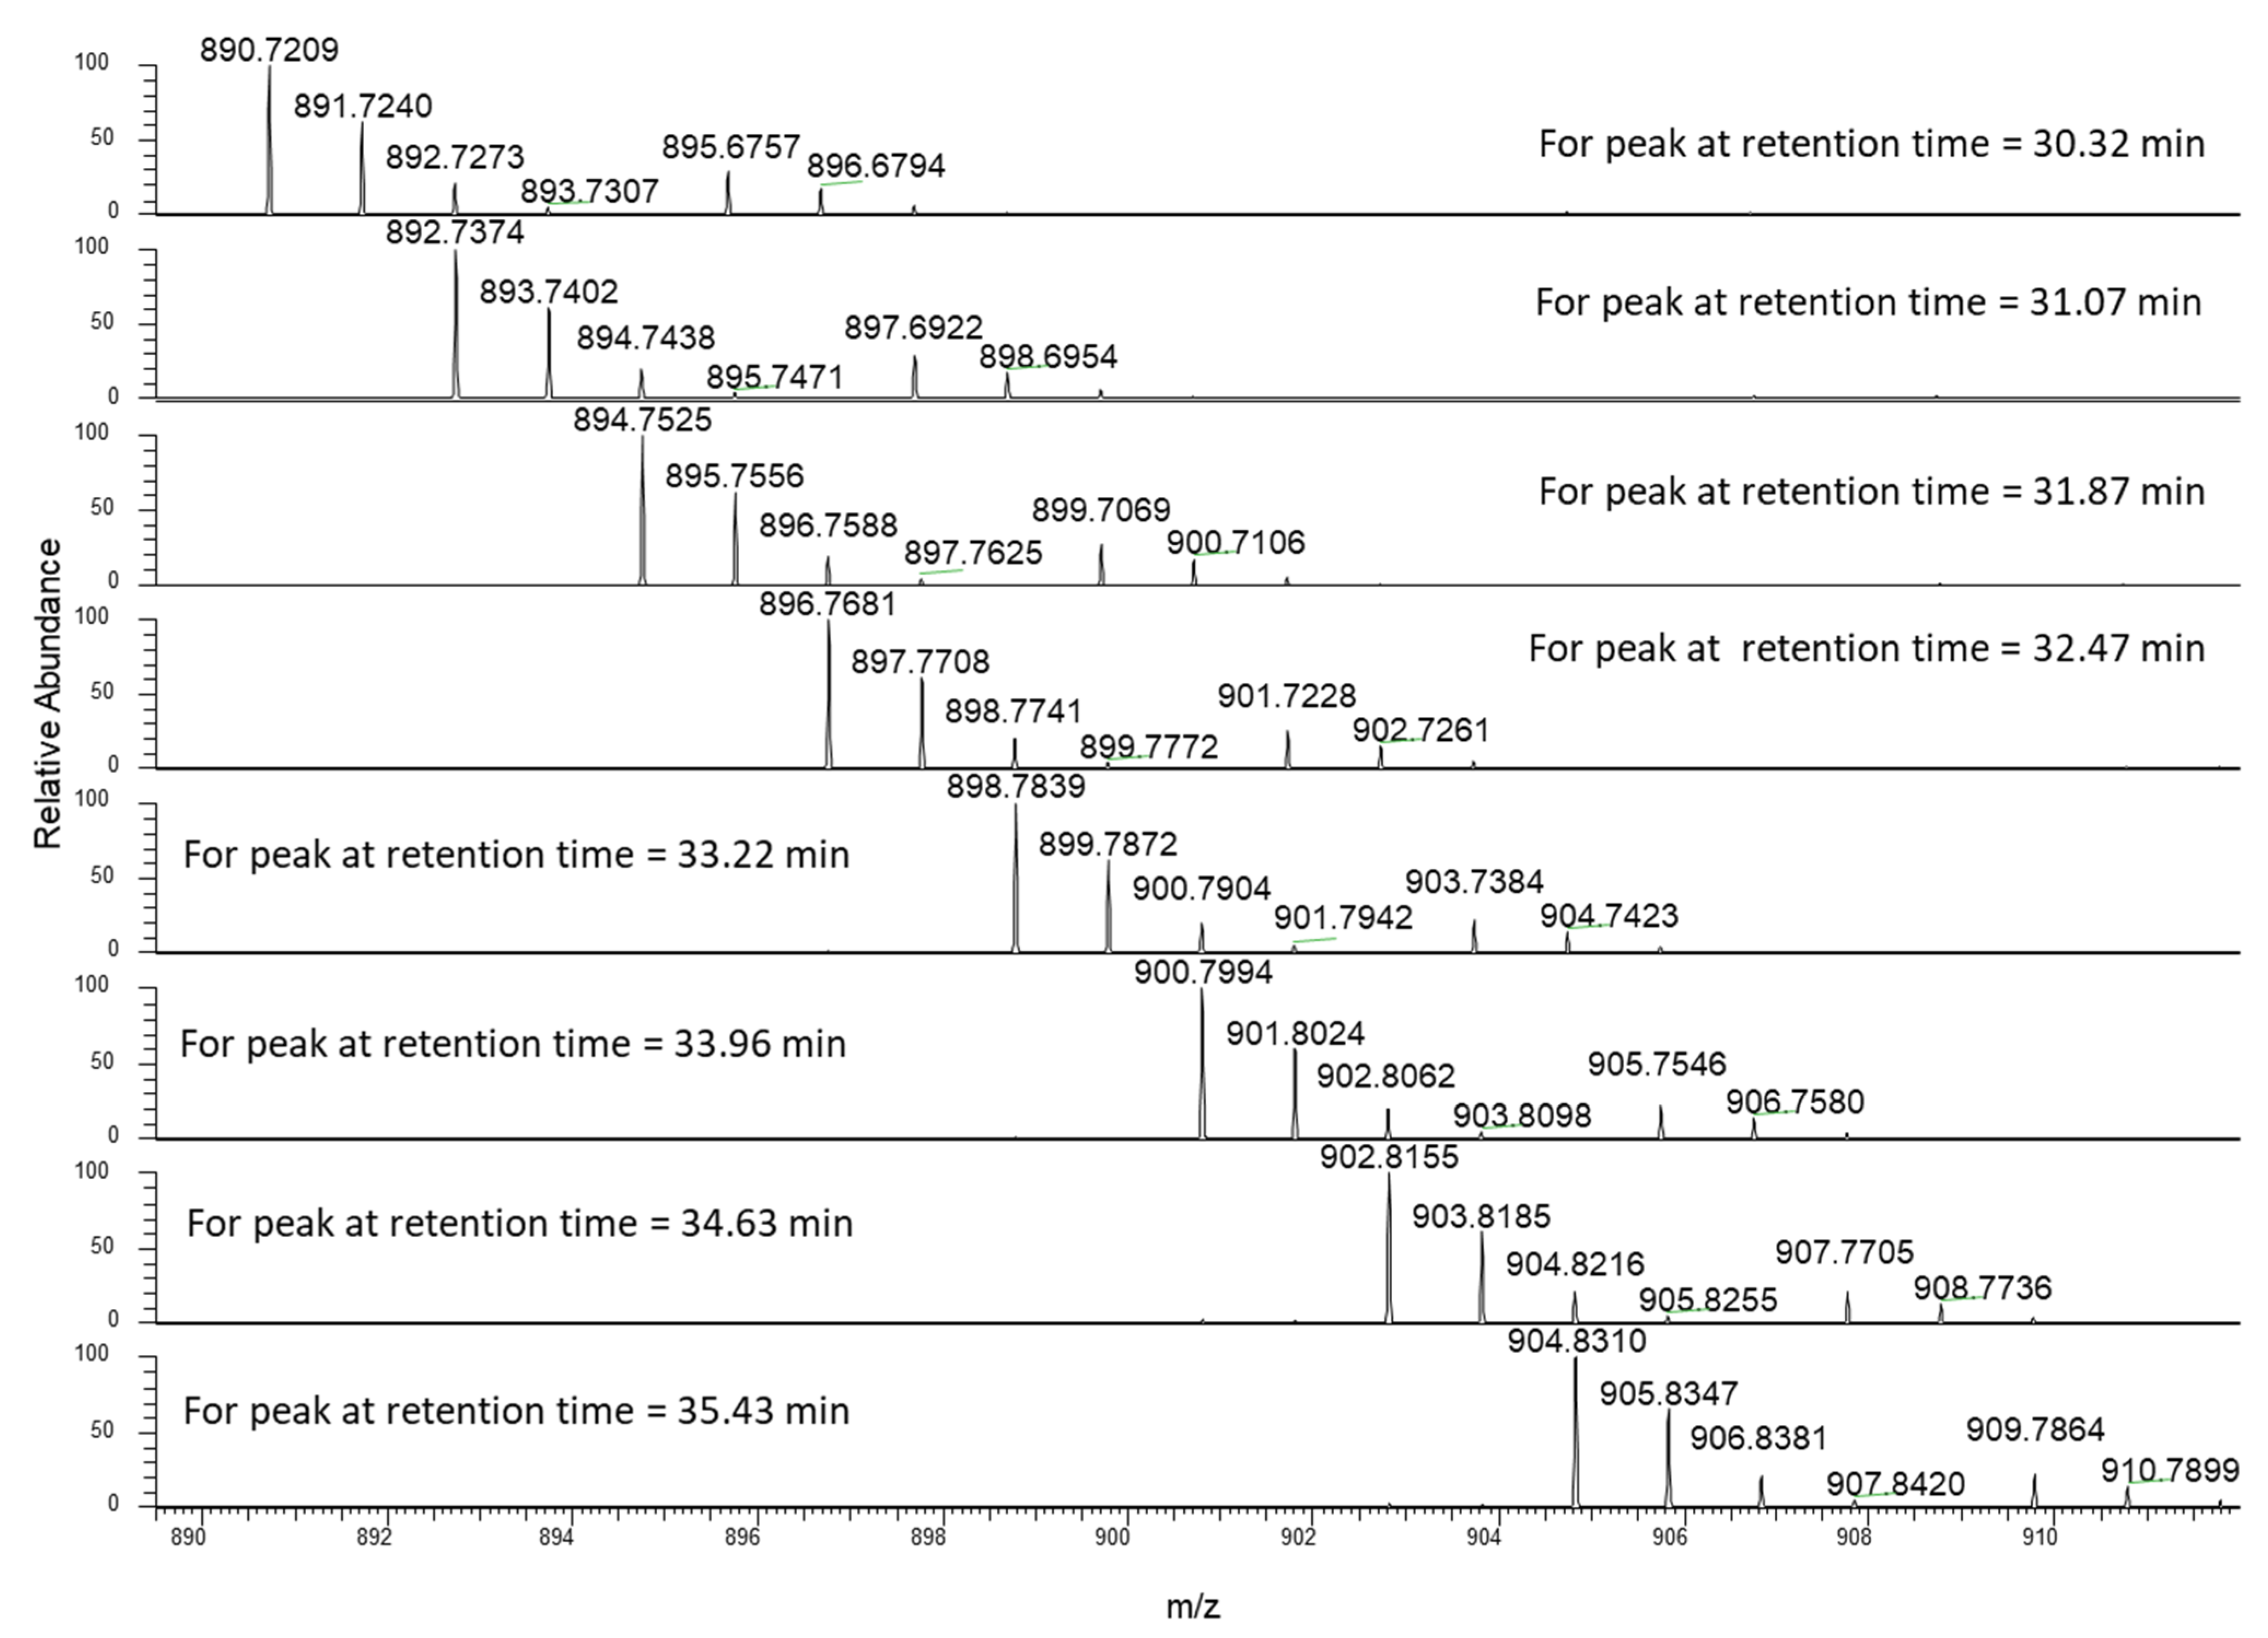
3.4. High Resolution Mass Spectra
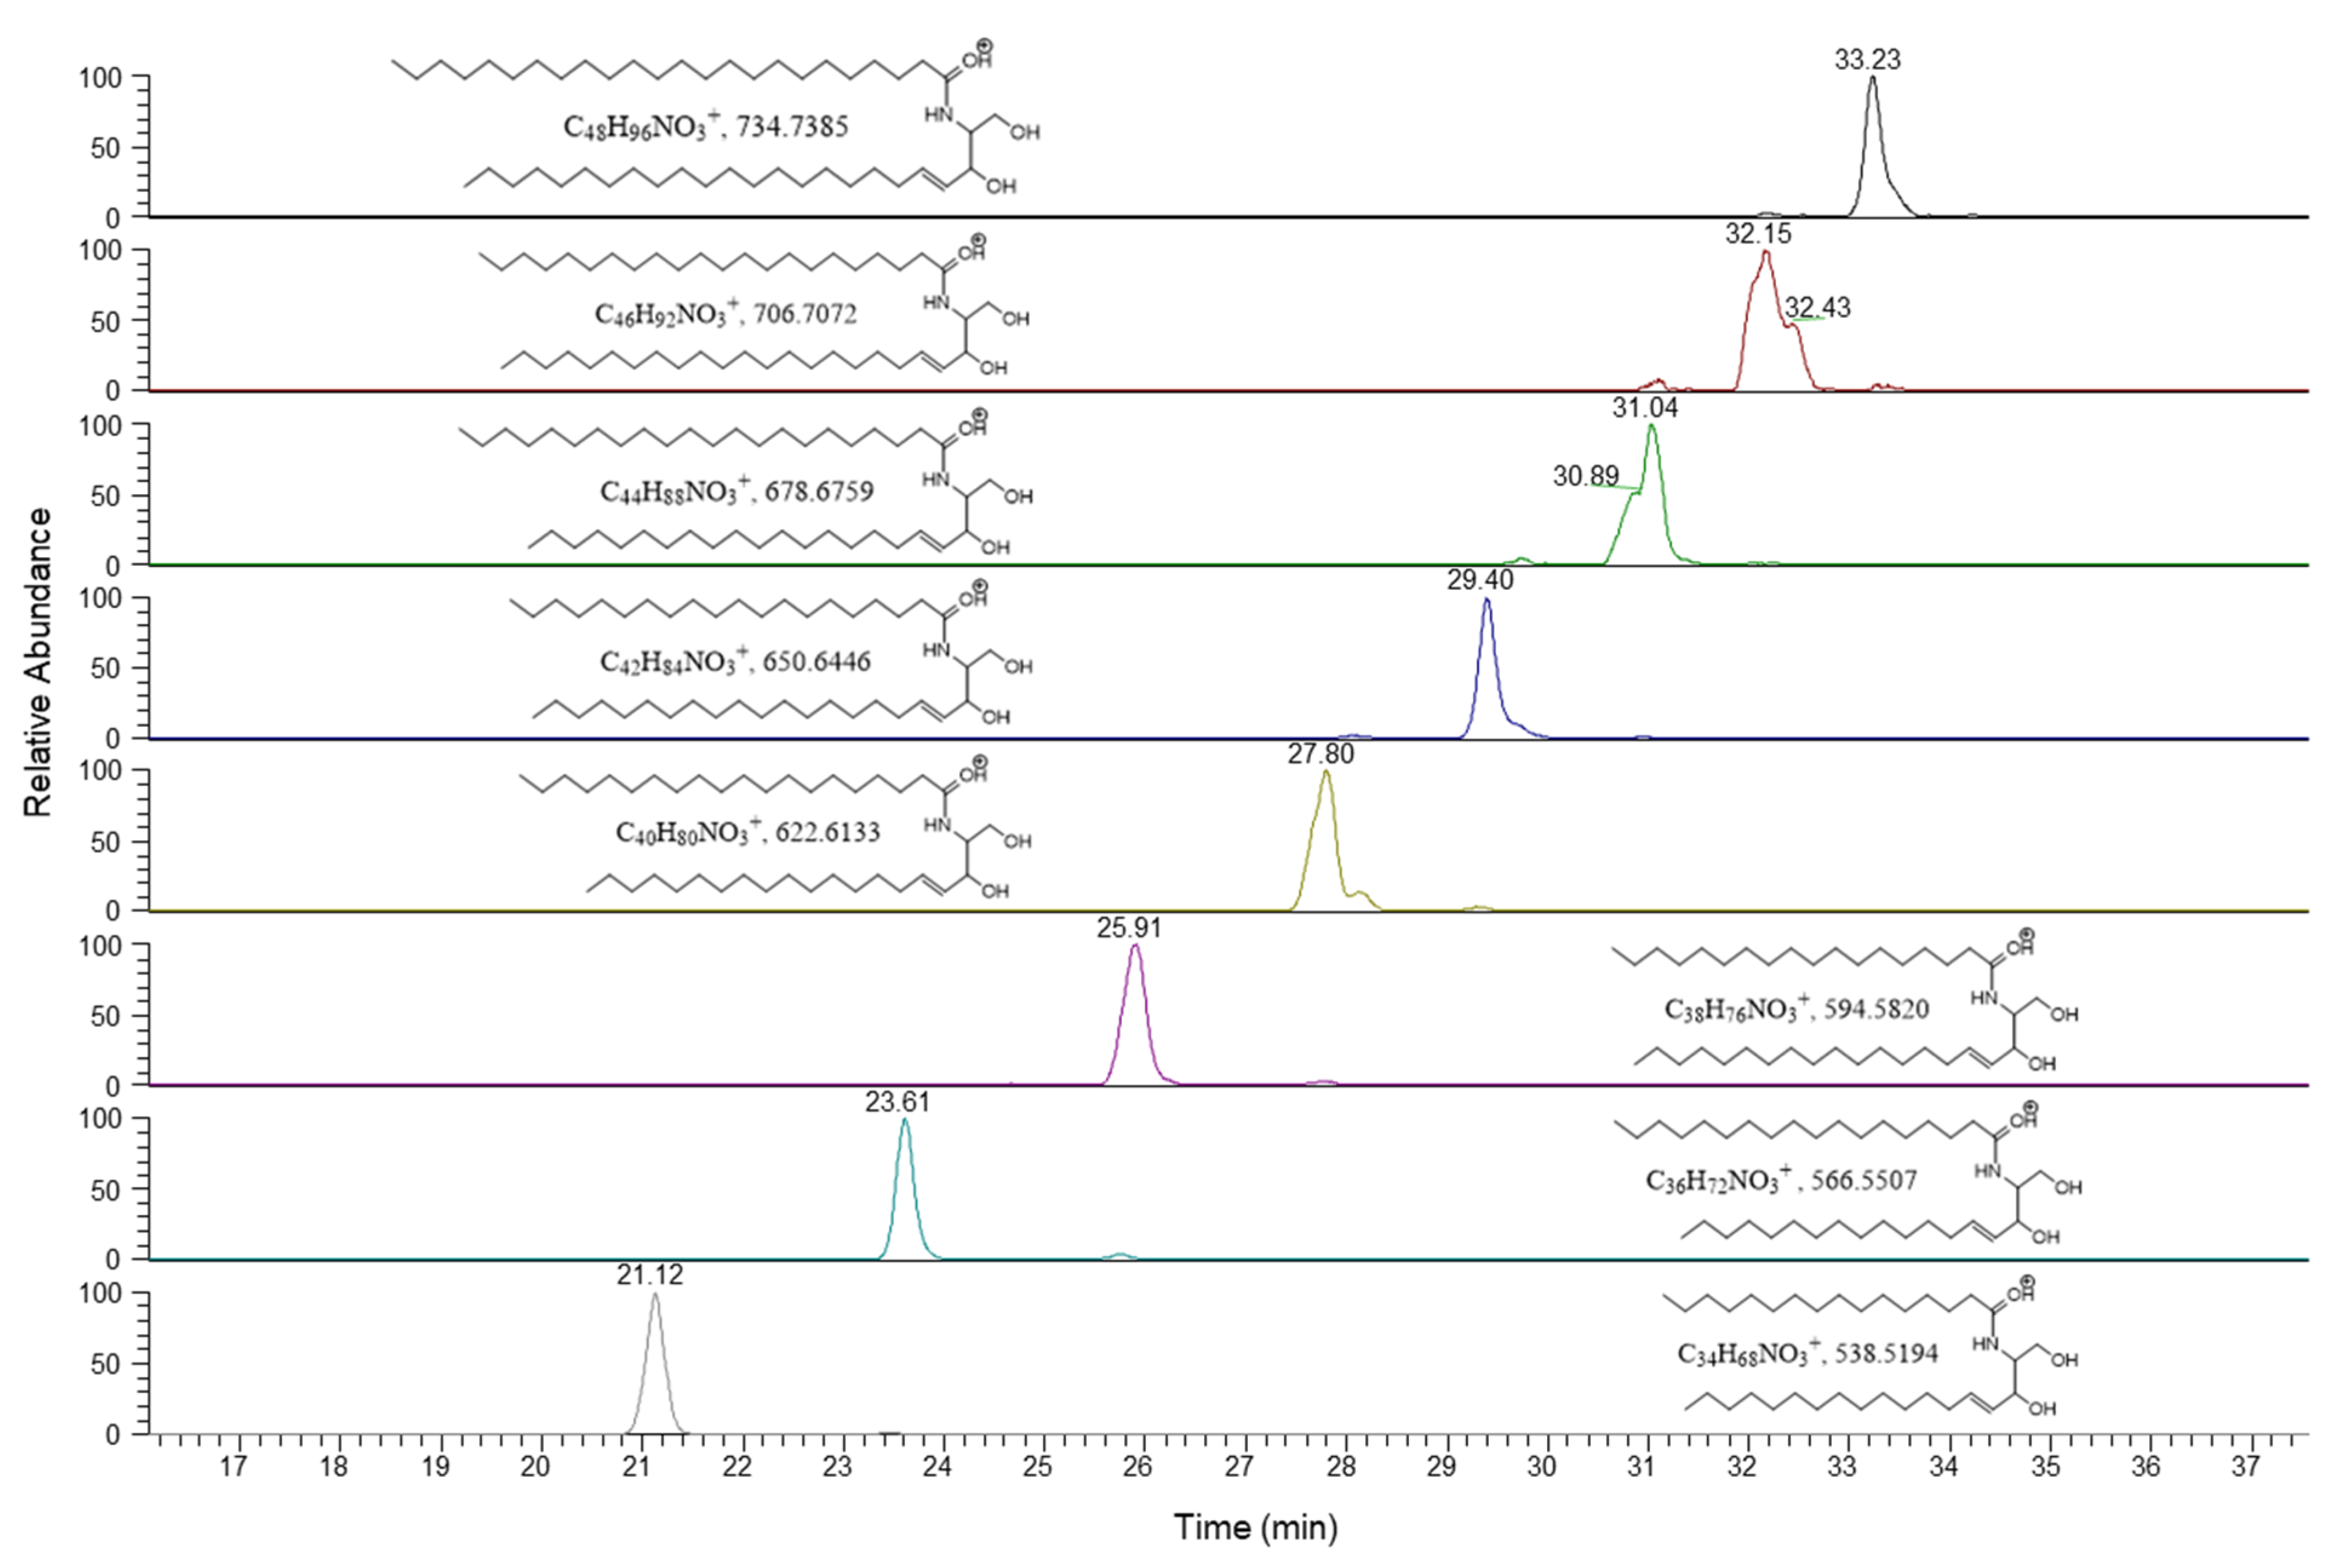
3.5. Structural Identification of Chemical Marker for Hemp Seed Oil
3.6. HPLC-HRMS Method Validation
4. Conclusions
Author Contributions
Funding
Institutional Review Board Statement
Informed Consent Statement
Conflicts of Interest
References
- Iffland, K.; Grotenhermen, F. An Update on Safety and Side Effects of Cannabidiol: A Review of Clinical Data and Relevant Animal Studies. Cannabis Cannabinoid Res. 2017, 2, 139–154. [Google Scholar] [CrossRef] [Green Version]
- Bergamaschi, M.M.; Queiroz, R.H.C.; Zuardi, A.W.; Crippa, J.A.S. Safety and Side Effects of Cannabidiol, a Cannabis sativa Constituent. Curr. Drug Saf. 2011, 6, 237–249. [Google Scholar] [CrossRef]
- Schettino, L.; Prieto, M.; Benedé, J.; Chisvert, A.; Salvador, A. A Rapid and Sensitive Method for the Determination of Cannabidiol in Cosmetic Products by Liquid Chromatography–Tandem Mass Spectrometry. Cosmetics 2021, 8, 30. [Google Scholar] [CrossRef]
- Oláh, A.; Tóth, B.I.; Borbíró, I.; Sugawara, K.; Szöllõsi, A.G.; Czifra, G.; Pál, B.; Ambrus, L.; Kloepper, J.; Camera, E.; et al. Cannabidiol exerts sebostatic and antiinflammatory effects on human sebocytes. J. Clin. Investig. 2014, 124, 3713–3724. [Google Scholar] [CrossRef] [PubMed] [Green Version]
- Casares, L.; García, V.; Garrido-Rodriguez, M.; Millán, E.; Collado, J.A.; García-Martín, A.; Peñarando, J.; Calzado, M.A.; de la Vega, L.; Muñoz, E. Cannabidiol induces antioxidant pathways in keratinocytes by targeting BACH1. Redox Biol. 2020, 28, 101321. [Google Scholar] [CrossRef]
- Jhawar, N.; Schoenberg, E.; Wang, J.V.; Saedi, N. The growing trend of cannabidiol in skincare products. Clin. Dermatol. 2019, 37, 279–281. [Google Scholar] [CrossRef]
- Jeong, S.; Kim, M.S.; Lee, S.H.; Park, B.D. Epidermal Endocannabinoid System (EES) and its Cosmetic Application. Cosmetics 2019, 6, 33. [Google Scholar] [CrossRef] [Green Version]
- Pundir, S.; Garg, P.; Dviwedi, A.; Ali, A.; Kapoor, V.; Kapoor, D.; Kulshrestha, S.; Lal, U.R.; Negi, P. Ethnomedicinal uses, phytochemistry and dermatological effects of Hippophae rhamnoides L.: A review. J. Ethnopharmacol. 2021, 266, 113434. [Google Scholar] [CrossRef] [PubMed]
- Vellido-Perez, J.; Ochando-Pulido, J.; la Fuente, E.B.-D.; Martinez-Ferez, A. Novel emulsions–based technological approaches for the protection of omega–3 polyunsaturated fatty acids against oxidation processes—A comprehensive review. Food Struct. 2021, 27, 100175. [Google Scholar] [CrossRef]
- Mayser, P.; Mrowietz, U.; Arenberger, P.; Bartak, P.; Buchvald, J.; Christophers, E.; Jablonska, S.; Salmhofer, W.; Schill, W.-B.; Krämer, H.-J.; et al. ω-3 Fatty acid–based lipid infusion in patients with chronic plaque psoriasis: Results of a double-blind, randomized, placebo-controlled, multicenter trial. J. Am. Acad. Dermatol. 1998, 38, 539–547. [Google Scholar] [CrossRef]
- Wang, Y.; Hao, Z.; Pan, L. HRMS Detector for the New HILIC CBD Method Development in Hemp Seed Oil. J. Am. Soc. Mass Spectrom. 2020, 32, 1919–1927. [Google Scholar] [CrossRef] [PubMed]
- Picardo, M.; Ottaviani, M.; Camera, E.; Mastrofrancesco, A. Sebaceous gland lipids. Dermato-Endocrinology 2009, 1, 68–71. [Google Scholar] [CrossRef]
- Tascini, A.S.; Noro, M.G.; Seddon, J.M.; Chen, R.; Bresme, F. Mechanisms of lipid extraction from skin lipid bilayers by sebum triglycerides. Phys. Chem. Chem. Phys. 2019, 21, 1471–1477. [Google Scholar] [CrossRef] [PubMed] [Green Version]
- Radner, F.P.; Grond, S.; Lass, A.; Zechner, R. Fat in the skin: Triacylglycerol metabolism in keratinocytes and its role in the development of neutral lipid storage disease. Dermato-Endocrinology 2011, 3, 77–83. [Google Scholar] [CrossRef] [PubMed]
- Rodríguez-Alcalá, L.; Fontecha, J. Major lipid classes separation of buttermilk, and cows, goats and ewes milk by high performance liquid chromatography with an evaporative light scattering detector focused on the phospholipid fraction. J. Chromatogr. A 2010, 1217, 3063–3066. [Google Scholar] [CrossRef]
- Indelicato, S.; Bongiorno, D.; Pitonzo, R.; Di Stefano, V.; Calabrese, V.; Indelicato, S.; Avellone, G. Triacylglycerols in edible oils: Determination, characterization, quantitation, chemometric approach and evaluation of adulterations. J. Chromatogr. A 2017, 1515, 1–16. [Google Scholar] [CrossRef]
- Yang, Q.; Shi, X.; Gu, Q.; Zhao, S.; Shan, Y.; Xu, G. On-line two dimensional liquid chromatography/mass spectrometry for the analysis of triacylglycerides in peanut oil and mouse tissue. J. Chromatogr. B 2012, 895–896, 48–55. [Google Scholar] [CrossRef] [PubMed]
- Han, X.; Ye, H. Overview of Lipidomic Analysis of Triglyceride Molecular Species in Biological Lipid Extracts. J. Agric. Food Chem. 2021, 69, 8895–8909. [Google Scholar] [CrossRef] [PubMed]
- Ruiz-Samblás, C.; González-Casado, A.; Rodríguez, L.C. Triacylglycerols Determination by High-temperature Gas Chromatography in the Analysis of Vegetable Oils and Foods: A Review of the Past 10 Years. Crit. Rev. Food Sci. Nutr. 2013, 55, 1618–1631. [Google Scholar] [CrossRef]
- Castro-Gómez, M.P.; Holgado, F.; Rodríguez-Alcalá, L.M.; Montero, O.; Fontecha, J. Comprehensive Study of the Lipid Classes of Krill Oil by Fractionation and Identification of Triacylglycerols, Diacylglycerols, and Phospholipid Molecular Species by Using UPLC/QToF-MS. Food Anal. Methods 2015, 8, 2568–2580. [Google Scholar] [CrossRef]
- Buchgraber, M.; Ulberth, F.; Emons, H.; Anklam, E. Triacylglycerol profiling by using chromatographic techniques. Eur. J. Lipid Sci. Technol. 2004, 106, 621–648. [Google Scholar] [CrossRef]
- Balgoma, D.; Guitton, Y.; Evans, J.J.; Le Bizec, B.; Dervilly-Pinel, G.; Meynier, A. Modeling the fragmentation patterns of triacylglycerides in mass spectrometry allows the quantification of the regioisomers with a minimal number of standards. Anal. Chim. Acta 2019, 1057, 60–69. [Google Scholar] [CrossRef]
- Renaud, J.B.; Overton, S.; Mayer, P.M. Energy and entropy at play in competitive dissociations: The case of uneven positional dissociation of ionized triacylglycerides. Int. J. Mass Spectrom. 2013, 352, 77–86. [Google Scholar] [CrossRef]
- Franklin, E.T.; Xia, Y. Structural elucidation of triacylglycerol using online acetone Paternò–Büchi reaction coupled with reversed-phase liquid chromatography mass spectrometry. Analyst 2020, 145, 6532–6540. [Google Scholar] [CrossRef] [PubMed]
- Williams, P.E.; Klein, D.R.; Greer, S.M.; Brodbelt, J.S. Pinpointing Double Bond and sn-Positions in Glycerophospholipids via Hybrid 193 nm Ultraviolet Photodissociation (UVPD) Mass Spectrometry. J. Am. Chem. Soc. 2017, 139, 15681–15690. [Google Scholar] [CrossRef]
- Kodali, S.; Shukla, V.K.S. CBD Oil for Healthier-Looking Skin; International Cosmetics Science Center A/S: Aarhus, Denmark, 2019; Volume 48. [Google Scholar]
- Liao, F.-Y.; Lin, Y.-C.; Chen, Y.-L.; Feng, C.-H. Determination of tranexamic acid in various matrices using microwave-assisted derivatization followed by dispersive liquid–liquid microextraction. J. Chromatogr. A 2015, 1377, 35–45. [Google Scholar] [CrossRef]
- Paulson, D.S.; Topp, R.; Boykin, R.E.; Schultz, G.; Yang, Q. Efficacy and safety of a novel skin cleansing formulation versus chlorhexidine gluconate. Am. J. Infect. Control 2018, 46, 1262–1265. [Google Scholar] [CrossRef]
- Wertz, P.W.; Downing, D.T. Covalently bound ω-hydroxyacylsphingosine in the stratum corneum. Biochim. Biophys. Acta (BBA) Lipids Lipid Metab. 1987, 917, 108–111. [Google Scholar] [CrossRef]
- Pinna, K.; Whitney, E.; Rady Rolfes, S. Understanding Nutrition, 11th ed.; Brooks Cole Publishing Company: Pacific Grove, CA, USA, 2015; pp. 144–147. [Google Scholar]
- Alonso-Esteban, J.I.; Fernández, M.J.G.; Fabrikov, D.; Torija-Isasa, E.; Sánchez-Mata, M.D.C.; Guil-Guerrero, J.L. Hemp (Cannabis sativa L.) Varieties: Fatty Acid Profiles and Upgrading of γ-Linolenic Acid–Containing Hemp Seed Oils. Eur. J. Lipid Sci. Technol. 2020, 122, 1900445. [Google Scholar] [CrossRef]
- Abdollahi, M.; Sefidkon, F.; Calagari, M.; Mousavi, A.; Mahomoodally, M.F. A comparative study of seed yield and oil composition of four cultivars of Hemp (Cannabis sativa L.) grown from three regions in northern Iran. Ind. Crops Prod. 2020, 152, 112397. [Google Scholar] [CrossRef]
- Marzocchi, S.; Caboni, M. Effect of harvesting time on hemp (Cannabis sativa L.) seed oil lipid composition. Ital. J. Food Sci. 2020, 32, 1018–1029. [Google Scholar]
- Tringaniello, C.; Cossignani, L.; Blasi, F. Characterization of the Triacylglycerol Fraction of Italian and Extra-European Hemp Seed Oil. Foods 2021, 10, 916. [Google Scholar] [CrossRef] [PubMed]
- Ianni, F.; Blasi, F.; Giusepponi, D.; Coletti, A.; Galli, F.; Chankvetadze, B.; Galarini, R.; Sardella, R. Liquid chromatography separation of α- and γ-linolenic acid positional isomers with a stationary phase based on covalently immobilized cellulose tris(3,5-dichlorophenylcarbamate). J. Chromatogr. A 2020, 1609, 460461. [Google Scholar] [CrossRef] [PubMed]


| CBD Hemp Seed Oil | Dilution Ratio | Diluent | HSO Concentration | CBD Concentration |
|---|---|---|---|---|
| Stock solution (S0) | Chloroform solvent | 2850 ppm | 142,500 ppb | |
| Working solution S1 | 1:100 from S0 | 1:10 chloroform:normal propanol solvent | 28.5 ppm | 1425 ppb |
| Working solution S2 | 1:10 from S1 | 80% normal propanol water solvent | 5.7 ppm | 285 ppb |
| Working solution S3 | 1:4 from S2 | 50% normal propanol water solvent | 0.425 ppm | 71.3 ppb |
| Working solution S4 | 1:4 from S3 | 50% normal propanol water solvent | 0.356 ppm | 17.8 ppb |
| Working solution S5 | 1:4 from S4 | 50% normal propanol water solvent | 0.089 ppm | 4.5 ppb |
| GTND Standard | Dilution Ratio | Diluent | Concentration | |
| Stock solution (S0) | chloroform | 2700 ppm | ||
| S1 | 1:20 from S0 | 1:10 chloroform:normal propanol solvent | 135 ppm | |
| S2 | 1:100 from S1 | 1:10 chloroform:normal propanol solvent | 1.35 ppm | |
| S3 | 1:10 from S2 | normal propanol | 0.135 ppm | |
| S4 | 1:5 from S3 | 50% normal propanol water solvent | 0.027 ppm | |
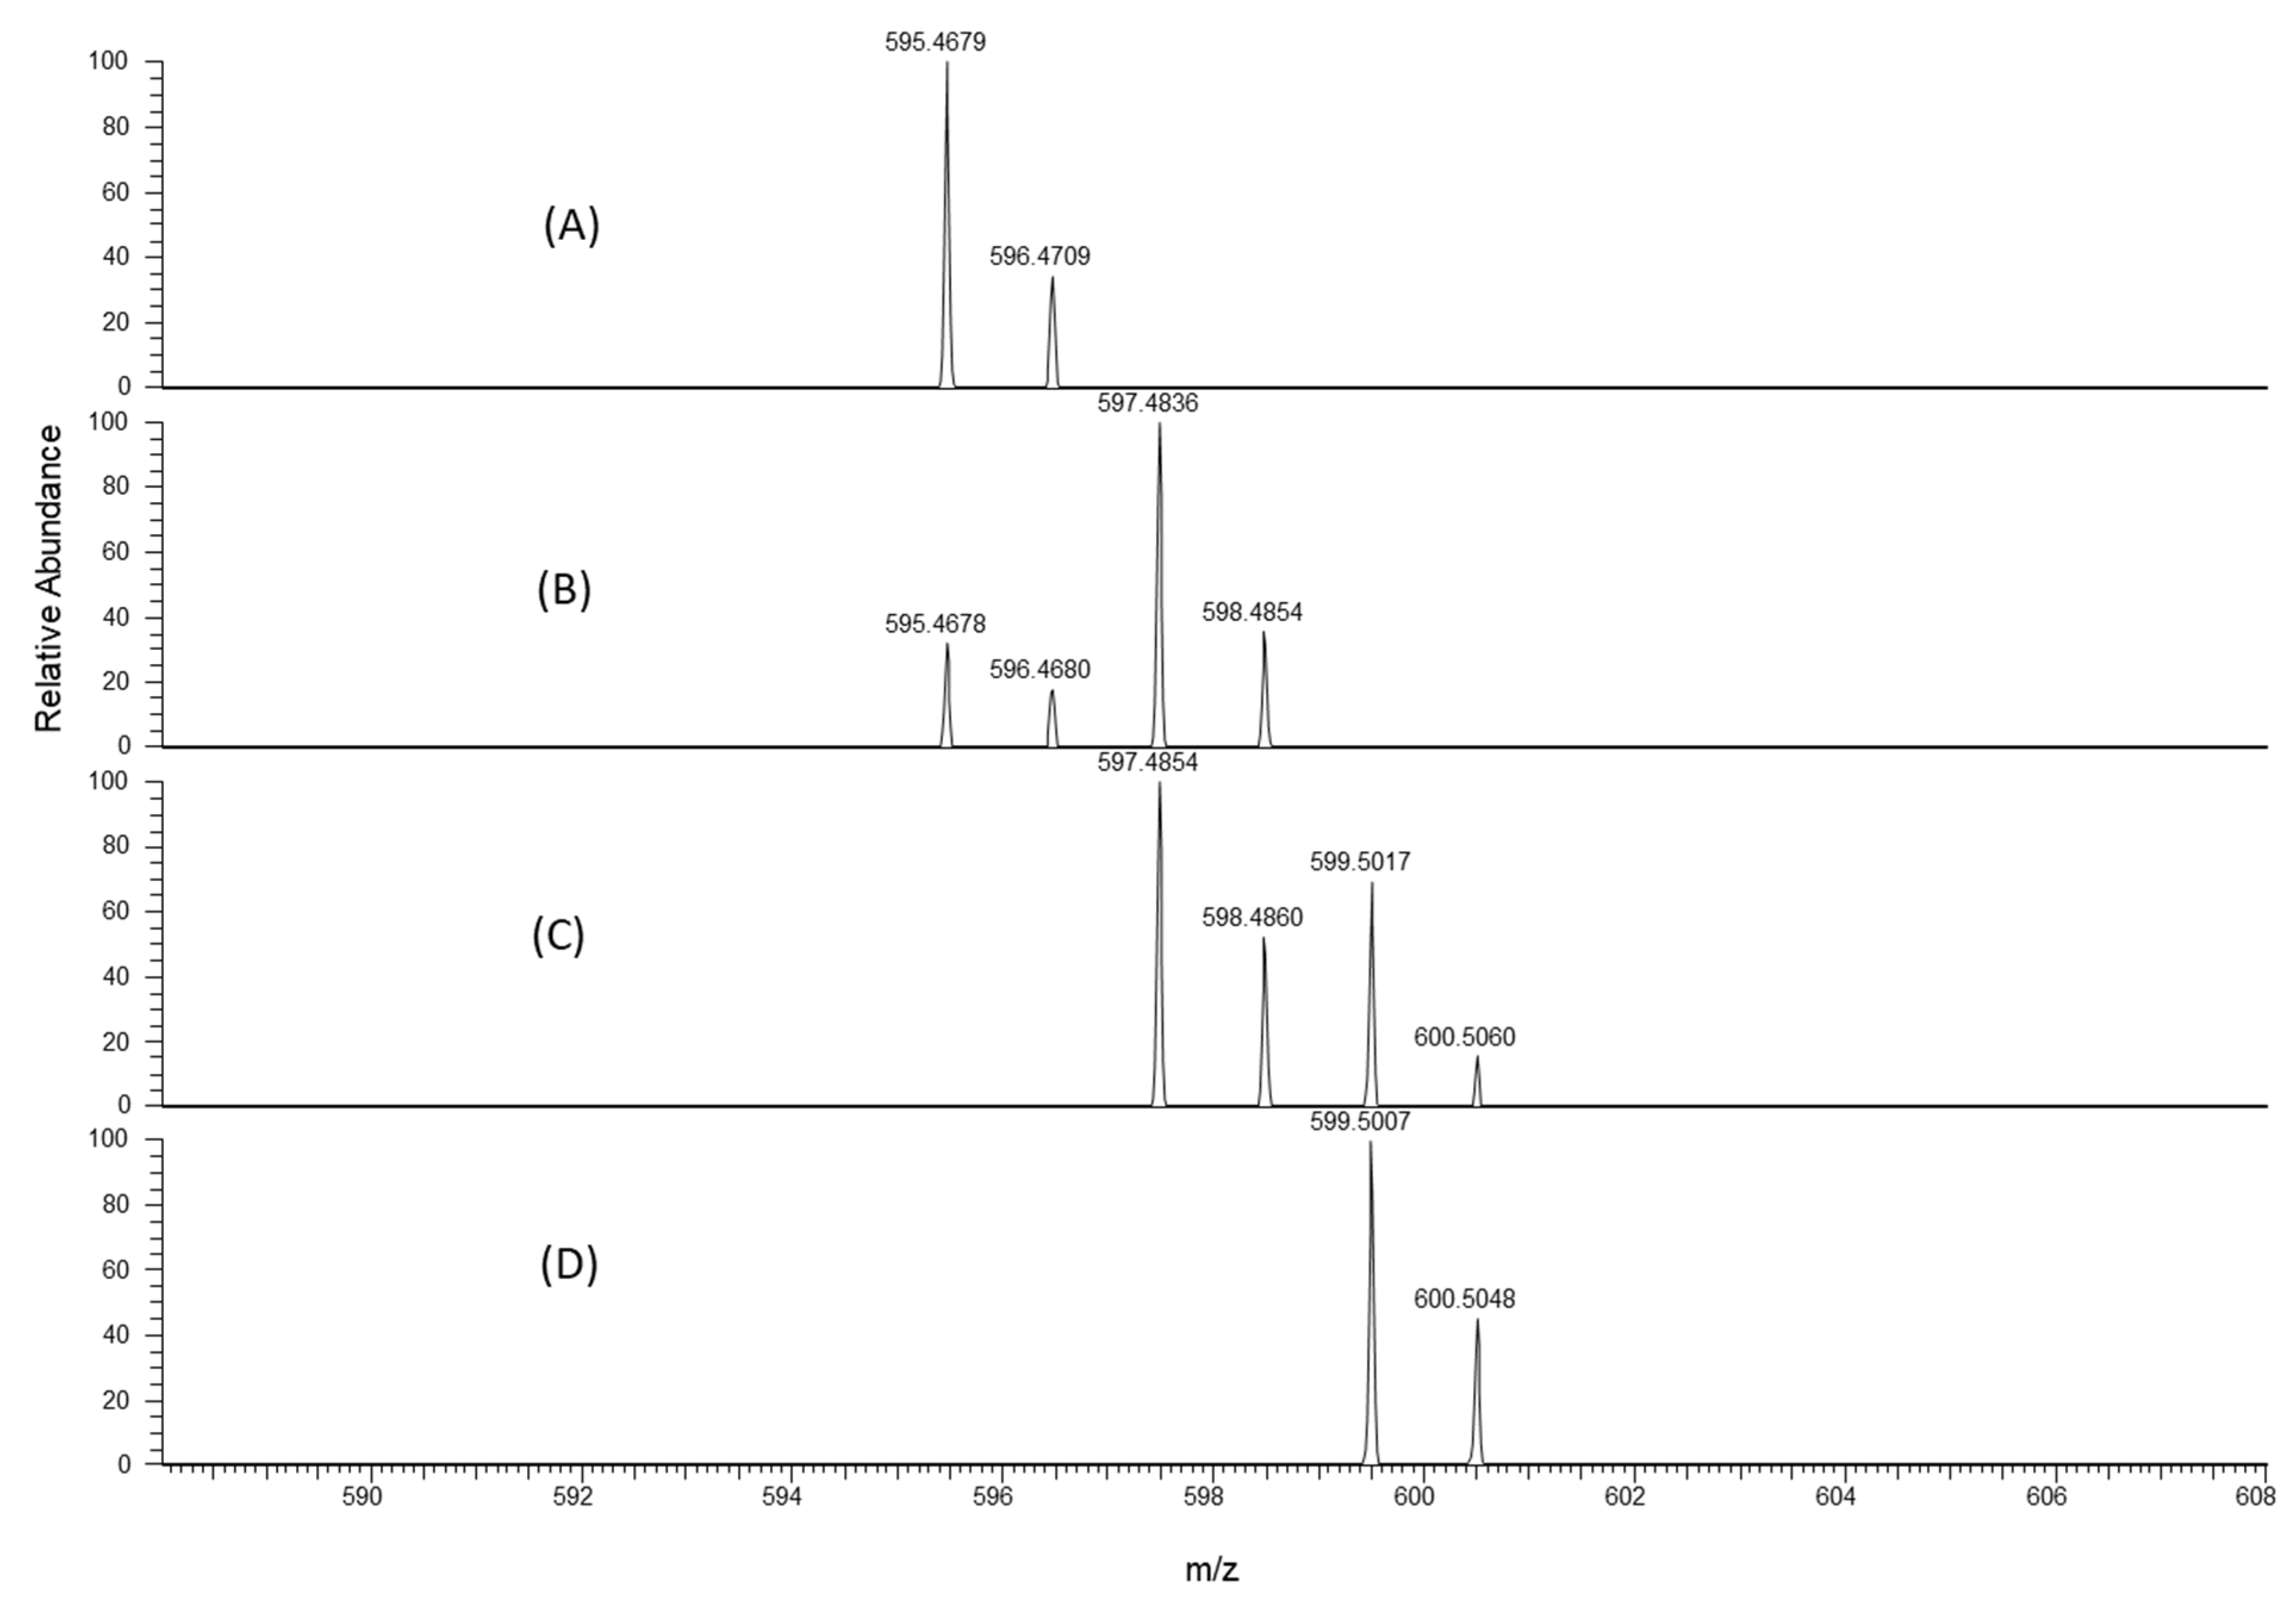
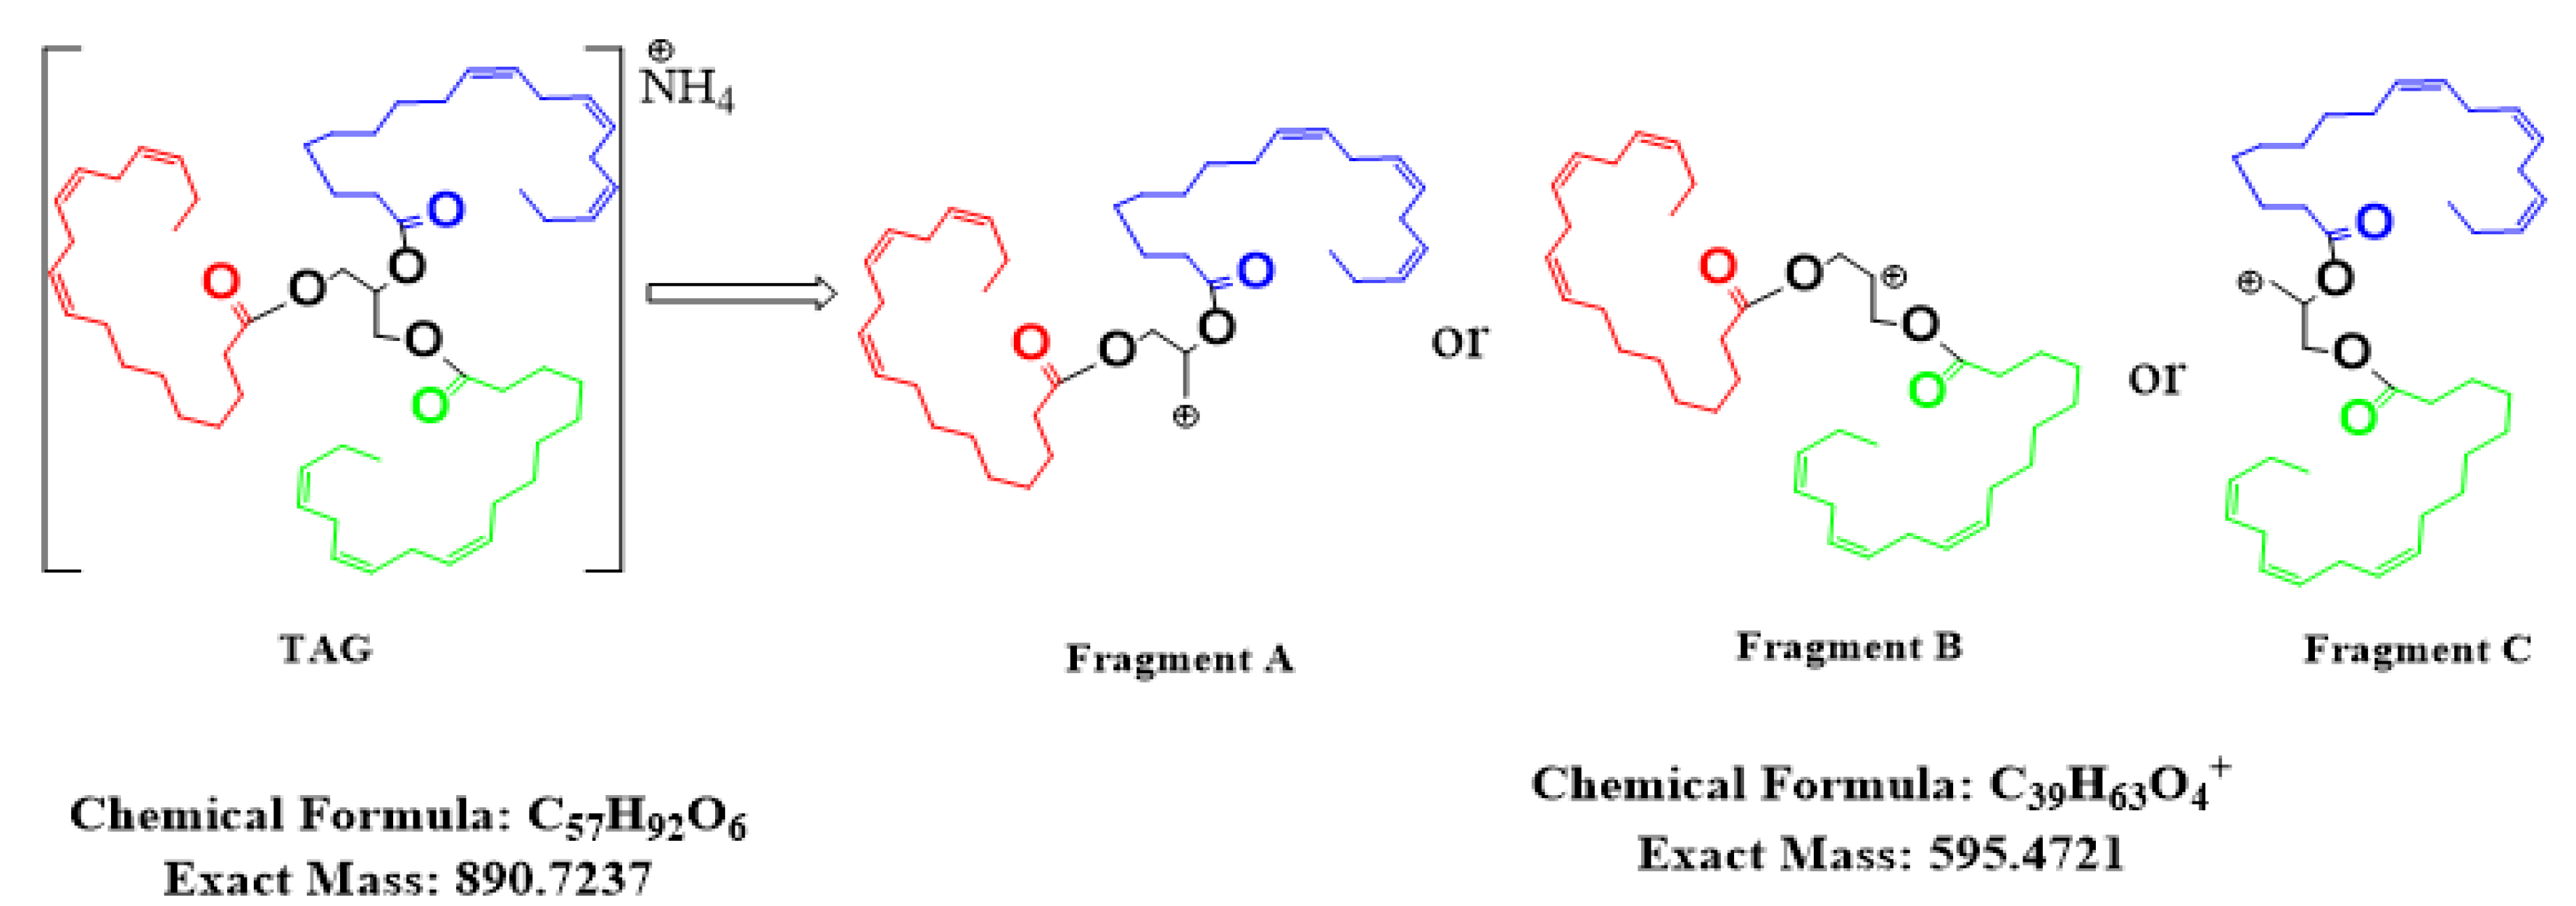
| [M + NH4]+ | Total Double Bond | Red | Blue | Green | Fragment-A | Fragment-B | Fragment-C |
|---|---|---|---|---|---|---|---|
| 890.7216 | 9 | 3 | 3 | 3 | 595 | 595 | 595 |
| 892.7375 | 8 | 2 | 3 | 3 | 597 | 597 | 595 |
| 894.7525 | 7 | 1 | 3 | 3 | 599 | 599 | 595 |
| 896.7682 | 6 | 2 | 2 | 2 | 599 | 599 | 599 |
Publisher’s Note: MDPI stays neutral with regard to jurisdictional claims in published maps and institutional affiliations. |
© 2021 by the authors. Licensee MDPI, Basel, Switzerland. This article is an open access article distributed under the terms and conditions of the Creative Commons Attribution (CC BY) license (https://creativecommons.org/licenses/by/4.0/).
Share and Cite
Liu, Y.; Wang, Y.; Hao, Z.; Pan, L. HPLC Method for Separation of Cannabidiol Hemp Seed Oil with Skin Lipids and Tandem HRMS Technology for Characterization of a Chemical Marker. Cosmetics 2021, 8, 108. https://0-doi-org.brum.beds.ac.uk/10.3390/cosmetics8040108
Liu Y, Wang Y, Hao Z, Pan L. HPLC Method for Separation of Cannabidiol Hemp Seed Oil with Skin Lipids and Tandem HRMS Technology for Characterization of a Chemical Marker. Cosmetics. 2021; 8(4):108. https://0-doi-org.brum.beds.ac.uk/10.3390/cosmetics8040108
Chicago/Turabian StyleLiu, Yuxin, Yu Wang, Zhigang Hao, and Long Pan. 2021. "HPLC Method for Separation of Cannabidiol Hemp Seed Oil with Skin Lipids and Tandem HRMS Technology for Characterization of a Chemical Marker" Cosmetics 8, no. 4: 108. https://0-doi-org.brum.beds.ac.uk/10.3390/cosmetics8040108