
Microenvironmental Features Driving Immune Evasion in Myelodysplastic Syndromes and Acute Myeloid Leukemia


1
First Department of Internal Medicine, General Hospital of Piraeus “Tzaneio”, 18536 Piraeus, Greece
2
Department of Haematology, Faculty of Medicine, School of Health Sciences, University of Ioannina, 45500 Ioannina, Greece
*
Author to whom correspondence should be addressed.
Diseases 2022, 10(2), 33; https://0-doi-org.brum.beds.ac.uk/10.3390/diseases10020033
Submission received: 7 May 2022
/
Revised: 6 June 2022
/
Accepted: 8 June 2022
/
Published: 10 June 2022
(This article belongs to the Special Issue Feature Paper Special Issue for Editorial Board Members (EBMs) of Diseases)
Abstract
:Bone marrow, besides the known functions of hematopoiesis, is an active organ of the immune system, functioning as a sanctuary for several mature immune cells. Moreover, evidence suggests that hematopoietic stem cells (the bone marrow’s functional unit) are capable of directly sensing and responding to an array of exogenous stimuli. This chronic immune stimulation is harmful to normal hematopoietic stem cells, while essential for the propagation of myeloid diseases, which show a dysregulated immune microenvironment. The bone marrow microenvironment in myelodysplastic syndromes (MDS) is characterized by chronic inflammatory activity and immune dysfunction, that drive excessive cellular death and through immune evasion assist in cancer cell expansion. Acute myeloid leukemia (AML) is another example of immune response failure, with features that augment immune evasion and suppression. In this review, we will outline some of the functions of the bone marrow with immunological significance and describe the alterations in the immune landscape of MDS and AML that drive disease progression.
1. Introduction
Bone marrow (BM) is a sophisticated organ, providing more than just passive hematopoiesis. BM supports the immune system through lymphopoiesis and myelopoiesis and is not an indifferent organ immune-wise, but rather a highly active one, with its components reacting to an array of immune and noxious stimuli, influencing the function of hematopoietic stem cells (HSCs) and hematopoietic niche cells [1]. Moreover, BM acts as a sanctuary for many immune cells, such as plasma cells and mature lymphoid cells [2]. Alterations in the niche components are associated with malignancies [3].
The BM immune landscape significantly changes with myeloid malignancies. In myelodysplastic syndromes (MDS) (a malignancy characterized by myelodysplasia and ineffective hematopoiesis [4], the HSC reactivity to environmental stimuli proves detrimental, as chronic inflammatory signaling drives MDS progression and normal HSC suppression [1,5,6]. Studies suggest that the difference between low-risk and high-risk diseases also manifests in their different immune microenvironments [7,8].
Acute myeloid leukemia (AML) is a highly heterogenous disease, which results in normal hematopoiesis failure, owing to immature myeloid cell proliferation [9]. The BM immune microenvironment is significantly dysregulated in AML and even though AML has been considered an immune responsive disease [10], AML cells are capable of evading and suppressing host immune responses [11].
In this review, we highlight the immune functions of the normal BM and further outline the dysregulations of the immune landscape that augment disease progression in MDS and AML (summarized in Table 1).
1.1. BM in Immunity and Inflammation
BM is the premier organ to produce different blood components during both steady-state and stress hematopoiesis. Hematopoietic stem and progenitor cells (HSPC) represent the functional unit; they self-renew and differentiate in a tightly regulated manner in heterogenous microenvironmental domains.
BM supports the immune system through myelopoiesis and lymphopoiesis, as well as a sanctuary for mature lymphoid cell types [2]. A topic of great interest is the function of BM besides that of a hematopoietic organ, having a key role in sustaining protective immune responses through plasma cell survival and immune memory maintenance [12,13], as well as being a dynamic entity capable of directly sensing and modulating its response to inflammatory signals [1]. Aberrancy in the components of the hematopoietic stem cell niche can induce and/ or sustain myeloid malignancy
1.2. Lymphopoiesis
HSCs differentiate into multipotent progenitors (MPPs) [14], which will differentiate into lymphoid and myeloid lineages through common lymphoid (CLPs) and common myeloid progenitors (CML), respectively [15]. Different HSC populations exhibit heterogenous potential for lymphoid commitment, suggesting the existence of intrinsic lymphoid bias [2], although HSC differentiation leans towards myelopoiesis with aging [16]. During lymphoid development, early T-cell progenitors migrate to the thymus, while B-cell progenitors maturate in the BM [2]. Distinct cellular niches guide B-cell developmental stages. Early-stage lymphopoiesis is associated with osteoblasts, osteoclasts, and CXCL12-abundant reticular (CAR) cells, whereas later development is regulated by interleukin (IL)-7 producing cells and sinusoidal endothelial cells [2]. IL-7 is pivotal in B-cell development [17].
1.3. Interplay between Lymphoid Lineage Cells and the BM
In addition to lymphopoiesis, BM harbors multiple mature lymphoid cells [2]. Naive T-/B-cells recirculate and populate the dendritic cell (DC) rich perisinusoidal space, forming a possible defense for blood-borne pathogens [18,19]. CD4+ and CD8+ memory T-cells can also be maintained in the BM after antigen experience. Whether memory T-cells are temporary inhabitants or a fraction of them permanently reside in the BM is an area of active research [20]. The current consensus is that a non-migratory CD69+ memory T cell subset exists, permanently localized in the BM [12], and a CD 69- memory T-cell subset exists in a state of equilibrium between the BM and the peripheral blood [12]. Regulatory T-cells (Tregs) are known immune mediators and have a crucial role in the success of allogeneic hematopoietic stem cell transplantation (allo-HSCT), as well as the progression of myeloid malignancies [3]. Tregs also regulate IL-7 production, and therefore, B-cell development [21]. T-cells also function in the context of inflammation by impairing HSC renewal through interferon (IFN)-γ [22,23] and inducing myelopoiesis through tumor necrosis factor (TNF)-a [24].
Plasma cells survive in the BM with stimuli from the microenvironment. These stimuli include the secretion of cytokines such as CXCL12, IL-6, B-cell activating factor (BAFF), and a proliferation-inducing ligand (APRIL) in specialized domains termed survival niches [25]. Ligation of B-cell maturation antigen (BCMA) by APRIL/ BAFF is a crucial step for plasma cell survival [26]. Mature cells of hematopoietic progeny and non-hematopoietic stromal cells contribute to the formation of the plasma cell niche [12,27].
Even though the BM is not a secondary lymphoid organ, some of its functions resemble one. The BM can conduct primary immune reactions (CD4+ and CD8+ T-cells) in response to blood-borne antigens [28,29], without forming organized B-/T-cell areas, which characterize secondary lymphoid organs, but rather aggregates of dendritic cells and T-cells [16]. Moreover, memory CD4+ T-cell responses, leading to cluster formation between major histocompatibility complex type II (MHC II) presenting cells and antigen-specific T-cells have been documented [30]. Histologically, lymphoid follicle-like structures, which are devoid of traditional B-/T-cell organized areas can expand during inflammation and autoimmunity [31].
1.4. Myelopoiesis
The BM microenvironment controls myeloid progenitor differentiation and distribution through opposing signals from different cell types [17,32]. For instance, Hérault et al. showed that granulocyte–macrophage progenitors (GMP) are scattered single cells during a steady state. However, GMPs expand and form clusters during regeneration and leukemia. G-CSF and IL-1 nurtured GMP cluster manifestation, whereas megakaryocyte-derived signals inhibited GMP promotion [33].
As stated above, the BM is not an organ that only produces immune cells, but also actively responds to harmful and inflammatory stimuli. HSCs are capable of directly sensing exogenous noxious and/or inflammatory signals such as cytokines, pathogen-associated molecular patterns (PAMPS), and damage-associated molecular patterns (DAMPS) with an inventory of intracellular and extracellular receptors. The resulting effects are HSPC mobilization and differentiation to augment immune cell production [1,34,35]. Moreover, it is known that a differentiation program can be preferred under specific conditions, as in the case of emergency myelopoiesis (sacrificing lymphopoiesis) during severe infection [34,36].
An array of different inflammatory cytokines such as IFN-a, IFN-γ, TNF-a, transforming growth factor (TGF)-β,IL-1, IL-6, macrophage-colony stimulating factor (M-CSF) secreted by hematopoietic progeny and non-hematopoietic cells affect HSC function and preferentially induce myeloid differentiation [1]. However, the effects of cytokines may be context-dependent and when maintained can have deleterious consequences on HSCs [1,37]. Toll-like receptors (TLRs), specifically TLR2 and TLR4, are expressed on HSPC and their activation by DAMPs and PAMPs results in myeloid differentiation [38]. Pattern recognition receptors (PRRs), such as TLRs and NOD-like receptors exist on hematopoietic and non-hematopoietic cells affecting HSC upon their activation. BM microenvironment cells of non-hematopoietic progeny such as endothelial cells, osteocytes, adipocytes, and neurons can modulate HSC functions in stressed conditions [1]. For instance, TLR-4 and NOD-like receptor 1/2 by microenvironment cells resulted in granulocyte-CSF(G-CSF) and induced a myeloid differentiation in HSCs [39,40]. Furthermore, HSCs and their BM niche respond to transient BM injury and inflammation by chemotherapy and radiotherapy to reinstate normal hematopoiesis [1].
In recent years, the concept of trained immunity of the innate immune system–analogous to the immunological memory of the adaptive immune system- has emerged, with its basis being epigenetic reprogramming of innate immune cells [41]. This trained immunity may come down to its effects on HSPCs giving another layer of complexity to the immune response [1,42].
1.5. HSCs and Allo-HSCT
HSCT is an effective method for treating hematologic malignancies; however, the myeloablative regimens enlisted are damaging to the recipients’ BM microenvironment, subsequently compromising donor HSCs’ function and transplant success (negative bystander effect) [3,43]. Transplanted HSC in order to reconstitute hematopoiesis must home and establish themselves in the damaged/reconstituting BM [44], with CXCL12 being critical (among many chemo-attractants) in mediating HSC engraftment [45,46]. Interestingly, donor HSCs can also influence the recipient’s BM microenvironment into augmenting their engraftment potential [44]. The elevated O2 levels (attributed to transplant pre-conditioning [47], metabolic switch to OXPHOS, and the resulting increase in ROS levels [48,49], are insults that transplanted HSC need to address in order to be functionally intact and balance between self-renewal and differentiation [44].
Immune reconstitution post-HSCT commences gradually at different phases, with the innate component being the first to function, with different transplantation procedures characterized by different neutrophil engraftment dates (umbilical cord HSCT being the slowest) [50,51], followed by NK and CD4+/CD8+ T-cells and lastly B-cell reconstitution [52]. Different transplantation modalities result in different immune reconstitution kinetics, with haploidentical HSCT having delayed immune reconstitution compared to matched-sibling donor transplantation [53]. Moreover, it is suggested that better immune recovery correlates with superior transplantation outcomes [54].
Now that some immune functions of the BM have been outlined, the contribution and perturbation of the immunological landscape of the BM in the context of MDS and AML will be discussed.
2. The Immune Landscape in MDS
The Revised International Prognostic Scoring System (IPSS-R) is used to estimate the MDS patients’ risk of AML progression and overall survival (OS). In clinical settings, patients with an IPSS-R score of 3.5 or less represent a lower-risk MDS group (median survival; 5.9 years), whereas an IPSS-R score > 3.5 falls into the higher-risk MDS group (median survival; 1.5 years) [55]. The lower-risk disease is associated with an inflammatory microenvironment and increased cell death, in contrast to higher-risk disease, which is delineated by immunosuppression and clonal expansion (Figure 1) [7,56]. Herein, the role of inflammation and immunosuppression regarding their constituting cell types will be discussed.
2.1. The Inflammatory Microenvironment of MDS
Aberrant innate immune system activation leads to dysfunctional hematopoiesis and induces excessive cellular death; a hallmark of MDS [56]. Several factors, intrinsic and extrinsic of the malignant clone, contribute to the intricate inflammatory network.
2.1.1. Predisposing Factors Driving Inflammation (Mutations, Aging/Chronic Immune Stimulation)
The genetic lesions of MDS are complex and dynamic and may enable a reciprocal mechanism in which gene mutations upregulate inflammation pathways and the inflammatory milieu contributes to genomic instability and mutagenesis [7]. Recurrent mutations entail spliceosome machinery, epigenetic and transcription regulation, DNA repair, signaling pathways, and the cohesin complex [4]. Spliceosome mutations such as SF3B1, SRSF2, U2AF1, and mutations in epigenetic regulators, e.g., TET2, and ASXL1, which drive clonal dominance and evolution in MDS [7], trigger innate immune signaling pathways and NRP3-inflammasome activation [7,57]. Haploinsufficiency of microRNAs (miR-145, miR-146a), as well as genes, in del (5q) MDS altered signaling intermediates, such as Toll-interleukin-1 receptor domain-containing adaptor protein (TIRAP) and TNF receptor factor-6 (TRAF6), stimulating TLR activation and cytokine (IL-6) production [58,59].
Aging represents a smoldering inflammatory process (“inflammaging”) [60] characterized by immunosenescence leading to malfunctioning adaptive immune responses [61,62]. As analyzed, HSCs are capable of directly sensing DAMPs/PAMPs through PRRs, skewing their differentiation program to myeloid lineages [16,38]. Such conditions create a fertile environment for mutated MDS clones to propagate [7]. Moreover, MDS is associated with a variety of autoimmune diseases, providing another example of chronic immune stimuli [8].
2.1.2. Significant Signalling Pathways
Innate immune signaling is central in the pathogenesis of MDS. Genes related to immune signaling are overexpressed in more than 50% of MDS patients [63,64]. TLRs and their downstream intermediates (MyD88, IRAK1/4, TRAF6) are hyperactivated, whereas inhibitory regulators are repressed [5]. Sustained TLR activation is damaging to HSCs and their niche [65] and excessive TLR4 signaling results in genotoxicity, possible carcinogenesis [37], and cell death (along with TLR2) [66,67]. Alarmins S100A8 and S100A9 are of particular importance in MDS, because—via autocrine and paracrine actions—they drive TLR4 activation, NLR family pyrin domain-containing protein 3 (NLRP3) inflammasome assembly, and microenvironmental immunosuppression [6]. Pyroptosis—a form of programmed cell death—being driven by NLRP3 inflammasome activation, is responsible for cellular death in MDS, being a point of convergence for cell-intrinsic, (e.g., gene mutations) and cell-extrinsic, (e.g., DAMPs) pathogenesis mechanisms [57]. The NLRP3-pyroptosis axis functioned independently of specific gene class mutations [57]; however, pyroptotic cell death observed in erythroid progenitors was proportional to mutational allelic burden and complexity [6]. The cytopenic phenotype of MDS is further augmented by evidence of increased apoptotic signaling; activation of death receptor Fas–Fas ligand pathway through cytokine induction (like TNFa, IFN-γ), TNF receptor 1 and 2 (TNFR1 and 2) induced apoptosis and p38 mitogen-activated protein kinase (MAPK) apoptotic signalling [8].
2.1.3. Cytokines
Aberrancy in the cytokine network has been observed in MDS patients by several investigators [8,56,68], with increased levels of inflammatory cytokines, such as TNFa, IFN-γ, TGF-β, IL-6, and IL-8, indicating abnormal inflammatory signaling and myeloid differentiation [8]. Various cell types can secrete cytokines in MDS, such as myeloid-derived suppressor cells (MDSCs) and MDS-derived myeloid cells [5]. Cytokine pressure from chronic immune stimulation has toxic effects on normal HSCs and may provide an evolutionary edge in MDS clones, driving their expansion [56]. In a first-of-its-kind meta-analysis, Xin et al. showed an increased level of inflammatory cytokines implicated in MDS pathogenesis and a cytokine profile changing along with the natural history of the disease [69]. Low-risk disease and its pyroptotic/ inflammatory microenvironment are associated with elevated levels of inflammatory cytokines (TNFa, IL-6, IFN-γ) [70] and type 1 cytokines (IL-1β, IL-7, IL-8), whereas high-risk disease has increased immunosuppressive cytokines (like IL-10), reflecting tumor immune escape [71]. Moreover, a positive correlation can be made between cytokine expression, clinical outcomes [56], and cytogenetic features [68].
2.2. Defective Cellular Immune Responses Result in MDS Progression
Cellular immune response dysregulation is another important immunological mechanism driving MDS pathogenesis, as it closely interacts with the coexisting inflammatory microenvironment and seems to have distinct features in different disease states [7].
2.2.1. T-Lymphocytes in MDS
Low-risk MDS is characterized by increased numbers of cytotoxic (CD8+) T-cells and diminished counts of Tregs [72,73], contradicting the general finding of lymphopenia. The T-cell response of high-risk disease manifests itself with lower levels of CD8+ T-cells and higher numbers of Tregs [71,73].
CD8+ T-cells in low-risk MDS have the potential of suppressing both malignant and normal hematopoiesis in vitro, further augmenting cellular death in this disease state, because of the existence of epitopes on MDS HSCs that can activate cytotoxic T-cells [74]. In younger MDS patients, CD8+ autoreactivity seems to be correlated with reduced numbers of CD4+ helper T-cells [75]. Potential epitopes include Wilms tumor protein 1 (WT1), overexpressed in MDS with trisomy 8, cancer-testis antigen (CTA), proteinase 3, and MHC-I [8]. However, the impact of immunogenic neo-antigens is unexplored territory, with early studies pointing to the presence of a protective effect [7,76]. In high-risk MDS, failing immunosurveillance and anti-MDS function is the major characteristic of the adaptive immune response, possibly through immune checkpoint molecule upregulation [8], mainly cytotoxic T lymphocyte-associated protein 4 (CTLA4) and programmed cell death protein 1 (PD-1) [77]. MDS blasts in high-risk diseases overexpress PD-L1 in comparison to normal controls [78] and this can be further augmented by the effects of cytokines, such as TNF-a, and IFN-γ, which induce PD-1 and PD-L1 expression, on T-cells and MDS cells, respectively [79]. Interestingly, Sand et al. reported increased numbers of BM cytotoxic T-cells; however, they were accompanied by dysfunctional T-cell receptor (TCR) cytotoxicity [80].
Regarding helper T cells (Th); Th1/Th2 ratio imbalance might reflect CD4/CD8 imbalance [81]. Shao et al. reported no difference in Th1 in MDS patients and healthy controls, as well as between low versus high-risk diseases. Moreover, Th17 numbers were increased in MDS patients, with greater expansion in low-risk disease, denoting the auto-reactive, possible anti-tumor nature of the process [82,83], whereas Th22 cells were increased in high-risk disease, correlating with increased IL-6 and TNF-a [82].
Tregs are a subset of helper T-cells tasked with immune response modulation and immune tolerance [8]. As a result, reduced Treg functionality is associated with autoimmunity and increased Treg function with cancer cell immune evasion [84]. This is evident in low versus high disease states, where in low-risk disease, patients had diminished Treg numbers and function, in contrast to high-risk disease; increased Treg population and functionality, along with MDS clone expansion [81,85,86].
Apropos of the MDS mutational landscape, the presence of MDS founder mutations on the lymphoid lineage may lead to defective immune responses [7]. Furthermore, the TP53 mutated subset of MDS was associated with increased PD-L1 expression on MDS/secondary AML specimens, as well as ICOS High/PD-1neg Treg expansion, leading to an immunosuppressive microenvironment [87].
2.2.2. Dendritic Cells in MDS
Dendritic cells are essential for tumor recognition, antigen presentation [88], and T-cell activation [89]. In MDS, dendritic cells have reduced T-cell activation potential and maturation defects—possibly stemming from the malignant clone [90]—along with a different cytokine profile between immature and mature monocytic dendritic cells (high IL-10 and low IL-12) [91]. Moreover, the high-risk disease has been shown to have reduced numbers of myeloid and plasmacytoid precursor dendritic cells [92].
2.2.3. Natural Killer Cells in MDS
Natural killer cells (NK cells) are a lymphoid subset of innate immunity and their aberration in MDS represents another aspect of defective immune surveillance. Studies have shown low NK cell numbers and impaired NK cell performance [93,94]. Cytotoxic impairment was especially evident in high-risk MDS, which correlated with advanced disease burden (excess blasts, high IPSS score, cytogenetics) [95,96]. Shared genetic lesions with the malignant clone and NK populations might explain an intrinsic defect in the functionality of NK cells [97].
2.2.4. Myeloid-Derived Suppressor Cells in MDS
Myeloid-derived suppressor cells (MDSCs) are a heterogeneous population of the myeloid lineage, which expand in pathological conditions such as cancer [98]. They have the ability to suppress non-myeloid immune cell activity, such as T-cell, B-cell, and NK-cells [99,100] and modulate macrophage cytokine production [101]. They can also assist Treg expansion through IL-10 and TGF-β secretion [102]. In MDS, high counts of MDSCs were reported in the BM [103] and peripheral blood of patients [104]. MDSC expansion can be induced by a number of pro-inflammatory cytokines such as IL-6, IL-10, IL-1β, and IFN-γ [102]. Alarmin S100A9 seems to drive MDSC expansion in MDS [103]. Moreover, concomitant age-related myeloid skewing, senescence, and “inflammaging” are involved in age-related MDSC increase [100,105]. In high-risk diseases, Kittang et al. [106] showed MDSC and Treg associated expansion, assisting in immune evasion and cancer progression. MDSCs also play a role in ineffective hematopoiesis [103]. Interestingly, MDSCs in MDS patients seem to evolve from a non-MDS clone, as they did not harbor the same mutations [103].
2.2.5. Macrophages in MDS
Macrophages come from monocytic differentiation and exhibit a diverse set of biological roles [107]. Defective macrophage function may result from reduced CD206 and signal regulatory protein alpha (SIRPa) expression, as well as increased inducible nitric oxide synthase (iNOS), which aids cancer progression through NO production [108]. INOS+ macrophages were associated with low-risk disease [109]. Macrophages are divided into M1 and M2 subtypes, with M1 having antitumor effects [110]. M2 subtype, but not M1 expansion was observed in MDS, suggesting a further reduced antitumor effect [111].
2.2.6. Mesenchymal Stem Cells in MDS
MSCs are an essential non-hematopoietic subset for hematopoiesis. Although inconclusive, MSCs might have a role in MDS initiation and maintenance, through pro-inflammatory signaling contributing to immune suppression and mutagenesis [7,8]. MSCs exhibit an age-related wane in functionality [112]. This is accompanied by the fact that MDS/AML-derived MSCs have functional deficits, as well as chromosomal aberrations different from the malignant clone [7]. Meydouf et al. elegantly showed the influence of MDS HSCs on their microenvironment with their ability to induce gene expression changes in healthy MSCs giving them an MDS-like phenotype [113]. MDS-MSCs produce factors such as S100A8/9 and immunomodulators that enable MDS clone expansion [114,115,116]. Interestingly, MSCs seem to exhibit different characteristics between risk groups [8]. Low-risk disease MSCs showed reduced DC maturation and differentiation efficiency, whereas high-risk disease MSCs demonstrated immunosuppressive properties, higher TGF-β production, apoptosis, and Treg induction [117,118].
3. Immune Evasion in Acute Myeloid Leukemia
From an immunological perspective, AML blasts and leukemic stem cells (LSCs) recruit several intrinsic and extrinsic immune evasion mechanisms, that along with an assisting BM microenvironment remodeling drive disease progression (Figure 2).
3.1. Cell Intrinsic Factors in AML
Intrinsic characteristics of the heterogenous AML population form the foundation of the defective immune response [11]. The mutational landscape of AML is characterized by an average of 13 mutations in coding genes per patient, with 5 genes being recurrently mutated [119]. Genetic stratification systems assess the impact of these recurrent mutations on survival [120]; however, the reciprocity between genetic lesions and the immune dysregulation of AML is less characterized (reviewed in [121]). Herein we present the immunological consequences of the commonest mutations. Evidence suggests that nucleophosmin1 (NPM1) mutations, mostly associated with favorable prognosis, have the potential to elicit T-cell responses [121]. Fms-like tyrosine kinase 3 (FLT3) mutations, i.e., internal tandem duplication (ITD) and tyrosine kinase domain (TKD) have been correlated with immune response alterations in AML [121]. Clinical studies have shown that ITD was associated with high populations of DCs, pre-DCs, and Tregs [122]. Moreover, immunological extensions of FLT3 inhibitor therapy have been reported [123]. The effects of mutant IDH1/2 and the oncometabolite R-2-hydroxyglutarate (R2-HG) on the immune system have been studied in gliomas extensively, with evidence of T-cell suppression and reduced innate immune system function [121]. In the setting of AML, R-2-HG was associated with Treg development [39]. In addition to functioning as the guardian of the genome, TP-53 may have tumor-suppressing properties stemming from the regulation of immune responses, and p53 mutations may reduce immunosurveillance and create a cancer-promoting immunosuppressing microenvironment [121] (in parallel with MDS [87]).
Immunoediting properties of leukemic blasts, such as downregulation of mismatched HLAs in AML blasts [124,125,126] and epigenetic downregulation of class II HLAs [127,128], have been observed in the context of alloHSCT (different donor settings). This gives a fitness advantage in AML blasts and contributes to Graft versus Leukemia (GvL) evasion and post-HSCT relapse [129]. Impaired antigen presentation via HLA class II may also play a role in immune evasion [130]. Moreover, immunosuppressive class I molecule HLA-G may contribute to the immunosuppressive microenvironment through DC, T-cell, NK cell, and monocyte inhibition [129]; however, these findings are not solid [131].
As described in the above section, NLRP3 inflammasome activation is central in the pathophysiology of MDS. On the contrary, the role of NLRP3 inflammasome in the pathogenesis of AML is not well documented. Zhong et al. showed that AML cells overexpressed NLRP3 inflammasome components and the NRLP3 inflammasome assisted in AML propagation in an IL-1β dependent manner [132]. The same authors also demonstrated immunological implications of the NLRP3 inflammasome, which is associated with an aryl-hydrocarbon receptor (AHR) contributed to AML T helper cell abnormalities [133].
Immune checkpoint molecules and secretion of factors with immunomodulating capacities will be presented in later sections.
3.2. Cytokines in AML
Cytokine network aberrations have been reported mainly in primary AML and dysregulation between pro-inflammatory and anti-inflammatory cytokines provides a fertile tumor-promoting microenvironment [134]. Regarding pro-inflammatory cytokines, IL-1β is the premier cytokine studied in AML and is known to assist in AML cell growth [134]. IL-6 and TNF-a are also implicated in leukemic growth, survival, and drug resistance [134]. IFN-γ effects on AML cells maybe be determined by the microenvironmental cytokine network [135]. IL-2 produces two-sided effects by supporting lymphocyte function, however, also promotes Treg expansion and therefore immunosuppression [129]. On the other hand, TGF-β was shown to inhibit AML growth [136] and lower levels of TGF-β were found in AML patients [137,138] indicating that diminished TGF-β effects promote AML survival [134]. IL-10 may impede AML cell growth [134] and has been shown to be elevated in AML patients [138]; however, its impact on survival is unclear [138,139] and may also depend on the local cytokine/ cellular microenvironment [134]. Interestingly, anti-inflammatory cytokine IL-35 is elevated in AML and correlated with Treg expansion (IL-35 is secreted primarily by Tregs), as well as CD4+ and CD8+ inhibition [134].
3.3. Metabolic, Soluble, and Vascular Factors with Immunological Significance in AML
In addition to cytokines, several soluble factors and metabolites contribute to the immunosuppressive microenvironment of AML. AML blasts, MSCs and MDSCs have the capacity of secreting indoleamine 2,3- dioxygenase 1 (IDO1) [140]. IDO1 (a catabolic enzyme of tryptophan metabolism) activity leads to local tryptophan depletion and accumulation of noxious tryptophan metabolites, resulting in Treg expansion and effector T-cell inhibition and apoptosis [140,141], as well as dismal prognosis [142]. Increased arginase II levels associate with inhibition of T-cells and hematopoietic progenitors and macrophage skewing towards M2-phenotype [143]. In addition, iNOS upregulation by AML cells is also associated with suppressed T-cell proliferation and NKT cell numbers, along with increased Tregs [144].
Evidence suggests that AML-induced metabolic remodeling, inhibitory molecule production, (e.g., ROS), and competition for nutrients are associated with immune suppression [145]. MSCs are skewed towards adipocyte differentiation in AML and directly provide metabolic support to AML blasts [146] by enhancing fatty acid oxidation [147,148]. Fatty acids and FAO impede T-cell effector functions and aid in Treg and M2 macrophage generation [149]. MSCs also assist in AML OXPHOS through mitochondrial transfer mediated by AML NOX2 activity [150]. High amounts of ROS generated by NOX and OXPHOS activity [151] assist in T and NK cell suppression via PARP-1 dependent apoptosis [152].
Abnormal remodeling of the vascular component in the AML niche translates into further immune dysregulation [140]. Firstly, poor BM perfusion and hypoxia result in T and NK cell suppression through adenosine [153]. High extracellular amounts of ATP in AML lead to adenosine production through CD73 and CD39 enzymes on AML cells, Tregs, and MDSCs [154]. NO-mediated vascular remodeling promotes the hypoxic niche [155]. Moreover, vascular remodeling obstructs T-cell trafficking [140] and impaired immune cell adhesion to the endothelium has been reported, due to elevated E-selectin [156].
3.4. Cellular Immune Response Dysregulation
3.4.1. T-Cells in AML
No consensus has been made regarding T-cell distribution and function in AML, possibly because of disease and patient heterogeneity along with different approaches in T-cell investigation [157]. Le Dieu et al. reported increased numbers of circulating T-lymphocytes in AML patients (in contrast to healthy controls), with a marked increase in a less clonal CD8+ population compared to CD4+ T-cells. Interestingly, BM T-cells were comparable between the two groups [158]. Increased CD8+ T-cells have also been reported by other groups [159]. Moreover, the T-cell activation signature was also elevated [158]. However, some studies demonstrated no increase in lymphocyte numbers between AML and controls but exhibited reduced CD4/CD8 ratios [160,161]. Nevertheless, higher BM lymphocytes with predominant T-cells were associated with superior OS [162] and strong lymphocytic increase post chemotherapy with decreased relapse risk [163].
Data suggest that T-cell dysfunction/exhaustion is present at diagnosis and T-cell functional status may be in a dynamic relationship with disease phase and treatment [157]. Le Dieu et al. showed that AML T-cells had different transcription profiles compared to controls, with some distinctively expressed genes contributing to cytoskeleton formation [158]. Subsequently, they showed an in vitro T-cell impairment in immune synapse formation [158]. A significant immune evasion mechanism is the expression of immune checkpoint ligands by leukemic blasts [128,164]. Human studies also demonstrated that T-cells from AML (co-) expressed higher levels of immune checkpoint molecules (PD-1 and TIM3, PD-1 and LAG3) compared to controls and their expression frequency increased with disease progression [165]. PD-L1 levels on AML cells were wide-ranging across different studies (from 18% to more than 50%) and PD-L1 expression was associated with acute monocytic leukemia and correlated with dismal prognosis [10]. TIM3 and its ligand galectin-9 (expressed on AML cells) induce β-catenin and NF-κB mediated self-renewal and NK-/T-cell suppression [166]. Furthermore, elevated mRNA levels of CTLA4 and LAG3 were found in T-cells correlating with inferior prognosis [167]. Similarly, several studies have shown that immune checkpoint expression in CD8+ is associated with T-cell dysfunction and leukemia relapse [10]. A study by Schnorfeil et al. demonstrated that cytokine production and proliferation of T-cells from AML patients with different diseases are unimpaired (in addition to reduced CD4+ IFN-γ production), with PD-1 overexpression representing differentiated effector T-cells, not exhaustion [168]. AML CD8+ T-cell cytokine production may not diverge from normal controls, even though exhausted subsets have been identified as stated [10]. Moreover, transcriptional signature reversibility of CD8+ cells in induction chemotherapy responders was demonstrated [165,169,170,171,172]. Remarkably, Radpour et al. suggested that in favorable-risk AML the BM CD8+ T-cells assisted in LSC expansion. Transcriptomic analysis of these CD8+ T-cells revealed epigenetic alterations affecting T-cell function [173]. On the contrary, high-risk disease LSC growth was a cell-intrinsic event and T-cell independent [173].
Regarding T helper cell function, Th1 cell numbers and functional capacity (IFN-γ production) may be decreased [168] with Th17 increase along with elevated IL-17 secretion associated with diminished Th1 and IFN-γ levels [108,174].
Treg numbers and function might be upregulated, as shown by several studies. In one study, peripheral and BM Tregs were increased compared to controls and BM Tregs exhibited higher immunosuppressive capabilities than their peripheral counterparts [175]. AML blasts that express inducible T-cell-co- stimulator ligand (ICOSL), promote Treg proliferation that contributes to disease maintenance via IL-10 secretion [176]. Furthermore, CXCL12/ CXCR4 may be crucial for Treg accumulation in the BM [177]. Variable levels of Tregs during treatment have been demonstrated [178,179]. Murine models and clinical studies have shown higher Treg levels at diagnosis contribute to disease propagation and inferior outcomes [175]. Contradictive results were demonstrated by a retrospective study; higher Tregs levels during lymphocytic recovery after induction were associated with improved response and survival [180].
3.4.2. Dendritic Cells in AML
A study in AML patients by Derolf et al. demonstrated that DCs were diminished or even absent in AML BM at diagnosis compared to control, with DC regeneration observed in CR patients (even though plasmacytoid dendritic cells (pDC) were still reduced) [181]. The authors found no correlation between DC levels and survival [181]. Xiao et al. showed a significant reduction of plasmacytoid dendritic cells (pDC) in AML patients, as well as blast: pDC ratio correlated with positive measurable residual disease and poor outcome [182]. On the contrary, elevated DC proportions of peripheral blood mononuclear cells have been reported accompanied by immunosuppressive characteristics [122], an effect reversed with a TLR7/8 agonist [183,184]. Additionally, tissue forming-pDC (TF-pDCs) positive patients had inferior prognosis [185].
3.4.3. NK Cells in AML
NK cell impairment in AML further contributes to the immune-evasive nature of the disease. Experimental studies have shown that TGF-β and IL-10 impede NK activity [186]. Tregs are capable of inhibiting NK activity through a TGF-β mediated mechanism [187]. NK dysfunction in AML-derived NK cells is a result of poor expression of natural cytotoxic receptors (NCR) [188]. The functional and phenotypic alterations of NK cells were reversible in patients who achieved remission, in contrast to treatment non-responders [189]. Moreover, the activating receptor NKG2D is poorly expressed in AML [186,190,191]. AML cells downregulated NCR-ligand expression leading to NK cytotoxicity evasion [188], with epigenetic mechanisms contributing to this [188,192,193,194].AML blasts can also avoid NK-mediated cell-lysis through weakened perforin binding [195].
3.4.4. MDSCs in AML
Similarly, MDSCs in AML are an important medium in T- and NK- cell immunosuppression. MDSC numbers in AML patients are elevated in BM and PB, with MDSC increase correlating with MRD positivity [196]. MDSC proliferation can be induced by AML blasts themselves, via oncoprotein MUC1 containing extracellular vesicle production (EV). MUC1 increases cMYC expression in EVs resulting in MDSC growth [196]. The Akt/mTOR pathway is also implicated in the AML-EV mediated transition of monocytes to MDSCs [197]. MDSC suppressing mechanisms include V-domain Ig suppressor of T-cell activation (VISTA), PD-L1, IDO1, TGF-β, IL-10, ROS, peroxynitrite, PGE2, and exosomes [198].
3.4.5. Macrophages in AML
Macrophages demonstrate endogenous plasticity capable of driving cell polarization under tissue-specific conditions [199] and in AML leukemia blasts have the ability to reprogram macrophages towards leukemia promoting the M2 phenotype [199]. AML blasts can induce M2 polarization via arginase II production [143,200]. Furthermore, higher numbers of M2-like macrophages were found in AML patients’ BM compared to controls and AML cells could induce an M2-like phenotype, possibly through dependence on transcription factor Gfi-1 [201]. Epigenetic and miRNA contributors may also be involved in M1 polarization impairment [200].
3.4.6. MSCs in AML
AML-derived MSCs show higher immunosuppressive behavior like lymphocyte suppression and reduced proinflammatory cytokine production, compared to normal controls [139]. MSCs in AML diagnosis demonstrate higher VEGFA, CXCL12, PGE2, IDO1, IL-1β, IL-6, and IL-32, with reduced IL-10 compared to MSCs in AML relapse [116]. AML patient-derived MSCs exhibit Treg induction and IDO1 upregulation abilities [202]. Moreover, MSCs protected AML blasts from NK killing in co-culture systems [203], with TLR4 playing a role [204]. MSCs also inhibit NK expansion through IDO and PGE2 [204].
It should also be noted that the BM microenvironment assists in cancer resistance to chemotherapy via various different mechanisms (soluble factor-mediated or cell-adhesion mediated) from endothelial cells, MSCs, and osteoblasts [205]. Activated endothelial cells for example are important factors that drive leukemia relapse. AML-induced endothelial activations result in AML cell proliferation and cytarabine resistance [206]. Age-associated BM alterations have also been described in mice to affect young HSC engraftment and T-cell production when they were transplanted to old recipients compared to young [207].
4. Conclusions
Evidence suggests that the BM can participate in sophisticated immune responses since it harbors the appropriate immune cell types. The HSCs themselves have proper adaptation mechanisms to exogenous immune and inflammatory factors, which may become deleterious when sustained in time, leading to HSC malfunction, myeloid bias, and propagation of malignancies. MDS is a neoplastic disease, in which—as outlined above—chronic microenvironmental inflammatory signaling leads to neoplastic clone progression. Current studies indicate a dichotomy between low- and high-risk MDS immune milieu low-risk MDS manifests with an inflammatory cytopenic phenotype, whereas high-risk MDS clones take advantage of the suppression and reduction of various effector cell types and the upregulation of immunosuppressive cells. Similar to high-risk MDS, AML also recruits an inventory of mechanisms aimed at immune suppression and evasion of anti-leukemic cytotoxic cells. Of course, in reality, these diseases are much more complicated, as shown by Guo et al. who reported a highly heterogenous AML immune landscape with newly defined exotic immune cell subsets [208]. Our review only outlines the increasingly complex immunological landscape of these myeloid malignancies, provided by an ever-expanding number of studies. Nonetheless, the understanding of the immune dysregulation in MDS and AML will pave the way for the development of novel treatments that are so much needed for this patient population.
Author Contributions
Conceptualization, G.P.B.; writing—original draft preparation, G.P.B.; writing—review and editing, E.H.; visualization, G.P.B..; E.H.; supervision, E.H.; All authors have read and agreed to the published version of the manuscript.
Funding
This research received no external funding.
Institutional Review Board Statement
Not applicable.
Informed Consent Statement
Not applicable.
Data Availability Statement
Not applicable.
Conflicts of Interest
The authors declare no conflict of interest.
References
- Sezaki, M.; Hayashi, Y.; Wang, Y.; Johansson, A.; Umemoto, T.; Takizawa, H. Immuno-Modulation of Hematopoietic Stem and Progenitor Cells in Inflammation. Front. Immunol. 2020, 11, 585367. [Google Scholar] [CrossRef]
- Mercier, F.E.; Ragu, C.; Scadden, D.T. The bone marrow at the crossroads of blood and immunity. Nat. Rev. Immunol. 2011, 12, 49–60. [Google Scholar] [CrossRef] [PubMed]
- Man, Y.; Yao, X.; Yang, T.; Wang, Y. Hematopoietic Stem Cell Niche During Homeostasis, Malignancy, and Bone Marrow Transplantation. Front. Cell Dev. Biol. 2021, 9, 621214. [Google Scholar] [CrossRef] [PubMed]
- Cazzola, M. Myelodysplastic Syndromes. N. Engl. J. Med. 2020, 383, 1358–1374. [Google Scholar] [CrossRef] [PubMed]
- Barreyro, L.; Chlon, T.M.; Starczynowski, D.T. Chronic immune response dysregulation in MDS pathogenesis. Blood 2018, 132, 1553–1560. [Google Scholar] [CrossRef] [Green Version]
- Sallman, D.A.; List, A. The central role of inflammatory signaling in the pathogenesis of myelodysplastic syndromes. Blood 2019, 133, 1039–1048. [Google Scholar] [CrossRef] [Green Version]
- Winter, S.; Shoaie, S.; Kordasti, S.; Platzbecker, U. Integrating the “Immunome“ in the Stratification of Myelodysplastic Syndromes and Future Clinical Trial Design. J. Clin. Oncol. 2020, 38, 1723–1735. [Google Scholar] [CrossRef]
- Wang, C.; Yang, Y.; Gao, S.; Chen, J.; Yu, J.; Zhang, H.; Li, M.; Zhan, X.; Li, W. Immune dysregulation in myelodysplastic syndrome: Clinical features, pathogenesis and therapeutic strategies. Crit. Rev. Oncol. Hematol. 2018, 122, 123–132. [Google Scholar] [CrossRef]
- Dohner, H.; Weisdorf, D.J.; Bloomfield, C.D. Acute Myeloid Leukemia. N. Engl. J. Med. 2015, 373, 1136–1152. [Google Scholar] [CrossRef] [Green Version]
- Vago, L.; Gojo, I. Immune escape and immunotherapy of acute myeloid leukemia. J. Clin. Investig. 2020, 130, 1552–1564. [Google Scholar] [CrossRef]
- Khaldoyanidi, S.; Nagorsen, D.; Stein, A.; Ossenkoppele, G.; Subklewe, M. Immune Biology of Acute Myeloid Leukemia: Implications for Immunotherapy. J. Clin. Oncol. 2021, 39, 419–432. [Google Scholar] [CrossRef] [PubMed]
- Slamanig, S.A.; Nolte, M.A. The Bone Marrow as Sanctuary for Plasma Cells and Memory T-Cells: Implications for Adaptive Immunity and Vaccinology. Cells 2021, 10, 1508. [Google Scholar] [CrossRef] [PubMed]
- Chang, H.D.; Tokoyoda, K.; Radbruch, A. Immunological memories of the bone marrow. Immunol. Rev. 2018, 283, 86–98. [Google Scholar] [CrossRef]
- Boyer, S.W.; Schroeder, A.V.; Smith-Berdan, S.; Forsberg, E.C. All hematopoietic cells develop from hematopoietic stem cells through Flk2/Flt3-positive progenitor cells. Cell Stem Cell 2011, 9, 64–73. [Google Scholar] [CrossRef] [PubMed] [Green Version]
- Galan-Diez, M.; Cuesta-Dominguez, A.; Kousteni, S. The Bone Marrow Microenvironment in Health and Myeloid Malignancy. Cold Spring Harb. Perspect. Med. 2018, 8, a031328. [Google Scholar] [CrossRef] [PubMed]
- Beerman, I.; Bhattacharya, D.; Zandi, S.; Sigvardsson, M.; Weissman, I.L.; Bryder, D.; Rossi, D.J. Functionally distinct hematopoietic stem cells modulate hematopoietic lineage potential during aging by a mechanism of clonal expansion. Proc. Natl. Acad. Sci. USA 2010, 107, 5465–5470. [Google Scholar] [CrossRef] [Green Version]
- Wei, Q.; Frenette, P.S. Niches for Hematopoietic Stem Cells and Their Progeny. Immunity 2018, 48, 632–648. [Google Scholar] [CrossRef] [Green Version]
- Sapoznikov, A.; Pewzner-Jung, Y.; Kalchenko, V.; Krauthgamer, R.; Shachar, I.; Jung, S. Perivascular clusters of dendritic cells provide critical survival signals to B cells in bone marrow niches. Nat. Immunol. 2008, 9, 388–395. [Google Scholar] [CrossRef]
- Feuerer, M.; Beckhove, P.; Garbi, N.; Mahnke, Y.; Limmer, A.; Hommel, M.; Hammerling, G.J.; Kyewski, B.; Hamann, A.; Umansky, V.; et al. Bone marrow as a priming site for T-cell responses to blood-borne antigen. Nat. Med. 2003, 9, 1151–1157. [Google Scholar] [CrossRef]
- Di Rosa, F.; Gebhardt, T. Bone Marrow T Cells and the Integrated Functions of Recirculating and Tissue-Resident Memory T Cells. Front. Immunol. 2016, 7, 51. [Google Scholar] [CrossRef] [Green Version]
- Pierini, A.; Nishikii, H.; Baker, J.; Kimura, T.; Kwon, H.S.; Pan, Y.; Chen, Y.; Alvarez, M.; Strober, W.; Velardi, A.; et al. Foxp3(+) regulatory T cells maintain the bone marrow microenvironment for B cell lymphopoiesis. Nat. Commun. 2017, 8, 15068. [Google Scholar] [CrossRef] [PubMed] [Green Version]
- Baldridge, M.T.; King, K.Y.; Boles, N.C.; Weksberg, D.C.; Goodell, M.A. Quiescent haematopoietic stem cells are activated by IFN-gamma in response to chronic infection. Nature 2010, 465, 793–797. [Google Scholar] [CrossRef] [PubMed]
- de Bruin, A.M.; Demirel, O.; Hooibrink, B.; Brandts, C.H.; Nolte, M.A. Interferon-gamma impairs proliferation of hematopoietic stem cells in mice. Blood 2013, 121, 3578–3585. [Google Scholar] [CrossRef] [PubMed] [Green Version]
- Yamashita, M.; Passegue, E. TNF-alpha Coordinates Hematopoietic Stem Cell Survival and Myeloid Regeneration. Cell Stem Cell 2019, 25, 357–372.e7. [Google Scholar] [CrossRef] [Green Version]
- Benson, M.J.; Dillon, S.R.; Castigli, E.; Geha, R.S.; Xu, S.; Lam, K.P.; Noelle, R.J. Cutting edge: The dependence of plasma cells and independence of memory B cells on BAFF and APRIL. J. Immunol. 2008, 180, 3655–3659. [Google Scholar] [CrossRef] [Green Version]
- O’Connor, B.P.; Raman, V.S.; Erickson, L.D.; Cook, W.J.; Weaver, L.K.; Ahonen, C.; Lin, L.L.; Mantchev, G.T.; Bram, R.J.; Noelle, R.J. BCMA is essential for the survival of long-lived bone marrow plasma cells. J. Exp. Med. 2004, 199, 91–98. [Google Scholar] [CrossRef]
- Nguyen, D.C.; Joyner, C.J.; Sanz, I.; Lee, F.E. Factors Affecting Early Antibody Secreting Cell Maturation Into Long-Lived Plasma Cells. Front. Immunol. 2019, 10, 2138. [Google Scholar] [CrossRef]
- Tripp, R.A.; Topham, D.J.; Watson, S.R.; Doherty, P.C. Bone marrow can function as a lymphoid organ during a primary immune response under conditions of disrupted lymphocyte trafficking. J. Immunol. 1997, 158, 3716–3720. [Google Scholar]
- Di Rosa, F.; Pabst, R. The bone marrow: A nest for migratory memory T cells. Trends Immunol. 2005, 26, 360–366. [Google Scholar] [CrossRef]
- Siracusa, F.; Durek, P.; McGrath, M.A.; Sercan-Alp, O.; Rao, A.; Du, W.; Cendon, C.; Chang, H.D.; Heinz, G.A.; Mashreghi, M.F.; et al. CD69(+) memory T lymphocytes of the bone marrow and spleen express the signature transcripts of tissue-resident memory T lymphocytes. Eur. J. Immunol. 2019, 49, 966–968. [Google Scholar] [CrossRef] [Green Version]
- Zhao, E.; Xu, H.; Wang, L.; Kryczek, I.; Wu, K.; Hu, Y.; Wang, G.; Zou, W. Bone marrow and the control of immunity. Cell Mol. Immunol. 2012, 9, 11–19. [Google Scholar] [CrossRef] [PubMed] [Green Version]
- Lucas, D. Structural organization of the bone marrow and its role in hematopoiesis. Curr. Opin. Hematol. 2021, 28, 36–42. [Google Scholar] [CrossRef] [PubMed]
- Herault, A.; Binnewies, M.; Leong, S.; Calero-Nieto, F.J.; Zhang, S.Y.; Kang, Y.A.; Wang, X.; Pietras, E.M.; Chu, S.H.; Barry-Holson, K.; et al. Myeloid progenitor cluster formation drives emergency and leukaemic myelopoiesis. Nature 2017, 544, 53–58. [Google Scholar] [CrossRef] [PubMed]
- Takizawa, H.; Boettcher, S.; Manz, M.G. Demand-adapted regulation of early hematopoiesis in infection and inflammation. Blood 2012, 119, 2991–3002. [Google Scholar] [CrossRef] [PubMed] [Green Version]
- Pietras, E.M. Inflammation: A key regulator of hematopoietic stem cell fate in health and disease. Blood 2017, 130, 1693–1698. [Google Scholar] [CrossRef] [Green Version]
- Clapes, T.; Lefkopoulos, S.; Trompouki, E. Stress and Non-Stress Roles of Inflammatory Signals during HSC Emergence and Maintenance. Front. Immunol. 2016, 7, 487. [Google Scholar] [CrossRef] [Green Version]
- Walter, D.; Lier, A.; Geiselhart, A.; Thalheimer, F.B.; Huntscha, S.; Sobotta, M.C.; Moehrle, B.; Brocks, D.; Bayindir, I.; Kaschutnig, P.; et al. Exit from dormancy provokes DNA-damage-induced attrition in haematopoietic stem cells. Nature 2015, 520, 549–552. [Google Scholar] [CrossRef]
- Nagai, Y.; Garrett, K.P.; Ohta, S.; Bahrun, U.; Kouro, T.; Akira, S.; Takatsu, K.; Kincade, P.W. Toll-like receptors on hematopoietic progenitor cells stimulate innate immune system replenishment. Immunity 2006, 24, 801–812. [Google Scholar] [CrossRef] [Green Version]
- Boettcher, S.; Ziegler, P.; Schmid, M.A.; Takizawa, H.; van Rooijen, N.; Kopf, M.; Heikenwalder, M.; Manz, M.G. Cutting edge: LPS-induced emergency myelopoiesis depends on TLR4-expressing nonhematopoietic cells. J. Immunol. 2012, 188, 5824–5828. [Google Scholar] [CrossRef]
- Burberry, A.; Zeng, M.Y.; Ding, L.; Wicks, I.; Inohara, N.; Morrison, S.J.; Nunez, G. Infection mobilizes hematopoietic stem cells through cooperative NOD-like receptor and Toll-like receptor signaling. Cell Host Microbe 2014, 15, 779–791. [Google Scholar] [CrossRef] [Green Version]
- Netea, M.G.; Joosten, L.A.; Latz, E.; Mills, K.H.; Natoli, G.; Stunnenberg, H.G.; O’Neill, L.A.; Xavier, R.J. Trained immunity: A program of innate immune memory in health and disease. Science 2016, 352, aaf1098. [Google Scholar] [CrossRef] [PubMed] [Green Version]
- Mitroulis, I.; Ruppova, K.; Wang, B.; Chen, L.S.; Grzybek, M.; Grinenko, T.; Eugster, A.; Troullinaki, M.; Palladini, A.; Kourtzelis, I.; et al. Modulation of Myelopoiesis Progenitors Is an Integral Component of Trained Immunity. Cell 2018, 172, 147–161.e12. [Google Scholar] [CrossRef] [PubMed] [Green Version]
- Shen, H.; Yu, H.; Liang, P.H.; Cheng, H.; XuFeng, R.; Yuan, Y.; Zhang, P.; Smith, C.A.; Cheng, T. An acute negative bystander effect of gamma-irradiated recipients on transplanted hematopoietic stem cells. Blood 2012, 119, 3629–3637. [Google Scholar] [CrossRef]
- Ganuza, M.; McKinney-Freeman, S. Hematopoietic stem cells under pressure. Curr. Opin. Hematol. 2017, 24, 314–321. [Google Scholar] [CrossRef] [PubMed]
- Sasine, J.P.; Yeo, K.T.; Chute, J.P. Concise Review: Paracrine Functions of Vascular Niche Cells in Regulating Hematopoietic Stem Cell Fate. Stem Cells Transl. Med. 2017, 6, 482–489. [Google Scholar] [CrossRef] [PubMed] [Green Version]
- Lapidot, T.; Dar, A.; Kollet, O. How do stem cells find their way home? Blood 2005, 106, 1901–1910. [Google Scholar] [CrossRef] [Green Version]
- Spencer, J.A.; Ferraro, F.; Roussakis, E.; Klein, A.; Wu, J.; Runnels, J.M.; Zaher, W.; Mortensen, L.J.; Alt, C.; Turcotte, R.; et al. Direct measurement of local oxygen concentration in the bone marrow of live animals. Nature 2014, 508, 269–273. [Google Scholar] [CrossRef] [Green Version]
- Simsek, T.; Kocabas, F.; Zheng, J.; Deberardinis, R.J.; Mahmoud, A.I.; Olson, E.N.; Schneider, J.W.; Zhang, C.C.; Sadek, H.A. The distinct metabolic profile of hematopoietic stem cells reflects their location in a hypoxic niche. Cell Stem Cell 2010, 7, 380–390. [Google Scholar] [CrossRef] [Green Version]
- Takubo, K.; Nagamatsu, G.; Kobayashi, C.I.; Nakamura-Ishizu, A.; Kobayashi, H.; Ikeda, E.; Goda, N.; Rahimi, Y.; Johnson, R.S.; Soga, T.; et al. Regulation of glycolysis by Pdk functions as a metabolic checkpoint for cell cycle quiescence in hematopoietic stem cells. Cell Stem Cell 2013, 12, 49–61. [Google Scholar] [CrossRef] [Green Version]
- Seggewiss, R.; Einsele, H. Immune reconstitution after allogeneic transplantation and expanding options for immunomodulation: An update. Blood 2010, 115, 3861–3868. [Google Scholar] [CrossRef]
- Danby, R.; Rocha, V. Improving engraftment and immune reconstitution in umbilical cord blood transplantation. Front. Immunol. 2014, 5, 68. [Google Scholar] [CrossRef] [PubMed]
- Ogonek, J.; Kralj Juric, M.; Ghimire, S.; Varanasi, P.R.; Holler, E.; Greinix, H.; Weissinger, E. Immune Reconstitution after Allogeneic Hematopoietic Stem Cell Transplantation. Front. Immunol. 2016, 7, 507. [Google Scholar] [CrossRef] [PubMed] [Green Version]
- Dominietto, A.; Raiola, A.M.; Bruno, B.; van Lint, M.T.; Frassoni, F.; Grazia, C.D.; Gualandi, F.; Bregante, S.; Varaldo, R.; Ghiso, A.; et al. Rapid Immune Reconstitution Following Unmanipulated Haploidentical BMT with Post-Transplant High Dose Cyclophosphamide. Blood 2011, 118, 3050. [Google Scholar] [CrossRef]
- Chang, Y.J.; Zhao, X.Y.; Huang, X.J. Immune reconstitution after haploidentical hematopoietic stem cell transplantation. Biol. Blood Marrow Transplant. 2014, 20, 440–449. [Google Scholar] [CrossRef] [Green Version]
- Pfeilstocker, M.; Tuechler, H.; Sanz, G.; Schanz, J.; Garcia-Manero, G.; Sole, F.; Bennett, J.M.; Bowen, D.; Fenaux, P.; Dreyfus, F.; et al. Time-dependent changes in mortality and transformation risk in MDS. Blood 2016, 128, 902–910. [Google Scholar] [CrossRef] [Green Version]
- Matos, A.; Magalhaes, S.M.M.; Rauh, M.J. Immune Dysregulation and Recurring Mutations in Myelodysplastic Syndromes Pathogenesis. Adv. Exp. Med. Biol. 2021, 1326, 1–10. [Google Scholar] [CrossRef]
- Basiorka, A.A.; McGraw, K.L.; Eksioglu, E.A.; Chen, X.; Johnson, J.; Zhang, L.; Zhang, Q.; Irvine, B.A.; Cluzeau, T.; Sallman, D.A.; et al. The NLRP3 inflammasome functions as a driver of the myelodysplastic syndrome phenotype. Blood 2016, 128, 2960–2975. [Google Scholar] [CrossRef]
- Starczynowski, D.T.; Kuchenbauer, F.; Argiropoulos, B.; Sung, S.; Morin, R.; Muranyi, A.; Hirst, M.; Hogge, D.; Marra, M.; Wells, R.A.; et al. Identification of miR-145 and miR-146a as mediators of the 5q- syndrome phenotype. Nat. Med. 2010, 16, 49–58. [Google Scholar] [CrossRef]
- Varney, M.E.; Niederkorn, M.; Konno, H.; Matsumura, T.; Gohda, J.; Yoshida, N.; Akiyama, T.; Christie, S.; Fang, J.; Miller, D.; et al. Loss of Tifab, a del(5q) MDS gene, alters hematopoiesis through derepression of Toll-like receptor-TRAF6 signaling. J. Exp. Med. 2015, 212, 1967–1985. [Google Scholar] [CrossRef]
- Franceschi, C.; Garagnani, P.; Vitale, G.; Capri, M.; Salvioli, S. Inflammaging and ‘Garb-aging’. Trends Endocrinol. Metab. 2017, 28, 199–212. [Google Scholar] [CrossRef] [Green Version]
- Boraschi, D.; Aguado, M.T.; Dutel, C.; Goronzy, J.; Louis, J.; Grubeck-Loebenstein, B.; Rappuoli, R.; Del Giudice, G. The gracefully aging immune system. Sci. Transl. Med. 2013, 5, 185ps8. [Google Scholar] [CrossRef] [PubMed] [Green Version]
- Naismith, E.; Pangrazzi, L. The impact of oxidative stress, inflammation, and senescence on the maintenance of immunological memory in the bone marrow in old age. Biosci. Rep. 2019, 39, BSR20190371. [Google Scholar] [CrossRef] [PubMed]
- Hofmann, W.K.; de Vos, S.; Komor, M.; Hoelzer, D.; Wachsman, W.; Koeffler, H.P. Characterization of gene expression of CD34+ cells from normal and myelodysplastic bone marrow. Blood 2002, 100, 3553–3560. [Google Scholar] [CrossRef] [PubMed] [Green Version]
- Pellagatti, A.; Cazzola, M.; Giagounidis, A.; Perry, J.; Malcovati, L.; Della Porta, M.G.; Jadersten, M.; Killick, S.; Verma, A.; Norbury, C.J.; et al. Deregulated gene expression pathways in myelodysplastic syndrome hematopoietic stem cells. Leukemia 2010, 24, 756–764. [Google Scholar] [CrossRef] [Green Version]
- Esplin, B.L.; Shimazu, T.; Welner, R.S.; Garrett, K.P.; Nie, L.; Zhang, Q.; Humphrey, M.B.; Yang, Q.; Borghesi, L.A.; Kincade, P.W. Chronic exposure to a TLR ligand injures hematopoietic stem cells. J. Immunol. 2011, 186, 5367–5375. [Google Scholar] [CrossRef] [Green Version]
- Maratheftis, C.I.; Andreakos, E.; Moutsopoulos, H.M.; Voulgarelis, M. Toll-like receptor-4 is up-regulated in hematopoietic progenitor cells and contributes to increased apoptosis in myelodysplastic syndromes. Clin. Cancer Res. 2007, 13, 1154–1160. [Google Scholar] [CrossRef] [Green Version]
- Zeng, Q.; Shu, J.; Hu, Q.; Zhou, S.H.; Qian, Y.M.; Hu, M.H.; Hu, L.Y.; Wang, Y.G.; Zhou, Y.M.; Lu, J.H. Apoptosis in human myelodysplastic syndrome CD34+ cells is modulated by the upregulation of TLRs and histone H4 acetylation via a beta-arrestin 1 dependent mechanism. Exp. Cell Res. 2016, 340, 22–31. [Google Scholar] [CrossRef]
- Kornblau, S.M.; McCue, D.; Singh, N.; Chen, W.; Estrov, Z.; Coombes, K.R. Recurrent expression signatures of cytokines and chemokines are present and are independently prognostic in acute myelogenous leukemia and myelodysplasia. Blood 2010, 116, 4251–4261. [Google Scholar] [CrossRef] [Green Version]
- Shi, X.; Zheng, Y.; Xu, L.; Cao, C.; Dong, B.; Chen, X. The inflammatory cytokine profile of myelodysplastic syndromes: A meta-analysis. Medicine 2019, 98, e15844. [Google Scholar] [CrossRef]
- Shetty, V.; Mundle, S.; Alvi, S.; Showel, M.; Broady-Robinson, L.; Dar, S.; Borok, R.; Showel, J.; Gregory, S.; Rifkin, S.; et al. Measurement of apoptosis, proliferation and three cytokines in 46 patients with myelodysplastic syndromes. Leuk. Res. 1996, 20, 891–900. [Google Scholar] [CrossRef]
- Kordasti, S.Y.; Ingram, W.; Hayden, J.; Darling, D.; Barber, L.; Afzali, B.; Lombardi, G.; Wlodarski, M.W.; Maciejewski, J.P.; Farzaneh, F.; et al. CD4+CD25high Foxp3+ regulatory T cells in myelodysplastic syndrome (MDS). Blood 2007, 110, 847–850. [Google Scholar] [CrossRef] [PubMed] [Green Version]
- Fozza, C.; Contini, S.; Galleu, A.; Simula, M.P.; Virdis, P.; Bonfigli, S.; Longinotti, M. Patients with myelodysplastic syndromes display several T-cell expansions, which are mostly polyclonal in the CD4(+) subset and oligoclonal in the CD8(+) subset. Exp. Hematol. 2009, 37, 947–955. [Google Scholar] [CrossRef] [PubMed]
- Lopes, M.R.; Traina, F.; Campos Pde, M.; Pereira, J.K.; Machado-Neto, J.A.; Machado Hda, C.; Gilli, S.C.; Saad, S.T.; Favaro, P. IL10 inversely correlates with the percentage of CD8(+) cells in MDS patients. Leuk. Res. 2013, 37, 541–546. [Google Scholar] [CrossRef] [PubMed] [Green Version]
- Zheng, Z.; Qianqiao, Z.; Qi, H.; Feng, X.; Chunkang, C.; Xiao, L. In vitro deprivation of CD8(+)CD57(+)T cells promotes the malignant growth of bone marrow colony cells in patients with lower-risk myelodysplastic syndrome. Exp. Hematol. 2010, 38, 677–684. [Google Scholar] [CrossRef]
- Zou, J.X.; Rollison, D.E.; Boulware, D.; Chen, D.T.; Sloand, E.M.; Pfannes, L.V.; Goronzy, J.J.; Bai, F.; Painter, J.S.; Wei, S.; et al. Altered naive and memory CD4+ T-cell homeostasis and immunosenescence characterize younger patients with myelodysplastic syndrome. Leukemia 2009, 23, 1288–1296. [Google Scholar] [CrossRef] [PubMed] [Green Version]
- Coats, T.; Smith, A.E.; Mourikis, A.; Shahin, T.; Kulasekararaj, A.G.; Best, S.; Chitre, S.; Ellis, R.; Petrov, N.; Heck, S.; et al. Neoantigens in MDS Are Associated with Two Novel CD4+ T Cell Subsets and Improved Overall Survival. Blood 2017, 130, 2958. [Google Scholar] [CrossRef]
- Ok, C.Y.; Young, K.H. Checkpoint inhibitors in hematological malignancies. J. Hematol. Oncol. 2017, 10, 103. [Google Scholar] [CrossRef] [Green Version]
- Haroun, F.; Solola, S.A.; Nassereddine, S.; Tabbara, I. PD-1 signaling and inhibition in AML and MDS. Ann. Hematol. 2017, 96, 1441–1448. [Google Scholar] [CrossRef]
- Yang, H.; Bueso-Ramos, C.; DiNardo, C.; Estecio, M.R.; Davanlou, M.; Geng, Q.R.; Fang, Z.; Nguyen, M.; Pierce, S.; Wei, Y.; et al. Expression of PD-L1, PD-L2, PD-1 and CTLA4 in myelodysplastic syndromes is enhanced by treatment with hypomethylating agents. Leukemia 2014, 28, 1280–1288. [Google Scholar] [CrossRef]
- Sand, K.; Theorell, J.; Bruserud, O.; Bryceson, Y.T.; Kittang, A.O. Reduced potency of cytotoxic T lymphocytes from patients with high-risk myelodysplastic syndromes. Cancer Immunol. Immunother. 2016, 65, 1135–1147. [Google Scholar] [CrossRef]
- Hamdi, W.; Ogawara, H.; Handa, H.; Tsukamoto, N.; Murakami, H. Clinical significance of Th1/Th2 ratio in patients with myelodysplastic syndrome. Int. J. Lab. Hematol. 2009, 31, 630–638. [Google Scholar] [CrossRef] [PubMed]
- Shao, L.L.; Zhang, L.; Hou, Y.; Yu, S.; Liu, X.G.; Huang, X.Y.; Sun, Y.X.; Tian, T.; He, N.; Ma, D.X.; et al. Th22 cells as well as Th17 cells expand differentially in patients with early-stage and late-stage myelodysplastic syndrome. PLoS ONE 2012, 7, e51339. [Google Scholar] [CrossRef] [PubMed]
- Li, J.; Yue, L.; Wang, H.; Liu, C.; Liu, H.; Tao, J.; Qi, W.; Wang, Y.; Zhang, W.; Fu, R.; et al. Th17 Cells Exhibit Antitumor Effects in MDS Possibly through Augmenting Functions of CD8+ T Cells. J. Immunol. Res. 2016, 2016, 9404705. [Google Scholar] [CrossRef] [PubMed]
- Mailloux, A.W.; Young, M.R. Regulatory T-cell trafficking: From thymic development to tumor-induced immune suppression. Crit. Rev. Immunol. 2010, 30, 435–447. [Google Scholar] [CrossRef] [PubMed] [Green Version]
- Kotsianidis, I.; Bouchliou, I.; Nakou, E.; Spanoudakis, E.; Margaritis, D.; Christophoridou, A.V.; Anastasiades, A.; Tsigalou, C.; Bourikas, G.; Karadimitris, A.; et al. Kinetics, function and bone marrow trafficking of CD4+CD25+FOXP3+ regulatory T cells in myelodysplastic syndromes (MDS). Leukemia 2009, 23, 510–518. [Google Scholar] [CrossRef] [PubMed] [Green Version]
- Mailloux, A.W.; Sugimori, C.; Komrokji, R.S.; Yang, L.; Maciejewski, J.P.; Sekeres, M.A.; Paquette, R.; Loughran, T.P., Jr.; List, A.F.; Epling-Burnette, P.K. Expansion of effector memory regulatory T cells represents a novel prognostic factor in lower risk myelodysplastic syndrome. J. Immunol. 2012, 189, 3198–3208. [Google Scholar] [CrossRef] [Green Version]
- Sallman, D.A.; McLemore, A.F.; Aldrich, A.L.; Komrokji, R.S.; McGraw, K.L.; Dhawan, A.; Geyer, S.; Hou, H.A.; Eksioglu, E.A.; Sullivan, A.; et al. TP53 mutations in myelodysplastic syndromes and secondary AML confer an immunosuppressive phenotype. Blood 2020, 136, 2812–2823. [Google Scholar] [CrossRef]
- Banchereau, J.; Briere, F.; Caux, C.; Davoust, J.; Lebecque, S.; Liu, Y.J.; Pulendran, B.; Palucka, K. Immunobiology of dendritic cells. Annu. Rev. Immunol. 2000, 18, 767–811. [Google Scholar] [CrossRef]
- Kufner, S.; Fleischer, R.P.; Kroell, T.; Schmid, C.; Zitzelsberger, H.; Salih, H.; de Valle, F.; Treder, W.; Schmetzer, H.M. Serum-free generation and quantification of functionally active Leukemia-derived DC is possible from malignant blasts in acute myeloid leukemia and myelodysplastic syndromes. Cancer Immunol. Immunother. 2005, 54, 953–970. [Google Scholar] [CrossRef]
- Ma, L.; Delforge, M.; van Duppen, V.; Verhoef, G.; Emanuel, B.; Boogaerts, M.; Hagemeijer, A.; Vandenberghe, P. Circulating myeloid and lymphoid precursor dendritic cells are clonally involved in myelodysplastic syndromes. Leukemia 2004, 18, 1451–1456. [Google Scholar] [CrossRef] [Green Version]
- Ma, L.; Ceuppens, J.; Kasran, A.; Delforge, M.; Boogaerts, M.; Vandenberghe, P. Immature and mature monocyte-derived dendritic cells in myelodysplastic syndromes of subtypes refractory anemia or refractory anemia with ringed sideroblasts display an altered cytokine profile. Leuk. Res. 2007, 31, 1373–1382. [Google Scholar] [CrossRef] [PubMed]
- Saft, L.; Bjorklund, E.; Berg, E.; Hellstrom-Lindberg, E.; Porwit, A. Bone marrow dendritic cells are reduced in patients with high-risk myelodysplastic syndromes. Leuk. Res. 2013, 37, 266–273. [Google Scholar] [CrossRef] [PubMed]
- Hejazi, M.; Manser, A.R.; Frobel, J.; Kundgen, A.; Zhao, X.; Schonberg, K.; Germing, U.; Haas, R.; Gattermann, N.; Uhrberg, M. Impaired cytotoxicity associated with defective natural killer cell differentiation in myelodysplastic syndromes. Haematologica 2015, 100, 643–652. [Google Scholar] [CrossRef] [PubMed] [Green Version]
- Aggarwal, N.; Swerdlow, S.H.; TenEyck, S.P.; Boyiadzis, M.; Felgar, R.E. Natural killer cell (NK) subsets and NK-like T-cell populations in acute myeloid leukemias and myelodysplastic syndromes. Cytom. B Clin. Cytom. 2016, 90, 349–357. [Google Scholar] [CrossRef]
- Epling-Burnette, P.K.; Bai, F.; Painter, J.S.; Rollison, D.E.; Salih, H.R.; Krusch, M.; Zou, J.; Ku, E.; Zhong, B.; Boulware, D.; et al. Reduced natural killer (NK) function associated with high-risk myelodysplastic syndrome (MDS) and reduced expression of activating NK receptors. Blood 2007, 109, 4816–4824. [Google Scholar] [CrossRef]
- Zhang, W.; Xie, X.; Mi, H.; Sun, J.; Ding, S.; Li, L.; Liu, H.; Wang, H.; Fu, R.; Shao, Z. Abnormal populations and functions of natural killer cells in patients with myelodysplastic syndromes. Oncol. Lett. 2018, 15, 5497–5504. [Google Scholar] [CrossRef] [Green Version]
- Carlsten, M.; Jaras, M. Natural Killer Cells in Myeloid Malignancies: Immune Surveillance, NK Cell Dysfunction, and Pharmacological Opportunities to Bolster the Endogenous NK Cells. Front. Immunol. 2019, 10, 2357. [Google Scholar] [CrossRef] [Green Version]
- Marvel, D.; Gabrilovich, D.I. Myeloid-derived suppressor cells in the tumor microenvironment: Expect the unexpected. J. Clin. Investig. 2015, 125, 3356–3364. [Google Scholar] [CrossRef]
- Filipazzi, P.; Huber, V.; Rivoltini, L. Phenotype, function and clinical implications of myeloid-derived suppressor cells in cancer patients. Cancer Immunol. Immunother. 2012, 61, 255–263. [Google Scholar] [CrossRef]
- Salminen, A.; Kaarniranta, K.; Kauppinen, A. Immunosenescence: The potential role of myeloid-derived suppressor cells (MDSC) in age-related immune deficiency. Cell Mol. Life Sci. 2019, 76, 1901–1918. [Google Scholar] [CrossRef] [Green Version]
- Raza, A.; Galili, N. The genetic basis of phenotypic heterogeneity in myelodysplastic syndromes. Nat. Rev. Cancer 2012, 12, 849–859. [Google Scholar] [CrossRef] [PubMed]
- Gabrilovich, D.I.; Nagaraj, S. Myeloid-derived suppressor cells as regulators of the immune system. Nat. Rev. Immunol. 2009, 9, 162–174. [Google Scholar] [CrossRef] [PubMed]
- Chen, X.; Eksioglu, E.A.; Zhou, J.; Zhang, L.; Djeu, J.; Fortenbery, N.; Epling-Burnette, P.; Van Bijnen, S.; Dolstra, H.; Cannon, J.; et al. Induction of myelodysplasia by myeloid-derived suppressor cells. J. Clin. Investig. 2013, 123, 4595–4611. [Google Scholar] [CrossRef] [PubMed]
- Jiang, H.J.; Fu, R.; Wang, H.Q.; Li, L.J.; Qu, W.; Liang, Y.; Wang, G.J.; Wang, X.M.; Wu, Y.H.; Liu, H.; et al. Increased circulating of myeloid-derived suppressor cells in myelodysplastic syndrome. Chin. Med. J. 2013, 126, 2582–2584. [Google Scholar] [PubMed]
- Kirkwood, K.L.; Zhang, L.; Thiyagarajan, R.; Seldeen, K.L.; Troen, B.R. Myeloid-Derived Suppressor Cells at the Intersection of Inflammaging and Bone Fragility. Immunol. Invest. 2018, 47, 844–854. [Google Scholar] [CrossRef]
- Kittang, A.O.; Kordasti, S.; Sand, K.E.; Costantini, B.; Kramer, A.M.; Perezabellan, P.; Seidl, T.; Rye, K.P.; Hagen, K.M.; Kulasekararaj, A.; et al. Expansion of myeloid derived suppressor cells correlates with number of T regulatory cells and disease progression in myelodysplastic syndrome. Oncoimmunology 2016, 5, e1062208. [Google Scholar] [CrossRef] [Green Version]
- Wynn, T.A.; Chawla, A.; Pollard, J.W. Macrophage biology in development, homeostasis and disease. Nature 2013, 496, 445–455. [Google Scholar] [CrossRef]
- Han, Y.; Wang, H.; Shao, Z. Monocyte-Derived Macrophages Are Impaired in Myelodysplastic Syndrome. J. Immunol. Res. 2016, 2016, 5479013. [Google Scholar] [CrossRef]
- Yang, Y.; Wu, Y. The Clinical Significance of Tumor Associated Macrophages in Myelodysplastic Syndromes. Blood 2018, 132, 5505. [Google Scholar] [CrossRef]
- Sica, A.; Mantovani, A. Macrophage plasticity and polarization: In vivo veritas. J. Clin. Investig. 2012, 122, 787–795. [Google Scholar] [CrossRef]
- Zhang, G.; Yang, L.; Han, Y.; Niu, H.; Yan, L.; Shao, Z.; Xing, L.; Wang, H. Abnormal Macrophage Polarization in Patients with Myelodysplastic Syndrome. Mediat. Inflamm. 2021, 2021, 9913382. [Google Scholar] [CrossRef] [PubMed]
- Zhou, S.; Greenberger, J.S.; Epperly, M.W.; Goff, J.P.; Adler, C.; Leboff, M.S.; Glowacki, J. Age-related intrinsic changes in human bone-marrow-derived mesenchymal stem cells and their differentiation to osteoblasts. Aging Cell 2008, 7, 335–343. [Google Scholar] [CrossRef] [PubMed] [Green Version]
- Medyouf, H.; Mossner, M.; Jann, J.C.; Nolte, F.; Raffel, S.; Herrmann, C.; Lier, A.; Eisen, C.; Nowak, V.; Zens, B.; et al. Myelodysplastic cells in patients reprogram mesenchymal stromal cells to establish a transplantable stem cell niche disease unit. Cell Stem Cell 2014, 14, 824–837. [Google Scholar] [CrossRef] [PubMed] [Green Version]
- Zambetti, N.A.; Ping, Z.; Chen, S.; Kenswil, K.J.G.; Mylona, M.A.; Sanders, M.A.; Hoogenboezem, R.M.; Bindels, E.M.J.; Adisty, M.N.; Van Strien, P.M.H.; et al. Mesenchymal Inflammation Drives Genotoxic Stress in Hematopoietic Stem Cells and Predicts Disease Evolution in Human Pre-leukemia. Cell Stem Cell 2016, 19, 613–627. [Google Scholar] [CrossRef] [PubMed] [Green Version]
- Chen, S.; Zambetti, N.A.; Bindels, E.M.; Kenswill, K.; Mylona, A.M.; Adisty, N.M.; Hoogenboezem, R.M.; Sanders, M.A.; Cremers, E.M.; Westers, T.M.; et al. Massive parallel RNA sequencing of highly purified mesenchymal elements in low-risk MDS reveals tissue-context-dependent activation of inflammatory programs. Leukemia 2016, 30, 1938–1942. [Google Scholar] [CrossRef] [Green Version]
- Lopes, M.R.; Pereira, J.K.; de Melo Campos, P.; Machado-Neto, J.A.; Traina, F.; Saad, S.T.; Favaro, P. De novo AML exhibits greater microenvironment dysregulation compared to AML with myelodysplasia-related changes. Sci. Rep. 2017, 7, 40707. [Google Scholar] [CrossRef]
- Zhao, Z.; Wang, Z.; Li, Q.; Li, W.; You, Y.; Zou, P. The different immunoregulatory functions of mesenchymal stem cells in patients with low-risk or high-risk myelodysplastic syndromes. PLoS ONE 2012, 7, e45675. [Google Scholar] [CrossRef]
- Wang, Z.; Tang, X.; Xu, W.; Cao, Z.; Sun, L.; Li, W.; Li, Q.; Zou, P.; Zhao, Z. The different immunoregulatory functions on dendritic cells between mesenchymal stem cells derived from bone marrow of patients with low-risk or high-risk myelodysplastic syndromes. PLoS ONE 2013, 8, e57470. [Google Scholar] [CrossRef]
- Cancer Genome Atlas Research Network; Ley, T.J.; Miller, C.; Ding, L.; Raphael, B.J.; Mungall, A.J.; Robertson, A.; Hoadley, K.; Triche, T.J., Jr.; Laird, P.W.; et al. Genomic and epigenomic landscapes of adult de novo acute myeloid leukemia. N. Engl. J. Med. 2013, 368, 2059–2074. [Google Scholar] [CrossRef] [Green Version]
- Dohner, H.; Estey, E.; Grimwade, D.; Amadori, S.; Appelbaum, F.R.; Buchner, T.; Dombret, H.; Ebert, B.L.; Fenaux, P.; Larson, R.A.; et al. Diagnosis and management of AML in adults: 2017 ELN recommendations from an international expert panel. Blood 2017, 129, 424–447. [Google Scholar] [CrossRef] [Green Version]
- Mendez, L.M.; Posey, R.R.; Pandolfi, P.P. The Interplay Between the Genetic and Immune Landscapes of AML: Mechanisms and Implications for Risk Stratification and Therapy. Front. Oncol. 2019, 9, 1162. [Google Scholar] [CrossRef] [PubMed] [Green Version]
- Rickmann, M.; Krauter, J.; Stamer, K.; Heuser, M.; Salguero, G.; Mischak-Weissinger, E.; Ganser, A.; Stripecke, R. Elevated frequencies of leukemic myeloid and plasmacytoid dendritic cells in acute myeloid leukemia with the FLT3 internal tandem duplication. Ann. Hematol. 2011, 90, 1047–1058. [Google Scholar] [CrossRef] [PubMed] [Green Version]
- Gutierrez, L.; Jang, M.; Zhang, T.; Akhtari, M.; Alachkar, H. Midostaurin reduces Regulatory T cells markers in Acute Myeloid Leukemia. Sci. Rep. 2018, 8, 17544. [Google Scholar] [CrossRef] [PubMed]
- Vago, L.; Perna, S.K.; Zanussi, M.; Mazzi, B.; Barlassina, C.; Stanghellini, M.T.; Perrelli, N.F.; Cosentino, C.; Torri, F.; Angius, A.; et al. Loss of mismatched HLA in leukemia after stem-cell transplantation. N. Engl. J. Med. 2009, 361, 478–488. [Google Scholar] [CrossRef] [PubMed] [Green Version]
- Crucitti, L.; Crocchiolo, R.; Toffalori, C.; Mazzi, B.; Greco, R.; Signori, A.; Sizzano, F.; Chiesa, L.; Zino, E.; Lupo Stanghellini, M.T.; et al. Incidence, risk factors and clinical outcome of leukemia relapses with loss of the mismatched HLA after partially incompatible hematopoietic stem cell transplantation. Leukemia 2015, 29, 1143–1152. [Google Scholar] [CrossRef]
- McCurdy, S.R.; Iglehart, B.S.; Batista, D.A.; Gocke, C.D.; Ning, Y.; Knaus, H.A.; Jackson, A.M.; Leffell, M.S.; Luznik, L.; Gojo, I. Loss of the mismatched human leukocyte antigen haplotype in two acute myelogenous leukemia relapses after haploidentical bone marrow transplantation with post-transplantation cyclophosphamide. Leukemia 2016, 30, 2102–2106. [Google Scholar] [CrossRef] [Green Version]
- Christopher, M.J.; Petti, A.A.; Rettig, M.P.; Miller, C.A.; Chendamarai, E.; Duncavage, E.J.; Klco, J.M.; Helton, N.M.; O’Laughlin, M.; Fronick, C.C.; et al. Immune Escape of Relapsed AML Cells after Allogeneic Transplantation. N. Engl. J. Med. 2018, 379, 2330–2341. [Google Scholar] [CrossRef]
- Toffalori, C.; Zito, L.; Gambacorta, V.; Riba, M.; Oliveira, G.; Bucci, G.; Barcella, M.; Spinelli, O.; Greco, R.; Crucitti, L.; et al. Immune signature drives leukemia escape and relapse after hematopoietic cell transplantation. Nat. Med. 2019, 25, 603–611. [Google Scholar] [CrossRef]
- Sendker, S.; Reinhardt, D.; Niktoreh, N. Redirecting the Immune Microenvironment in Acute Myeloid Leukemia. Cancers 2021, 13, 1423. [Google Scholar] [CrossRef]
- van Luijn, M.M.; van den Ancker, W.; Chamuleau, M.E.; Ossenkoppele, G.J.; van Ham, S.M.; van de Loosdrecht, A.A. Impaired antigen presentation in neoplasia: Basic mechanisms and implications for acute myeloid leukemia. Immunotherapy 2010, 2, 85–97. [Google Scholar] [CrossRef]
- Guo, Q.Y.; Chen, B.G.; Ruan, Y.Y.; Lin, A.; Yan, W.H. HLA-G expression is irrelevant to prognosis in patients with acute myeloid leukemia. Leuk. Res. 2011, 35, 1350–1354. [Google Scholar] [CrossRef] [PubMed]
- Zhong, C.; Wang, R.; Hua, M.; Zhang, C.; Han, F.; Xu, M.; Yang, X.; Li, G.; Hu, X.; Sun, T.; et al. NLRP3 Inflammasome Promotes the Progression of Acute Myeloid Leukemia via IL-1beta Pathway. Front. Immunol. 2021, 12, 661939. [Google Scholar] [CrossRef]
- Jia, Y.; Zhang, C.; Hua, M.; Wang, M.; Chen, P.; Ma, D. Aberrant NLRP3 inflammasome associated with aryl hydrocarbon receptor potentially contributes to the imbalance of T-helper cells in patients with acute myeloid leukemia. Oncol. Lett. 2017, 14, 7031–7044. [Google Scholar] [CrossRef] [PubMed] [Green Version]
- Binder, S.; Luciano, M.; Horejs-Hoeck, J. The cytokine network in acute myeloid leukemia (AML): A focus on pro- and anti-inflammatory mediators. Cytokine Growth Factor Rev. 2018, 43, 8–15. [Google Scholar] [CrossRef] [PubMed]
- Ersvaer, E.; Skavland, J.; Ulvestad, E.; Gjertsen, B.T.; Bruserud, O. Effects of interferon gamma on native human acute myelogenous leukaemia cells. Cancer Immunol. Immunother. 2007, 56, 13–24. [Google Scholar] [CrossRef] [PubMed]
- Carey, A.; Edwards, D.K.t.; Eide, C.A.; Newell, L.; Traer, E.; Medeiros, B.C.; Pollyea, D.A.; Deininger, M.W.; Collins, R.H.; Tyner, J.W.; et al. Identification of Interleukin-1 by Functional Screening as a Key Mediator of Cellular Expansion and Disease Progression in Acute Myeloid Leukemia. Cell Rep. 2017, 18, 3204–3218. [Google Scholar] [CrossRef] [PubMed]
- Wu, Y.; Chen, P.; Huang, H.F.; Huang, M.J.; Chen, Y.Z. Reduction of transforming growth factor-beta1 expression in leukemia and its possible role in leukemia development. Leuk. Lymphoma 2012, 53, 145–151. [Google Scholar] [CrossRef]
- Sanchez-Correa, B.; Bergua, J.M.; Campos, C.; Gayoso, I.; Arcos, M.J.; Banas, H.; Morgado, S.; Casado, J.G.; Solana, R.; Tarazona, R. Cytokine profiles in acute myeloid leukemia patients at diagnosis: Survival is inversely correlated with IL-6 and directly correlated with IL-10 levels. Cytokine 2013, 61, 885–891. [Google Scholar] [CrossRef]
- Diaz de la Guardia, R.; Lopez-Millan, B.; Lavoie, J.R.; Bueno, C.; Castano, J.; Gomez-Casares, M.; Vives, S.; Palomo, L.; Juan, M.; Delgado, J.; et al. Detailed Characterization of Mesenchymal Stem/Stromal Cells from a Large Cohort of AML Patients Demonstrates a Definitive Link to Treatment Outcomes. Stem Cell Rep. 2017, 8, 1573–1586. [Google Scholar] [CrossRef] [Green Version]
- Tettamanti, S.; Pievani, A.; Biondi, A.; Dotti, G.; Serafini, M. Catch me if you can: How AML and its niche escape immunotherapy. Leukemia 2022, 36, 13–22. [Google Scholar] [CrossRef]
- Curti, A.; Pandolfi, S.; Valzasina, B.; Aluigi, M.; Isidori, A.; Ferri, E.; Salvestrini, V.; Bonanno, G.; Rutella, S.; Durelli, I.; et al. Modulation of tryptophan catabolism by human leukemic cells results in the conversion of CD25- into CD25+ T regulatory cells. Blood 2007, 109, 2871–2877. [Google Scholar] [CrossRef] [PubMed]
- Folgiero, V.; Goffredo, B.M.; Filippini, P.; Masetti, R.; Bonanno, G.; Caruso, R.; Bertaina, V.; Mastronuzzi, A.; Gaspari, S.; Zecca, M.; et al. Indoleamine 2,3-dioxygenase 1 (IDO1) activity in leukemia blasts correlates with poor outcome in childhood acute myeloid leukemia. Oncotarget 2014, 5, 2052–2064. [Google Scholar] [CrossRef] [PubMed] [Green Version]
- Mussai, F.; De Santo, C.; Abu-Dayyeh, I.; Booth, S.; Quek, L.; McEwen-Smith, R.M.; Qureshi, A.; Dazzi, F.; Vyas, P.; Cerundolo, V. Acute myeloid leukemia creates an arginase-dependent immunosuppressive microenvironment. Blood 2013, 122, 749–758. [Google Scholar] [CrossRef] [PubMed] [Green Version]
- Jacamo, R.; Hoang, N.-M.; Al Rawi, A.; Ly, C.; Parihar, R.; McQueen, T.; Ruvolo, P.P.; Williams, P.; Alatrash, G.; Konopleva, M.; et al. Up-Regulation of iNOS in AML Blasts Creates an Immunosuppressive Microenvironment, Inhibits T-Cell Proliferation and Transforms T-Cells Towards a Tumor-Tolerating Phenotype. Blood 2017, 130, 2443. [Google Scholar] [CrossRef]
- Mougiakakos, D. The Induction of a Permissive Environment to Promote T Cell Immune Evasion in Acute Myeloid Leukemia: The Metabolic Perspective. Front. Oncol. 2019, 9, 1166. [Google Scholar] [CrossRef] [PubMed] [Green Version]
- Azadniv, M.; Myers, J.R.; McMurray, H.R.; Guo, N.; Rock, P.; Coppage, M.L.; Ashton, J.; Becker, M.W.; Calvi, L.M.; Liesveld, J.L. Bone marrow mesenchymal stromal cells from acute myelogenous leukemia patients demonstrate adipogenic differentiation propensity with implications for leukemia cell support. Leukemia 2020, 34, 391–403. [Google Scholar] [CrossRef]
- Shafat, M.S.; Oellerich, T.; Mohr, S.; Robinson, S.D.; Edwards, D.R.; Marlein, C.R.; Piddock, R.E.; Fenech, M.; Zaitseva, L.; Abdul-Aziz, A.; et al. Leukemic blasts program bone marrow adipocytes to generate a protumoral microenvironment. Blood 2017, 129, 1320–1332. [Google Scholar] [CrossRef]
- Tabe, Y.; Yamamoto, S.; Saitoh, K.; Sekihara, K.; Monma, N.; Ikeo, K.; Mogushi, K.; Shikami, M.; Ruvolo, V.; Ishizawa, J.; et al. Bone Marrow Adipocytes Facilitate Fatty Acid Oxidation Activating AMPK and a Transcriptional Network Supporting Survival of Acute Monocytic Leukemia Cells. Cancer Res. 2017, 77, 1453–1464. [Google Scholar] [CrossRef] [Green Version]
- O’Neill, L.A.; Kishton, R.J.; Rathmell, J. A guide to immunometabolism for immunologists. Nat. Rev. Immunol. 2016, 16, 553–565. [Google Scholar] [CrossRef] [Green Version]
- Moschoi, R.; Imbert, V.; Nebout, M.; Chiche, J.; Mary, D.; Prebet, T.; Saland, E.; Castellano, R.; Pouyet, L.; Collette, Y.; et al. Protective mitochondrial transfer from bone marrow stromal cells to acute myeloid leukemic cells during chemotherapy. Blood 2016, 128, 253–264. [Google Scholar] [CrossRef] [Green Version]
- Hole, P.S.; Zabkiewicz, J.; Munje, C.; Newton, Z.; Pearn, L.; White, P.; Marquez, N.; Hills, R.K.; Burnett, A.K.; Tonks, A.; et al. Overproduction of NOX-derived ROS in AML promotes proliferation and is associated with defective oxidative stress signaling. Blood 2013, 122, 3322–3330. [Google Scholar] [CrossRef] [PubMed]
- Aurelius, J.; Thoren, F.B.; Akhiani, A.A.; Brune, M.; Palmqvist, L.; Hansson, M.; Hellstrand, K.; Martner, A. Monocytic AML cells inactivate antileukemic lymphocytes: Role of NADPH oxidase/gp91(phox) expression and the PARP-1/PAR pathway of apoptosis. Blood 2012, 119, 5832–5837. [Google Scholar] [CrossRef] [Green Version]
- Vijayan, D.; Young, A.; Teng, M.W.L.; Smyth, M.J. Targeting immunosuppressive adenosine in cancer. Nat. Rev. Cancer 2017, 17, 709–724. [Google Scholar] [CrossRef] [PubMed]
- Beavis, P.A.; Stagg, J.; Darcy, P.K.; Smyth, M.J. CD73: A potent suppressor of antitumor immune responses. Trends Immunol. 2012, 33, 231–237. [Google Scholar] [CrossRef] [PubMed]
- Passaro, D.; Di Tullio, A.; Abarrategi, A.; Rouault-Pierre, K.; Foster, K.; Ariza-McNaughton, L.; Montaner, B.; Chakravarty, P.; Bhaw, L.; Diana, G.; et al. Increased Vascular Permeability in the Bone Marrow Microenvironment Contributes to Disease Progression and Drug Response in Acute Myeloid Leukemia. Cancer Cell 2017, 32, 324–341.e6. [Google Scholar] [CrossRef] [Green Version]
- Barbier, V.; Erbani, J.; Fiveash, C.; Davies, J.M.; Tay, J.; Tallack, M.R.; Lowe, J.; Magnani, J.L.; Pattabiraman, D.R.; Perkins, A.C.; et al. Endothelial E-selectin inhibition improves acute myeloid leukaemia therapy by disrupting vascular niche-mediated chemoresistance. Nat. Commun. 2020, 11, 2042. [Google Scholar] [CrossRef]
- Lamble, A.J.; Lind, E.F. Targeting the Immune Microenvironment in Acute Myeloid Leukemia: A Focus on T Cell Immunity. Front. Oncol. 2018, 8, 213. [Google Scholar] [CrossRef]
- Le Dieu, R.; Taussig, D.C.; Ramsay, A.G.; Mitter, R.; Miraki-Moud, F.; Fatah, R.; Lee, A.M.; Lister, T.A.; Gribben, J.G. Peripheral blood T cells in acute myeloid leukemia (AML) patients at diagnosis have abnormal phenotype and genotype and form defective immune synapses with AML blasts. Blood 2009, 114, 3909–3916. [Google Scholar] [CrossRef] [Green Version]
- Rey, J.; Fauriat, C.; Kochbati, E.; Orlanducci, F.; Charbonnier, A.; D’Incan, E.; Andre, P.; Romagne, F.; Barbarat, B.; Vey, N.; et al. Kinetics of Cytotoxic Lymphocytes Reconstitution after Induction Chemotherapy in Elderly AML Patients Reveals Progressive Recovery of Normal Phenotypic and Functional Features in NK Cells. Front. Immunol. 2017, 8, 64. [Google Scholar] [CrossRef] [Green Version]
- Panoskaltsis, N.; Reid, C.D.; Knight, S.C. Quantification and cytokine production of circulating lymphoid and myeloid cells in acute myelogenous leukaemia. Leukemia 2003, 17, 716–730. [Google Scholar] [CrossRef] [Green Version]
- Vidriales, M.B.; Orfao, A.; Lopez-Berges, M.C.; Gonzalez, M.; Hernandez, J.M.; Ciudad, J.; Lopez, A.; Moro, M.J.; Martinez, M.; San Miguel, J.F. Lymphoid subsets in acute myeloid leukemias: Increased number of cells with NK phenotype and normal T-cell distribution. Ann. Hematol. 1993, 67, 217–222. [Google Scholar] [CrossRef] [PubMed]
- Ismail, M.M.; Abdulateef, N.A.B. Bone marrow T-cell percentage: A novel prognostic indicator in acute myeloid leukemia. Int J. Hematol. 2017, 105, 453–464. [Google Scholar] [CrossRef] [PubMed]
- Behl, D.; Porrata, L.F.; Markovic, S.N.; Letendre, L.; Pruthi, R.K.; Hook, C.C.; Tefferi, A.; Elliot, M.A.; Kaufmann, S.H.; Mesa, R.A.; et al. Absolute lymphocyte count recovery after induction chemotherapy predicts superior survival in acute myelogenous leukemia. Leukemia 2006, 20, 29–34. [Google Scholar] [CrossRef] [PubMed]
- Zhou, Q.; Munger, M.E.; Veenstra, R.G.; Weigel, B.J.; Hirashima, M.; Munn, D.H.; Murphy, W.J.; Azuma, M.; Anderson, A.C.; Kuchroo, V.K.; et al. Coexpression of Tim-3 and PD-1 identifies a CD8+ T-cell exhaustion phenotype in mice with disseminated acute myelogenous leukemia. Blood 2011, 117, 4501–4510. [Google Scholar] [CrossRef]
- Knaus, H.A.; Berglund, S.; Hackl, H.; Blackford, A.L.; Zeidner, J.F.; Montiel-Esparza, R.; Mukhopadhyay, R.; Vanura, K.; Blazar, B.R.; Karp, J.E.; et al. Signatures of CD8+ T cell dysfunction in AML patients and their reversibility with response to chemotherapy. JCI Insight 2018, 3, e120974. [Google Scholar] [CrossRef] [Green Version]
- Kikushige, Y.; Shima, T.; Takayanagi, S.; Urata, S.; Miyamoto, T.; Iwasaki, H.; Takenaka, K.; Teshima, T.; Tanaka, T.; Inagaki, Y.; et al. TIM-3 is a promising target to selectively kill acute myeloid leukemia stem cells. Cell Stem Cell 2010, 7, 708–717. [Google Scholar] [CrossRef] [Green Version]
- Radwan, S.M.; Elleboudy, N.S.; Nabih, N.A.; Kamal, A.M. The immune checkpoints Cytotoxic T lymphocyte antigen-4 and Lymphocyte activation gene-3 expression is up-regulated in acute myeloid leukemia. Hla 2020, 96, 3–12. [Google Scholar] [CrossRef]
- Schnorfeil, F.M.; Lichtenegger, F.S.; Emmerig, K.; Schlueter, M.; Neitz, J.S.; Draenert, R.; Hiddemann, W.; Subklewe, M. T cells are functionally not impaired in AML: Increased PD-1 expression is only seen at time of relapse and correlates with a shift towards the memory T cell compartment. J. Hematol. Oncol. 2015, 8, 93. [Google Scholar] [CrossRef] [Green Version]
- Li, Z.; Philip, M.; Ferrell, P.B. Alterations of T-cell-mediated immunity in acute myeloid leukemia. Oncogene 2020, 39, 3611–3619. [Google Scholar] [CrossRef]
- Jia, B.; Wang, L.; Claxton, D.F.; Ehmann, W.C.; Rybka, W.B.; Mineishi, S.; Rizvi, S.; Shike, H.; Bayerl, M.; Schell, T.D.; et al. Bone marrow CD8 T cells express high frequency of PD-1 and exhibit reduced anti-leukemia response in newly diagnosed AML patients. Blood Cancer J. 2018, 8, 34. [Google Scholar] [CrossRef]
- Paley, M.A.; Kroy, D.C.; Odorizzi, P.M.; Johnnidis, J.B.; Dolfi, D.V.; Barnett, B.E.; Bikoff, E.K.; Robertson, E.J.; Lauer, G.M.; Reiner, S.L.; et al. Progenitor and terminal subsets of CD8+ T cells cooperate to contain chronic viral infection. Science 2012, 338, 1220–1225. [Google Scholar] [CrossRef] [PubMed] [Green Version]
- Jia, B.; Zhao, C.; Rakszawski, K.L.; Claxton, D.F.; Ehmann, W.C.; Rybka, W.B.; Mineishi, S.; Wang, M.; Shike, H.; Bayerl, M.G.; et al. Eomes(+)T-bet(low) CD8(+) T Cells Are Functionally Impaired and Are Associated with Poor Clinical Outcome in Patients with Acute Myeloid Leukemia. Cancer Res. 2019, 79, 1635–1645. [Google Scholar] [CrossRef] [PubMed]
- Radpour, R.; Riether, C.; Simillion, C.; Hopner, S.; Bruggmann, R.; Ochsenbein, A.F. CD8(+) T cells expand stem and progenitor cells in favorable but not adverse risk acute myeloid leukemia. Leukemia 2019, 33, 2379–2392. [Google Scholar] [CrossRef] [PubMed]
- Wu, C.; Wang, S.; Wang, F.; Chen, Q.; Peng, S.; Zhang, Y.; Qian, J.; Jin, J.; Xu, H. Increased frequencies of T helper type 17 cells in the peripheral blood of patients with acute myeloid leukaemia. Clin. Exp. Immunol. 2009, 158, 199–204. [Google Scholar] [CrossRef]
- Shenghui, Z.; Yixiang, H.; Jianbo, W.; Kang, Y.; Laixi, B.; Yan, Z.; Xi, X. Elevated frequencies of CD4(+) CD25(+) CD127lo regulatory T cells is associated to poor prognosis in patients with acute myeloid leukemia. Int J. Cancer 2011, 129, 1373–1381. [Google Scholar] [CrossRef] [PubMed]
- Han, Y.; Dong, Y.; Yang, Q.; Xu, W.; Jiang, S.; Yu, Z.; Yu, K.; Zhang, S. Acute Myeloid Leukemia Cells Express ICOS Ligand to Promote the Expansion of Regulatory T Cells. Front. Immunol. 2018, 9, 2227. [Google Scholar] [CrossRef] [Green Version]
- Zou, L.; Barnett, B.; Safah, H.; Larussa, V.F.; Evdemon-Hogan, M.; Mottram, P.; Wei, S.; David, O.; Curiel, T.J.; Zou, W. Bone marrow is a reservoir for CD4+CD25+ regulatory T cells that traffic through CXCL12/CXCR4 signals. Cancer Res. 2004, 64, 8451–8455. [Google Scholar] [CrossRef] [Green Version]
- Lichtenegger, F.S.; Lorenz, R.; Gellhaus, K.; Hiddemann, W.; Beck, B.; Subklewe, M. Impaired NK cells and increased T regulatory cell numbers during cytotoxic maintenance therapy in AML. Leuk Res. 2014, 38, 964–969. [Google Scholar] [CrossRef]
- Ersvaer, E.; Liseth, K.; Skavland, J.; Gjertsen, B.T.; Bruserud, O. Intensive chemotherapy for acute myeloid leukemia differentially affects circulating TC1, TH1, TH17 and TREG cells. BMC Immunol. 2010, 11, 38. [Google Scholar] [CrossRef] [Green Version]
- Menter, T.; Kuzmanic, B.; Bucher, C.; Medinger, M.; Halter, J.; Dirnhofer, S.; Tzankov, A. Beneficial role of increased FOXP3(+) regulatory T-cells in acute myeloid leukaemia therapy response. Br. J. Haematol. 2018, 182, 581–583. [Google Scholar] [CrossRef] [Green Version]
- Derolf, A.R.; Laane, E.; Bjorklund, E.; Saft, L.; Bjorkholm, M.; Porwit, A. Dendritic cells in bone marrow at diagnosis and after chemotherapy in adult patients with acute myeloid leukaemia. Scand. J. Immunol. 2014, 80, 424–431. [Google Scholar] [CrossRef] [PubMed] [Green Version]
- Xiao, W.; Goldberg, A.D.; Famulare, C.A.; Devlin, S.M.; Nguyen, N.T.; Sim, S.; Kabel, C.C.; Patel, M.A.; McGovern, E.M.; Patel, A.; et al. Loss of plasmacytoid dendritic cell differentiation is highly predictive for post-induction measurable residual disease and inferior outcomes in acute myeloid leukemia. Haematologica 2019, 104, 1378–1387. [Google Scholar] [CrossRef] [PubMed]
- Fatehchand, K.; Mehta, P.; Colvin, C.B.; Buteyn, N.J.; Santhanam, R.; Merchand-Reyes, G.; Inshaar, H.; Shen, B.; Mo, X.; Mundy-Bosse, B.; et al. Activation of plasmacytoid dendritic cells promotes AML-cell fratricide. Oncotarget 2021, 12, 878–890. [Google Scholar] [CrossRef] [PubMed]
- Xiao, W.; Chan, A.; Waarts, M.R.; Mishra, T.; Liu, Y.; Cai, S.F.; Yao, J.; Gao, Q.; Bowman, R.L.; Koche, R.P.; et al. Plasmacytoid dendritic cell expansion defines a distinct subset of RUNX1-mutated acute myeloid leukemia. Blood 2021, 137, 1377–1391. [Google Scholar] [CrossRef] [PubMed]
- Wang, P.; Feng, Y.; Deng, X.; Liu, S.; Qiang, X.; Gou, Y.; Li, J.; Yang, W.; Peng, X.; Zhang, X. Tumor-forming plasmacytoid dendritic cells in acute myelocytic leukemia: A report of three cases and literature review. Int. J. Clin. Exp. Pathol. 2017, 10, 7285–7291. [Google Scholar] [PubMed]
- Szczepanski, M.J.; Szajnik, M.; Welsh, A.; Whiteside, T.L.; Boyiadzis, M. Blast-derived microvesicles in sera from patients with acute myeloid leukemia suppress natural killer cell function via membrane-associated transforming growth factor-beta1. Haematologica 2011, 96, 1302–1309. [Google Scholar] [CrossRef]
- Ghiringhelli, F.; Menard, C.; Terme, M.; Flament, C.; Taieb, J.; Chaput, N.; Puig, P.E.; Novault, S.; Escudier, B.; Vivier, E.; et al. CD4+CD25+ regulatory T cells inhibit natural killer cell functions in a transforming growth factor-beta-dependent manner. J. Exp. Med. 2005, 202, 1075–1085. [Google Scholar] [CrossRef]
- Costello, R.T.; Sivori, S.; Marcenaro, E.; Lafage-Pochitaloff, M.; Mozziconacci, M.J.; Reviron, D.; Gastaut, J.A.; Pende, D.; Olive, D.; Moretta, A. Defective expression and function of natural killer cell-triggering receptors in patients with acute myeloid leukemia. Blood 2002, 99, 3661–3667. [Google Scholar] [CrossRef]
- Stringaris, K.; Sekine, T.; Khoder, A.; Alsuliman, A.; Razzaghi, B.; Sargeant, R.; Pavlu, J.; Brisley, G.; de Lavallade, H.; Sarvaria, A.; et al. Leukemia-induced phenotypic and functional defects in natural killer cells predict failure to achieve remission in acute myeloid leukemia. Haematologica 2014, 99, 836–847. [Google Scholar] [CrossRef] [Green Version]
- Nowbakht, P.; Ionescu, M.C.; Rohner, A.; Kalberer, C.P.; Rossy, E.; Mori, L.; Cosman, D.; De Libero, G.; Wodnar-Filipowicz, A. Ligands for natural killer cell-activating receptors are expressed upon the maturation of normal myelomonocytic cells but at low levels in acute myeloid leukemias. Blood 2005, 105, 3615–3622. [Google Scholar] [CrossRef]
- Della Chiesa, M.; Carlomagno, S.; Frumento, G.; Balsamo, M.; Cantoni, C.; Conte, R.; Moretta, L.; Moretta, A.; Vitale, M. The tryptophan catabolite L-kynurenine inhibits the surface expression of NKp46- and NKG2D-activating receptors and regulates NK-cell function. Blood 2006, 108, 4118–4125. [Google Scholar] [CrossRef] [PubMed]
- Baragano Raneros, A.; Martin-Palanco, V.; Fernandez, A.F.; Rodriguez, R.M.; Fraga, M.F.; Lopez-Larrea, C.; Suarez-Alvarez, B. Methylation of NKG2D ligands contributes to immune system evasion in acute myeloid leukemia. Genes Immun. 2015, 16, 71–82. [Google Scholar] [CrossRef] [PubMed]
- Paczulla, A.M.; Rothfelder, K.; Raffel, S.; Konantz, M.; Steinbacher, J.; Wang, H.; Tandler, C.; Mbarga, M.; Schaefer, T.; Falcone, M.; et al. Absence of NKG2D ligands defines leukaemia stem cells and mediates their immune evasion. Nature 2019, 572, 254–259. [Google Scholar] [CrossRef] [PubMed]
- Elias, S.; Yamin, R.; Golomb, L.; Tsukerman, P.; Stanietsky-Kaynan, N.; Ben-Yehuda, D.; Mandelboim, O. Immune evasion by oncogenic proteins of acute myeloid leukemia. Blood 2014, 123, 1535–1543. [Google Scholar] [CrossRef] [Green Version]
- Lehmann, C.; Zeis, M.; Schmitz, N.; Uharek, L. Impaired binding of perforin on the surface of tumor cells is a cause of target cell resistance against cytotoxic effector cells. Blood 2000, 96, 594–600. [Google Scholar] [CrossRef] [PubMed]
- Pyzer, A.R.; Stroopinsky, D.; Rajabi, H.; Washington, A.; Tagde, A.; Coll, M.; Fung, J.; Bryant, M.P.; Cole, L.; Palmer, K.; et al. MUC1-mediated induction of myeloid-derived suppressor cells in patients with acute myeloid leukemia. Blood 2017, 129, 1791–1801. [Google Scholar] [CrossRef] [PubMed] [Green Version]
- Tohumeken, S.; Baur, R.; Bottcher, M.; Stoll, A.; Loschinski, R.; Panagiotidis, K.; Braun, M.; Saul, D.; Volkl, S.; Baur, A.S.; et al. Palmitoylated Proteins on AML-Derived Extracellular Vesicles Promote Myeloid-Derived Suppressor Cell Differentiation via TLR2/Akt/mTOR Signaling. Cancer Res. 2020, 80, 3663–3676. [Google Scholar] [CrossRef]
- Yang, Y.; Li, C.; Liu, T.; Dai, X.; Bazhin, A.V. Myeloid-Derived Suppressor Cells in Tumors: From Mechanisms to Antigen Specificity and Microenvironmental Regulation. Front. Immunol. 2020, 11, 1371. [Google Scholar] [CrossRef]
- Miari, K.E.; Guzman, M.L.; Wheadon, H.; Williams, M.T.S. Macrophages in Acute Myeloid Leukaemia: Significant Players in Therapy Resistance and Patient Outcomes. Front. Cell Dev. Biol. 2021, 9, 692800. [Google Scholar] [CrossRef]
- Jiang, M.; Zhang, J.; Qian, L.; Miao, Y.; Song, W.; Liu, H.; Li, R. MOZ Forms an Autoregulatory Feedback Loop with miR-223 in AML and Monocyte/Macrophage Development. iScience 2019, 11, 189–204. [Google Scholar] [CrossRef] [Green Version]
- Al-Matary, Y.S.; Botezatu, L.; Opalka, B.; Hones, J.M.; Lams, R.F.; Thivakaran, A.; Schutte, J.; Koster, R.; Lennartz, K.; Schroeder, T.; et al. Acute myeloid leukemia cells polarize macrophages towards a leukemia supporting state in a Growth factor independence 1 dependent manner. Haematologica 2016, 101, 1216–1227. [Google Scholar] [CrossRef] [PubMed] [Green Version]
- Mansour, I.; Zayed, R.A.; Said, F.; Latif, L.A. Indoleamine 2,3-dioxygenase and regulatory T cells in acute myeloid leukemia. Hematology 2016, 21, 447–453. [Google Scholar] [CrossRef] [PubMed] [Green Version]
- Vasold, J.; Wagner, M.; Drolle, H.; Deniffel, C.; Kutt, A.; Oostendorp, R.; Sironi, S.; Rieger, C.; Fiegl, M. The bone marrow microenvironment is a critical player in the NK cell response against acute myeloid leukaemia in vitro. Leuk. Res. 2015, 39, 257–262. [Google Scholar] [CrossRef]
- Lu, Y.; Liu, J.; Liu, Y.; Qin, Y.; Luo, Q.; Wang, Q.; Duan, H. TLR4 plays a crucial role in MSC-induced inhibition of NK cell function. Biochem. Biophys. Res. Commun. 2015, 464, 541–547. [Google Scholar] [CrossRef] [PubMed]
- Wang, A.; Zhong, H. Roles of the bone marrow niche in hematopoiesis, leukemogenesis, and chemotherapy resistance in acute myeloid leukemia. Hematology 2018, 23, 729–739. [Google Scholar] [CrossRef] [Green Version]
- Vijay, V.; Miller, R.; Vue, G.S.; Pezeshkian, M.B.; Maywood, M.; Ast, A.M.; Drusbosky, L.M.; Pompeu, Y.; Salgado, A.D.; Lipten, S.D.; et al. Interleukin-8 blockade prevents activated endothelial cell mediated proliferation and chemoresistance of acute myeloid leukemia. Leuk. Res. 2019, 84, 106180. [Google Scholar] [CrossRef] [PubMed]
- Yang, D.; de Haan, G. Inflammation and Aging of Hematopoietic Stem Cells in Their Niche. Cells 2021, 10, 1849. [Google Scholar] [CrossRef]
- Guo, R.; Lu, M.; Cao, F.; Wu, G.; Gao, F.; Pang, H.; Li, Y.; Zhang, Y.; Xing, H.; Liang, C.; et al. Single-cell map of diverse immune phenotypes in the acute myeloid leukemia microenvironment. Biomark. Res. 2021, 9, 15. [Google Scholar] [CrossRef]
Figure 1.
The immune landscape in low (top half) and high-risk (bottom half) MDS. NLRP3 inflammasome recruitment (by means of TLR signaling pathways (through DAMPs, PAMPs, S100A8/A9) and somatic mutations) by cancer cells is central in MDS pathogenesis driving proinflammatory cytokine production and pyroptosis. In low-risk disease, cytotoxic T-lymphocytes are increased, whereas Tregs are reduced. Cytotoxic T-cells suppress both malignant and normal HSCs further augmenting the cytopenic phenotype. High-risk disease is characterized by MDS clone expansion driven by immunosuppressive cytokine production, reduced efficiency of NK cells, and cytotoxic T-cells with concomitant expansion of Tregs and MDSCs. MSCs and M2-phenotype mac.

Figure 2.
The immune landscape in AML. A complex network of AML cell-extrinsic and intrinsic factors characterize the immune microenvironment of AML. AML-related somatic mutations are implicated in immune alterations (with NPM1mut involved in effective T-cell immune responses). HLA molecule downregulation and defective antigen presentation are also recruited. Altered cytokine balance also assists AML cell expansion, Treg function, and immune suppression. A number of metabolic factors (IDO1/iNOS/ArgII elevation, increased fatty acid oxidation, and oxidative phosphorylation) contribute to immunosuppression. MDSC expansion (possibly through MUC1 containing extracellular vesicles) and M2-macrophages also augment AML immune escape. Immune checkpoint molecule overexpression on AML and CD8+ T-cells (e.g., PD-1/PD-L1, TIM-3/galectin-9), poor immune synapse function, and impaired NK –cell function (through NK-cell receptor downregulation, defective NK degranulation, and perforin binding). BM vascular remodeling impedes anti-AML immune responses through reduced cell migration and hypoxia induction.


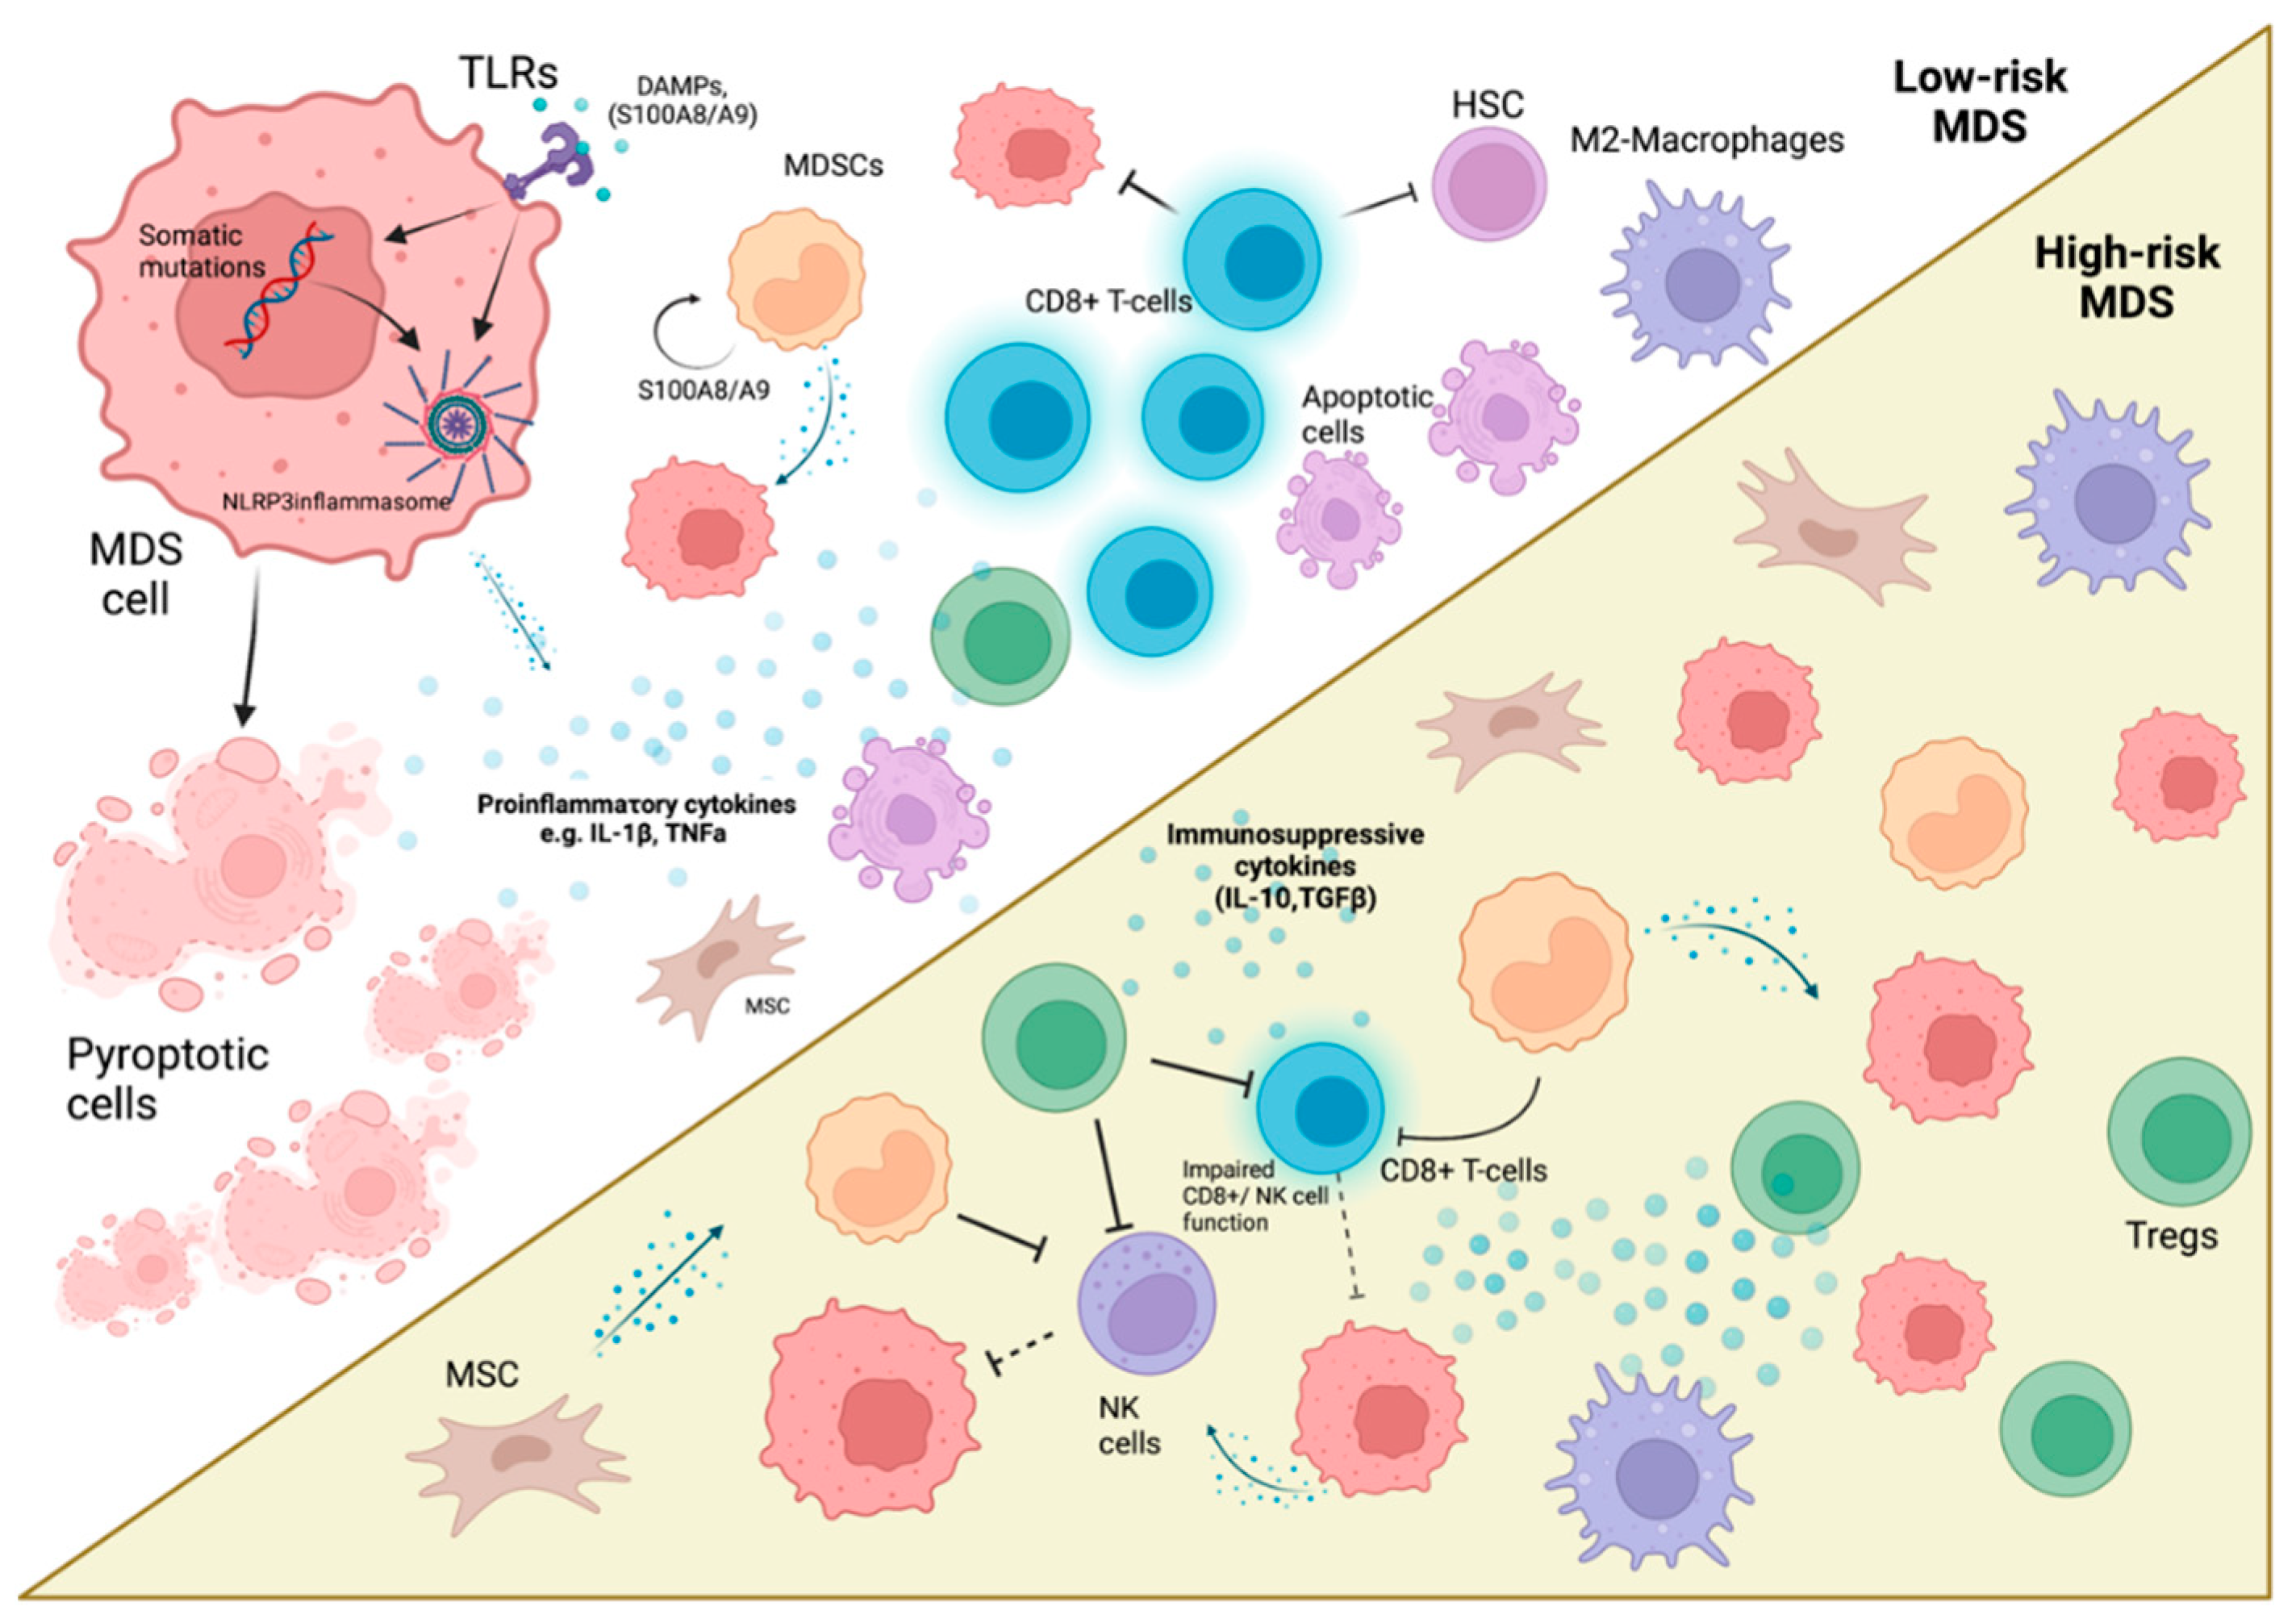
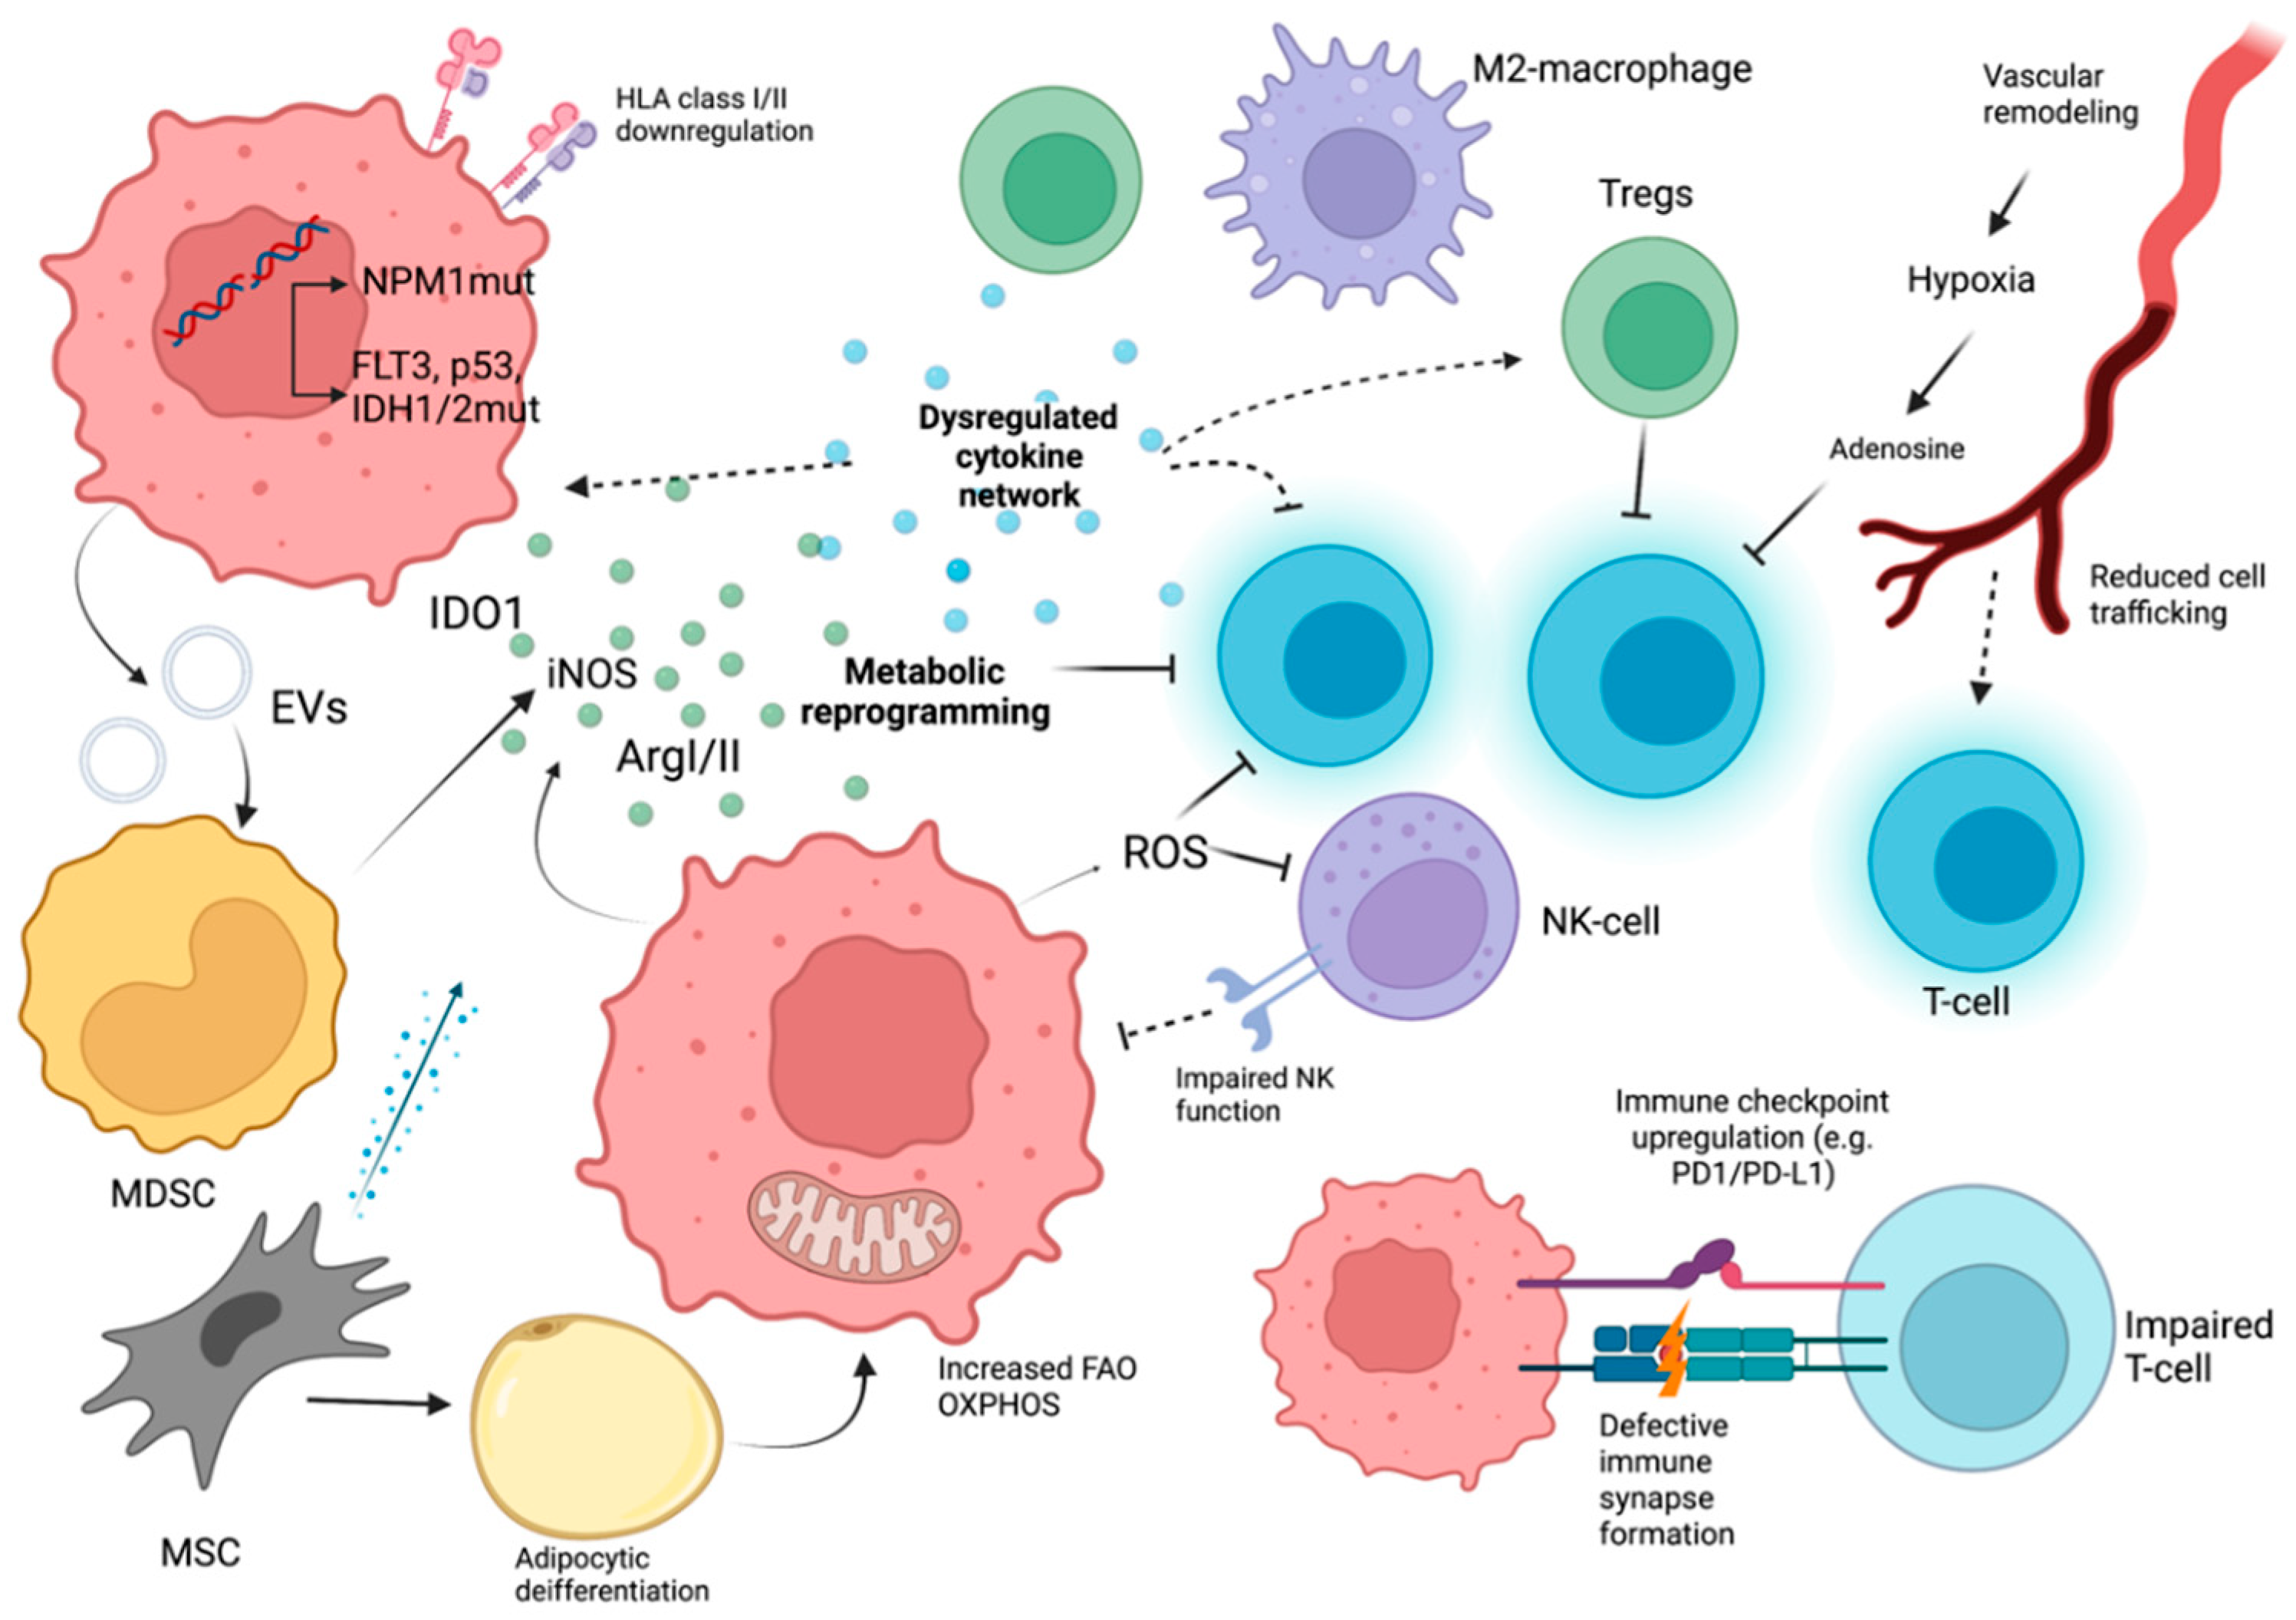
Table 1.
Summarizing evidence regarding immunology in low-risk/high-risk MDS/AML. MDSC: myeloid-derived suppressor cells, MSCs: mesenchymal stem cells.
Table 1.
Summarizing evidence regarding immunology in low-risk/high-risk MDS/AML. MDSC: myeloid-derived suppressor cells, MSCs: mesenchymal stem cells.
| Low-Risk MDS | High-Risk MDS | AML | |
|---|---|---|---|
| Cell intrinsic factors | Increased NLRP3-inflammasome activation and Pyroptosis Apoptosis induction | NLRP3 inflammasome activation | Downregulation of mismatched HLAs, class II HLAs (in alloHSCT) Impaired antigen presentation |
| Cytokines/Metabolites | Increased proinflammatory cytokine production (TNFa, IL-1β, etc.) | Immunosuppressive cytokine production (IL-10) | Increased Il-1β/ΙL-6/TNFa/IL-35 Decreased TGFβ Increased immunosuppressive metabolic factors (IDO1, ArgII, iNOS, FAO, etc.) Vascular remodeling with immunosuppressive sequelae |
| T-lymphocytes | Increased CD8+ lymphocytes with autoreactive potential Increased Th17 helper cell numbers Decreased Treg number | Diminished and dysfunctional CD8+ lymphocytes Increased immune checkpoint molecule expression Increased Th22 helper cells Tregs with increased number and functionality | Reduced CD8+ lymphocyte function/Increased immune checkpoint molecule expression Increased Treg numbers with immunosuppressive properties |
| NK-lymphocytes | Decreased NK-cell numbers with reduced function | NK-cell impairement | |
| MDSCs | MDSC expansion | MDSC expansion correlating with Treg increase | MDSC expansion |
| Macrophages | M2 macrophage expansion INOS+ subtype increase | M2 macrophage expansion | M2 macrophage expansion |
| MSCs | Reduced differentiation potential | Increased with immunosuppressive properties | Increased immunosuppressive behavior |
Publisher’s Note: MDPI stays neutral with regard to jurisdictional claims in published maps and institutional affiliations. |
© 2022 by the authors. Licensee MDPI, Basel, Switzerland. This article is an open access article distributed under the terms and conditions of the Creative Commons Attribution (CC BY) license (https://creativecommons.org/licenses/by/4.0/).
Share and Cite
MDPI and ACS Style
Barakos, G.P.; Hatzimichael, E. Microenvironmental Features Driving Immune Evasion in Myelodysplastic Syndromes and Acute Myeloid Leukemia. Diseases 2022, 10, 33. https://0-doi-org.brum.beds.ac.uk/10.3390/diseases10020033
AMA Style
Barakos GP, Hatzimichael E. Microenvironmental Features Driving Immune Evasion in Myelodysplastic Syndromes and Acute Myeloid Leukemia. Diseases. 2022; 10(2):33. https://0-doi-org.brum.beds.ac.uk/10.3390/diseases10020033
Chicago/Turabian StyleBarakos, Georgios Petros, and Eleftheria Hatzimichael. 2022. "Microenvironmental Features Driving Immune Evasion in Myelodysplastic Syndromes and Acute Myeloid Leukemia" Diseases 10, no. 2: 33. https://0-doi-org.brum.beds.ac.uk/10.3390/diseases10020033
Note that from the first issue of 2016, this journal uses article numbers instead of page numbers. See further details here.