The Socio-Economic Benefits of Sharing Economy: Colleague-Based Carpooling Service in Korea

Department of Urban Engineering, Hanbat National University, Daejeon 34158, Korea
*
Author to whom correspondence should be addressed.
J. Open Innov. Technol. Mark. Complex. 2018, 4(3), 40; https://0-doi-org.brum.beds.ac.uk/10.3390/joitmc4030040
Submission received: 27 May 2018
/
Revised: 20 August 2018
/
Accepted: 21 August 2018
/
Published: 3 September 2018
Abstract
:Carpooling—a concept of shared transportation for addressing traffic issues such as congestion and CO2 emissions—has been actively introduced, especially in developed countries. This study proposes a method to estimate the benefits of introducing carpooling for employees in public agencies that are transferring innovation cities. To overcome the shortcomings of previous carpooling services, a carpooling service for inter-company employees was designed and evaluated in our study. The traffic flow theory was used to estimate the direct benefits to carpooling users and the indirect benefits to express highway drivers. The results indicate that carpooling services have a significant socio-economic cost-saving effect on traffic congestion, environmental cost reduction, and so forth, and will therefore play an important role in traffic demand management.
1. Introduction
Industrialization and urbanization have contributed positively to increasing the distribution rate of vehicles; however, they have also caused social problems such as environmental pollution and the exhaustion of resources. In many countries, including the United States (US) and Europe, research is actively being conducted to address urbanization-related issues such as climate change and resource exhaustion [1,2].
In the transportation sector, the increasing rate of traffic congestion and single-occupancy vehicles during rush hours has become a major issue in addition to other issues such as parking difficulties and environmental pollution. Shared transportation was conceptualized based on most private passenger cars being used mostly during commuting hours. Similar to in other developed countries, in Korea as well, vehicles and parking spaces are drawing attention as major issues in this regard.
Car-sharing and carpooling are two outstanding examples of shared transportation. Car-sharing involves renting a vehicle for certain hours of the day, whereas carpooling—also called ride-sharing—involves a group of people leaving home and office at similar time slots to share a vehicle owned by the driver.
Carpooling has both advantages and disadvantages. It contributes to reducing air pollution and transportation costs including fuel cost and tolls; however, it involves safety and privacy concerns because the identity of the occupants may be uncertain. In Korea, carpooling has not widely spread compared to other countries because of issues with insurance coverage policies in cases of traffic accidents and the difficulty in adjusting commuting times, given that different occupants are sharing the same vehicle. Further, certain legal restrictions do not allow carpooling except during commuting hours, and matching is not easy either, because the pick-up and drop-off locations are different. To overcome such problems, a new carpooling service is being promoted among inter-company employees.
We seek to estimate the effects of introducing a carpooling system among innovation cities transferring public agencies based on an estimation of the economic benefits from introducing a carpooling service among inter-company employees; this system was developed to overcome the disadvantages of the existing carpooling services.
2. Colleague-Based Carpooling and Prediction of Demand for Carpooling
2.1. Literature Review
Conventional research on carpooling focused on service aspects such as identifying the main users of carpooling, problems with the carpooling system, and methods of increasing matching rates [3,4,5,6,7]. Stiglic et al. [5] emphasized the need for the driver’s sacrifice for successful matching in a carpooling system. Caulfield [6] designed an application (APP) through which vulnerable spots of public transportation could be identified and used for alternative transportation means such as the carpool service. Aarthi [7] studied carpool service improvement by applying a user-centered design methodology to a carpool system.
Gargiulo et al. [8] applied three ride-sharing scenarios in Dublin, where the travel distance and CO2 reduction effects were examined. When carpooling was introduced for commuting on weekdays, approximately 12,600 tons of CO2 was reduced, which corresponded to approximately 706,428 euros. Amey [9] estimated the effects of carpooling when 50%–77% of the total commuting population used carpooling, including the faculty and students at the Massachusetts Institute of Technology. It was estimated that the total daily travel distance would be shortened by as much as 9%–27%. Neoh et al. [10] used structural equation modeling to analyze environments where commuters would more actively use a carpooling arrangement. Jacoboson and King [11] identified that if no additional travel is required to pick up passengers, adding one additional passenger for every 100 vehicles would reduce the national annual fuel consumption by 0.80–0.82 billion gallons per year in the US. Yang and Huang [12] theoretically developed the characteristics of first-best tolls in either the absence or presence of high-occupancy vehicle (HOV) lanes using a deterministic equilibrium mode choice model with overall elastic demand.
In previous studies, different constraints were applied to carpooling services based on the countries and regions. Thus, there were an extremely limited number of cases where carpooling was permitted only for commuting hours, such as in Korea. The perception of vehicles also varied significantly among countries. Many studies on carpooling have been conducted by means of surveys or algorithms, but there has been very little research on traffic demand management based on traffic flow theory using an actual mobile app.
Therefore, in this study, we apply the traffic flow theory to examine the socio-economic effects of introducing a carpooling service during commuting hours among innovation cities transferring public agencies within the jurisdiction of Korean law. The author recommends readers to refer to the relevant literature on the theory and application of traffic flow theory [13,14]. To the best of our knowledge, this study is significant because it is the first case that estimates the direct benefits to users and the indirect benefits to vehicles driven in certain sections when an inter-company carpooling app service was introduced to address the safety problems of carpooling with strangers among passengers, and minimize the sacrifice of a driver who has to detour to pick up and drop off carpooling passengers.
2.2. Colleague-Based Carpooling Service
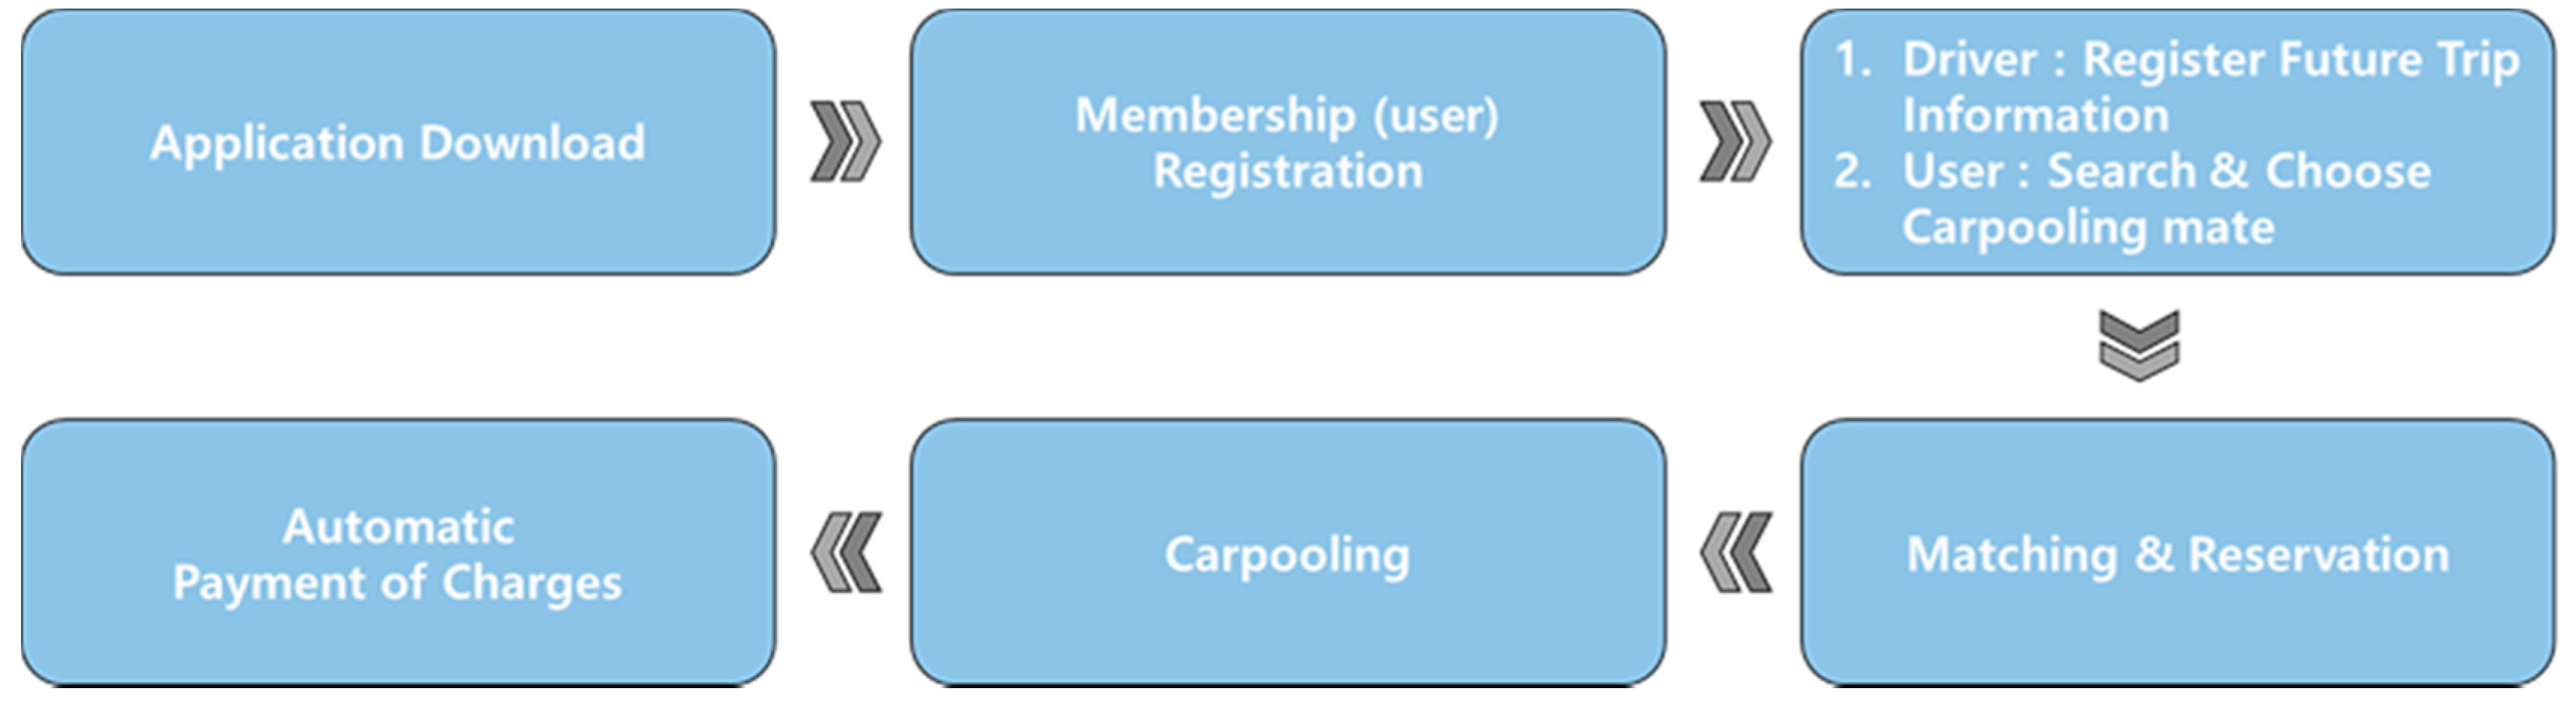
“BlaBlaCar” in France and “DD Pincher” in China are two major examples of carpooling services. Figure 1 shows the flowchart for an inter-company carpooling service that is designed to minimize the driver’s sacrifice of picking up and dropping off passengers and remove the safety apprehensions of carpooling with strangers. This service aims only at inter-company users to overcome the limitations of the existing carpooling services.
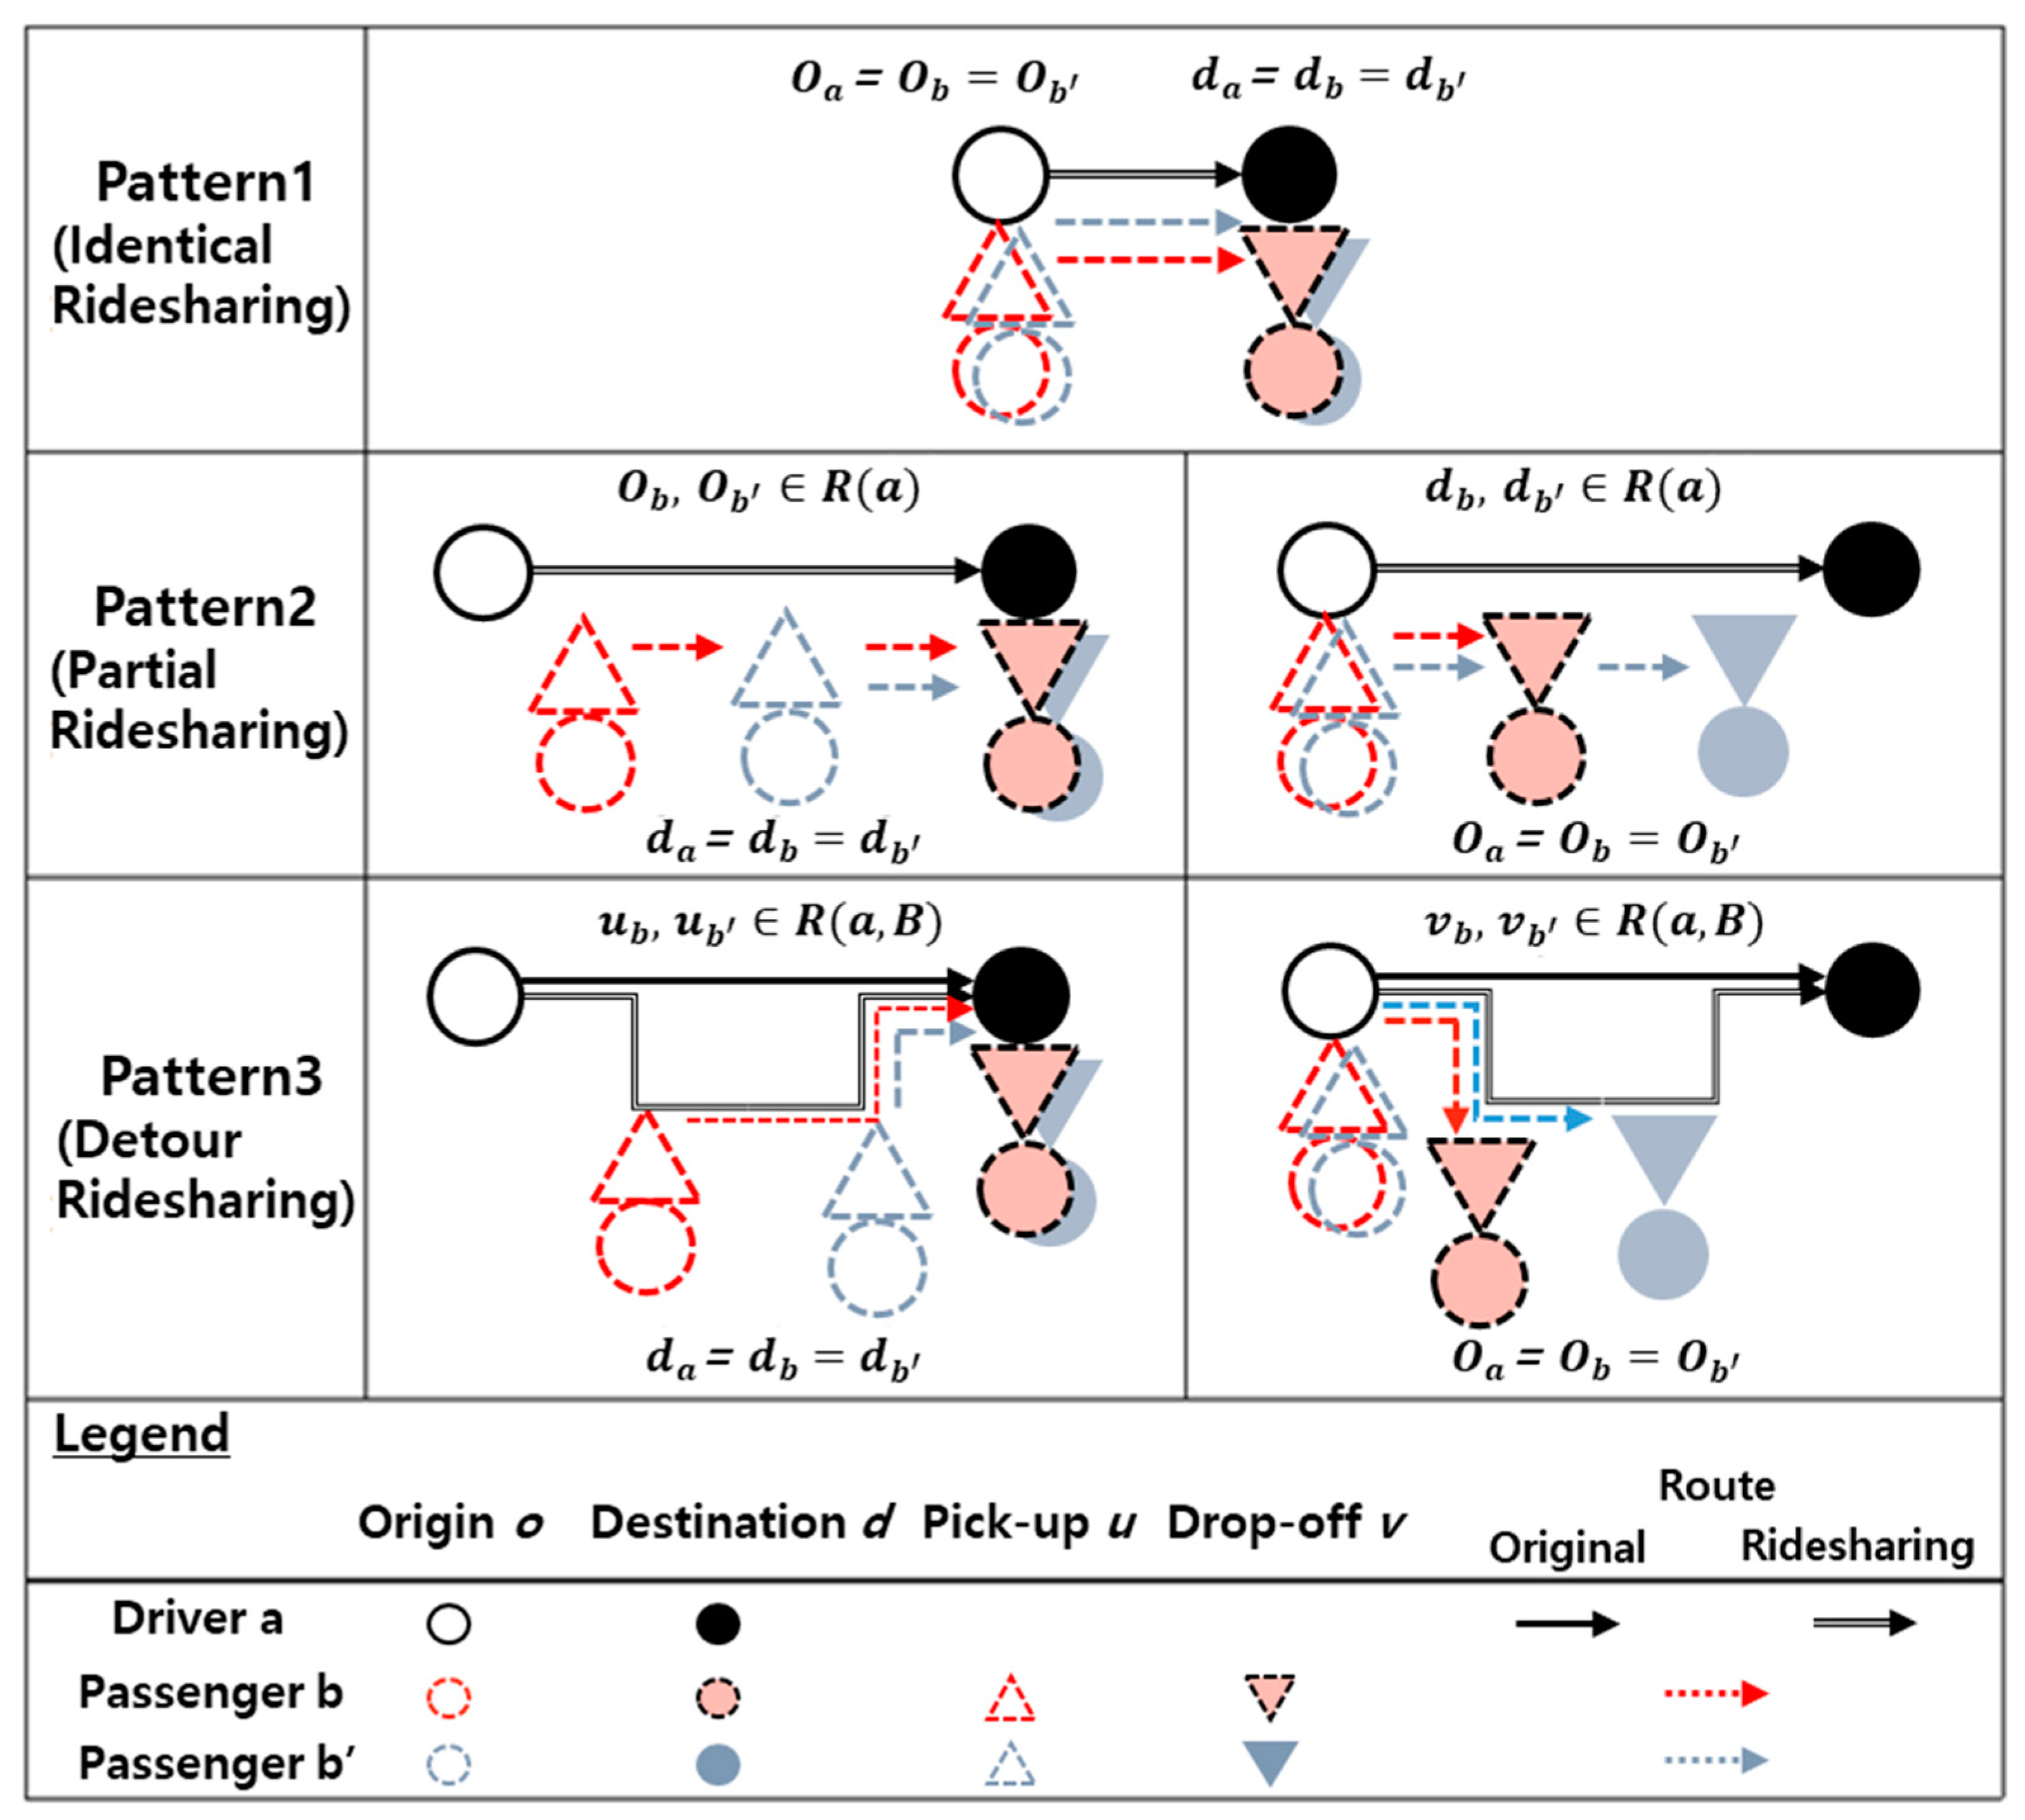
Carpooling services can be classified into two types: pick-up (u) and drop-off (v) are practiced in the optimal route between the origin (O) and the destination (D); or the route is adjusted (detouring) depending on the passengers, as shown in Figure 2. The original route of Driver “a” is R(a), and the carpooling route set of Driver “a” and passengers (b, b’) may be expressed with R(a, B) [15].
Identical ride-sharing implies that passengers with the same origin and destination are picked up from the driver’s perspective, while partial ride-sharing is when either the origin or the destination is the same, and passengers are picked up or dropped off at a location of their preference. Detour ride-sharing is when the driver detours to pick up passengers. From the driver’s perspective, this service type is not as preferred compared with identical or partial ride-sharing service types, because the position of passenger drop-off can deviate considerably from the original path. This may result in the carpooling service receiving complaints regarding cost, routing, etc., and may possibly lead to the driver or passengers giving up the carpool service due to the inconvenience caused.
Most studies of carpooling services focus on detour routing, matching passengers, and carpooling cost estimation based on the assumption of detour ride-sharing. The advantages and disadvantages may be different depending on the service type, but if all of the occupants commute to or from the same agency (same destination) as in the case of partial ride-sharing, it will be advantageous both for the driver and the passengers. Therefore, we examine the use of an inter-company carpooling service—“RIDE”—based on a partial ride-sharing service model.
2.3. Expected Demand for Carpooling Service
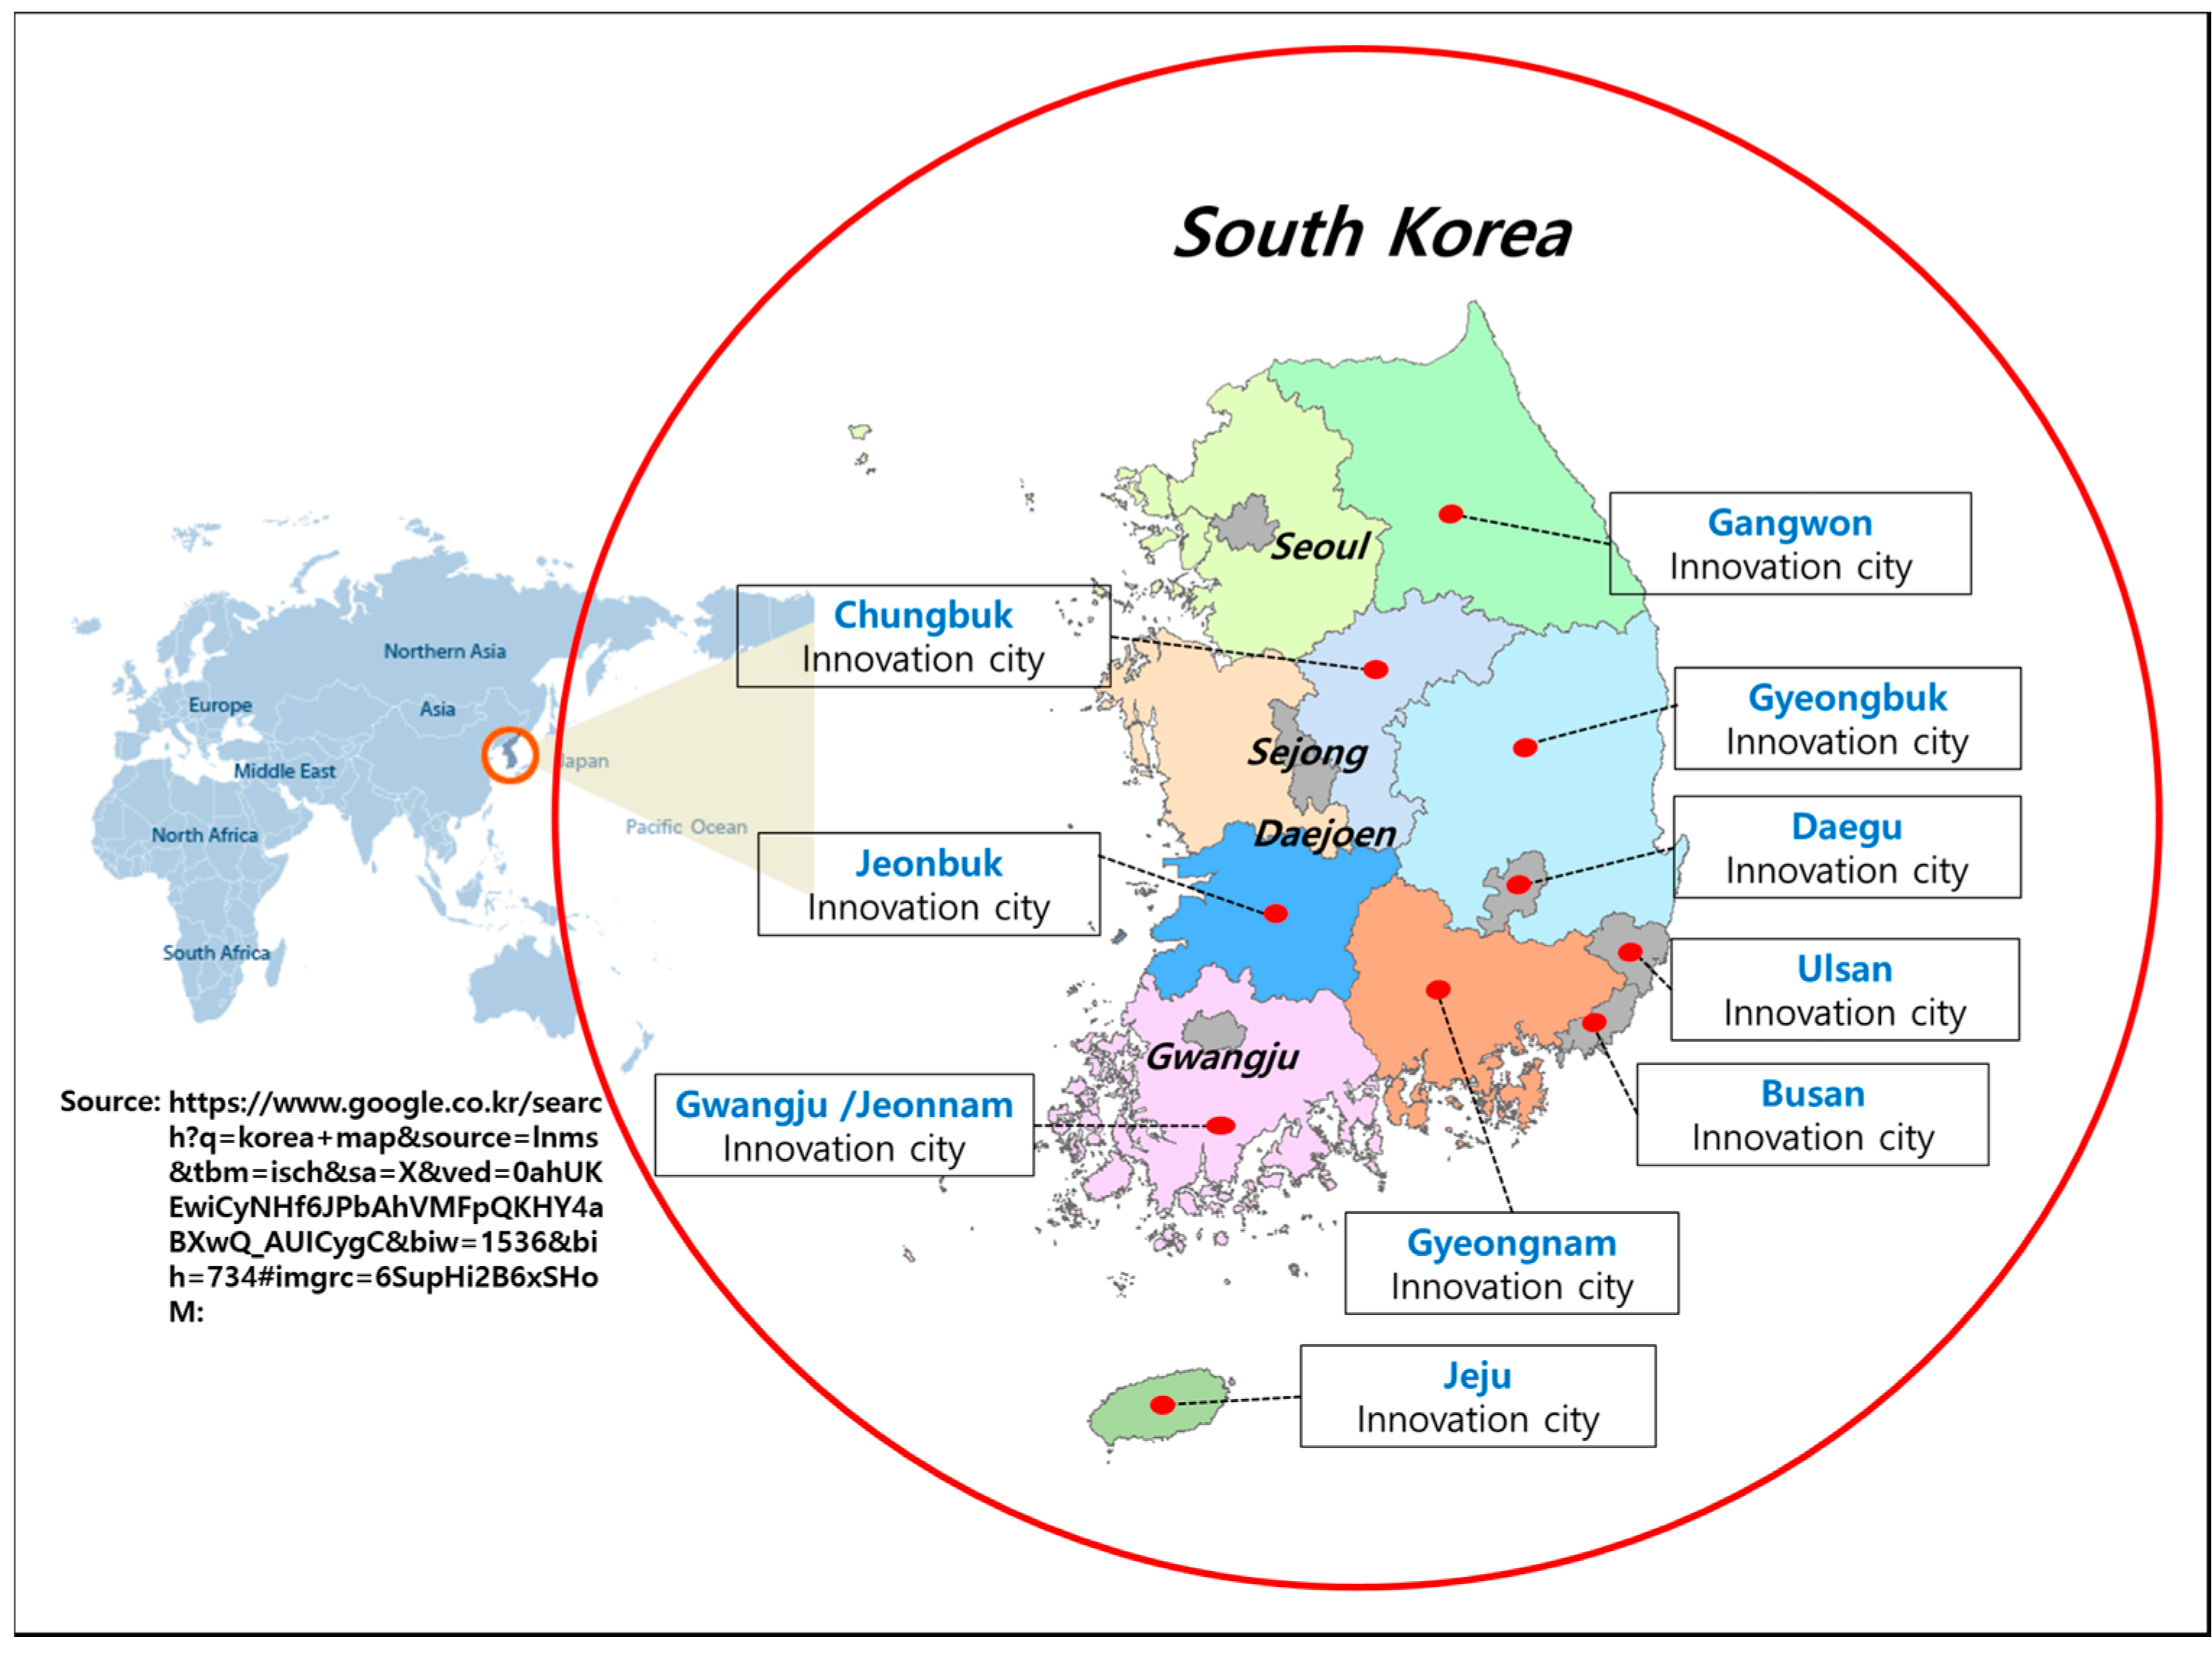
The Korean government propelled local economy invigoration through the relocation of public agencies to solve the problem of bipolarism: overcrowding in the Seoul Metropolitan Area and the local area’s depression. As shown in Figure 3, central administrative agencies were relocated to Sejong City, and innovative cities were built in some local areas. Therefore, some of the workers of the agencies that relocated to innovative cities from the Seoul Metropolitan Area now need to commute a long distance.
For the data on the number and rate of workers of public agencies commuting from the Seoul Metropolitan Area to innovative cities, the homepage of the Ministry of Land, Infrastructure, and Transport [16] and existing research results were used [17,18].
In order to predict the demand for the carpooling service, the expected number of mid/long-term commuters was calculated based on the data obtained from the Ministry of Land, Infrastructure, and Transport regarding innovation cities transferring public agencies. Individuals commuting by a passenger car were included as the potential users of the carpool services.
The results of existing studies related to innovation cities indicate that approximately 26% of those transferring to an innovation city were planning to commute, and 32% of them would be using a passenger car [17,18]. Our study estimated the demand for carpool service for 129 agencies among 132, as those with no data of transferring employees were excluded.
In Korea, carpooling is limited to only during rush hour (in the morning and in the evening). Considering that the carpool service targets passenger cars, this study limited the demand for the carpool service to passenger cars.
The expected demand for a carpooling service was converted into the number of vehicles required. Two scenarios were assumed to estimate this number of carpooling vehicles for each agency: (1) there is one driver and one passenger, which is the minimum number of car occupants for carpooling; (2) there is one driver and three passengers, which is the maximum number of car occupants for carpooling (see Table 1).
If the demand for each relocated agency’s carpool service is estimated and converted into the unit of car, then, based on existing research results, we get:
where ACD(i) is the carpooling demand of each agency i, TE(i) is the total number of employees for each agency i, CR(i) is the commute rate for each agency i (%), PU(i) is the rate of passenger car users for each agency i (%), and PO(i) is the passenger car occupancy for each agency i.
2.4. Traffic Flow Models
The change in the traffic demand at certain road sections after the introduction of carpooling services is likely to cause a change in the travel speed. Basically, the demand in each section of an express highway may change depending on the commuting distance and time from (or to) an agency to an innovation city. In other words, the effects of the difference in the travel speed as a result of the changing traffic demand on the travel-time cost function are quantified and reflected into benefit estimation. To this end, a traffic flow model was established in our study to check the change in the travel speed at each section.
To calculate the travel speed at each road section depending on the changing traffic demand during commuting hours after the introduction of the carpooling service, we referred to the Vehicle Detection System (VDS) data provided by the Korea Highway Corporation. VDS data divides domestic express highways into sections, and presents traffic details for each section (e.g., traffic volume and travel speed). Accordingly, we established a traffic-flow model for express-highway sections that were on each agency’s commuting routes. We limited the use of the carpooling service to commuting hours, according to the Passenger Transport Service Act of Korea. Thus, VDS traffic data were analyzed only for the peak hours to commute to and from work, excluding weekends and holidays.
To design the optimal traffic-flow model for each section, the following speed-density model formulas were utilized: Greenshields, Greenberg, and Underwood. Table 2 shows the basic model formulas and parameters of each model, where is the jam density, is the free-flow speed, and is the critical density. Considering the importance of selecting a model to best represent the traffic characteristics of a particular road section, we analyzed R² and the error rates of each section model, that is, the mean absolute per error (MAPE) and root mean square error (RMSE) to select the optimal traffic-flow model.
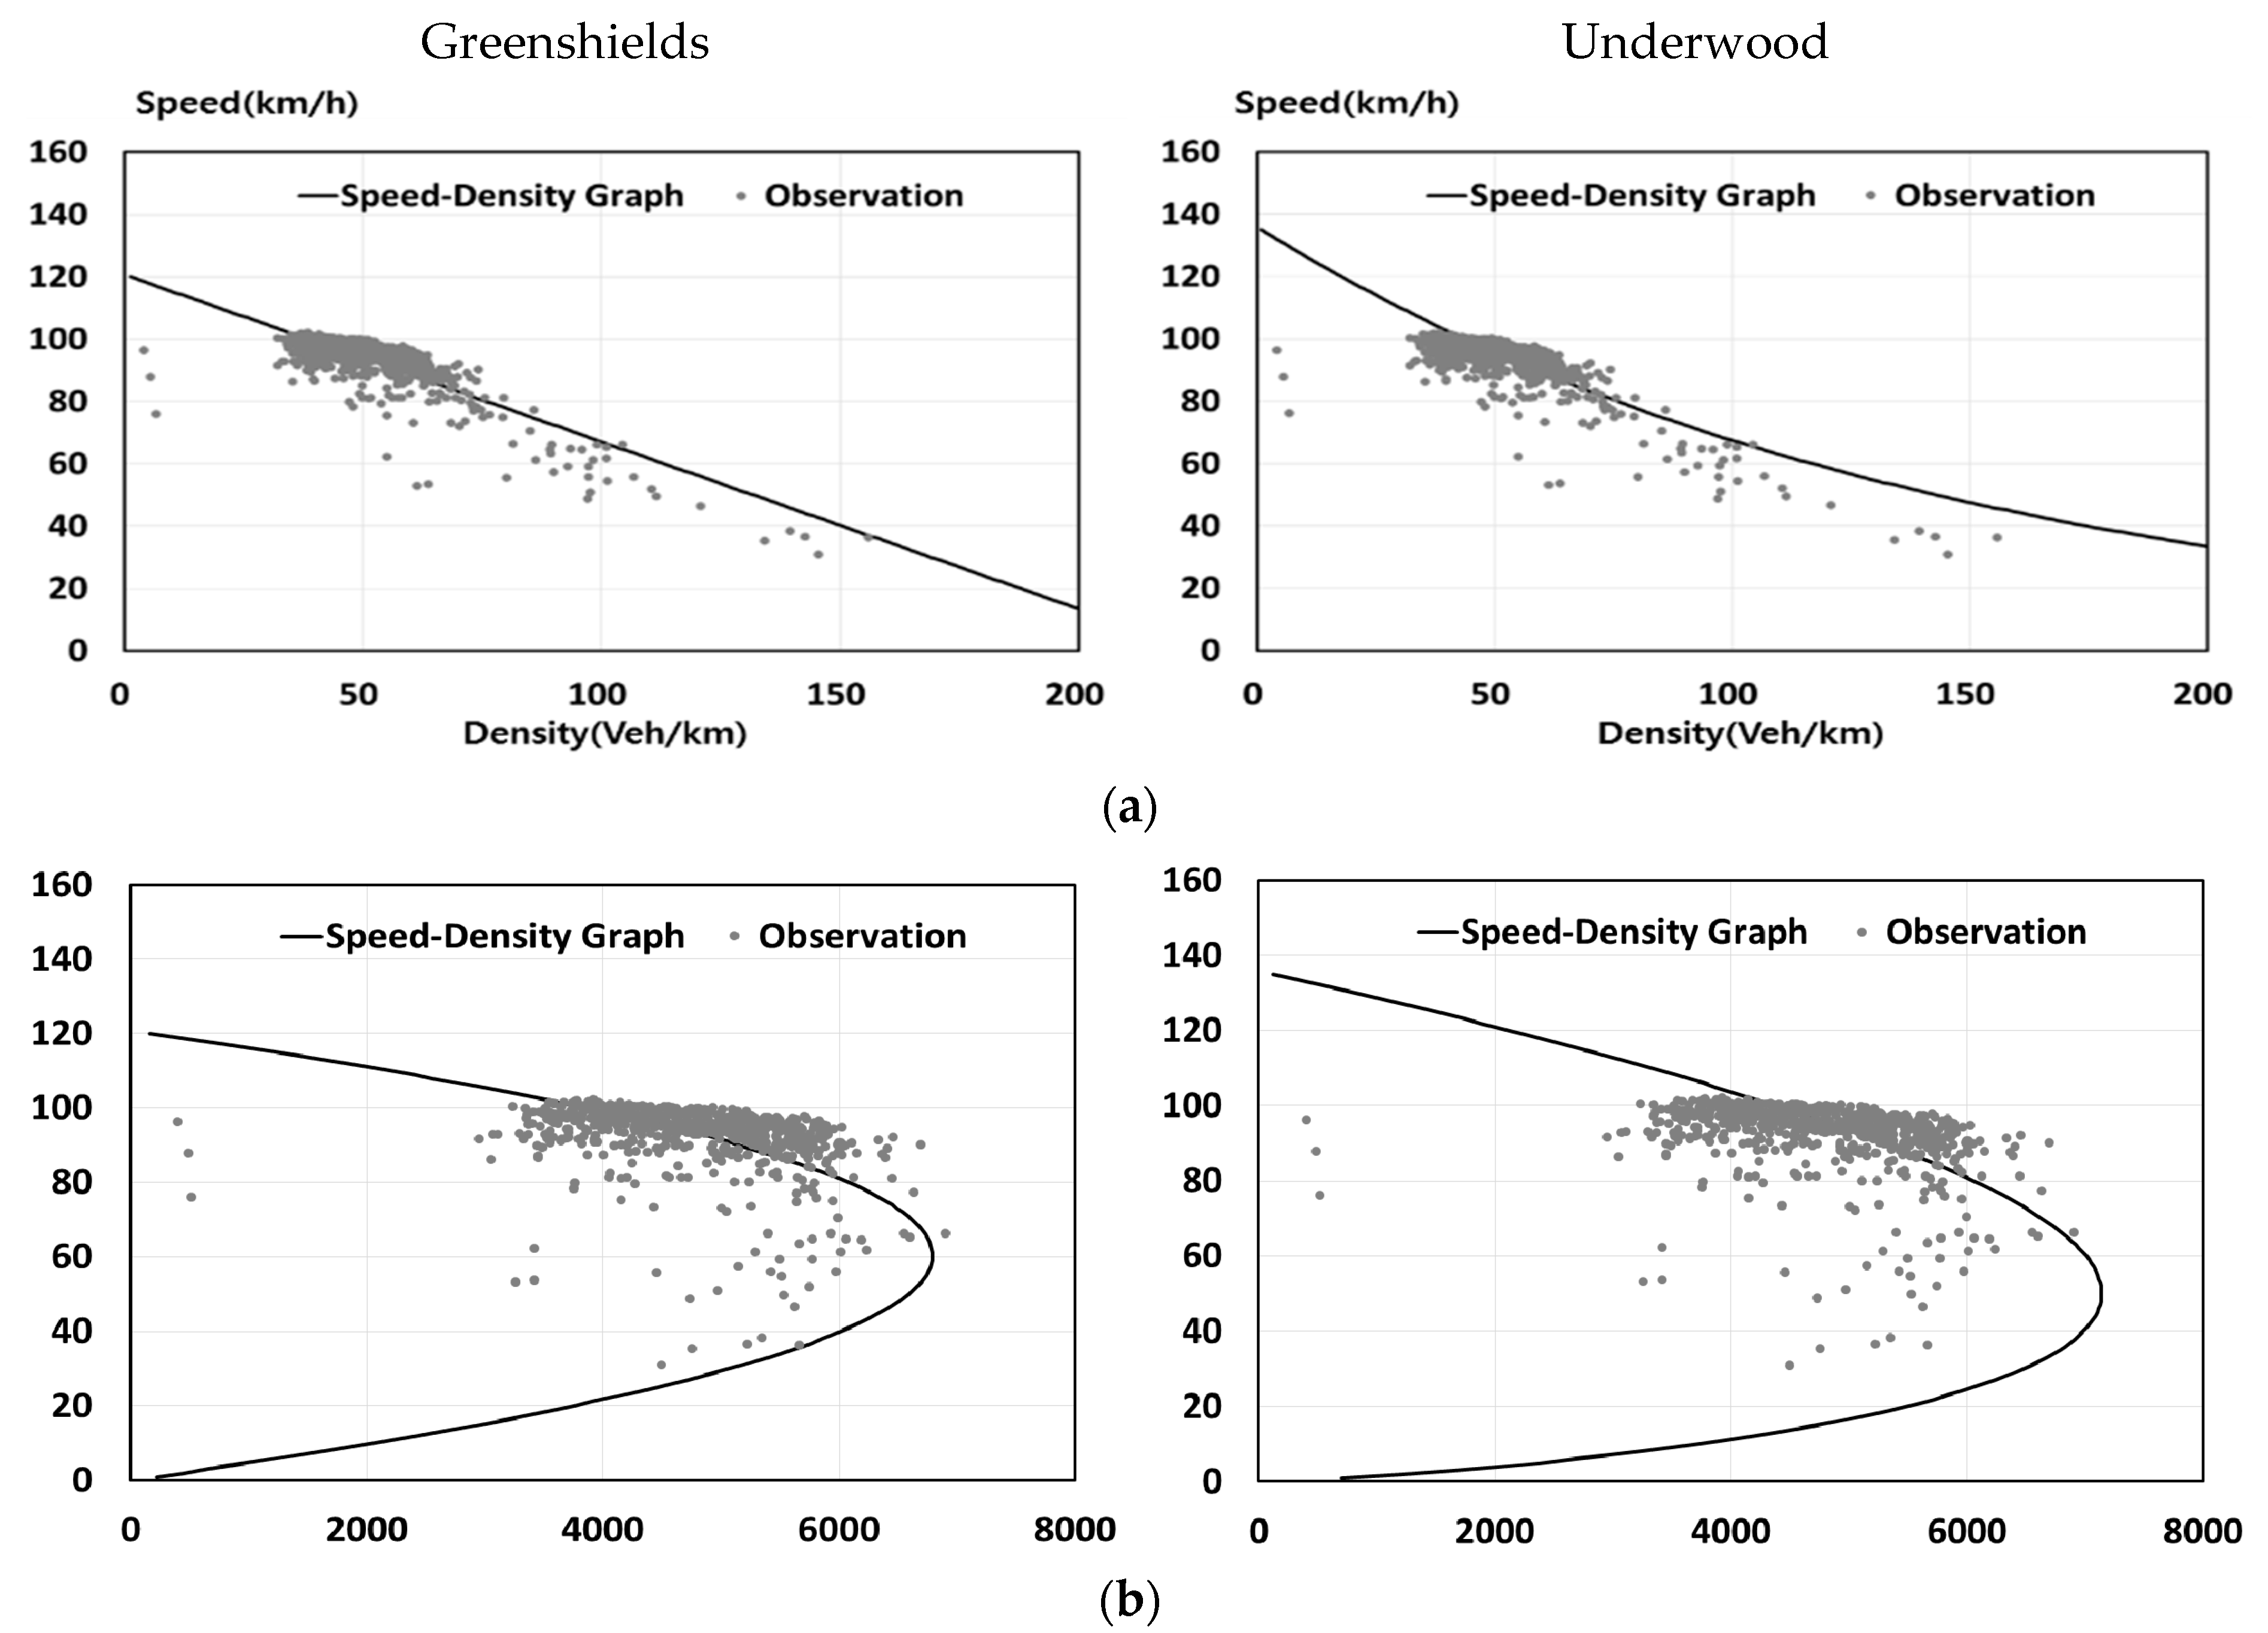
As VDS data were analyzed, the number of sections that were used as commuting routes for transferring public agencies was 297. Among these, 58 agencies passed through the routes between Cheonan Junction (JC) and Dongtan JC. As traffic-flow models were designed for each section, only two of the models, that is, Greenshields and Underwood, were found to be appropriate. In the case of Greenberg, log functions were applied, and the speed was observed to increase indefinitely if the density was low; this is inappropriate for express highways, where the speed is generally high and the density is low.
Figure 4 shows the relation between speed and density and between speed and traffic volume depending on the traffic-flow models used in the section between Cheonan Interchange (IC) and the North Cheonan IC, which is one of the commuting routes. As R2 in this section was compared numerically by using the values of MAPE and RMSE, Greenshields is the appropriate model formula to use in this section. In the same process, optimal models were selected for each of the 297 commuting routes, with model formulas derived accordingly (See Table 3).
3. Benefit Analysis of Carpooling Introduction
The benefits of introducing the carpooling service may be divided into direct and indirect benefits. The direct benefits of using the carpooling service include the saving of access cost, waiting time, and the fares of using modes of public transportation by the passengers. In addition, the drivers receive fares from passengers. Moreover, non-carpooling drivers using the same express highway sections can drive in improved driving environments, thus benefitting indirectly from the introduction of carpooling by saving costs such as those required for car operation, travel time, accident reduction, environmental pollution, and noise.
Scenarios were analyzed on the assumption that the carpooling app service dedicated to each agency would be utilized. It was also assumed that the carpooling service would be used only on working days. The analysis was conducted reflecting the time value of each car type (as of 2017), and it was based on the cost items presented in MOLIT [19].
Direct benefits include the saving of waiting or transfer time and fares that would have been spent on public transportation. However, we assumed in the estimation of expected carpooling demands that everyone would use a private car for commuting. Therefore, vehicle operating costs and tolls were only included as cost items.
Direct benefits were analyzed in two scenarios of carpooling: considering a minimum of two occupants and a maximum of four occupants. For benefit estimation, the cost differences in scenarios 1 and 2 were used, in which the carpool service was used in terms of the cost incurred during the commuting of all of the drivers using their own cars (without case, base alternative).
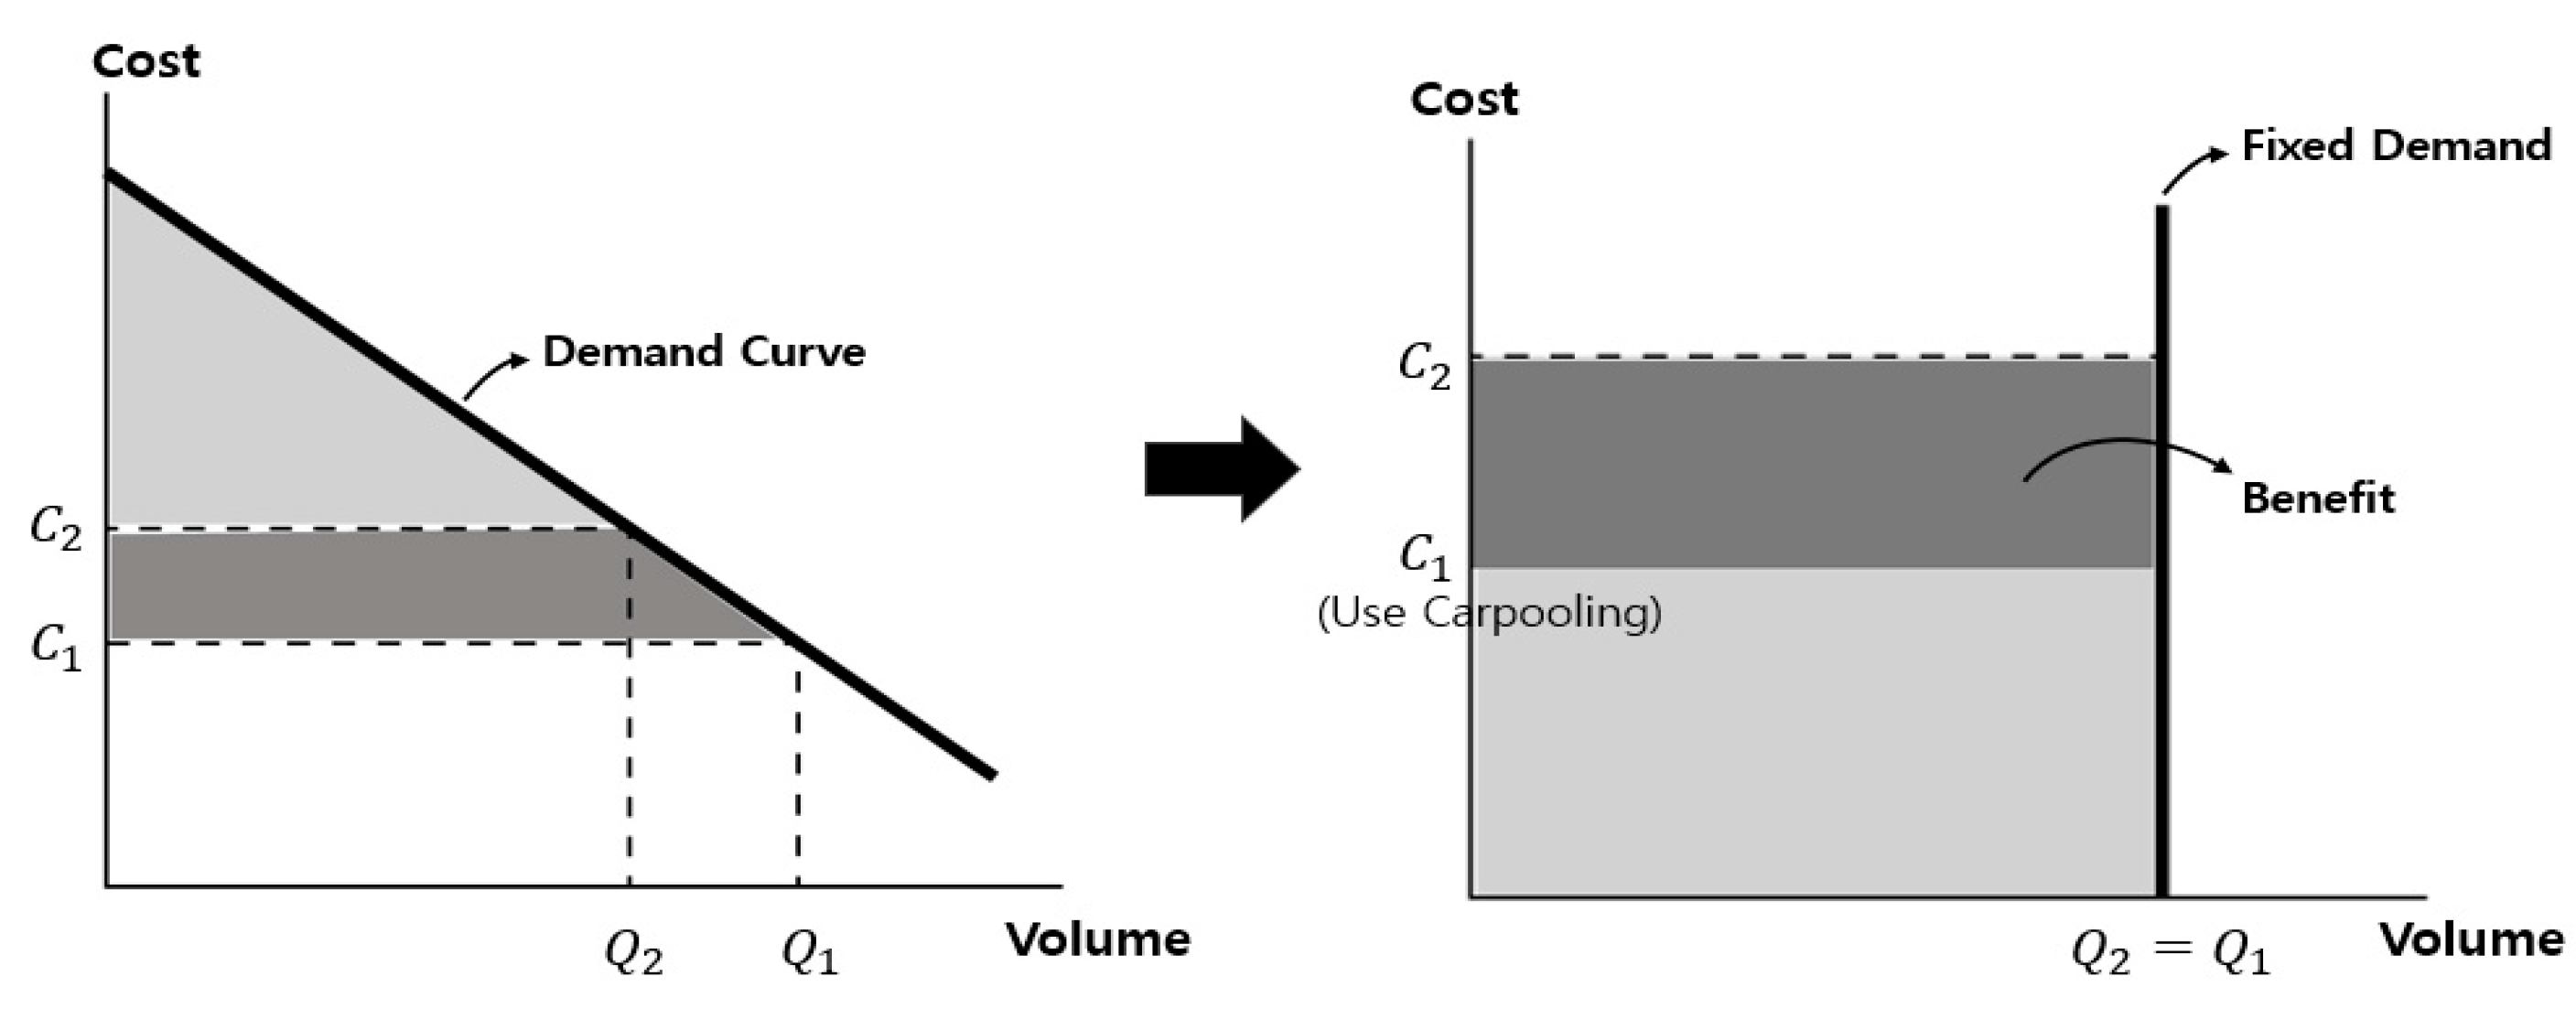
The change in the traffic volume on the existing highways would be insignificant even after introducing carpooling (the shift in demand from other transportation modes would be negligible). Therefore, the concept of consumer surplus was applied in our study to estimate the direct benefits: the gap between the cost without and the cost with carpooling introduction when the general volume of demand was fixed (see Figure 5).
where:
- .
- .
In the case of no carpooling, the cost per day was approximately 315000 USD. The direct benefits for scenarios 1 and 2 with the carpooling service were 158000 USD and 235000 USD, respectively (Table 4). When these figures (total benefits of scenarios 1 and 2) were converted into benefits per year, the amounts of benefits were 41014000 USD and 61275000 USD for scenarios 1 and 2, respectively.
As the base alternative for estimating the indirect benefits from the carpooling introduction, VDS highway data of 2017 was analyzed to examine the traffic volume and travel speed for each section in the case of no carpooling service. To estimate the traffic volume in each section with the use of the carpooling service, the carpooling demand at each agency was calculated using Equation (1) based on the traffic volume without the use of a carpooling service, and then compared with the traffic volume on the highway sections with a carpooling service at each time slot.
Figure 6 shows the result of analyzing the section of Cheonan IC–North Cheonan IC. With the introduction of the carpooling service, traffic congestion decreased, and the average travel speed increased (by as much as 10 km/h). Therefore, the introduction of the carpooling service was shown to have a positive effect on the travel speed in the road sections. By repeating this analysis process, indirect benefits were calculated based on the difference in the traffic volume and travel speed at each time slot of commuting hours before and after the introduction of the carpooling service.
As the carpooling service is applicable mostly to passenger cars, we limited the carpooling demand to passenger cars, and estimated the traffic volume of each car type on each road section after the carpooling service was provided based on the Statistical Yearbook of Traffic Volume. Items for estimating indirect benefits included car-operation cost, travel-time cost, accident-reducing cost, environmental pollution cost, and noise cost, as suggested in MOLIT [19].
Table 5 shows the results of calculating benefits from the introduction of the carpooling service during commuting hours based on the reduction of traffic demand in each time slot, and in comparison with the cost in the sections without the carpooling service.
The yearly benefits from the introduction of the carpooling service during commuting hours were estimated at 173 million USD and 217 million USD per year during the commute to and from work, respectively, in the case of scenario 1. In scenario 2, the amount of benefits during the commute to and from work hours was 263 million USD and 295 million USD per year, respectively. As shown in Table 5, the noise cost increased after the introduction of carpooling, which was probably because of the increase in travel speed in the sections as the traffic volume decreased.
4. Conclusions and Future Research
With the aim of proposing a solution to various problems, such as parking difficulties and the traffic congestion that results from the increasing number of vehicles, we examined the socio-economic costs and benefits of introducing the carpooling service, which is a major example of shared transport, to innovation cities transferring public agencies.
To this end, the demand for the use of carpooling among public agencies transferring innovation cities was estimated based on the findings of the existing research. To estimate changes in the traffic demand and travel speed in each road section according to the scenarios of introducing carpooling, VDS traffic data of the Korea Highway Corporation was referred, and the optimal traffic-flow model was selected for highway sections that are used as routes to and from each agency.
Benefits were divided into direct benefits achieved from the use of the carpooling service and indirect benefits achieved from improving the environment for existing road users. The analysis results showed that the direct benefit of the introduction of the carpooling service was between 41,014–61,275 thousand USD per year. Moreover, the indirect benefits were between 389,536–557,991 thousand USD per year. These findings indicate that carpooling has significant socio-economic cost-saving effects, and could play a key role in managing traffic jams, demands, and environmental pollution in the future. In addition, the findings of our study will be utilized as basis information for the successful introduction of the carpooling service.
However, the study still has several limitations. It would be possible to derive more reliable research findings if a survey was conducted to consider carpooling users’ characteristics (commuting hours in the morning and evening, frequency of use on each day of the week, residential area, etc.) and regional characteristics (demands and frequency for carpooling use depending on the distance, etc.). Additionally, this study was conducted in reference to the “Guidelines for Evaluation on Investment into Traffic Facilities” and by utilizing an actual carpooling service app to secure the objectivity of benefits. As more benefits could be achieved from the use of the carpooling service than those mentioned in our study, it is necessary to include and analyze more varied items of benefits in the future.
Author Contributions
The authors confirm contribution to the paper as follows: concept idea and design: M.D.; data collection: H.J.; analysis and interpretation of results: M.D. and H.J.; draft manuscript preparation: M.D. and H.J.
Funding
This research received no external funding.
Conflicts of Interest
The authors declare no conflicts of interest.
References
- Cooke, P. Green governance and green cluster: Regional & national policies for the climate change challenge of Central & Eastern Europe. J. Open Innov. Technol. Mark. Complex. 2015, 1, 1. [Google Scholar] [CrossRef]
- Park, C.; Park, J.; Choi, S. Emerging clean transportation technologies and distribution of reduced greenhouse gas emissions in Southern California. J. Open Innov. Technol. Mark. Complex. 2017, 3, 8. [Google Scholar] [CrossRef]
- Li, J.; Embry, P.; Mattingly, S.; Sadabadi, K.; Rasmidatta, L.; Burris, M. Who chooses to carpool and why?: Examination of Texas carpoolers. J. Transp. Res. Board 2007, 2021, 110–117. [Google Scholar] [CrossRef]
- Correia, G.; Viegas, J. Carpooling and carpool clubs: Clarifying concepts and assessing value enhancement possibilities through a Stated Preference web survey in Lisbon, Portugal. Transp. Res. Part A Policy Pract. 2011, 45, 81–90. [Google Scholar] [CrossRef]
- Stiglic, M.; Agatz, N.; Savelsbergh, M.; Gradisar, M. Making dynamic ride-sharing work: The impact of driver and rider flexibility. Transp. Res. Part E Logist. Transp. Rev. 2016, 91, 190–207. [Google Scholar] [CrossRef]
- Caulfield, B. Estimating the environmental benefits of ride-sharing: A case study of Dublin. Transp. Res. Part D Transp. Environ. 2009, 14, 527–531. [Google Scholar] [CrossRef] [Green Version]
- Aarthi, R. A smart real time ridesharing and travel assistance. Int. J. Eng. Comput. Sci. 2015, 4, 2319–7242. [Google Scholar]
- Gargiulo, E.; Giannantonio, R.; Guercio, E.; Borean, C.; Zenezini, G. Dynamic ride sharing service: Are users ready to adopt it? Procedia Manuf. 2015, 3, 777–784. [Google Scholar] [CrossRef]
- Amey, A. A proposed methodology for estimating rideshare viability within an organization, applied to the MIT community. In Proceedings of the Transportation Res Boar 90th Annual Meeting (TRB 2011), Washington, DC, USA, 23–27 January 2011; pp. 1–16. [Google Scholar]
- Neoh, J.; Chipulu, M.; Marshall, A.; Tewkesbury, A. How commuter’s motivations to drive relate to propensity to carpool: Evidence from the United Kingdom and the United States. Transp. Res. Part A Policy Pract. 2018, 110, 128–148. [Google Scholar] [CrossRef]
- Jacobson, S.; King, D. Fuel saving and ridesharing in the US: Motivations, limitations, and opportunities. Transp. Res. Part D Transp. Environ. 2009, 14, 14–21. [Google Scholar] [CrossRef]
- Yang, H.; Huang, H. Carpooling and congestion pricing in a multilane highway with high-occupancy-vehicle lanes. Transp. Res. Part A Policy Pract. 1999, 33, 139–155. [Google Scholar] [CrossRef]
- Kerner, B.S. The physics of traffic: Empirical freeway pattern features. Eng. Appl. Theory 2004. [Google Scholar] [CrossRef]
- May, A.D. Traffic Flow Fundamentals; Englewood Cliffs: Prentice Hall, NJ, USA, 1990; ISBN 0-13-926072-2. [Google Scholar]
- Furuhata, M.; Dessouky, M.; Ordonez, F.; Brunet, M.; Wang, X.; Koenig, S. Ridesharing: The state-of-the-art and future directions. Transp. Res. Part B Methodol. 2013, 57, 28–46. [Google Scholar] [CrossRef]
- Ministry of Land Infrastructure and Transport. Available online: Innocity.molit.go.kr/ (accessed on 16 February 2017).
- Kwon, Y.; Kang, S.; Go, S.; Yoon, M. A Study on the Improvement and Support System of Innovative Urban Transportation Infrastructure; The Korea Transport Institute: Sejong, Korea, 2014. [Google Scholar]
- Jung, Y.; Park, Y. Civil Servant Recognition Survey on Relocation of Institution Sejong City; Korea Institute of Public Administration: Seoul, Korea, 2014. [Google Scholar]
- Ministry of Land Infrastructure and Transport (MOLIT). Traffic Infrastructure Assessment Guidelines; Ministry of Land Infrastructure and Transport: Seoul, Korea, 2017.
Figure 1.
Inter-Company (Colleague) Based Carpooling Service.

Figure 2.
Concept of Carpooling Service. Source: [15].
Figure 2.
Concept of Carpooling Service. Source: [15].

Figure 3.
Innovation Cities Transferring Public Agencies.

Figure 4.
Comparison of Two Traffic-Flow Models on Cheonan Interchange (IC)–North Cheonan IC Section. (a) Speed–Density Model; (b) Speed–Volume Model.
Figure 4.
Comparison of Two Traffic-Flow Models on Cheonan Interchange (IC)–North Cheonan IC Section. (a) Speed–Density Model; (b) Speed–Volume Model.

Figure 5.
Fixed demand curve.

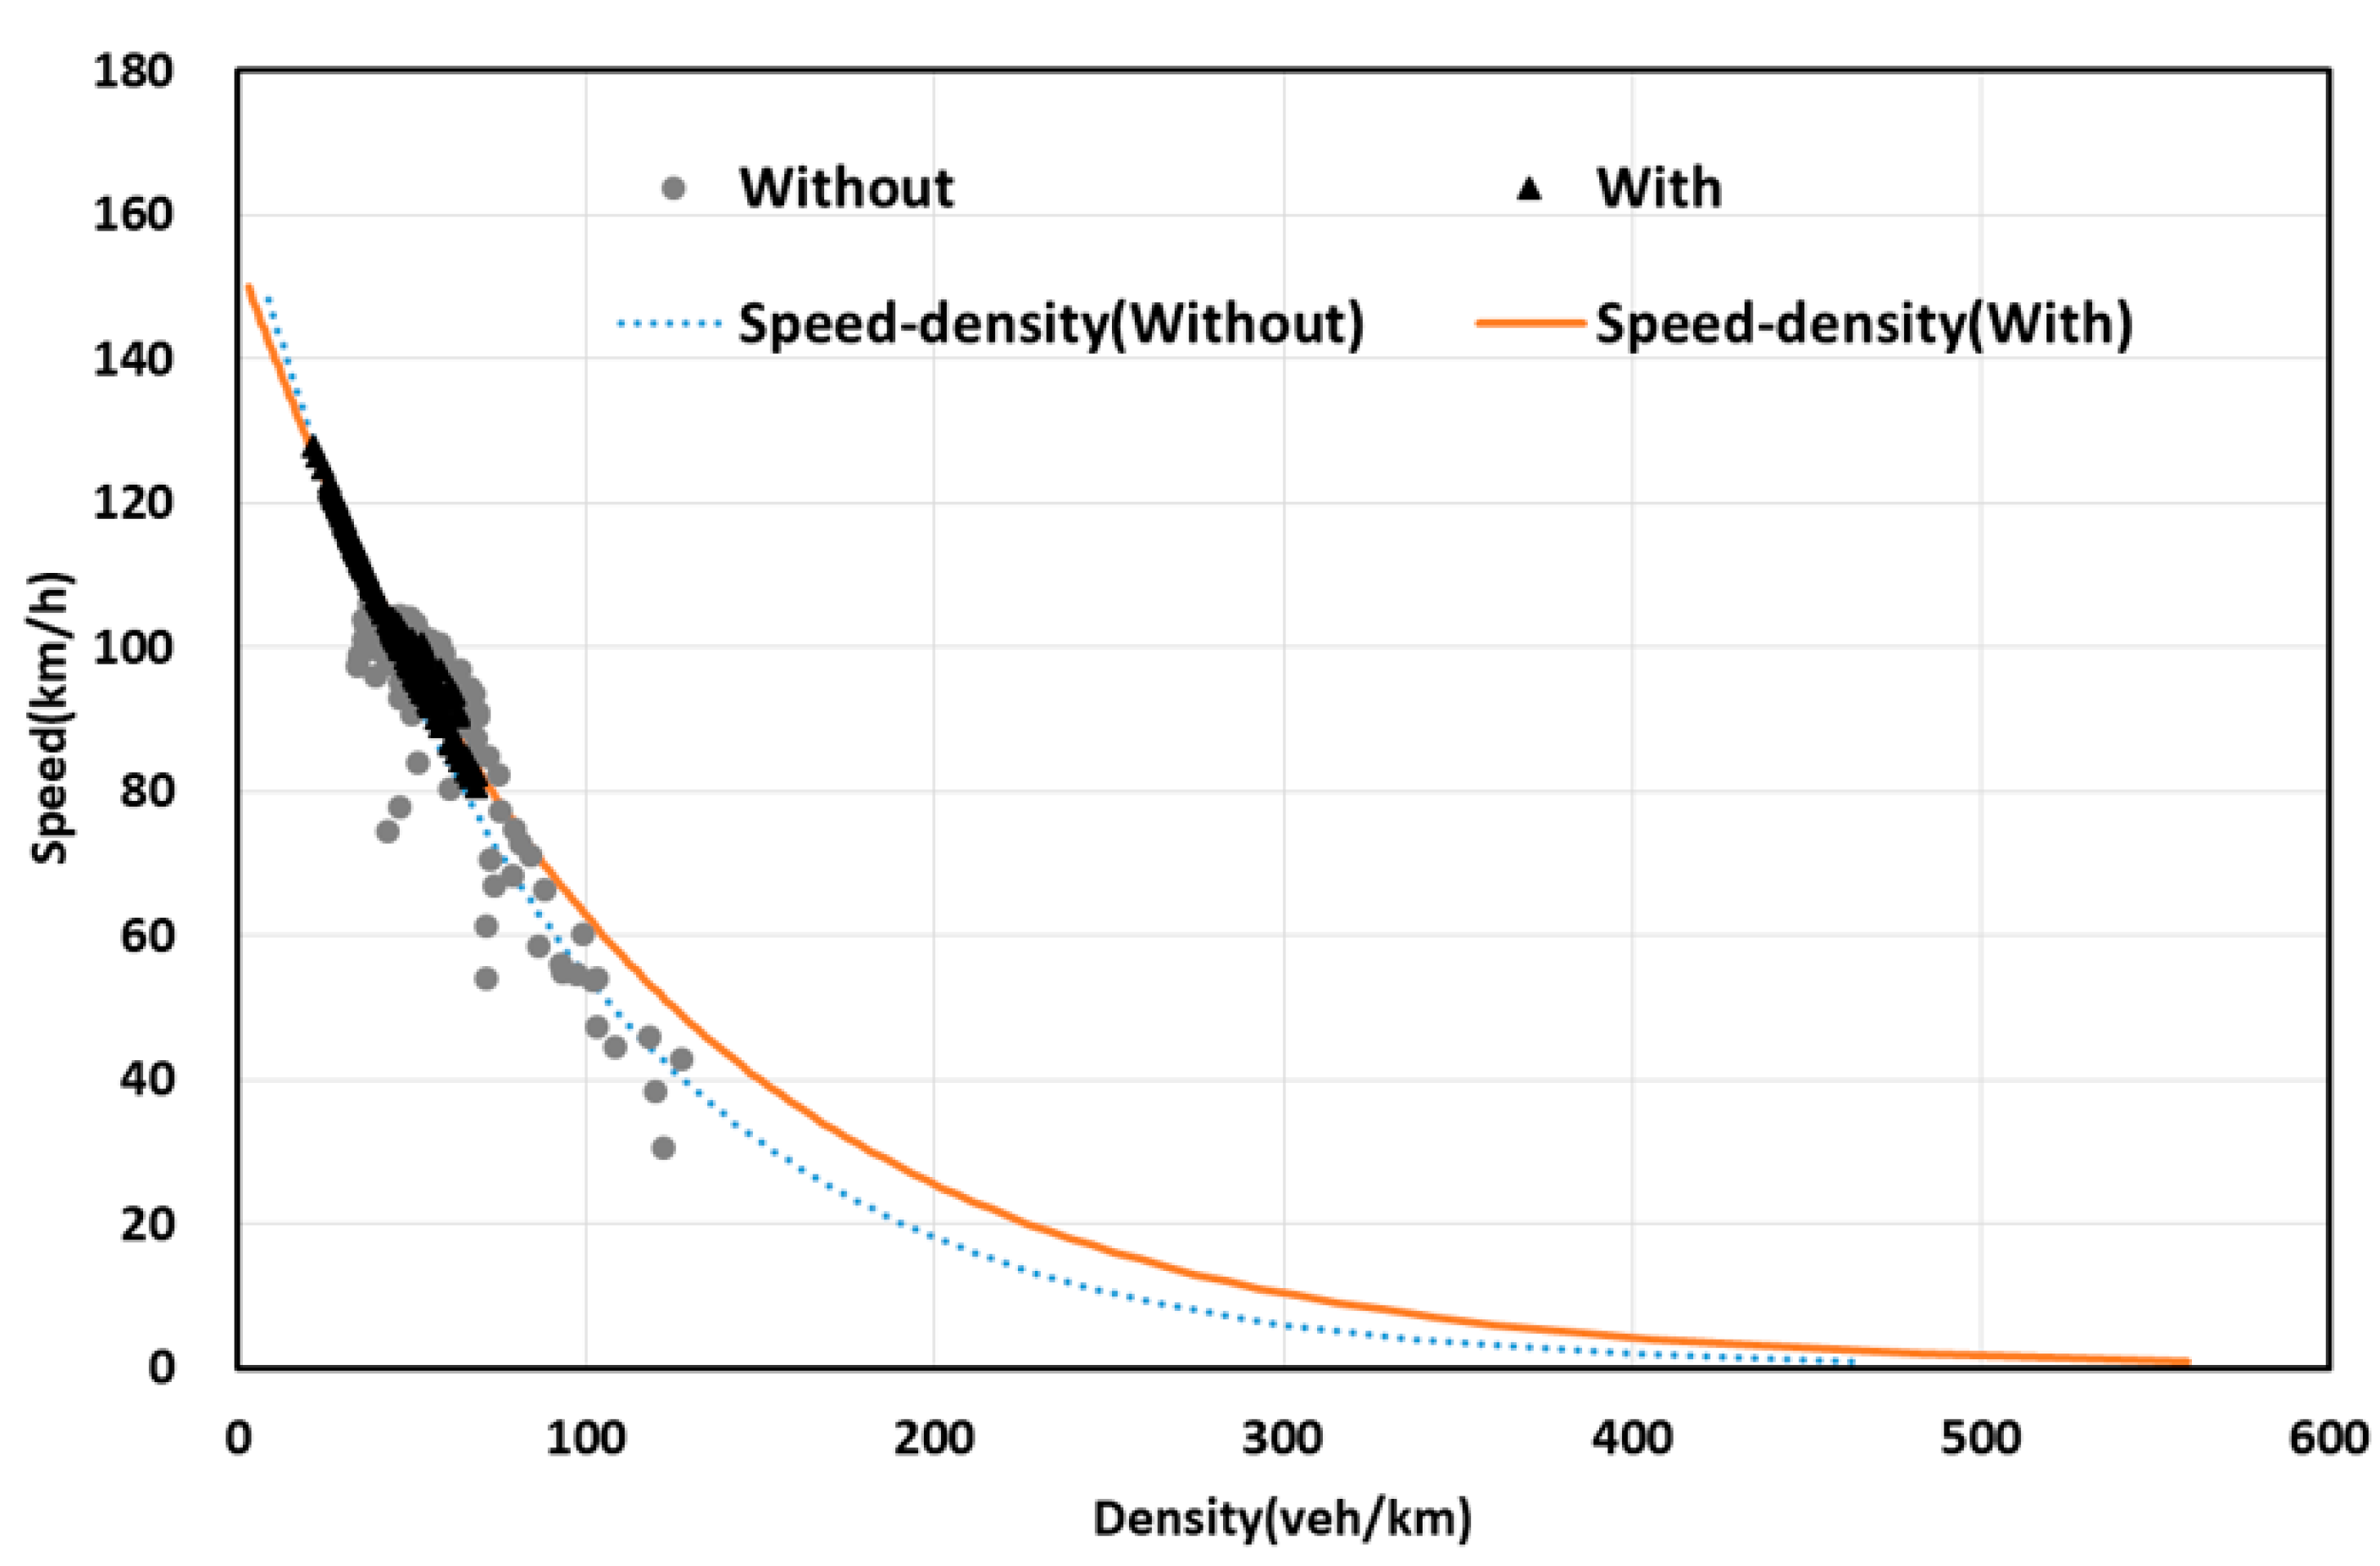
Figure 6.
Comparison of With and Without the Carpooling Service (Speed–Density Graph).


Table 1.
Carpooling Demand of Public Agencies in Innovation Cities.
| No. | Agency Name | Region | Target of Employee (Number of People) | Expected Carpooling Demand (Number of People) | Scenario (the Number of Vehicles) | |
|---|---|---|---|---|---|---|
| Scenario 1 | Scenario 2 | |||||
| 1 | KEPCO-ENG | Gimcheon | 2494 | 175 | 88 | 44 |
| 2 | NHIS | Ganwon | 1192 | 158 | 79 | 40 |
| 3 | NHI | Chungbuk | 1106 | 207 | 103 | 52 |
| 4 | HIRA | Gangwon | 1088 | 145 | 72 | 36 |
| 126 | NPS | Jeonju | 573 | 42 | 21 | 11 |
| 127 | KORES | Gangwon | 550 | 73 | 37 | 19 |
| 128 | KTO | Gangwon | 518 | 53 | 27 | 14 |
| 129 | KFRI | Jeonju | 505 | 37 | 19 | 10 |
| Total | 44363 | 3607 | 1803 | 902 | ||
Table 2.
Traffic Flow Models.
| Model | Speed–Density Model | Speed–Volume Model | Parameters |
|---|---|---|---|
| Greenshields | , | ||
| Greenberg | , | ||
| Underwood | , |
Table 3.
Traffic-Flow Model Results of Top 5 Sections. JC: Cheonan Junction; MAPE: mean absolute per error; RMSE: root mean square error.
Table 3.
Traffic-Flow Model Results of Top 5 Sections. JC: Cheonan Junction; MAPE: mean absolute per error; RMSE: root mean square error.
| Road Section | Length (km) | GS 3 | UW 4 | MAPE | RMSE | Regression Model | |||||
|---|---|---|---|---|---|---|---|---|---|---|---|
| GS | UN | GS | UN | ||||||||
| CTW 1 | Dongtan JC–Osan IC | 3.89 | 258 | 99 | 200 | 103 | 1529 | 2261 | 0.35 | 0.54 | |
| Osan IC–Anseong JC | 13.27 | 515 | 101 | 500 | 103 | 5868 | 8837 | 1.12 | 1.60 | ||
| Anseong JC–Anseong IC | 4.83 | 950 | 107 | 1000 | 107 | 1496 | 2135 | 3.27 | 4.53 | ||
| Anseong IC–North Cheongan IC | 11.61 | 458 | 107 | 333 | 108 | 5142 | 5204 | 1.00 | 1.01 | ||
| North Cheongan IC–Cheonan IC | 8.36 | 500 | 94 | 500 | 95 | 5649 | 7594 | 5.07 | 6.73 | ||
| CFW 2 | Osan IC–Dongtan JC | 3.89 | 197 | 115 | 111 | 135 | 568 | 476 | 0.09 | 0.08 | |
| Anseong JC–Osan IC | 13.27 | 179 | 131 | 100 | 159 | 403 | 355 | 0.07 | 0.06 | ||
| Anseong IC–Anseong JC | 4.83 | 157 | 114 | 77 | 145 | 548 | 818 | 0.09 | 0.13 | k | |
| North Cheongan JC–Anseong IC | 11.61 | 222 | 123 | 125 | 144 | 698 | 690 | 0.12 | 0.11 | ||
| Cheongan JC–North Cheonan IC | 8.36 | 225 | 121 | 143 | 136 | 1007 | 1304 | 0.18 | 0.22 | ||
1 Commute to work; 2 Commute from work; 3 Greenshields; 4 Underwood.
Table 4.
Direct Benefit Results Based on Carpooling Scenarios (Per Day).
| Agency Name | Demand (the Number of Vehicles) | Expense (USD) | Benefit (USD) | |||||
|---|---|---|---|---|---|---|---|---|
| Not Used | Used | Not Use | SN 1 | SN 2 | SN 1 | SN 2 | ||
| SN 1 1 | SN 2 2 | |||||||
| HIRA | 145 | 72 | 108 | 5096 | 2549 | 1277 | 2549 | 3281 |
| NFS | 23 | 11 | 17 | 1132 | 566 | 286 | 566 | 892 |
| KRLIA | 14 | 7 | 11 | 883 | 441 | 221 | 441 | 639 |
| KOROAD | 42 | 21 | 32 | 2214 | 1106 | 553 | 1106 | 1660 |
| KEDI | 82 | 41 | 62 | 3980 | 1174 | 998 | 1990 | 2982 |
| KEIS | 44 | 22 | 33 | 2348 | 1615 | 588 | 1174 | 1760 |
| KICE | 61 | 31 | 46 | 3230 | 2095 | 813 | 1615 | 2419 |
| KGS | 69 | 35 | 52 | 4188 | 1217 | 1049 | 2096 | 3140 |
| Total | 3607 | 1443 | 2706 | 314737 | 157592 | 79966 | 157145 | 234771 |
1 Scenario 1; 2 Scenario 2.
Table 5.
Indirect Benefits of Carpooling Service (Unit: One Thousand USD).
| Scenario/Commute | Vehicle-Operating Cost | Travel-Time Cost | Accident Cost | Environmental Cost | Noise Cost | Total | |
|---|---|---|---|---|---|---|---|
| SN 1 1 | Commute to work | 50227 | 68153 | 2275 | 53230 | −1001 | 172884 |
| Commute from work | 43403 | 144313 | 2275 | 30027 | −3458 | 216652 | |
| SN 2 2 | Commute to work | 77252 | 80346 | 3458 | 102821 | −910 | 262966 |
| Commute from work | 66788 | 169973 | 3458 | 57962 | −3276 | 294995 | |
1 Scenario 1; 2 Scenario 2.
© 2018 by the authors. Licensee MDPI, Basel, Switzerland. This article is an open access article distributed under the terms and conditions of the Creative Commons Attribution (CC BY) license (http://creativecommons.org/licenses/by/4.0/).
Share and Cite
MDPI and ACS Style
Do, M.; Jung, H. The Socio-Economic Benefits of Sharing Economy: Colleague-Based Carpooling Service in Korea. J. Open Innov. Technol. Mark. Complex. 2018, 4, 40. https://0-doi-org.brum.beds.ac.uk/10.3390/joitmc4030040
AMA Style
Do M, Jung H. The Socio-Economic Benefits of Sharing Economy: Colleague-Based Carpooling Service in Korea. Journal of Open Innovation: Technology, Market, and Complexity. 2018; 4(3):40. https://0-doi-org.brum.beds.ac.uk/10.3390/joitmc4030040
Chicago/Turabian StyleDo, MyungSik, and HoYong Jung. 2018. "The Socio-Economic Benefits of Sharing Economy: Colleague-Based Carpooling Service in Korea" Journal of Open Innovation: Technology, Market, and Complexity 4, no. 3: 40. https://0-doi-org.brum.beds.ac.uk/10.3390/joitmc4030040