1. Introduction
Under current conditions, nearly all countries in Eastern Europe seem to be still in the very early stages of local Coronavirus outbreaks, but things are changing rapidly. The new epidemic situation is becoming a critical factor in the government’s spending on health, which is increasing significantly every day in the struggle for human lives [
1]. Rapid and unpredictable spread of the virus made it necessary to make a decision about mass closing of borders between countries across the globe. Companies were faced with border closures overnight; in many countries, all air and land communications were forcibly blocked as part of quarantine measures [
2].
The trade and services sector in the economy is primarily affected by the epidemic. Quarantine measures have a negative impact on the volume of exports and imports, which means that they have a negative impact on the economy (the drop in exports means the drop in currency supply, while the drop in imports is a decrease in tax revenues and therefore the дoxoдoв budget) [
3].
Another channel of negative impact is a high dependency on remittance flows from Europe, which will decline amid lower economic activity. Among Emerging market Forex Trading EM FX, the currencies of emerging Europe look better than those of commodity exporters look but still have lost around 9% of their value against the USD, which is more than most Asian currencies [
4]. For Central Europe, the biggest concern is trade links with Germany. These countries have a total trade turnover with Germany of 25% to almost 50% of their respective GDP [
5].
Commodity-exporting countries face double challenges, as terms of trade and export volumes deteriorate simultaneously along with countries’ isolation. Germany and Italy are the most important supply chains for Eastern European countries, but China also plays a significant role (2% to 3.5% of value added) for many countries [
5], especially with regard to Russia’s supply chain with China as its major trading partner (China accounts for more than 13% of exports and more than 22% of imports). The country loses about one billion rubles due to the decrease in trade turnover with China [
6].
The countries of Eastern Europe, which are heavily dependent on the tourism industry, are also particularly affected by the pandemic. As far as Bulgaria is concerned, tourism accounts for 10.8% of GDP [
7] and is one of the country’s main sources of income. However, it should be noted that with the exception of Poland and Russia, tourism accounts for between 6% and 10.8% of GDP in the rest of Eastern Europe [
7]. Consequently, the pandemic will make them lose this share of GDP. Remarkably, in addition to the tourism business, which has already suffered billions of losses not only in Eastern European countries, but also worldwide, the hotel industry and catering are also affected.
The economies of almost half of the countries in Eastern Europe are heavily dependent on the dynamics of oil prices, especially exporting countries, in particular Russia, which currently faces a classic shock of changing terms of trade on the energy market. More and more countries are imposing restrictions on movement and other measures aimed at curbing the epidemic, so the demand for oil is falling at record rates. Oil has fallen by almost 50% since the beginning of 2020 [
8] and continues to do so, despite the fact that Organization of the Petroleum Exporting Countries (OPEC) members, Russia, and a number of other countries have agreed to reduce oil production until 2022. Stronger measures against the spread of the pandemic are provoking a significant reduction in demand. According to the latest data from Goldman Sachs, the coronavirus pandemic will slash demand by 19 m bpd in April and May in 2020 [
9].
Under the current circumstances, Russia has slightly reduced the impact of the price shock on the economy, thanks to the enormous efforts made since 2014 to isolate the economy from oil price cycles [
10]. Nevertheless, the Russian currency is still getting weaker, provoking an imbalance in the budget. With the strengthening of quarantine measures in the long run, these risks may also be projected on currencies of countries with significant balance of payments deficits (Ukraine, Moldova, Belarus). In the end, the deficit may widen further due to negative export trends, as these countries are heavily dependent on capital inflows, which have become increasingly scarce in the epidemic.
The prolongation of the mass quarantine causes a recession in the economies of Eastern European countries, which cannot afford such harsh measures as authoritarian China. Therefore, we can assume that the quarantine epidemic will last longer there, and that the economic crisis will therefore worsen. Rich Western countries will be able to borrow huge sums of money to introduce large-scale tax incentives, but many emerging markets (including Eastern Europe) will not be able to do so. Reduced financing will require tighter fiscal policy, exacerbating the recession and effective timely preventive measures to sustain the economy. The role of International Monetary Fund (IMF) and other international lenders will also be critical to mitigating the worst downturn in emerging markets, with an adequate and rapid assessment of the state of the economy. The significant variation in the percentage of pandemic coverage, period and magnitude by country (as demonstrated by China and Europe as a percentage of the total population infected) requires predicting the epidemic situation in Eastern Europe in light of current infection patterns and factors contributing to/constraining the spread of the virus. Based on the advantages and disadvantages of the existing practical models for predicting the epidemic situation [
2,
11], this study has put forth a model for predicting the threshold of epidemiological saturation in Eastern Europe with reference to the influence of factors that determine the speed and number of infected, taking into account the dynamics of the number of infected worldwide and experience in combating the epidemic in China.
The study has the following structure:
Section 2 presents an analysis of the latest scientific developments in assessing the impact of the pandemic on economic development;
Section 3 presents a system of indicators and methodology for determining predictive scenarios for the impact of the COVID-19 pandemic on the economies of certain Eastern European countries;
Section 4 presents data analysis, providing a clear and objective account of the results obtained through the application of scientific methods;
Section 5 and
Section 6 provides discussion of the results, conclusions and recommendations.
2. Literature Review
Scientists, such as Lee and McKibbin [
12,
13,
14,
15,
16,
17], considered the specific features of changes in economic indicators influenced by the pandemic spread. In particular, the impact of COVID-19 on economics was discussed in the papers [
18,
19]. Emphasis was placed on research into the risks, rise in the risk-premium and factors of changing consumer demand. McKibbin and Sidorenko [
13] predicted that closed borders, suspension of tourism business, and slowdown in the trade supply chain at the country level will cause a 0.8% GDP damage. If we consider the damage on a global economic scale, the loss is assumed to be 12.6% of GDP.
The Congressional Budget Office [
20] also studied the change in economic development under the influence of severe and mild forms of pandemics (such as Spanish flu of 1918–1919 and the 1957 and 1968 pandemics) due to: changes in consumer demand, reversal of the behavior of the population as a factor in the size and quality of the labor force, human capital. With these factors changing, scientists predicted a 1% change in GDP in the case of a mild epidemic. In case of a severe form of epidemic and characterized by the duration of spread, the annual GDP level will decrease by 4%.
It should be noted that such factors and their impact on the economy under the conditions of the general pandemic were also studied by Burns, van der Mensbrugghe and Timmer [
21]. According to their estimates, the global GDP may drop to 3.1%, with a consumer demand shock accounting for 2/3 of the decline in economic growth.
Evans, Goldstein and Popova also took the position that consumer demand shock is a fundamental factor in the economic seduction [
22]. Researching the Ebola epidemic in Western Africa in 2014 by means of the computable general equilibrium (CGE) model scientists developed scenarios for the development of regional and global economies in the conditions of the spread of the heavy and light form of Ebola under the influence of factors such as labor shortages, rising transaction and trade costs, etc.
Keogh-Brown et al. [
23] used the development of a macroeconomic model to explain the most sensitive factors of socio-economic development under the conditions of the spread of the pandemic and the introduction of strict quarantine measures on the example of UK. Empirically, the scientists proved that in the case of a moderate form of the epidemic, the country’s GDP will decrease by 2.5%. If the pandemic takes a severe form of spread, the economic losses will be more significant, amounting to 6% of UK GDP. Another interesting point in this paper is that, despite a reduction in the labor force, consumer demand, increased mortality and morbidity, the most significant negative factor in the development of the national economy, as the authors prove, is the closure of schools.
The sensitivity of economic development factors to the epidemic was also studied by Dixon et al. [
24]. Scientists studied the impact of the H1N1 epidemic in the US based on quarterly data on reduction in tourism industry development, reduction in labor costs, increase in health care system costs and significant reduction in leisure spending and using my CGE predicted a 1.6% reduction in GDP for the next two quarters.
However, it should be noted that earlier methods of modeling the impact of the epidemic on economic development are fundamentally different and cannot adequately assess the economic impact of the COVID-19 pandemic. A distinctive feature of the current situation is the shock of social distancing, which affects the reduction in labor supply and economic activity. In addition, the coronavirus pandemic provokes a significant increase in trade costs due to travel restrictions, which disrupt global supply chains and lead to deepening recessionary economies, whether at the regional or global level. Nevertheless, it should be noted that, due to the relevance, the list of studies on the expected economic effects of the coronavirus is expanding rapidly. International organizations [
2,
25], national research institutes and private research [
1,
11,
18,
26] are contributing to these studies.
They are thus based on assumptions about the duration of the pandemic, social distancing measures and responses to supply and demand. The uncertainty about these parameters makes some of these research studies develop scenarios. This approach is also used in the current study.
As evidenced by the analysis of the up-to-date literature, the assessment of the impact of the COVID-19 epidemic on economic development is usually based on the prediction of infection using: (1) exponential explosion models; (2) SIR models; (3) SIS models [
27,
28,
29,
30].
As the dynamics of 2020 show, the number of COVID-19 infections in Eastern Europe (and the whole world except Spain, Italy, Germany, China, Austria, South Korea, Australia, and Iceland) is currently increasing exponentially. It should be noted, however, that there comes a point (saturation threshold) when the increase in disease incidence is declining, as demonstrated by the current situation in China and the experience of a previous pandemic—the 2009–2010 swine influenza A/H1N1 pandemic [
31]. The decline in the rate of infection is due to a decline in the number of people prone to becoming infected as a result of an increase in the number of cases in which immunity is generated and a weakening of the virus over time and its consequent transformation. Therefore, the use of exponential explosion models to predict the level of infectiousness is feasible in the short term of 3–6 months. It also lacks the ability to determine the saturation threshold and the end of a pandemic, as exponential explosion patterns assume a steady increase in the infection rates.
SIR and SIS models assume logistic type of function of the infection rate time dependence [
27,
29]. The SIR model takes into account the influence of the number of those who are ill, whose immunity is formed and who are not prone to infection; the number of those who adhere to social distancing and who have a low probability of infection; the number of those who are prone to infection. This model is the most accurate for ing the epidemiological situation in the world, in a particular country, in a region. The inability to use the SIR model in this study is due to the fact that the countries of Eastern Europe are precisely those with low levels of population testing. As of 12 April, the average testing level was five tests per 1000 people [
32,
33,
34,
35]. In developed countries, the level of testing is much higher, more than 16 tests per 1000 people [
35,
36]. The low level of population testing for COVID-19 makes it impossible to determine the SIR model parameter values: the exact number of infected; the number of those whose immunity is developed; the number of those prone to infection.
Determining the number of people who keep the social distance is also a problem. In Belarus, the quarantine was not introduced. In other Eastern European countries, despite the fact that the quarantine was introduced, there is no strict adherence to it due to disregard for legal requirements. This is confirmed by the rule of law index, which is below the average of the world. With the world average World Justice Project (WJP) Rule of Law Index-2020 = 0.56 and a maximum of 1.0, in countries such as Belarus, Bulgaria, Hungary, Moldova, Ukraine, and the Russian Federation the index is at 0.47–0.55 [
37].
The problem of calculating the exact number of infected people also creates a problem in using the SIS model.
This study attempts to develop an approach for building a computational predictive model to assess the impact of the COVID-19 pandemic on the economies of Eastern Europe, taking into account the leveling out of the shortcomings of the approaches already available in literature and practice. The proposed approach will make it possible to simulate the COVID-19 spread intensity in Eastern European countries, based on limited statistical data. The problem of low testing and the accurate determination of the number of infected people has been solved by building a “critical infection” model. In this model, the number of infected people is understood to be the official number that has been identified as a result of testing. Some of the infections, for which there are no official statistics, are those that have not been reported to medical institutions. Since they are patients in whom the disease is asymptomatic, they cannot cause the introduction/rejection, the quarantine regime change, and, therefore, will not affect the economic situation in countries. In addition, the proposed approach allows taking into account the essential parameters (provided by the SIR model) in modeling the epidemiological situation by means of factors impact assessment. These are factors affecting the number of infected people and the number of people who adhere to the social distance.
3. Methods and Materials
3.1. Determination of Factors Affecting the COVID-19 Spread Intensity
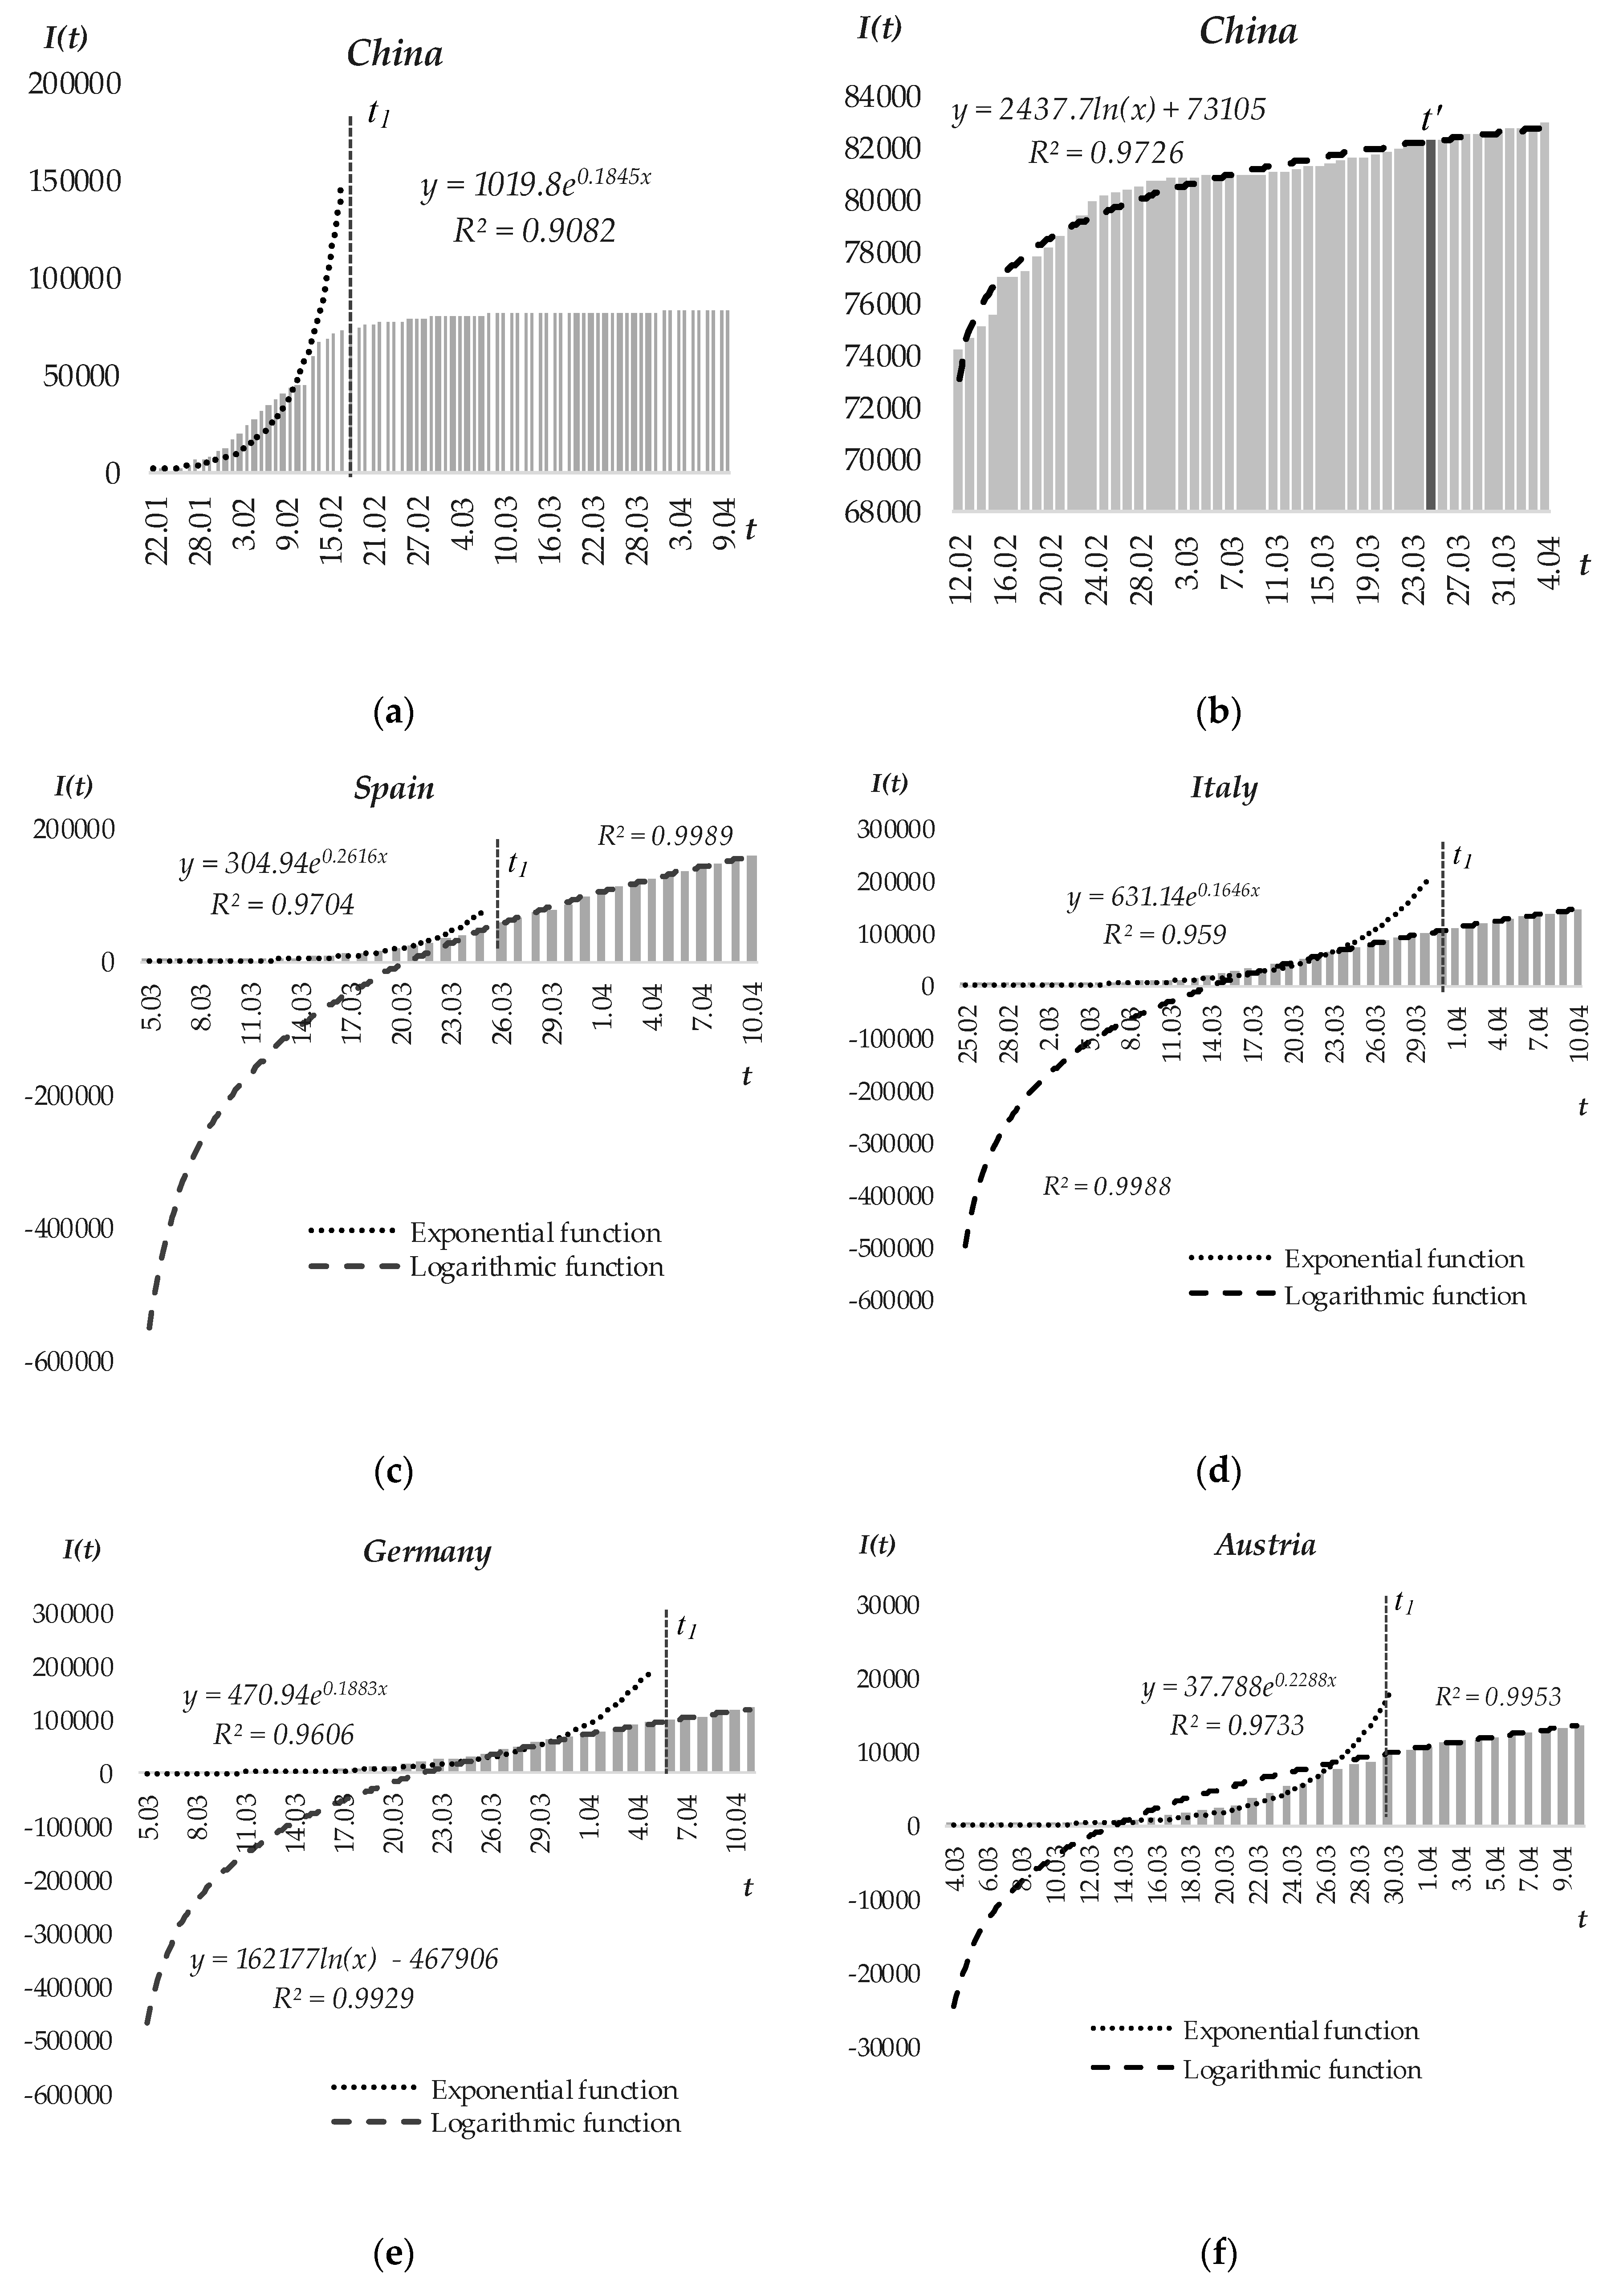
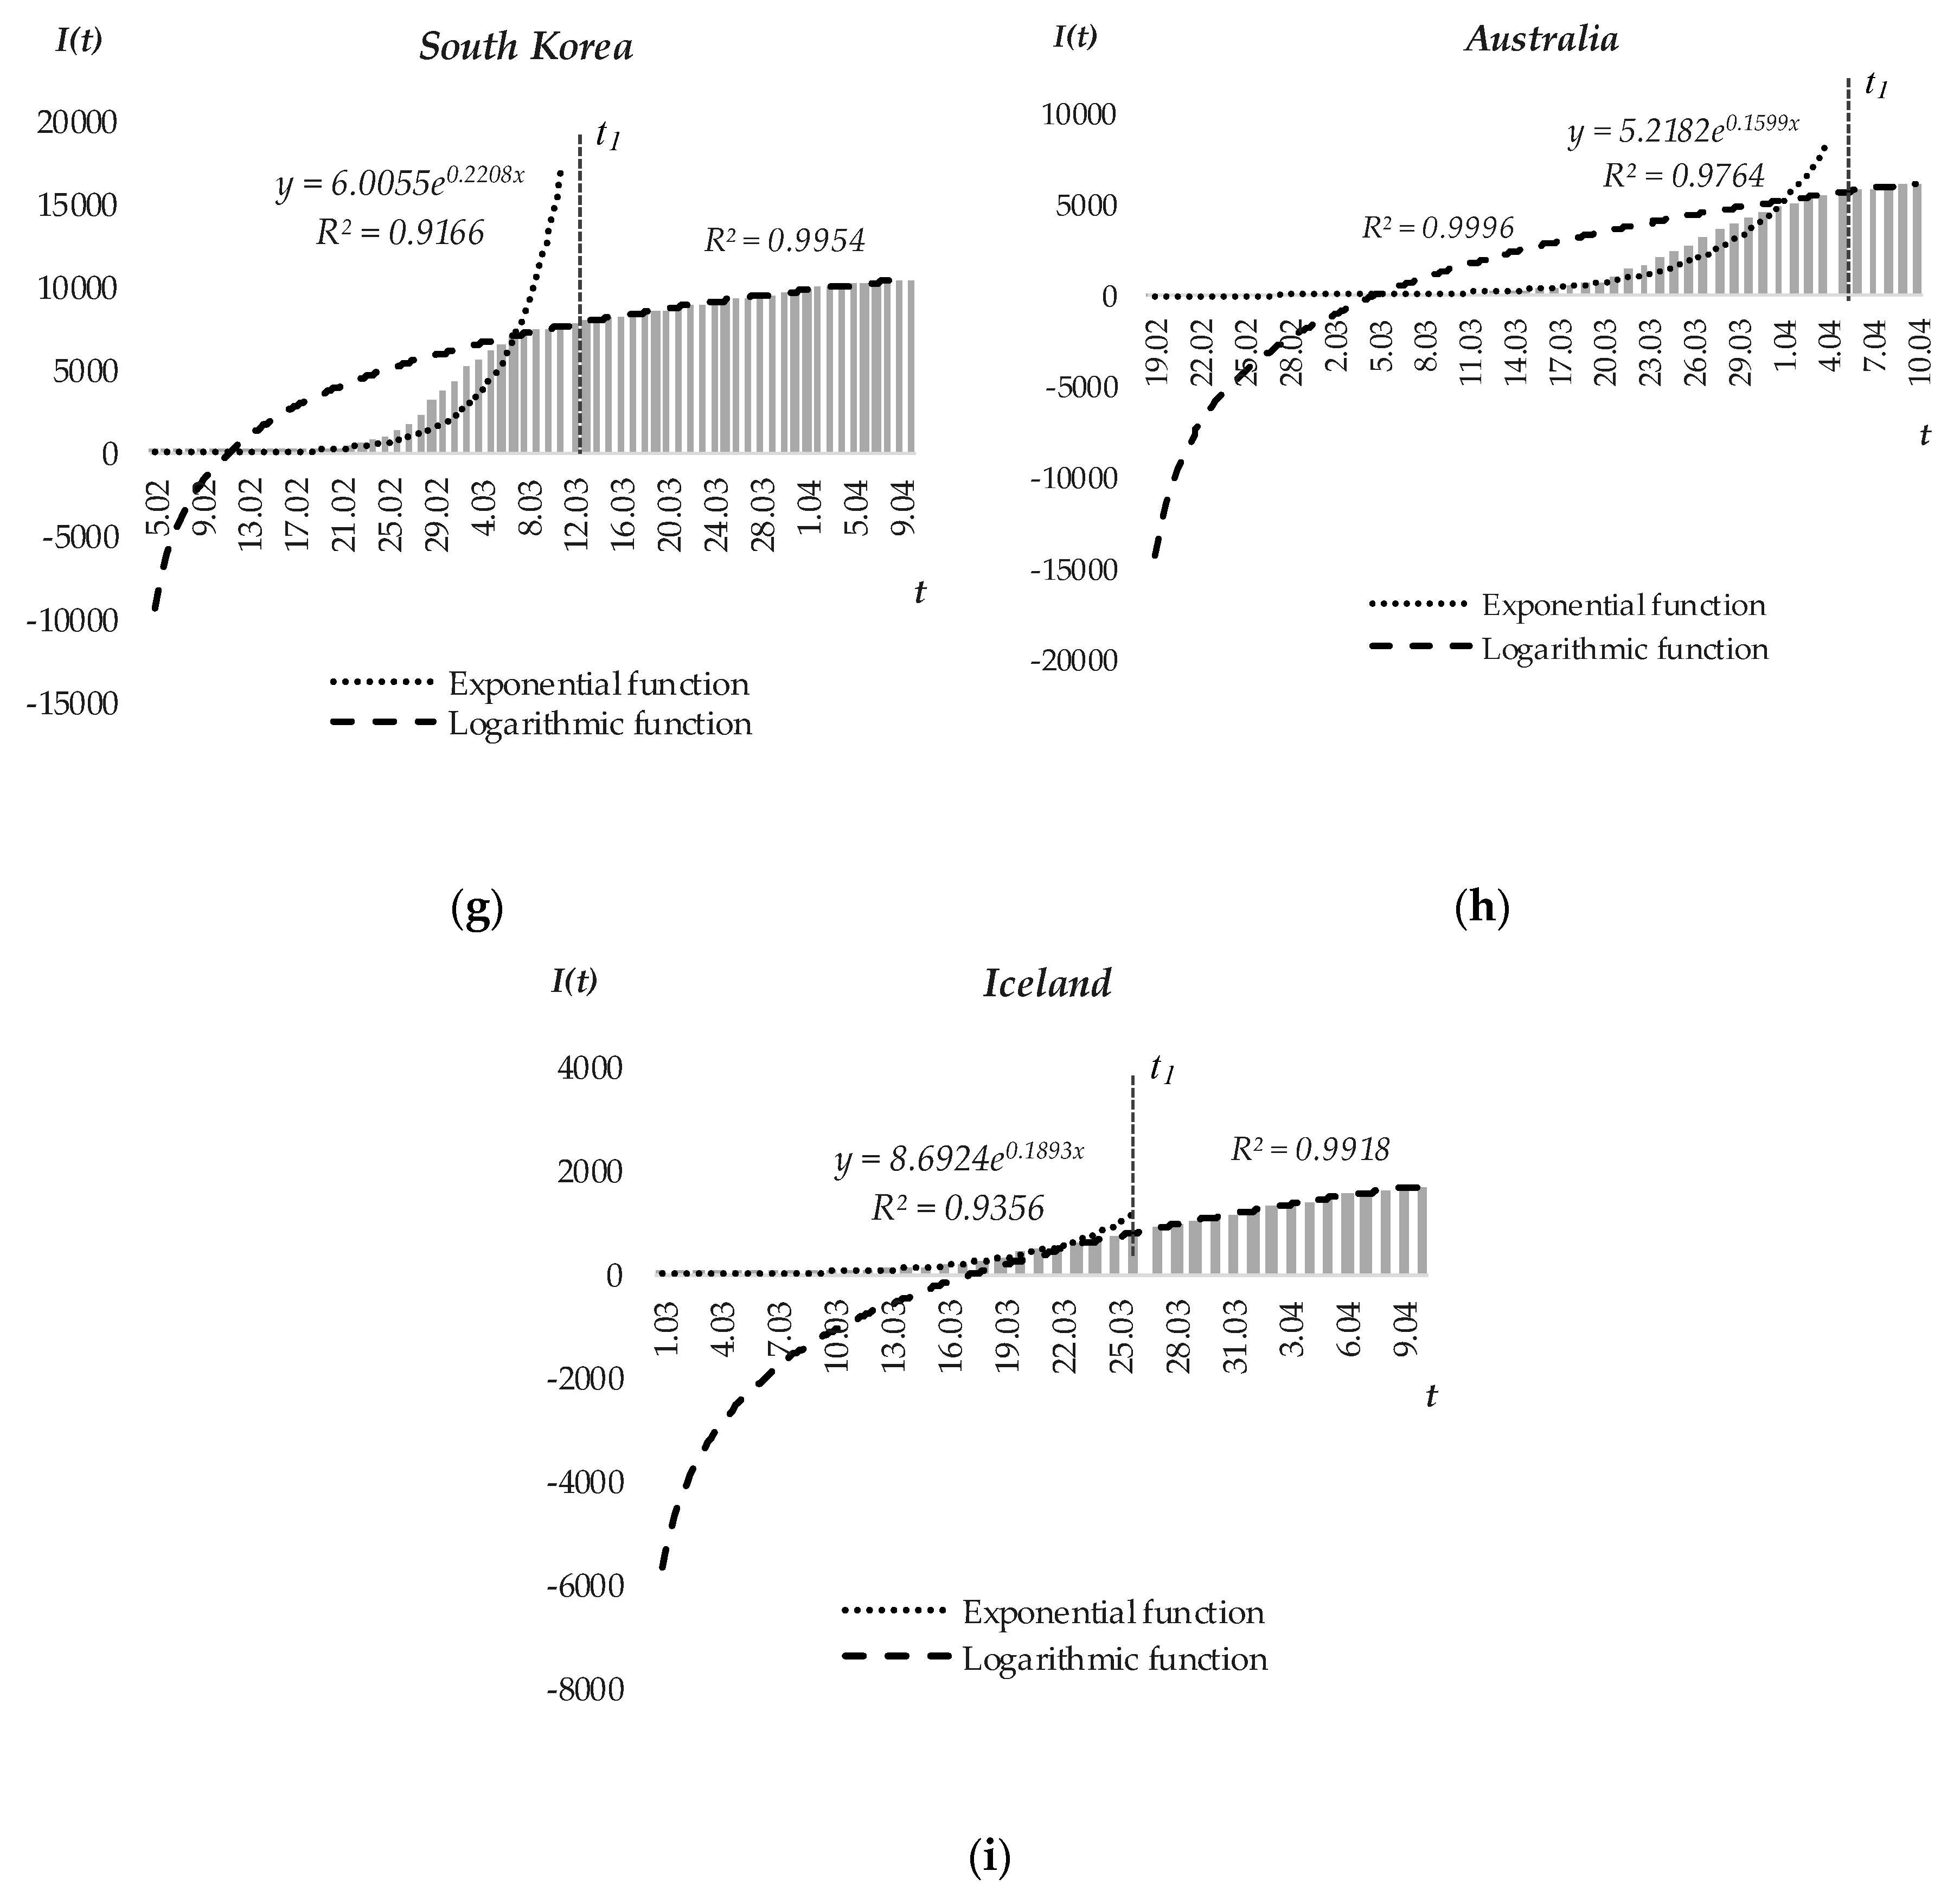
The first task of the research was to study the nature of changes in the infection rate and the factors influencing it. A sample of countries, to estimate the nature of the change in the number of infected, was generated based on China (where the saturation threshold has been reached and the economic recovery period is under way), as well as Spain, Italy, Germany, Austria, South Korea, Australia and Iceland (where the exponential increase in the number of infected people has been completed). The sample of countries is based on the fact that, at the time of the study, only these countries underwent the exponential growth, and the epidemic spread trends can be distinguished. All other countries in the world (including countries of Eastern Europe) are at the stage of exponential growth. This makes it possible to determine only individual factor impact on the infection rate growth at the moment. At the same time, it is not possible to study retrospective experience of the function behavior to model the saturation threshold and identify the factors affecting it. To study the nature of changes in the infection rate and the factors influencing it, the infection rate indicator as of the date was used. Daily data for these countries were used from the beginning of the epidemic up to 10 April 2020 [
38].
The dynamic of the number of infected people (
Figure 1) shows three phases of COVID-19 spread:
Exponential growth
Logarithmic growth
Saturation threshold
The exponential and logarithmic function of virus propagation is confirmed by trend lines built on different time intervals. Approximation coefficients (
R2 > 0.9) indicate the validity of the conclusions about the nature of COVID-19 propagation. The time intervals are determined by the experiments and compliance with the criterion of maximization of approximation coefficients of two functions (both exponential and logarithmic). When time ranges shift (expansion of exponential or logarithmic growth stage), coefficients of approximation of both trend lines decrease, which is the result of wrong classification of transition period in morbidity development. Accordingly, the reliability of the obtained results will also decrease. Periods of exponential and logarithmic growth determined in the article provide maximum possible values of coefficients of approximation of exponential and logarithmic trend lines at the corresponding stages of COVID-19 propagation among the countries under study (
Figure 1).
As a result of drawing the trend lines, the identical laws of COVID-19 spread were revealed among the countries that formed the research sample. These are countries of different continents, with different economic and demographic development indicators, different medicine levels, and different state systems. The identical nature of the infection rate function behavior for such different countries indicates the universality of the behavior of the function and the possibility of its use for Eastern European countries. Despite the identical laws of COVID-19 spread, functions differ in the countries by the rate of function increment and duration of phases. To determine the key factors influencing the nature of the function behavior, single-factor regression functions have been used, reflecting the following factors:
Impact of Xi factors on the infection rate in the total population (it1) by the time t1
Impact of Xi factors on the average infection rate (ΔĪt0 − t1) on the time interval [t0; t1]
Impact of Xi factors on the average infection rate (ΔĪt1 − t’), on the time interval [t1; t’], with t0 being an outburst of the epidemic in the country, t1 being the end of the exponential growth and the beginning of the logarithmic growth, and t’ being a saturation threshold. Given the declining rate of growth over time of those infected at the logarithmic stage of the virus, the indicator ΔĪt1 − t’ was used to designate arithmetic mean values of increase in the number of infected during the first six days of logarithmic growth. Using the same period for all countries allows for a comparable result, since when using different periods, an increase in the time range will cause the average to be understated. The duration of six days has been determined by the fact that this is the time range of logarithmic growth in the sample of countries studied (the minimum time range for Germany and Austria is six days).
Single-factor regression models are built on the sample of the above countries. The dependent variables were the indicators
it1, Δ
Īt0 − t1, Δ
Īt1 − t’. The independent ones were values of the factors listed below. The sample for the model building consists of 8 observations: for the infection rate [
38]; for determining the factors values [
2,
37,
39,
40]. Despite the limited statistical base, the number of observations for each constructed model is 8 times higher than the independent variables number. This indicates that the minimum requirements for the observations number for the regression analysis are met [
41,
42]. In addition, the adequacy of the built models, confirmed by Fisher’s and Student’s criteria, with 95% probability, testifies to the existence of a linear relationship between the dependent and independent variables, and thus to the possibility of applying the regression analysis and using the results obtained. The calculated values of Fisher’s
F-criterion and Student’s
t-criterion by module exceed the table values at
p = 0.05 (table value of the
F-criterion is 5.99, and of the
t-criterion is 2.45).
The regression analysis results show that factors that have a significant impact on the nature of the function of the infection rate time dependence Inf = f(t) are:
1. In the exponential growth phase of the epidemic:
The nature of such restrictions (forced or recommendatory) [
2]. When restrictions were imposed, the country was given 1 point for a single direction restriction; with respect to the nature of restrictions, a forced restriction was given 1 point and a recommendation was given 0 points. The points for all directions were summed up.
Discipline, which means the degree of compliance with the norms and rules of conduct. Discipline is proposed to be assessed by the “Rule of Law Index” (
WJP) [
37] and “Democracy Index” (
DI) [
39], which characterize the degree of authority in the country and compliance with legislation, in particular quarantine compliance. The values of indicators for 2019 are taken for analysis;
The state of the health system (Global Health Security Index
GHSI), ensuring preventive measures to prevent infection and active response to identified cases. The Global Health Security Index 2019 indicator was used for this purpose [
40]. This indicator reflects countries’ preparedness for epidemics and pandemics, based on indicators of prevention quality; responsiveness; health system development; compliance of the national health system with international standards and the level of environmental risk.
2. In the logarithmic growth phase of the epidemic:
The severity of quarantine measures (SQM);
Rule of Law Index (WJP);
Democracy Index (DI);
The state of the health system (GHSI);
The number of people who became ill at a time t1, expressed as a proportion of the total population of the country (it1). The impact of the number of overdoses is due to the fact that as the number of overdoses increases, the number of people vulnerable to infection decreases.
Due to the different dimensionality of indicators, they were normalized. The growth of indicators QIP and DI contributes to the growth of morbidity, as opposed to the rest of the SQM, WJP, GHSI, it1, which are deterrents in the spread of infection. Therefore, based on indicator QIP, its opposite value is calculated as 1/QIP, with QIP being the number of days between the first infection in the country and the implementation of quarantine. If quarantine was introduced before the first outbreak of the epidemic in the country, the indicator value is taken as 1. Due to the fact that the indicator 1/QIP is measured in a range [0; 1], it does not need to be normalized. Indicators are normalized by dividing the actual value by the maximum possible value SQMmax = 5, WJPmax = 1, GHSImax = 100. Taking into account the fact that the growth of DI contributes to the growth of morbidity, its calculated opposite value (by analogy with QIP) is 1/DI. Indicator it1 does not need to be normalized because of its relative value. Further on, SQM, WJP, GHSI indicators are understood as their normalized values, QIP, DI indicators—their opposite values.
3.2. Integral Indicator of Factor Influence on COVID-19 Distribution Intensity
On the basis of the selected significant indicators affecting the spread of COVID-19 at each stage, an integral indicator is constructed. Integral indicator of influence of
QIP,
SQM,
WJP,
DI,
GHSI factors on indicators
it1, Δ
Īt0 − t1 is as follows:
with
Fe being value of integral indicator, showing the influence of indicators
QIP,
SQM,
WJP,
DI,
GHSI onto the intensity of COVID-19 spread, and
ke1–
ke5 being significance coefficients of indicators affecting the COVID-19 propagation intensity, calculated using (2)–(3) formulae.
To calculate the significance coefficients
ke1–
ke5 single-factor regression analysis was carried out using Statistica 12.0 software. The regression models allowed determining the functions of the impact of indicators
QIP,
SQM,
WJP,
DI,
GHSI onto dependent variable s
it1, Δ
Īt0 − t1 and the elasticity coefficients. The elasticity coefficients are the basis for calculating the weight coefficients
ke1–
ke6. The weight coefficients are calculated as the ratio of the corresponding index elasticity coefficient to the elasticity coefficients sum for all indicators, which are the part of the model (1). To determine the significance of individual indicators that are part of an integral, describing model
It1 =
f(
Fe) equation (2) was used. To determine the significance of individual indicators that are part of an integral, describing model Δ
Īt0 − t1 =
f(
Fe) Equation (3) was used.
where
EIt1Xi and
EΔĪt0 − t1Xi being elasticity coefficients
it1 and Δ
Īt0 − t1, respectively, from the indicators
QIP,
SQM,
WJP,
DI,
GHSI; Σ
EIt1Xi and Σ
EΔĪt0 − t1Xi being the sum of linear elasticity coefficients
it1 and Δ
Īt0 − t1, respectively, from the indicators;
n—the indicators number,
n = 5.
For the prognostic model Δ
Īt1 − t’ factor impact is described with the following function (4):
The weight coefficients (kl2–kl6) calculation is performed similarly to functions (2)–(3). The significance coefficients characterize the elasticity of the resulting indicator ΔĪt1 − t’ with SQM, WJP, DI, GHSI, it1 indicators.
Calculation of the integral indicator of the influence of factors as a sum of values of indicators, adjusted for the coefficients of significance (Equations (1) and (4)), was possible due to the same nature of the impact of indicators QIP, SQM, WJP, DI, GHSI, it1 on the epidemic indicators. Based on the negative values of elasticity coefficients, all indicators are deterrents to the spread of COVID-19.
Single-factor regression models were also used to determine the strength of the influence of integral factors Fe и Fl on the proportion of infected people (it1) at the time t1, the rate of growth of infected people (ΔĪt0 − t1) at the time interval [t0; t1], the rate of growth of infected people (ΔĪt1 − t’) at the time interval [t1; t’].
Use in the study of the integrated factor influence indicators (Fe, Fl), rather than the multifactor regression models in which independent variables would be the indicators QIP, SQM, WJP, DI, GHSI, it1, is determined by a small research sample. With a sample in N = 8 the multifactor models use would not provide adequate results. The single-factor models allow the consideration of the separate influence of all indicators, by ensuring the minimum requirements for a sample in the context of limited information.
3.3. Model for Determining the Saturation Threshold for the Number of Infected Persons and the Quarantine Duration
The forecast of changes in GDP in Eastern Europe during the coronavirus COVID-19 epidemic is based on the prediction of the speed and scale of the virus spreading. The prediction is based on the saturation threshold, which is the time interval (t’) from the outburst (the first infection) to the peak, after which the increase in the function of the number of infected people is insignificant (ΔInf/Δt → 0).
The right choice of the saturation threshold, which means the removal of quarantine measures, affects the development of the economy. Premature removal of quarantine leads to the second wave of the epidemic and further economic decline, unreasonably long quarantine and also economic decline due to restrictive measures. In practice, there are no international regulations on quarantine removal conditions and there is no possibility to study the countries’ retrospective experience (since only China has passed this stage), which would make it possible to determine the factors influencing such decision. Therefore, an example of a successful fight against the COVID-19 pandemic is the experience of China, which has seen stabilization of the epidemic situation since quarantine was terminated (further reduction in the infection rate to a 0.07% increase in cases on 10 April [
38]). China’s experience shows that the saturation threshold comes with a daily increase in the number of infected people Δ
Īt’ < 0.09% [
38], which was used in the study as a critical point for quarantine removal in Eastern Europe. The value of ξ indicator that designates the point of time, where Δ
Īt’ = 1.0009 (0.09% growth rate) across countries, is determined using the first order derivative of the logarithmic function from the given values of the sixth day derivative:
where
a and
b being unknown function parameters
x = 6.
3.4. Forecast of Economic Development in Eastern Europe in Epidemic Conditions
For predicting the development of the Eastern Europe economies, the value of the parameter t’ as a control factor (prediction period of quarantine duration) is taken as a basis. The resulting factor is the country’s GDP growth rate. The following factors were used as factors reflecting the impact of COVID-19 spread:
Indicators of direct manifestation of the pandemic: productivity index (PRODUCT), production and services growth rate (Product_GR), world oil price index (PRICE), trade cost index (COST);
Indicators that will mediate the impact of the listed indicators on GDP growth rate: export growth rate (Export_GR) and import growth rate (Import_GR);
These indicators primarily reflect the impact of the pandemic on economic development, as noted earlier in the study.
The reason for the change in the productivity index (PRODUCT) is remote work, which according to studies [
20] leads to a 5% decrease in productivity. Quarantine restrictions on the dynamics of production and services (Product_GR) have a significant impact. Decrease in supply of goods and services during the quarantine period is estimated at 80% [
20].
The decline in the volume of foreign trade (goods and services) and the increase in trade costs is caused by a decline in global demand, the restrictions and higher prices for freight transport, the imposition of bans or restrictions on border crossing, and the restriction of passenger transport [
43]. Industrial products predominate in the foreign trade framework in Eastern European countries (Belarus, Bulgaria, the Czech Republic, Hungary, Moldova, Poland, Romania, Slovakia, and Ukraine, over 53.4% in the export structure and 54.1% in the import structure [
5]), the impact on demand and supply is determined by production volumes. For Russia, the main export item is fuel. In addition to the reduction in the world demand, this product witnessed the reduction in world prices (oil prices in 2020 decreased by 73% [
8]), which negatively affects the Russian economy. As the dynamics of prices the indices of dynamics for Urals oil are taken, because among fuel this type of oil is the main item in the foreign trade activity of the countries in Eastern Europe (at the expense of export from Russia) and the factor that has the most influence on the economy of the countries. For Russia, the revenues from export of Urals oil are the main item in the budget revenues. Increase in trade costs due to restriction of cargo transportation during the pandemic is estimated at 70% [
20].
Functions of interdependencies between PRODUCT, Product_GR, PRICE, COST, Export_GR, Import_GR indicators and GDP growth rates (GDP_GR) are obtained using linear regression models. The regression models were based on statistics of the studied indicators for Eastern Europe with quarterly details for the period 2005–2019 [
8,
44,
45,
46]. The program Statistica 12.0 was used to build the models.
4. Results
The conducted regression analysis proved the significant influence of QIP, SQM, WJP, DI, GHSI,
it1 indicators according to Fisher and Student criteria on the nature of COVID-19 spread in the world, taking as an example China, Spain, Italy, Germany, Austria, South Korea, Australia, and Iceland. Using the countries of different continents (Australia, Asia, Europe) with different levels of development and political principles as a statistical base allows the extension of the results obtained to the countries of Eastern Europe. The regression models with indication of their statistical significance are presented in
Table 1.
Calculated values of Fisher F-criterion and Student t-criterion exceed the table values (5.99 for Fisher F-criterion and 2.45 for Student t-criterion) at the significance level of p = 0.05. p-value indicators for model’s independent variables is <0.05. This indicates the adequacy of the models built and the statistical significance of the influence of the selected indicators on the COVID-19 propagation intensity at the exponential and logarithmic stage of the infected population growth.
The speed and scale of the spread of COVID-19 is most constrained at the initial stage (during exponential growth) by administrative measures:
Timely introduction of quarantine (EIt1QIP = −0.0004, EΔĪt0 − t1 QIP = −0.0010);
Austerity of quarantine (EIt1SQM = −0.0040, EΔĪt0 − t1 SQM = −0.0033);
Quarantine observation, which is determined by the rule of law in the country (EIt1WJP = −0.0059, EΔĪt0 − t1 WJP = −0.0059), as well as the level of authoritarianism (EIt1DI = −0.0056, EΔĪt0 − t1 DI = −0.0059);
Another important factor is the level of healthcare system security (EIt1GHSI = −0.0058, EΔĪt0 − t1GHSI = −0.0036).
At the stage of logarithmic distribution of COVID-19, the most important factors are:
The ability of the health system to combat the disease (EΔĪt1 − t’ GHSI = −0.0036);
The proportion of those who already had COVID-19 (EΔĪt1 − t’ it1 = −0.0028);
The level of authoritarianism (EΔĪt1 − t’ DI = −0.0023);
Rule of law (EΔĪt1 − t’ WJP = −0.0022);
The austerity of quarantine (EΔĪt1 − t’ SQM = −0.0013).
The significance of these factors is confirmed by the statistical significance (
R2, Fisher
F-criterion, Student
t-criterion) of the constructed single-factor regression models (
Table 1), which reflect the influence of these factors on the growth rate of the number of infected at the logarithmic stage of virus spread. The force of influence of factors is directly proportional to the calculated modulus of elasticity coefficients for the corresponding factor.
In connection with the obtained elasticity coefficients (
Table 1), the integral indicator of the influence of factors on the indicators
it1 an Δ
Īt0 − t1 is as follows:
Integral indicator of factors’ influence on the indicator Δ
Īt1 − t’ is described by the following function:
Influence of integral factors (
Fe,
Fl) on the distribution rates of COVID-19 in Eastern Europe is described by the following system of functions:
The built system of the models allows the assertion that constraining factors in the COVID-19 spreading are timely quarantine introduction, its rigidity and adherence to it. The degree of adherence to the quarantine measures, as demonstrated by the experience of China, Spain, Italy, Germany, Austria, South Korea, Australia, Iceland, depends on the degree of the rule of law and the democracy level in the country. Another factor contributing to the infection rate reducing is the ability of the health system to combat the disease. The logarithmic stage of the virus spread is significantly influenced by the number of people who have previously become ill. This growth reduces the number of people vulnerable to infection and generates herd immunity, which prevents the virus spread. Thus, the highlighted factors allow the estimating of the impact of the mandatory parameters stipulated by the widely spread SIR and SIS models.
Calculated by formula (8), the predicted values of the proportion of infected at time
t1 (
it1) and the rate of spread of COVID-19 at the exponential (Δ
Īt0 − t1) and logarithmic stages (Δ
Īt1 − t’) in the East European countries are given in
Table 2.
Taking into account the timely introduction of quarantine, discipline and the level of development of the health care system at the exponential stage of development, an increase in morbidity is predicted to be 0.245–0.448% of the total population. Belarus is most vulnerable to infection as it has the lowest level of health system security in Eastern Europe, low level of rule of law and inefficient administrative response to the pandemic (no quarantine was introduced in Belarus as of April). The part of the infected population in Belarus during the exponential growth period is projected at 0.448% of the country’s population, the average growth rate of the infected during the exponential growth period is one. Based on the rate of recovery (dynamics of infected at the logarithmic stage), along with Belarus, the vulnerable groups are Ukraine (ΔĪt1 − t’ = 1.030), Moldova (ΔĪt1 − t’ = 1.024), and Bulgaria (ΔĪt1 − t’ = 1.022). The long period of recovery in these countries is due to the relatively low rule of law and security of the health system (especially in Ukraine).
The Czech Republic (it1 = 0.245, ΔĪt0 − t1 = 1.081, ΔĪt1 − t’ = 1.002) and Slovakia (it1 = 0.255, ΔĪt0 − t1 = 1.094, ΔĪt1 − t’ = 1.008) are the most stable COVID-19 countries.
The duration of the exponential growth stage, calculated on the basis of the number of infections and average rates of morbidity, is 90 days in Russia, 91 in Ukraine, 42 in Belarus, 56 in Bulgaria, 66 in Hungary, 82 in Moldova, 81 in Poland, 81 in Romania, 93 in Slovakia, and 96 in the Czech Republic.
The saturation point (t’), obtained using differential calculations, was 182 days (this is the period of time from the beginning of the epidemic to its cessation and elimination) in Russia, 211 in Ukraine, 213 in Belarus, 160 in Bulgaria, 129 in Hungary, 192 in Moldova, 105 in Poland, 151 Romania, 142 in Slovakia, and 106 in the Czech Republic. This means that the most probable scenario for the spread of COVID-19 in the countries of Eastern Europe is a significant increase in the incidence and continuation of restrictive measures for the period of 3.5–7.1 months from the detection of the first infected (within the time period from 4 March to 16 March).
The model of economic development under the quarantine is presented by the system of functions (
Table 3). The models developed reflect the impact of the most COVID-19 pandemic sensitive factors (PRODUCT, Product_GR, PRICE, COST) on the GDP growth rate.
Social distance, in the form of remote work, leads to a decrease in productivity that directly affects production volumes. In addition to productivity losses, the reasons for the decline in production are the decline in demand for durable and luxury goods and those requiring imported raw materials from countries affected by the pandemic that are also experiencing production stoppages.
Changes in the price of oil (PRICE) affect the export revenues of exporting countries (Russia), a decline which leads to lower export revenues (Export_GR) and correspondingly lower GDP (GDP_GR). Another economic indicator that is affected by changes in oil price is the cost of imports (Import_GR). For importing countries, oil price reduction has a positive impact on the economy. Factors affecting foreign trade are also indicators of dynamics of production volumes, services sector of the country under study (Product_GR), and the country of the main trade partner (Product_GR_p), as well as trade costs index (COST). Decrease in production volumes leads to a decrease in exports of finished goods and imports of raw materials or components necessary for production. The dynamics of production of the partner countries have an identical influence. The main trading partners for Russia are China, for Ukraine and Belarus: Russia, for Bulgaria, Hungary, Poland, Romania, Slovakia, Czech Republic: Germany, for Moldova: Romania [
5]. Therefore, for calculating the indicator Product_GR_p as a saturation threshold of a partner country for Ukraine and Belarus, the saturation threshold (
t’) in Russia is taken, while for Bulgaria, Hungary, Poland, Romania, Slovakia, and the Czech Republic it equals the
t’ for Germany (calculated in the same way as for Eastern European countries). Finally, for Moldova it equals
t’ for Romania. The partner country saturation threshold has not been used for Russia because China’s quarantine period is over and preliminary data are available on the level of production decline during the epidemic. Indicator Product_GR_p for the Russian GDP forecast model is preliminary data on the level of production decline in China, for the GDP forecast model of other Eastern European countries, it is calculated that production decline is based on the saturation threshold (Equation (5)) and that the supply of goods and services during the quarantine period will decrease by 80% [
21].
The adequacy of the built models of interdependencies between the economic indicators PRODUCT, Product_GR, Product_GR_p, PRICE, COST, Export_GR, Import_GR, Product_GR_p, GDP_GR is evidenced by the indicators of determinacy (R2), the values of which are close to one, and Fisher F-criterion, the calculated values of which, by module, are higher than the tabular one.
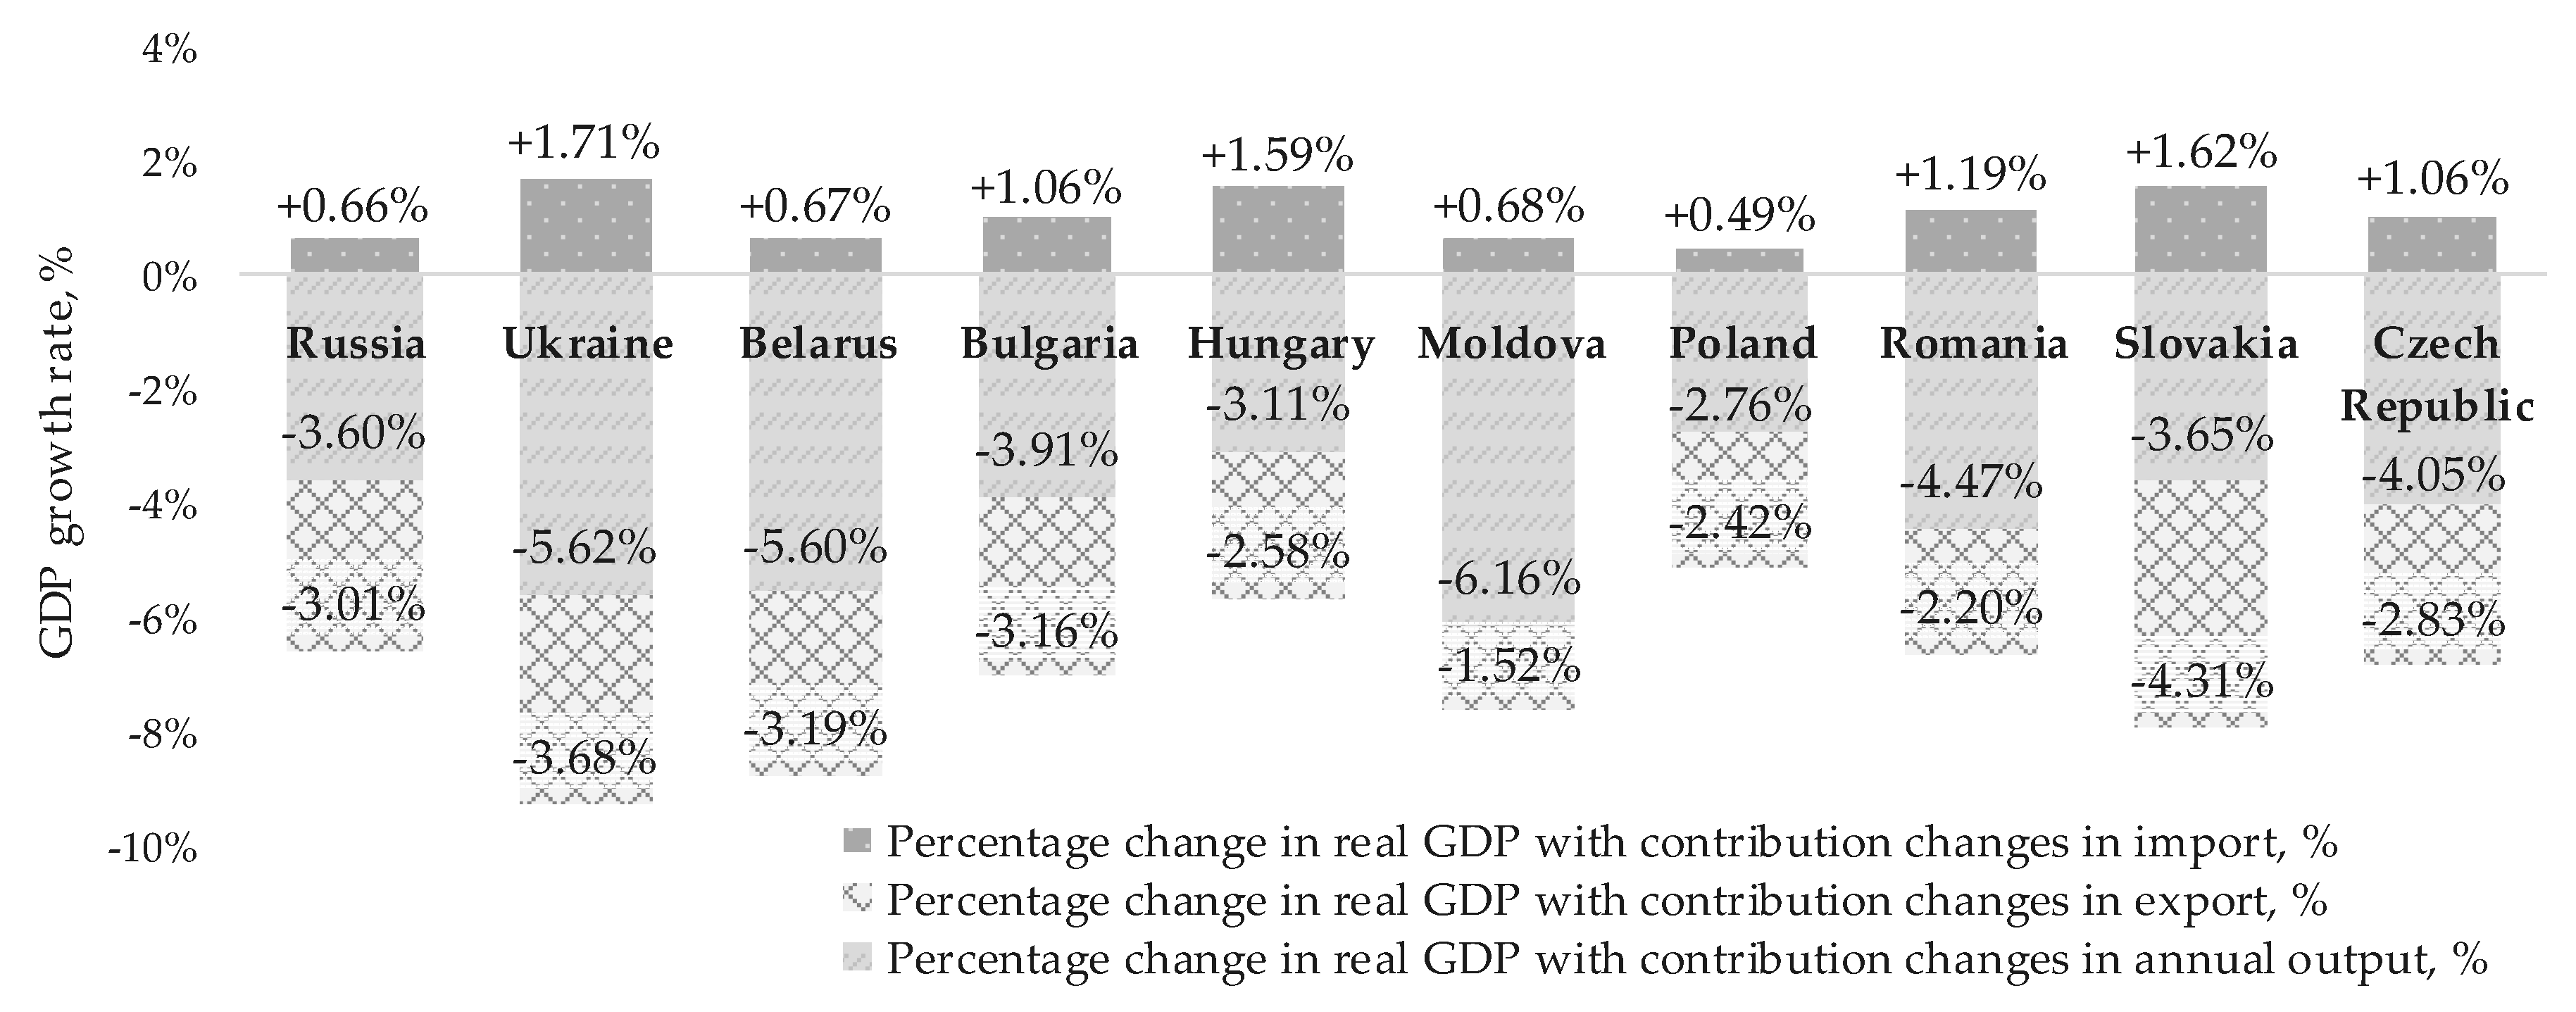
The performed calculations show that the Russia’s GDP in annual terms will decrease by 5.95%, Ukraine’s by 7.59%, Belarus’ by 8.13%, Bulgaria’s by 6.01%, Hungary’s by 4.1%, Moldova’s by 7.01%, Poland’s by 4.69%, Romania’s by 5.48%, Slovakia’s by 6.33%, and Czech Republic’s by 5.82% (
Figure 2).
The economy of Eastern European countries (except Russia) is positively influenced by the decrease in the world oil price. As a result, the value of imports decreases, which provokes the GDP growth by 0.49–1.71%. For Russia, the decrease in the world oil prices is the main reason for the export decrease, as a result of which a GDP decrease of 3.01% is forecasted for the year. For all countries, the COVID-19 pandemic will have a significant destabilizing effect on 2020, due to the reduction in production and export output.
5. Discussion
As part of this study, a predictive model of the impact of the epidemic on the economies of Eastern Europe was developed. An assessment tool for this region is necessary, as the leading rating agencies estimate that the economies of developing countries are more vulnerable to a deeper recession than those in the developed market. The predictive model is aimed at determining quantitative estimates of economic development; in particular, changes in GDP growth rates over a period of one year, which makes it possible to determine and build strategies of economic management for a long period of time, in contrast to tactical forecasting models [
4,
6].
In addition, given the different intensity of the spread and the rate of infection, the "critical infection" model was used to determine the number of infected people, which was an advantage of the proposed approach to accurately estimate the impact on the economy. This, in contrast to the SIR and SIS models and exponential explosion model [
27,
28,
29,
30], makes it possible to take into account in the prognostic model the number of infected people who have pronounced symptoms of COVID-19 disease and have received a positive COVID-19 test. The model will not include the number of potentially infectious populations that have not been tested for COVID-19. For them, the disease is asymptomatic, therefore they cannot be a reason to decide to strengthen quarantine conditions and thus do not affect the economy. In addition, the key parameter of the predictive model is the threshold of epidemiological saturation, after which the rate of human coronavirus infection decreases, which, therefore, leads to the weakening of quarantine and increased economic activity. That is, we take into account the presence of an epidemiological saturation threshold at which the growth of infected people tends to zero, as well as a system of objectively significant factors that may affect the number of infected people. That is, the forecast of economic development trends takes into account not only the intensity and period of infection of people, but also the probability period of the end of the pandemic. That is, a constant increase in infection is not assumed, which is not taken into account in, for example, SIS and exponential explosion models [
27].
It should be noted that this study regards economic processes under conditions of high uncertainty, where it is difficult to predict the course of events, the efficiency of measures to level out or reduce the impact of the pandemic on the development of national economies. Under these circumstances, the issue of the need to develop open innovation, which consists of close cooperation between scientific potential and the economy, becomes very acute. The effectiveness of these innovations has been proven by scientists in multiple studies [
47,
48,
49,
50,
51], not only during the digitalization of the economy [
47,
48,
49,
50], but also during the development of synthetic, universal, specific tools of diagnostics [
48] and forecasting of the development [
48] of the economy in the most unpredictable conditions. The introduction of various products of open innovative technologies and solutions helps to function much easier in crisis conditions [
48]. It is also necessary to take into account the fact that business entities are more open to innovation during a crisis, as they face forced changes in their habits [
51].
It should be noted that, in the absence of a sufficient statistical basis, a number of assumptions were made in the modeling study:
The patterns of COVID-19 propagation in Eastern European countries correspond to those in China, Spain, Italy, Germany, Austria, South Korea, Australia, Iceland;
The example of quarantine abolition in China is effective for Eastern European countries;
There is no second wave of aggravation in COVID-19 propagation in the world;
The impact of duration of quarantine on the economy under COVID-19 and previous pandemics is identical;
Decrease in production due to the picture in Eastern European countries and Germany (as the main trade in Eastern Europe and Germany).
The highest degree of uncertainty is in the forecast model of the Belarusian economy due to the fact that at the time of the study there were no restrictions imposed on the country aimed at containing the spread of COVID-19, which creates the risk of more infections and greater economic losses due to an additional factor—a steady intensive growth in the number of cases and deaths.


