Open Innovation and Business Model of Health Food Industry in Asia

Office of Border Economy and Logistics Study (OBELS), School of Management, Mae Fah Luang University, Chiang Rai 57100, Thailand
J. Open Innov. Technol. Mark. Complex. 2021, 7(3), 174; https://0-doi-org.brum.beds.ac.uk/10.3390/joitmc7030174
Submission received: 7 June 2021
/
Revised: 9 July 2021
/
Accepted: 10 July 2021
/
Published: 16 July 2021
Abstract
:Health trends and digital technologies are of great significance for the health and wellness food market and its development in the future. This study examines whether health trends, digital technology, and market concentration influence health and wellness food consumption in the Asian market. Our analysis uses a panel dataset covering 14 Asian economies from the period 2006–2020 and a panel quantile regression technique with non-additive fixed effects. The results reveal that health trends and digital technology have positive and significant impacts on health and wellness food consumption, whereas the concentration of distribution channels has a negative and significant impact. These results also offer insights into each type of health and wellness food consumption, thereby contributing to the health and wellness food market development. Finally, this study suggests the health and wellness food business development through a consumer-driven open innovation strategy.
1. Introduction
The phrase “You are what you eat” was always referred to in the context of consumer health and diet [1,2]. The higher the healthy food consumption, the better the consumer health. Nowadays, healthy food symbolizes good nutrition, healthy quality of life, social appeal, food literacy, wealth, and policy governance on food safety and security [3,4,5,6,7,8,9,10]. The higher the healthy food consumption, the better the health and human well-being. The physical and mental activities supporting health improvements show health trends defined in this study. Thereby, healthy food has become an indicator of sustainable development. Since the COVID-19 pandemic, the food industry has been more challenged by changes in consumer behavior, consumer purchasing behavior, and consumption patterns. Consumers need health and wellness foods to boost an immune system against COVID-19 and food distribution safety to avoid the COVID-19 spreading [11,12,13,14]. The COVID-19 pandemic has also affected the consumption way of life, for example, changing from frequent eating out of the home to eating at home, food distribution channels becoming more resilient, and purchasing patterns using digital technology such as ICT tools (online delivery platform) and food and retail applications [15,16,17,18,19,20]. Digital technologies for consumption in this study focus on ICT access, such as mobile internet access and mobile telephone subscription [21]. This incidence preliminarily reveals that health trends, digital technology for food purchasing, and diversified food and distribution channels influence food consumption.
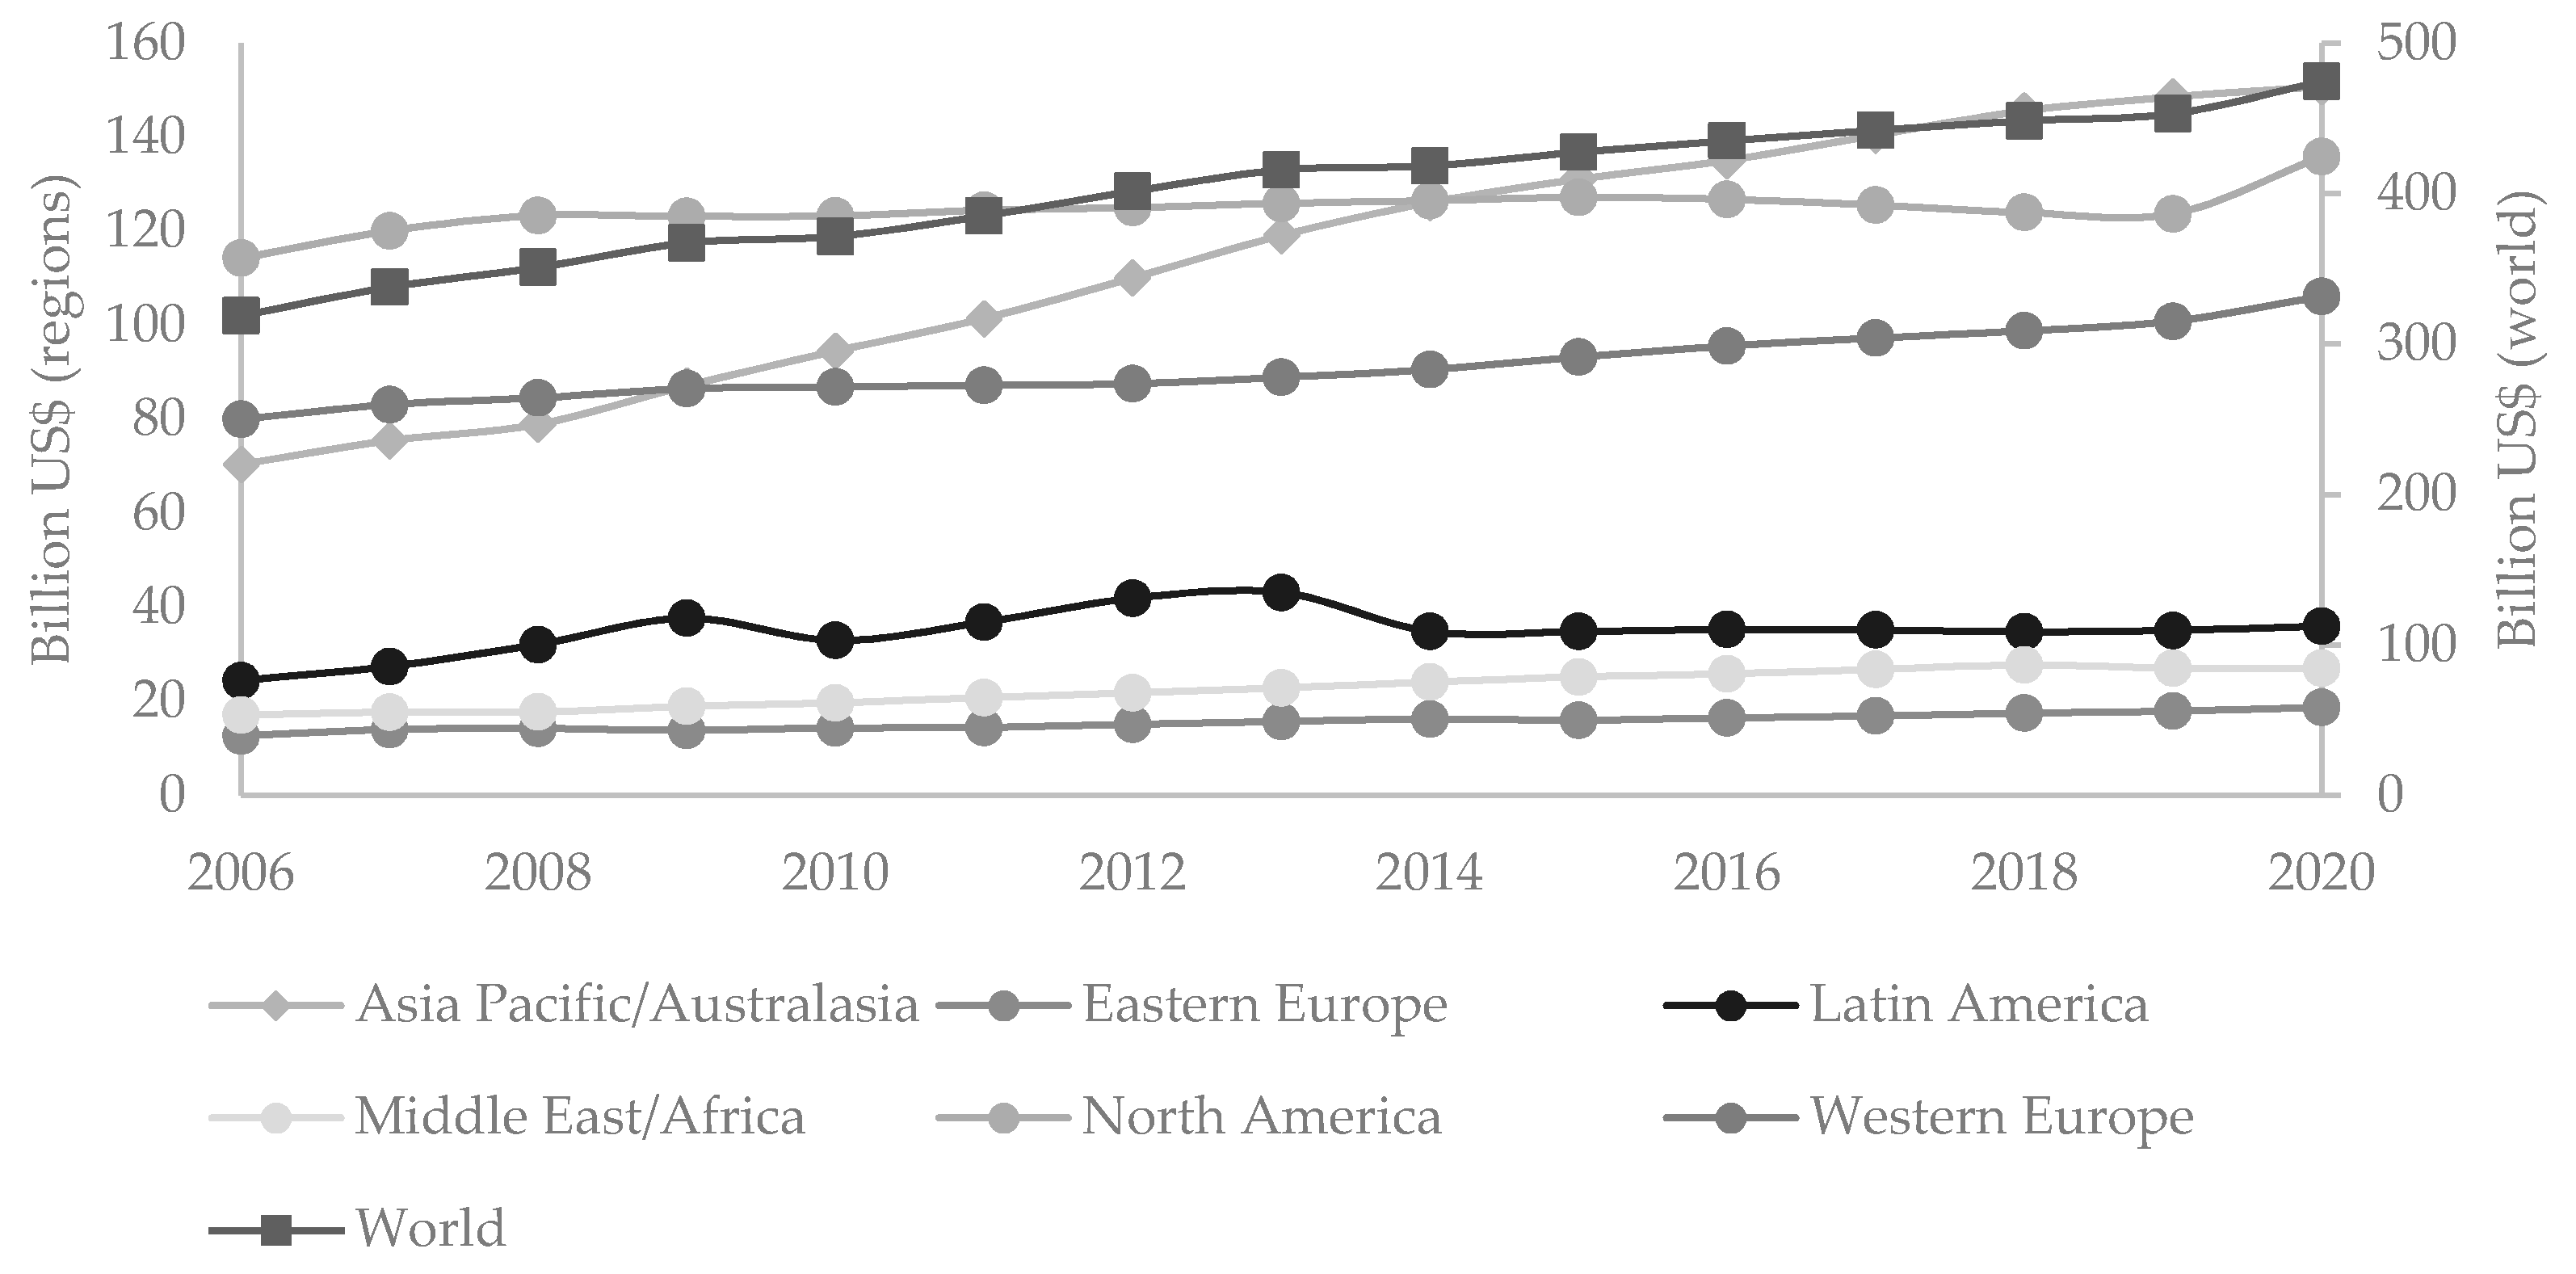
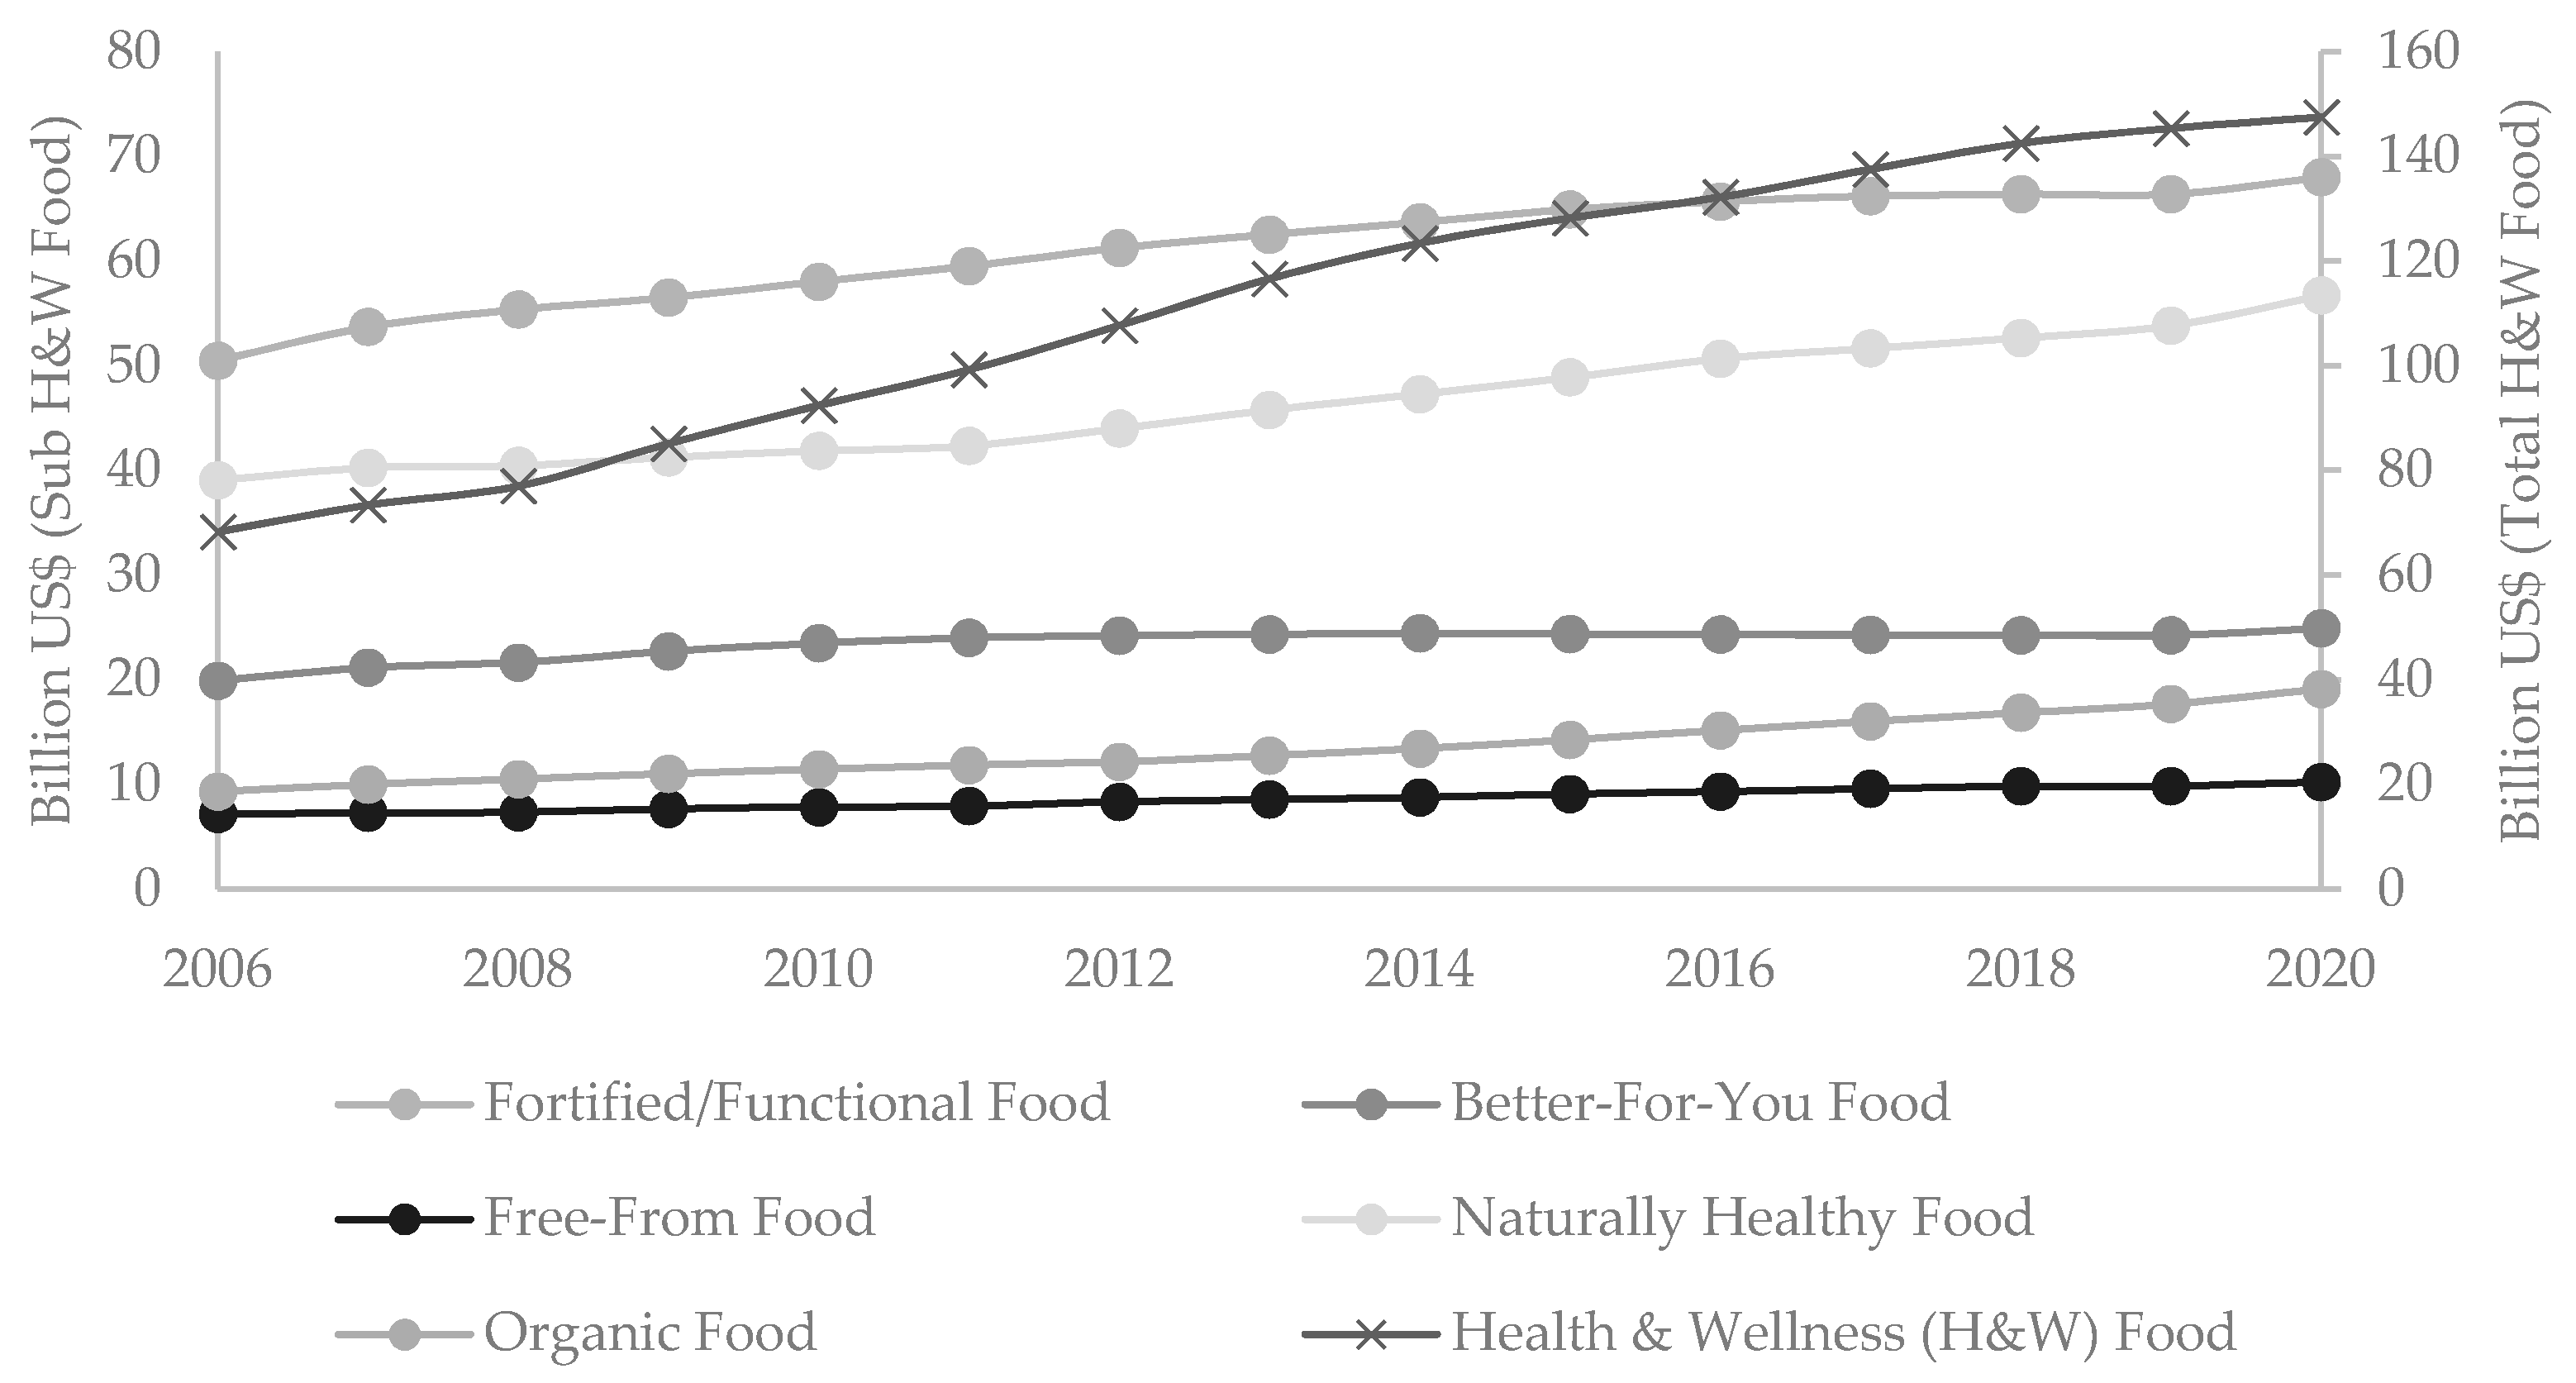
Health and wellness food consumption (categorized into five types: fortified and functional, better-for-you, free-from, naturally healthy, and organic food) has been increasingly growing [22]. The global retail value of health and wellness packaged food grew from US$ 318 billion in 2006 to US$ 474 billion by 2020, at a compound annual growth rate (CAGR) of 2.88% (Figure 1). The region with the highest CAGR of health and wellness packaged food retail from the period 2006–2020 was the Asia Pacific and Australasia (5.59%), followed by the Middle East and Africa (3.32%), Eastern Europe (2.84%), Latin America (2.82%), Western Europe (2.04%), and North America (1.25%). Over two-thirds of the Asia Pacific countries showed a higher CAGR of health and wellness packaged food retail than the world average, that is, Vietnam (9.30%), China (8.85%), India (8.54%), Hong Kong (7.70%), Indonesia (6.39%), Thailand (4.98%), Kazakhstan (4.34%), New Zealand (4.33%), Uzbekistan (4.33%), Malaysia (4.16%), and Singapore (3.16%). Among all types of health and wellness packaged food in Asia (Figure 2), the organic packaged food has the highest CAGR of 5.26% during 2006–2020, followed by naturally healthy packaged food (2.70%), free-from packaged food (2.56%), fortified/functional packaged food (2.15%), and better-for-you packaged food (1.61%). Considering the health and wellness food retail value in the Asian market, it is essential to study the influential factors on Asia’s health and wellness food consumption.
The research of health and wellness packaged food has gained momentum in the aftermath of the COVID-19 pandemic and healthcare and digital technology trends. Digital technological changes and health trends have become a global challenge that has attracted business and economics researchers, policymakers, consumers, and worldwide businesses. Although the extant studies explored the effects of health trends, digital technology, and market concentration on food consumption, only a few studies have focused on health and wellness food consumption. Moreover, the combined consideration of health trends, digital technology, and market concentration on health and wellness food consumption in the Asian market remains questionable due to the lack of concrete empirical results and discussion. As a result, it urges us to address the following research questions: (i) Are the health trends and digital technology of great significance for the health and wellness food market and its development in the future? Moreover, (ii) would the market concentration in brand and distribution channels cause the expansion of health and wellness food consumption?
Accordingly, this study investigates the influence of health trends, digital technology use, and market concentration on health and wellness food consumption in 14 Asian economies over the period 2006–2020 using a panel quantile regression approach. Our findings are consistent with the existing studies that health and wellness food consumption is susceptible to changes in health trends, digital technology use, and market concentration. These empirical results further lead to strategic business development to stimulate health and wellness food consumption in the Asian market.
Our contribution to the existing studies is summarized as follows: First, we augment the variable set considered in the recent literature by combining the significant effects of health trends, digital technology, and market concentration on health and wellness food consumption. However, the combined consideration of these factors indicates that health trends, digital technology, and distribution channels’ diversification are important and sensitive to health and wellness food consumption. Second, we employ panel quantile regression with non-additive fixed effects. This technique allows us to observe the variables across the conditional distribution of health and wellness food consumption rather than the conditional mean distribution, including dealing with the heterogeneity problem in the model. Lastly, we use the different schemes from the extant studies, 14 Asian countries during 2006–2020, for investigating health and wellness food consumption.
2. Literature Review
This section reviews the literature published from 2010 to 2021 regarding the effects of health trends, consumers’ use of digital technology, and market concentration on healthy food consumption including open innovation and business model. The following literature review provides the framework for this study.
2.1. Health Trends
The goal of “end hunger, achieve food security and improved nutrition, and promote sustainable agriculture” is one of the challenges for achieving the sustainable development goals (SDGs) of countries in the world. Healthy and sustainable diets, dietary patterns, and food systems are essential to achieve the SDGs [24]. Over the last few years, health and wellness trends have been a priority for consumers, whereas health and wellness food is targeted as a symbol of caring for health, and improving social and economic status. Many pieces of the literature suggest that health trends, health consciousness, and health awareness induce change in consumers’ demand and thereby lead to an expansion in health and wellness food consumption. Khan et al. [25] indicated that the new trends in “health and wellness” have been a catalyst for functional food product development and building a market position in the food industry. Falguera et al. [26] showed that the consumers’ concern about healthy and unhealthy products had driven the food industry toward health and wellness food improvement and development. Functional and organic food consumption was likely to increase in order to satisfy their health benefits. Ali and Ali [27] analyzed the willingness to pay for health and wellness food products in India and found that health consciousness significantly affected the buyers’ willingness to pay. Chen [28] also confirmed that health consciousness positively affected the consumers’ willingness to eat functional foods in Taiwan. Similarly, Kushwah et al. [29] reviewed the literature and highlighted that health consciousness influenced organic food consumption. Nagaraj [30] revealed that the consumer’s buying intention of organic food products in India was influenced by the health consciousness, increasing organic food consumption. Pham et al. [31] also suggested that health consciousness significantly influenced attitude towards organic food, especially a substantial purchase intention for young consumers in Vietnam. However, these results are contradictory to Liu et al. [32]. They suggested that health consciousness had an insignificant impact on organic consumption attitude and the consumers’ purchase. Sumi and Kabir [33] also investigated the impact of health benefits on consumers’ buying intention of organic tea in Bangladesh. They found that the health benefit had positive and significant relationships with the consumer’s perceived value and the consumer’s buying intention of organic tea. Understanding the health benefits of organic food and food accessibility tends to overcome the consumer’s limited health awareness. Moreover, the COVID-19 pandemic has accelerated health trends; meanwhile, adaptive consumer behavior boosts consumers’ immune systems and maintains their health. Consumers need innovative functional foods and nutraceuticals such as vitamins and antioxidants in the COVID-19 pandemic and post-pandemic era [19].
2.2. Digital Technology
Digital technologies such as the internet, information and communication technology, blockchain in the food supply chain, and industry 4.0 applications have become the substantial driver of food consumption and distribution nowadays, and for the food industry in the future. Miran-da-Ackerman and Colín-Chávez [34] suggested that innovation and new technology development could enhance food supply chain optimization, such as distributional channels and marketing. To date, there is much debate and literature regarding the effect of the use of digital technology on food consumption. These studies usually suggested strong relationships as rigorous as possible [35,36,37,38,39,40,41,42,43,44]. Samoggia et al. [35] collected the existing studies about the effect of digital technologies on food consumption and indicated that the digital platforms and applications rendered the food supply chain reduction and elimination of intermediaries’ transaction processes. Thereby, digital technologies generated an increase in food production and consumption. Li et al. [36] confirmed that online food delivery platforms rendered economic, social, and environmental impacts on sustainability. Job and sale opportunities were generated by the consumers’ use of online food delivery platforms. Similarly, Maimaiti et al. [37] indicated that the online-to-offline food delivery services changed consumers’ food shopping habits in China and increased food delivery consumption/orders. Their findings were in line with Chen et al. [38]. Elms et al. [39] explored the consumers’ internet grocery shopping using ethnographic case studies and found that consumers continued using the internet for shopping over time. Furthermore, Lemke and Schifferstein [40] highlighted that the use of information and communication technology (ICT) devices played an important role in providing information about the health benefits of food that could further encourage consumers’ purchase. Digitalization has also driven the transformation of retail chain stores that rendered retailers’ regional expansion and increased the market share of retail trade [41]. Dubé et al. [42] revealed that the eKutir technology that integrated ICT platform and ecosystem with micro-entrepreneurs tended to increase fruit and vegetable consumption in Odisha, India. Likewise, Davies [43] suggested that technological innovation and ICT had an essential role in sustainable eating futures. These technologies were used as food scanners for analyzing the food supply chain quality and the linkage of food growers and consumers. Digital technologies have also contributed to security in the COVID-19 pandemic period. For instance, the application and smart systems for supporting food processing facilities in the COVID-19 pandemic and lockdown period were utilized for the food supply chain’s safety. Meanwhile, the online delivery for supply chains and mobile applications for shopping tended to support food security [19]. Interestingly, Hassen et al. [44] revealed that during the COVID-19 pandemic, consumers’ food behavior in Russia was significantly associated with ordering groceries online, but shopping online was not yet widely used by Russian consumers. In addition, Sarkar and Costa [45] indicated that changes in food demand and supply were influenced by the public acceptance of food technology and digital platforms. Thereby, an open innovation system was a crucial process to improve food technology and digital platforms. Their results are similar to Nambisan et al. [46]. They suggested that open innovation and platforms via sharing knowledge and assets, sharing risks, and re-defining the business collaboration tended to create business opportunities.
2.3. Market Concentration
Market concentration has long attracted much attention from scholars. It accounts for the industry’s market structure, observing the number and size distribution of all firms in such industries. The Herfindahl–Hirschman index (HHI), calculated as the sum of squared market shares of all firms in a specific industry, is widely used to measure market concentration [47,48]. Moreover, the brand and distribution channel concentration across each category [49] reflect the diversified products and distribution channels used for consumer choice. During the COVID-19 pandemic, food distribution channels, particularly food retailing, became an essential role in food consumption in Canada [18]. Maintaining consistent food, grocery availability, and delivery were the main factors influencing consumers’ purchasing behavior. Ali and Alam [50] suggested that retail distribution channels significantly affected the health and wellness food retail in the Indian market. Independent small grocers, other grocery retailers, and supermarkets were the leading retail distribution channels for health and wellness food, whereas the retail distribution channel competition measured by HHI has been growing in India. Likewise, Ali et al. [51] revealed that the level of competition in India’s health and wellness food market was high (low HHI), and distribution channels had a significant impact on the health and wellness food market. Mullenga et al. [52] investigated the effect of market participation factors (i.e., crop commercialization and food group production diversification) on food dietary diversity in Zambia using a household survey. Their results showed that food product diversification had a significant and positive impact on household dietary diversity, and suggested that food group production diversification should be promoted. Moreover, some studies focused on the impact of retail concentration on retail product prices. For instance, Hovhannisyan and Mozic [53] examined the effect of market concentration (measured by firm size distribution) on retail dairy product prices in the United States and found that market concentration had a significant and positive impact on retail price. Aalto-Setälä [54] also showed that food prices in Finland were influenced by market concentration measured by the size of the retail firm.
Moreover, socio-economic factors, e.g., income per capita, economic growth, and population and product attributes, affect healthier food consumption. Using data at the country level, Nunes et al. [22] found that income per capita had a significantly positive relationship with increased healthier food demand, whereas economic growth and population had no significant relation. Based on the consumer survey, Ali and Ali [27] highlighted that the willingness to pay for health and wellness food products was influenced by socio-demographical characteristics of the buyers such as age, gender, income, and education. The willingness to pay was also influenced by product attributes such as product quality, price, packaging, and taste. Tsartsou et al. [55] confirmed that doubting the health benefits, preference for a healthy diet, and high price were the main factors of non-purchasing in dietary supplements and functional foods.
2.4. Open Innovation
Open innovation was first introduced by Chesbrough [56]. It refers to internal and external knowledge flows to improve internal innovation (open inbound innovation) and expand the markets for external exploitation of innovation (open outbound innovation). Currently, open innovation is one of the keys to a successful business. There is now extensive literature on open innovation and an interest in open innovation interaction [57,58,59,60,61,62,63,64,65]. Tomlineson and Fai [57] examined the determinants of innovation in UK small and medium-sized enterprises (SMEs). They found that cooperation with buyers, suppliers, and competitors (along the supply chain) had significant and positive effects on innovation, product innovation, and process innovation of UK SMEs. Considering open innovation from a consumer interaction perspective, Valdez-Juárez et al. [58] examined the relationship between online buyers and website security measured by the linkage of consumer behavioral reasoning and technological adaptation. They found that website security positively influenced online buyers. Mikheev et al. [59] suggested that mobile application was likely to improve the interaction between manufacturers, retailers, and buyers. These findings reflect the open innovation process regarding the cooperation between consumers and digital technology providers in business management. Considering open innovation from a producer interaction perspective, Markovic et al. [60] suggested that business-to-business open innovation by collaboration with business customers and competitors was a way of doing business in emerging markets. Their findings align with Nuthalapati and Nuthalapati [61], who explored the interconnections between startups in food and agriculture in India, and their business partnerships (from upstream to downstream) to improve the food value chain and level of technologies. Kafetzopoulos et al. [62] revealed that collaboration, environmental dynamism, knowledge orientation, quality orientation, and process management were the key drivers of the innovation process in Greek agricultural food companies. Their findings are similar to Bogers et al. [63] and Alva-rez-Meaza et al. [64]. Lastly, Mahdad et al. [65] indicated that adaptive capacity triggered by trust, social embeddedness, duality, and creativity skills were the challenges of open innovation in companies.
In summary, the significant drivers of open innovation are innovation networks, collaboration with stakeholders on the supply chain, innovation ecosystem, and digital technology, which are crucial issues for businesses and policymakers.
2.5. Business Model
A business model is a systematic framework for doing the business. Osterwalder and Pigneur [66] developed a business model canvas to attribute strategic management with 15 building blocks: customer segments, value propositions, channels, customer relationships, revenue streams, key resources, key activities, key partnerships, and cost structure. The business model canvas was widely used in various businesses, including the food and agriculture business. The business model was also employed to design a sharing economy [67] and a circular economy [68]. Barth et al. [69] investigated the effects of technological and social-and-organizational innovation on a sustainable business model in the Swedish agricultural sector. Their findings revealed that only organization innovation had a significant effect on the sustainable business model archetype. Danse et al. [70] evaluated the business model characteristics of private sector initiatives aiming at food and nutrition security improvements. They found that quality of products and services, training, and coalition building were the main factors to support the business model’s success. Lastly, Björklund et al. [71] analyzed a new business model in the COVID-19 pandemic using experimental research. A model with operational viability through searching for alternative revenue streams and the resiliency of the ventures through expanding the solution space was well served in the COVID-19 pandemic. All these studies also indicated that the business model and business ecosystem of markets were essential.
In a nutshell, the literature suggests that healthy food consumption appears to depend on health trends, digital technology, and market concentration. Most findings are consistent with the existing studies mentioned previously. Even though the demand-driven market can generate health and wellness food revenues, demand-driven innovation sustains the health and wellness food industry. Branstad and Solem [72] and Frenkel et al. [73] showed that consumers’ roles in market innovation, such as knowledge adoption and diffusion of innovations, and market actors were essential to market expansion and new market creation. Like many other great food industries globally, the Asian food market is currently undergoing massive food development. The shortcomings remain in this field because of a lack of combined consideration of health trends, digital technology, and market concentration of health and wellness food consumption. This study targets to reveal their relationship and suggest business model innovation for health and wellness food. Based on the above literature, a conceptual framework of this study is presented in Figure 3.
3. Economic Approach
A quantitative analysis approach is applied to examine the role of health trends, digital technology, and market concentration in health and wellness food consumption in the Asian market.
3.1. Model
Following the literature review mentioned previously, we develop an empirical model with health and wellness food consumption as a key dependent variable. Our model specification indicates that health trends, digital technology, and market concentration affect health and wellness food consumption in the Asian market. The model in the linear equation is shown as follows:
where is the logarithm of health and wellness food consumption measured by the retail value of health and wellness packaged food. refers to health trends; countries with high numbers of consumers who undertake the health trends are likely to consume health and wellness food. denotes the use of digital technologies; countries with high numbers of consumers who use digital technologies for food purchasing tend to consume more health and wellness food. is market concentration considering brands’ concentration and concentration of distribution channels; countries with a low market concentration of brands and distribution channels are likely to spend more on health and wellness food. is socio-economic control variables necessary for the estimation, i.e., consumers’ income and unit price of health and wellness food; countries with high consumer income and low prices of products tend to spend more on health and wellness food. and are the health and wellness food market (country) and the period (year), respectively. is the error term. According to the literature review, the signs of coefficient and are expected to be positive, whereas the expected signs of coefficient and could be either positive or negative.
3.2. Data Source
This study employs panel data for regression analysis drawn from 14 Asian countries (Australia, China, Hong Kong (China), India, Indonesia, Japan, Malaysia, New Zealand, Philippines, Singapore, South Korea, Taiwan, Thailand, and Vietnam) during the period 2006–2020. It amounts to a total of 14 × 15 = 210 observations. The research data are sourced as follows.
Data on dependent and independent variables are taken from the Euromonitor International database [23]. The dependent variable, health and wellness food consumption is measured by the retail sales value adjusted at constant 2020 million U.S. dollars. In addition, the retail sales value of five types of health and wellness food, fortified/functional packaged food , better-for-you packaged food , free-from packaged food , naturally healthy packaged food , and organic packaged food , are also gathered and used in the alternative investigation. Fortified/functional packaged food is a health and wellness food product adding health ingredients and/or nutrients. Better-for-you packaged food is a health and wellness food product reducing unhealthy substances e.g., fat, sugar, and salt. Free-from packaged food is a health and wellness food product free from ingredients causing allergy or intolerance e.g., gluten and lactose. Naturally healthy packaged food is a health and wellness food product containing natural substances to improve health and well-being. Organic packaged food is a health and wellness food product passing through the certified organic processes. From the share of health and wellness food retail in Asian countries from 2006–2020 [23], China was the most significant health and wellness food retail market in Asia (46.6%), followed by Japan (19.1%), Australia (6.0%), Indonesia (5.5%), South Korea (5.5%), India (3.7%), Vietnam (2.5%), Thailand (2.4%), Philippines (2.3%), Hong Kong (2.1%), Taiwan (1.6%), Malaysia (1.3%), New Zealand (1.1%), and Singapore (0.6%). Likewise, Japan was the largest in the fortified/functional food retail market (28.6%), followed by China (28.1%), Indonesia (8.8%), and South Korea (7.9%). Japan also was the largest better-for-you food retail market (40.1%), followed by Australia (33.8%) and New Zealand (5.0%). China was the largest free-from food retail market (50.7%), followed by Japan (34.8%). China still was the largest naturally healthy food retail market (39.0%), followed by Japan (34.8%), Australia (15.9%), India (6.6%), and South Korea (6.0%). Lastly, Japan was the largest organic food retail market (40.2%), followed by Australia (22.6%), China (15.3%), South Korea (11.4%), and New Zealand (5.4%).
The independent variable, health trends , is proxied by the growth rate of consumer health retail sales. Consumer health retail selling reflects more or less activity supporting consumer health improvement and indicating a level of health trends. The variable, the digital technology use for food purchasing, is proxied by mobile internet subscribers and mobile telephone subscribers , measured in thousand subscribers. The variable, market concentration, is proxied by the brand concentration and concentration of distributional channels calculated from the Herfindahl–Hirschman index (HHI) formula [41]. The brand concentration is calculated by squaring the market share (measured by the retail sales value) of each brand competing in the health and wellness market, and then summing the numbers. The distribution channels in this study focus on (i) four types of store-based retailing, i.e., modern grocery retailers, traditional grocery retailing, non-grocery retailing, and mix retailers, and (ii) four types of non-store retailing, i.e., vending, home-shopping, e-commerce, and direct selling. The concentration of distribution channels is calculated by squaring the market share (measured by the retail sales value) of each distribution channel in the health and wellness market, and then summing the resulting numbers. The socio-economic variables include consumers’ income, income per capita, and the price of the product. The variables, consumers’ income and income per capita , are proxied by the disposable income and disposable income per capita measured in constant 2020 million U.S. dollars, respectively. The variable, price , is proxied by the unit price of health and wellness food retail measured in constant 2020 U.S. dollars per tonnes. The descriptive statistics of the variables used in this study are shown in Table 1.
3.3. Methods
The panel dataset containing 14 Asian countries from 2006 to 2020 (15 years) is used in this study. It is known that using a panel dataset is likely to occur problems of cross-section dependence and non-stationary regressors. Neglecting these issues may cause inaccurate and spurious regression results. Therefore, testing the presence of cross-section dependence, the presence of unit root, and the normality must be conducted before regression analysis. The Pesaran [74] cross-section dependence (CD) test is used in this study. Under the null hypothesis of no cross-section dependence, the Pesaran-CD statistic has zero mean and constant variance, rendering the panel data model as non-stationary, dynamic, and heterogeneous. Regarding panel unit root testing, this study employs the first-generation Im, Pesaran, and Shin (IPS) [75] panel unit root test and the second-generation Pesaran [76] cross-section dependence augmented unit root tests, namely cross-sectionally augmented Dickey–Fuller (CADF) and cross-sectionally augmented Im, Pesaran, and Shin (CIPS). The null hypothesis is the presence of panel unit root. The cross-section dependence augmented unit root test can check the degree of residual cross-section dependence and tackle the problem of panel data heterogeneity. Moreover, we employ the Shapiro–Wilk test and the Shapiro–Francia test [77] to check the normality for all variables in this study. The null hypothesis is that the variable is normally distributed. If the variables in the model are not normally distributed, the panel quantile regression approach is more appropriate for the data than the conditional mean regression approach.
Next, we use the quantile regression for panel data suggested by Powell (QRPD) [78] to investigate the effects on health and wellness food consumption. Quantile regression provides the heterogeneity of the panel data model varying with multiple quantiles. It is also useful to better understand the distribution of health and wellness food consumption. The QRPD estimator by Powell [78] assumes the non-additive fixed effects model maintaining non-separable disturbances in the panel data model. There are two advantages over quantile panel data estimators with additive fixed effects [78,79]. First, the QRPD estimates the impact of explanatory variables on the quantile of the outcome distribution used within variation in the explanatory variables for identification purposes. Second, the QRPD avoids the difficulties in estimating a large number of fixed effects in a quantile model and tackling the number of incidental parameters that are smaller. Hence, the QRPD is adopted to examine the relationship between health and wellness food consumption and its related factors in this study. The quantile function of the panel data model is shown as follows:
where is set of explanatory variables consisting of trends, technology, market concentration, and socio-economic control variable. is the coefficient vector of interest. is the error term where is the function of the fixed effects and individual time-varying disturbance term . The quantile function of Equation (2) is
where is the -th quantile of , and is strictly increasing in . The estimation of the quantile function by Powell [78] employs the Generalized Method of Moments (GMM) approach.
4. Results
Prior to the empirical analysis, the cross-sectional dependence test [74] and panel unit root test [75,76] are conducted. It includes the Pesaran-CD test, the first-generation IPS panel unit root test, and the second-generation CADF and CIPS panel unit root tests for nine variables in our baseline model. The results of the baseline diagnostic tests are shown in Table 2. First, the first-generation IPS panel unit root test results show that all variables (except hw, hwpu, hwpc) are stationary at the level, and all variables in the panel data model are stationary at the first difference. Second, the Pesaran-CD statistics indicate the cross-section dependence for all the variables (except hwdc). Finally, the second-generation CIPS panel unit root test results reveal that all variables are stationary at the first difference level. The second-generation CADF unit root test results are in accordance with those obtained in the CIPS unit root test. The normality test of all variables is further conducted. The test results are shown in Table 3. The null hypothesis is rejected by both the Shapiro–Wilk test and the Shapiro–Francia test for all variables. It indicates that all variables are not normally distributed.
According to the diagnostic tests, we found that all observed variables in our model are not normally distributed, and stationary at the first difference level. Therefore, the panel quantile regression approach is appropriate in model estimation. Meanwhile, the first difference data are employed in our estimation analysis.
4.1. Is Health and Wellness Food Consumption Sensitive to Health Trends, Digital Technology, and Market Concentration?
Table 4 presents the panel quantile regression results on the effect of health trends, digital technologies, market concentration, and socio-economic factors on health and wellness food consumption in the 14 Asian countries. The results are expressed for quantile (10th, 20th, 30th, 40th, 50th, 60th, 70th, 80th, and 90th) percentiles of the conditional distribution of health and wellness food consumption. According to the share of health and wellness food consumption of 14 Asian countries as shown in Section 3.2, high consumption countries were China, Japan, Australia, Indonesia, and South Korea; and low consumption countries were India, Vietnam, Thailand, Philippines, Hong Kong, Taiwan, Malaysia, New Zealand, and Singapore. The findings also reveal that the impacts of health-related determinants on health and wellness food consumption are heterogeneous and asymmetric.
First, the estimated coefficients of the ‘health trends’ variable are statistically significant and positive in all quantiles at the 1% level, which indicates that health trends tend to increase health and wellness food consumption in Asia. Our findings are consistent with Khan et al. [25], who suggested the importance of trends in health and wellness on the food market position. Ali and Ali [27], Chen [28], Kushwah et al. [29], and Nagaraj [30] also support our findings that health consciousness significantly increases health and wellness food consumption in the Asian market.
Second, the estimated coefficients of ‘the digital technology’ variables (mobile internet use and mobile telephone use) are statistically significant. The coefficients of mobile internet subscribers are negatively significant at the 1% level in the 10th, 20th, 30th, and 50th quantile, and they are positively significant at the 1% level in the 40th, 80th, and 90th quantile and then insignificant in the 60th and 70th quantile. The significant positive results at high quantiles indicate that mobile internet induces health and wellness food consumption in higher consumption countries such as China, Japan, Australia, Indonesia, and South Korea. Meanwhile, the coefficients of the mobile telephone subscribers are significant and positive in all quantiles, which indicates that mobile telephone is likely to boost health and wellness food consumption in all countries. Samoggia et al. [35], Dubé et al. [42], and Hassen et al. [44] also found similar results to our findings where they suggested that the use of digital technology generated an increase in food consumption. Moreover, the open innovation approach associated with digital platform development should be engaged in the food business model [45,46].
Third, the estimated coefficients of ‘market concentration’ variables (brands’ concentration and concentration of distribution channels) are statistically significant. The coefficients of brands’ concentration are positive and significant at the 1% level in the 20th, 30th, 40th, and 50th quantile, and they are significant and negative in the 90th quantile while insignificant in the other quantiles. The significant positive results at low quantiles indicate that brands’ concentration in the health and wellness food market encourages health and wellness food consumption in lower consumption countries. Conversely, brands’ concentration positively influences the health and wellness food consumption in higher consumption countries. At the same time, the coefficients of concentration of distribution channels are significant and negative in all quantiles. More specifically, the coefficients decrease from −0.793 at the 10th quantile to −3.489 at the 90th quantile. This indicates that the concentration of distribution channels in the health and wellness food market causes lower health and wellness food consumption in higher consumption countries over lower consumption countries. Our findings are similar to the findings of Ali and Alam [50] and Ali et al. [51], who found that retail distribution channels in India had a significant relationship with the health and wellness food market.
Finally, the estimated coefficients of ‘socio-economic’ variables (income, income per capita, and unit price) are statistically significant. The coefficients of unit price are significant and positive in all quantiles except the 80th quantile. More interestingly, these coefficients decrease from 0.951 at the 10th quantile to 0.100 at the 90th quantile. It reveals that health and wellness food price induces an increased health and wellness food consumption in lower consumption countries over higher consumption countries. Our findings contrast to Tsartsou et al. [55], who found that higher prices caused non-purchasing in dietary supplements and functional foods. The coefficients of income per capita are significant and negative in the 20th, 30th, and 40th quantile. They are significant and positive in the 50th, 60th, 80th, and 90th quantile and then insignificant in the 10th and 70th quantile. The significant positive results at high quantiles indicate that income per capita increases health and wellness food consumption in high consumption countries. The coefficients of income are positive and significant in the 10th, 20th, 30th, and 40th quantile, and they become significant and negative in the 80th and 90th quantile while insignificant in the other quantiles. The significant positive results at low quantiles indicate that consumers’ income rises health and wellness food consumption in low consumption countries. Our findings align with Nunes et al. [22] and Ali and Ali [27]. They discovered that consumers’ income significantly tended to increase health and wellness food consumption.
In conclusion, the empirical results reveal that health trends, digital technology, and market concentration have significant effects on health and wellness food consumption in countries in Asia.
4.1.1. Alternative Empirical Results
The estimated results shown in the previous section indicate the effects of trends, technology, and market concentration on general health and wellness food consumption. This section extends the analysis to focus on each type of health and wellness food consumption. Following the share of health and wellness food consumption mentioned in Section 3.2, high consumption countries in fortified/functional food were Japan, China, Indonesia, and South Korea. High consumption countries in better-for-you food were Japan, Australia, and New Zealand. High consumption countries in free-from food were China and Japan. High consumption countries in naturally healthy food were China, Japan, Australia, India, and South Korea. High consumption countries in organic food were Japan, Australia, China, South Korea, and New Zealand. Table 5 presents the estimated results of panel quantile regression on fortified/functional food consumption (ffufood), better-for-you food consumption (bfyfood), free-from food consumption (fffood), naturally healthy food consumption (nhfood), and organic food consumption (orgfood).
With the cross-section dependence test and panel unit root test, their results indicate that the first difference data should be used in our alternative estimation regression (reported in Appendix A). The QRPD estimation results show the heterogeneous results for different types of health and wellness food consumption.
First, health trends significantly impact fortified/functional food consumption and free-from food consumption in almost all quantiles. The findings are in line with our baseline results. It also found that health trends significantly impact better-for-you food consumption in the low quantiles (10th–40th) and the highest quantiles (80th and 90th). Meanwhile, the coefficients of health trends are positive and significant to naturally healthy food consumption in the low percentiles (10th–50th) and negative and significant to naturally healthy food consumption in the high percentiles (60th and 80th). Lastly, health trends significantly impact organic food consumption in the 60th quantile and significantly and negatively impact the low (10th and 30th) and high (70th–90th) quantiles. Most results show, as expected, that health trends are likely to stimulate health and wellness food consumption in Asian countries. The findings of Falguera et al. [26], Chen [28], and Galanakis et al. [19] confirmed that health trends and health consciousness were important to boost functional food consumption, whereas the findings of Kushwah et al. [29], Nagaraj [30], Pham et al. [31], and Sumi and Kabir [33] found a positive impact on organic food and beverages. However, the results also reveal that the higher the health trends, the lesser the organic food consumption. These findings align with Liu et al. [32], who found that health consciousness was insignificant to organic food consumption.
Second, digital technology in terms of mobile internet use has significant and negative impacts on naturally healthy food consumption, free-from food consumption, fortified/functional food consumption in the low percentiles, and significant and positive impacts in the high percentiles. The findings are in line with our baseline results. Mobile internet use also has significant and positive impacts on better-for-you food consumption and organic food consumption in almost all quantiles. In addition, digital technology in terms of mobile telephone use has significant and positive effects on fortified/functional food consumption and better-for-you food consumption in almost all quantiles. These findings are consistent with the baseline results. Mobile telephone use has significant and positive impacts on naturally healthy food consumption, organic food consumption, and free-from food consumption at the high quantiles. Most results indicate the essential role of digital technology for health and wellness food consumption in Asian countries. These are in line with the findings of Samoggia et al. [35], Lemke and Schifferstein [40], and Hassen et al. [44], who suggested that digital technologies such as digital platforms and food applications tended to increase consumers’ food purchases. Thereby, an open innovation system was likely to support the food industry.
Third, brands’ concentration has a significant and positive impact on fortified/functional food consumption, better-for-you food consumption, and free-from food consumption in almost all quantiles. Meanwhile, the coefficients of brands’ concentration are significant and negative to naturally healthy food consumption, organic food consumption in the low percentiles, and significant and positive in the high percentiles. Most findings are in contrast to our baseline results. Moreover, the concentration of distribution channels has a significant and negative impact on better-for-you food consumption in all quantiles. The findings are consistent with the baseline results. It also found that the coefficients of the concentration of distribution channels are negative and significant to fortified/functional food consumption and naturally healthy food consumption from the middle percentiles onwards. Lastly, the distribution channel concentration coefficients are significant and negative to free-from food consumption and organic food consumption in the low percentiles and positive and significant in the high percentiles. The results reveal that brand and distribution channel diversification is vital to stimulate health and wellness food consumption in Asian countries. Similarly, the findings of Ali and Alam [50] and Ali et al. [51] indicated that the retail distribution channels were essential to health and wellness food consumption in India.
Finally, the coefficients of unit price are positive and significant to fortified/functional food consumption, better-for-you food consumption, naturally healthy food consumption, and organic food consumption in all quantiles. The findings are consistent with the baseline results. Interestingly, the unit price has a significant and negative impact on free-from food consumption in the high quantiles (70th–90th). Following the various health and wellness foods, the effects of income per capita and consumer income on health and wellness food consumption are heterogeneous and asymmetric. The income per capita has significant and positive impacts on better-for-you food consumption and organic food consumption in all quantiles. The income per capita has a significant and negative impact on fortified/functional food consumption in the low quantiles and a significant and positive impact in the high quantiles. The findings are in line with the baseline results. Lastly, income per capita has significant and positive impacts on free-from food consumption and naturally healthy food consumption in the low quantiles and significant and negative impacts in the high quantiles. Furthermore, consumer income has significant and negative impacts on better-for-you food consumption, naturally healthy food consumption, and organic food consumption in almost all quantiles. Consumer income has a significant and positive impact on fortified/functional food consumption in the low quantiles and a significant and negative impact in the high quantiles. The findings are consistent with our baseline results. Lastly, consumer income has a significant and negative impact on free-from food consumption in the low (10th and 20th) and highest quantiles, and a significant and positive impact in the 70th quantile. Despite these heterogeneous results, socio-economic factors are important to increase health and wellness food consumption in Asian countries. These findings are affirmed by Nunes et al. [22] and Ali and Ali [27].
4.1.2. Robustness Check
To evaluate the robustness check for this study, we replace the health and wellness food consumption with the health and wellness food consumption per capita (hwpc), health and wellness food consumption per overweight population (hwpc-owp), and health and wellness food consumption per obese population (hwpc-obp).
Table 6 shows the results of panel quantile regression with different values of health and wellness food consumption. Most results are consistent with the baseline results. The health trends variable is statistically significant and positive in all quantiles except the 80th and 90th quantile. The results still confirm that health trends cause an increase in health and wellness food consumption; our results are robust. The digital technology variables (mobile internet use and mobile telephone use) are statistically significant across quantiles. The results show the heterogeneous relationship between digital technology and health and wellness food consumption, which significantly affects higher quantiles.
Likewise, the brands’ concentration and concentration of distribution channels are statistically significant in most quantiles. The results still indicate that brands’ concentration is likely to increase health and wellness food consumption, whereas the concentration of distribution channels tends to reduce the health and wellness food consumption. The price of health and wellness food is significant and positive in all quantiles, where a rise in price causes an increase in health and wellness food consumption. The income per capita and income are statistically significant. The results indicate that the effects of income per capita and consumer income on health and wellness food consumption are heterogeneous and asymmetric.
5. Discussion
The main findings of the current study show that health trends, digital technology use, and brands’ concentration have significant and positive effects on health and wellness food consumption, whereas the concentration of distribution channels has a significant and negative effect. Most findings are consistent with the existing studies mentioned previously. It also implies that health trends, the use of digital technology, and distribution channels’ diversification are drivers of health and wellness food market development. As the digital economy spreads, digital technology becomes a crucial driver for open innovation. The larger the digital technology use, the more significant the role in the open innovation process. Moreover, open innovation (e.g., food open innovation, restaurant open innovation and service open innovation) is likely essential to design the health and wellness food business model in Asia, particularly in Singapore, South Korea, Hong Kong, China, and Japan, which ranked top twenty in the 2020 global innovation index [80]. This index sheds light on a country’s innovation performance, measuring the innovation input and output performance relating to the political environment, education, infrastructure, and business sophistication. However, countries with low innovation index, e.g., Indonesia, India, Thailand, and Vietnam should move forward to digital transformation and adopt business model innovation for the health and wellness food industry [80].
Moreover, a consumer-driven open innovation strategy plays a vital role in business model design for health and wellness food. This strategy focuses on the consumer role in knowledge adoption and diffusion of innovations and actor role [45,46,72,73].
First, this study shows the direct impacts of health trends and digital technology on health and wellness food consumption in Asian countries. The health and digital trends lead to changes in consumer norms and the way people live. Hence, healthy food literacy and digital literacy for consumers are essential to generate business model innovation for health and wellness food. In addition, the building of social innovation for health and digital literacy contributes to developing the health and wellness food business model.
For comparison, we can categorize the linkage of health trends and health and wellness food consumption between 2015 and 2020 into four groups (see Table A3). The first group are countries with higher health trends and health and wellness food consumption, i.e., Singapore, South Korea, and the Philippines. It appears that consumers in this group are aware of their health and have a high willingness to pay for health and wellness food. Health and wellness food innovation is the best way to keep these consumers. The second group are countries with higher health trends and lower health and wellness food consumption, i.e., Malaysia. Consumers in this group are aware of their health, but they prefer other ways to maintain their health rather than health and wellness food consumption. Building the understanding and awareness of health and wellness food is essential. The third group are countries with lower health trends and higher health and wellness food consumption, i.e., Indonesia and Japan. It appears that consumers in Indonesia and Japan tend to purchase health and wellness food as their habits no matter what health trends are. The building of social innovation for health literacy is likely to increase health and wellness food consumption. The fourth group are countries with lower health trends and health and wellness food consumption, e.g., Australia, China, Hong Kong, India, New Zealand, Taiwan, Thailand, and Vietnam. In this group, there are six countries—Australia, India, New Zealand, Taiwan, Thailand, and Vietnam (not China and Hong Kong)—in which health and wellness food consumption in 2020 had a positive growth rate. It indicates that even though consumers in this group are less aware of health trends, they still have a modest willingness to pay for health and wellness food. Health and wellness food innovation, building the understanding and awareness of health and wellness food, and building social innovation for health literacy are crucial.
Second, our results reveal the importance of consumers’ use of digital technology on health and wellness food consumption in Asian countries. The accessibility to digital platforms and open innovation is significant for the enhancement of the business environment. The government should seek to develop a digital innovation ecosystem that facilitates health and wellness food businesses and uplifts the competitiveness in the health and wellness food business.
Comparatively, the relationship between digital technology and health and wellness food consumption between 2015 and 2020 can be categorized into six groups (see Table A3). The first group is countries with higher mobile internet use, mobile telephone use, and health and wellness food consumption, i.e., Singapore and South Korea. Singapore and South Korea are the world’s second and eighth most digitally competitive countries in 2020, respectively [80]. It is probable that consumers in this group use digital technologies for their health and wellness food consumption choices. Advanced digital technology and digital innovation ecosystem can support and shape the future health and wellness food market. The second group is countries with higher mobile telephone use and health and wellness food consumption, and lower mobile internet use, i.e., Japan and the Philippines. The third group is countries with higher health and wellness food consumption and lower mobile internet use and mobile telephone use, i.e., Indonesia. Consumers in all of these groups purchase more health and wellness food independent of whether mobile internet and mobile telephone are better or worse off. Digital technology is a secondary driver of health and wellness food consumption. However, the better the digital technology, the greater the business opportunities grow. The fourth group is countries with higher mobile internet use and mobile telephone use and lower health and wellness food consumption, i.e., Hong Kong. The fifth group is countries with higher mobile telephone use and lower mobile internet use and health and wellness food consumption, i.e., China, Malaysia, Taiwan, and Vietnam. Consumers in all of these groups have less willingness to pay for health and wellness food even there is more or less mobile internet use and mobile telephone use. Even though digital technology is an indirect factor in stimulating health and wellness food consumption, food businesses can benefit from digital platforms and open innovation, including a digital innovation ecosystem. The sixth group is countries with lower mobile internet use, mobile telephone use, and health and wellness food consumption, i.e., Australia, India, New Zealand, and Thailand. In 2020, countries in this group had favorable growth rates of mobile internet use, mobile telephone use, and health and wellness food consumption. It is expected that the future health and wellness food market can drive simultaneously with digital platforms and open innovation.
Finally, our results also indicate that the diversification of distribution channels increases health and wellness food consumption. The health and wellness food industry should pursue the competitive innovation market framework for sustainable development. It is essential to increase producers and exporters and further develop diversified domestic and export markets. Market diversification can reach the consumption and production maximization for health and wellness food.
Relatively, the relationship between the concentration of brand and distribution channels and health and wellness food consumption between 2015 and 2020 can be categorized into six groups (see Table A4). The first group is countries with higher brand and distribution channel concentration and health and wellness food consumption, i.e., the Philippines. The Philippines had high brand diversification and moderate distribution channels diversification in 2020. This makes consumers purchase more health and wellness food. The second group is countries with higher brand concentration, higher health and wellness food consumption, and lower channel concentration, i.e., Indonesia and Singapore. The third group is countries with lower brand and distribution channel concentration and higher health and wellness food consumption, i.e., Japan and South Korea. These groups tend to purchase more health and wellness food through various distribution channels no matter what brand diversification is. Building the competitive innovation market for health and wellness food can support their consumer’s satisfaction. The fourth group is countries with higher brand and distribution channel concentration and lower health and wellness food consumption, i.e., Australia, Hong Kong, and Malaysia. The fifth group is countries with higher brand concentration and lower distribution channel concentration and health and wellness food consumption, i.e., India, Taiwan, Thailand, and Vietnam. The sixth group is countries with a lower brand and channel concentration and health and wellness food consumption, i.e., China and New Zealand. The concentration of either brand or distribution channels may cause lower health and wellness food consumption in these groups. Increased producers and traders, including improved domestic and foreign market diversification, can be a possible food consumption alternative.
In summary, a customer-driven innovation strategy will become a viable way to enhance the health and wellness food business, especially in Asia.
6. Conclusions
This study investigates the effects of health trends, digital technology, and market concentration on health and wellness food consumption in the Asian market. The annual panel data on 14 Asian countries from 2006 to 2020 and the panel quantile regression estimator with non-additive fixed effects [78] are employed to investigate this study. Our baseline estimation results show that the effects of health trends, digital technology (especially mobile telephones) and distribution channel diversification on health and wellness food consumption are more substantial for Asian countries in all quantiles. We also found that the estimation results of fortified/functional food consumption, better-for-you food consumption, free-from food consumption, naturally healthy food consumption, and organic food consumption are heterogeneous. However, most results are similar to the baseline results. The study indicates that health trends, digital technology, and market concentration have an essential role in health and wellness food consumption.
This study has its limitations. First, although this study provides a new perspective for examining the effects on health and wellness food consumption, there may be presumably other effects that we neglect. Second, we focus on health and wellness health consumption in specific countries, i.e., Asian countries. Indeed, there remains a group of interesting countries that should be studied. These shortcomings could be improved in future studies.
In summary, this paper provides three key contributions. First, it is the first attempt to navigate health trends, digital technologies, and market concentration affecting health and wellness food consumption in the Asian market. Second, it highlights the possibility of these effects in each type of health and wellness food product. Finally, it discusses the health and wellness food futures, focusing on a consumer-driven open innovation strategy. Consumer-driven open innovation appears to be a novel opportunity for driving health and wellness food consumption. Meanwhile, it is a challenge for health and wellness entrepreneurs to reach the ultimate business goal.
Funding
This research was funded by Mae Fah Luang University, grant number 60103030004.
Institutional Review Board Statement
Not applicable.
Informed Consent Statement
Not applicable.
Data Availability Statement
All relevant data are in the paper.
Conflicts of Interest
The authors declare no conflict of interest.
Appendix A. Diagnostic Testing in Alternative Models and Robustness Check
Table A1 and Table A2 present the results of cross-section dependence test, the first-and-second generation panel unit root tests, and normality test for the additional variables in alternative models and robustness check.

Table A1.
First- and second-generation Panel unit root tests for alternative estimates.
| Variables | Definition | IPS | Pesaran-CD | CIPS | CADF | ||
|---|---|---|---|---|---|---|---|
| Level | First Diff. | Level | First Diff. | ||||
| ln(ffufood) | FFU consumption | −1.915 | 25.774 * | −2.388 ** | −3.591 * | −2.020 | −3.591 * |
| ln(ffupu) | FFU unit price | −1.152 | −1.347 | −1.837 | −2.722 * | −1.472 | −2.722 * |
| ffubc | FFU brand concentration | −1.366 | 36.507 * | −2.027 | −3.337 * | −2.027 | −3.337 * |
| ffudc | FFU distribution channel concentration | −2.009 | −1.749 *** | −2.387 * | −3.073 * | −1.963 | −3.073 * |
| ln(bfyfood) | BFY consumption | −0.934 | 21.37 * | −1.810 | −2.128 *** | −1.499 | −2.128 *** |
| ln(bfypu) | BFY unit price | −1.982 | 0.278 | −1.576 | −2.919 *** | −1.689 | −2.919 * |
| bfybc | BFY brand concentration | - | 30.472 * | −0.632 | −1.519 | −0.632 | −1.519 |
| bfydc | BFY distribution channel concentration | −0.989 | 1.319 | −1.288 | −2.269 ** | −1.128 | −2.269 ** |
| ln(fffood) | FF consumption | −0.472 | 33.568 * | −2.293 ** | −3.063 * | −2.293 ** | −3.063 * |
| ln(ffpu) | FF unit price | −1.129 | 4.479 * | −1.706 | −3.050 * | −0.878 | −3.050 * |
| ffbc | FF brand concentration | −1.462 | 35.913 * | −2.518 ** | −2.572 * | −2.518 * | −2.572 * |
| ffdc | FF distribution channel concentration | −0.874 | 1.161 | −2.037 | −2.510 ** | −2.037 | −2.510 * |
| ln(nhfood) | NH consumption | 0.333 | 28.39 * | −1.653 | −2.128 | −1.653 | −2.128 *** |
| ln(nhpu) | NH unit price | −0.804 | 5.929 * | −0.834 | −2.581 * | −0.713 | −2.581 * |
| nhbc | NH brand concentration | −1.346 | 35.887 * | −1.727 | −2.578 * | −1.879 | −2.578 * |
| nhdc | NH distribution channel concentration | −1.950 | 0.816 | −1.709 | −2.644 * | −1.218 | −2.644 * |
| ln(orgfood) | ORG consumption | - | 28.00 * | −1.136 | −2.187 *** | −0.834 | −2.187 *** |
| ln(orgpu) | ORG unit price | - | 0.833 | −1.047 | −2.242 *** | −1.047 | −2.242 ** |
| orgbc | ORG brand concentration | - | 24.615 * | −1.762 | −2.506 ** | −1.310 | −2.506 * |
| orgdc | ORG distribution channel concentration | - | −0.618 | −1.180 | −1.676 | −1.180 | −2.158 *** |
| ln(hwpc) | HW consumption per capita | −1.263 | 32.261 * | −1.913 | −3.021 * | −1.759 | −3.021 * |
| ln(hwpc-ow) | HW consumption per overweight population | −1.697 | 7.167 * | −2.288 ** | −2.973 * | −2.288 ** | −2.973 * |
| ln(hwpc-ob) | HW consumption per obese population | −1.402 | 5.871 * | −1.912 | −3.429 * | −1.599 | −3.429 * |
Note: (1) HW = Health and wellness packaged food; FFU = Fortified/functional packaged food; BFY = Better-for-you packaged food; FF = Free-from packaged food; NH = Naturally healthy packaged food; ORG = Organic packaged food. (2) *, **, and *** are the level of significance at 1%, 5%, and 10%, respectively. Source: Author’s calculation.
Table A2.
Test results of normality for alternative estimates.
| Variables | Definition | Skewness | Kurtosis | Shapiro–Wilk Test | Shapiro–Francia Test |
|---|---|---|---|---|---|
| ln(ffufood) | FFU consumption | 0.647 | 3.289 | 4.711 * | 4.305 * |
| ln(ffupu) | FFU unit price | 1.006 | 4.862 | 6.037 * | 5.578 * |
| ffubc | FFU brand concentration | 0.373 | 2.255 | 4.334 * | 1.034 |
| ffudc | FFU distribution channel concentration | 0.361 | 2.493 | 4.799 * | 4.343 * |
| ln(bfyfood) | BFY consumption | −0.783 | 4.433 | 6.329 * | 5.867 * |
| ln(bfypu) | BFY unit price | 0.098 | 2.567 | 5.327 * | 4.845 * |
| bfybc | BFY brand concentration | 0.910 | 3.611 | 5.312 * | 3.158 * |
| bfydc | BFY distribution channel concentration | −0.124 | 2.796 | 3.183 * | 2.938 * |
| ln(fffood) | FF consumption | 0.680 | 3.444 | 5.626 * | 5.180 * |
| ln(ffpu) | FF unit price | 0.133 | 2.631 | 3.278 * | 2.864 * |
| ffbc | FF brand concentration | 0.835 | 3.112 | 4.915 * | 2.525 * |
| ffdc | FF distribution channel concentration | 0.035 | 3.230 | 5.261 * | 4.811 * |
| ln(nhfood) | NH consumption | 0.353 | 2.192 | 4.358 * | 3.895 * |
| ln(nhpu) | NH unit price | −1.198 | 4.016 | 6.722 * | 6.185 * |
| nhbc | NH brand concentration | 0.870 | 2.650 | 5.909 * | 4.355 * |
| nhdc | NH distribution channel concentration | −0.319 | 3.555 | 4.693 * | 4.291 * |
| ln(orgfood) | ORG consumption | 0.099 | 2.085 | 3.375 * | 2.905 * |
| ln(orgpu) | ORG unit price | −2.018 | 5.464 | 9.555 * | 8.839 * |
| orgbc | ORG brand concentration | 0.707 | 2.842 | 4.701 * | 0.746 |
| orgdc | ORG distribution channel concentration | −0.472 | 3.481 | 5.729 * | 5.363 * |
| ln(hwpc) | HW consumption per capita | −0.642 | 3.359 | 4.953 * | 4.540 * |
| ln(hwpc-ow) | HW consumption per overweight population | −0.244 | 3.725 | 5.022 * | 4.649 * |
| ln(hwpc-ob) | HW consumption per obese population | 0.122 | 3.185 | 3.780 * | 3.425 * |
Note: (1) HW = Health and wellness packaged food; FFU = Fortified/functional packaged food; BFY = Better-for-you packaged food; FF = Free-from packaged food; NH = Naturally healthy packaged food; ORG = Organic packaged food. (2) * is the level of significance at 1%. Source: Author’s calculation.
Appendix B. Changes in Health Trends, Digital Technology, and Market Concentration
Table A3 displays growth rate of health and wellness food consumption, health consumer, mobile internet use, and mobile telephone use in 14 Asian economies between 2015 and 2020.
Table A3.
Comparison in growth rate of in health and wellness food consumption, health consumer, mobile internet, and mobile telephone in the Asian market between 2015 and 2020 (percent).
Table A3.
Comparison in growth rate of in health and wellness food consumption, health consumer, mobile internet, and mobile telephone in the Asian market between 2015 and 2020 (percent).
| Country | 2015 | 2020 | ||||||
|---|---|---|---|---|---|---|---|---|
| HW Food | Consumer Health | Mobile Internet | Mobile Telephone | HW Food | Consumer Health | Mobile Internet | Mobile Telephone | |
| Australia | 3.8 | 11.2 | 12.0 | 2.8 | 3.6 | 2.3 | 5.3 | 2.0 |
| China | 3.2 | 7.5 | 33.6 | 0.5 | −0.1 | −1.7 | 17.9 | 5.0 |
| Hong Kong | 8.3 | −3.3 | −0.1 | −1.4 | −27.4 | −13.9 | 8.4 | 2.9 |
| India | 10.5 | 5.3 | 71.5 | 6.0 | 7.5 | 0.5 | 18.8 | 2.2 |
| Indonesia | 2.2 | 3.7 | 22.5 | 4.1 | 5.3 | 2.1 | 5.0 | 3.5 |
| Japan | 4.0 | 1.5 | 3.9 | 1.7 | 5.2 | −1.3 | 3.3 | 2.9 |
| Malaysia | 3.7 | 2.4 | 57.6 | −1.8 | 3.1 | 7.9 | 6.6 | 3.1 |
| New Zealand | 4.4 | 3.0 | 24.4 | 9.8 | 3.2 | 1.4 | 10.2 | 2.1 |
| Philippines | 4.7 | 5.6 | 51.2 | 5.8 | 4.7 | 4.8 | 12.9 | 6.2 |
| Singapore | 4.9 | 4.3 | 3.0 | 1.6 | 7.4 | 3.7 | 4.1 | 3.4 |
| South Korea | 1.2 | 4.1 | 1.5 | 2.9 | 2.6 | 2.2 | 4.3 | 3.3 |
| Taiwan | 3.6 | 4.7 | 19.9 | −2.2 | 2.2 | 4.5 | 5.0 | 0.6 |
| Thailand | 6.7 | 10.5 | 11.2 | 6.0 | 1.3 | −5.3 | 5.9 | 3.8 |
| Vietnam | 9.0 | 13.7 | 24.5 | −11.6 | 2.5 | 11.3 | 8.9 | 3.0 |
Source: Author’s calculation and data from Euromonitor (2021).
Table A4 shows changes in number of brands, brand concentration, share of store-based distribution channels, share of non-store-based distribution channels, and concentration of distribution channels in 14 Asian economies between 2015 and 2020.
Table A4.
Comparison in HHI of brands and distribution channels in the Asian market between 2015 and 2020.
Table A4.
Comparison in HHI of brands and distribution channels in the Asian market between 2015 and 2020.
| Country | 2015 | 2020 | ||||||||
|---|---|---|---|---|---|---|---|---|---|---|
| No. Brands | HHI Brands | Share of Store Channels | Share of Non-Store Channels | HHI Distribution Channels | No. Brands | HHI Brands | Share of Store Channels | Share of Non-Store Channels | HHI Distribution Channels | |
| Australia | 89 | 0.085 | 94.83 | 5.16 | 0.618 | 86 | 0.098 | 94.22 | 5.77 | 0.638 |
| China | 79 | 0.245 | 95.75 | 4.25 | 0.531 | 78 | 0.203 | 91.42 | 8.58 | 0.495 |
| Hong Kong | 51 | 0.105 | 99.54 | 0.45 | 0.408 | 51 | 0.144 | 98.02 | 1.99 | 0.459 |
| India | 53 | 0.233 | 99.96 | 0.03 | 0.712 | 50 | 0.258 | 99.59 | 0.42 | 0.682 |
| Indonesia | 51 | 0.141 | 99.60 | 0.40 | 0.578 | 51 | 0.175 | 98.46 | 1.54 | 0.569 |
| Japan | 45 | 0.384 | 86.58 | 13.42 | 0.291 | 44 | 0.383 | 85.37 | 14.63 | 0.290 |
| Malaysia | 55 | 0.081 | 89.95 | 10.05 | 0.624 | 53 | 0.087 | 89.97 | 11.02 | 0.626 |
| New Zealand | 53 | 0.079 | 98.86 | 1.13 | 0.701 | 54 | 0.078 | 97.20 | 2.80 | 0.690 |
| Philippines | 44 | 0.115 | 98.53 | 1.48 | 0.553 | 43 | 0.120 | 97.43 | 2.57 | 0.568 |
| Singapore | 56 | 0.097 | 95.21 | 4.79 | 0.547 | 55 | 0.111 | 92.54 | 7.45 | 0.532 |
| South Korea | 43 | 0.378 | 76.67 | 20.33 | 0.422 | 46 | 0.349 | 77.77 | 22.23 | 0.416 |
| Taiwan | 62 | 0.227 | 86.64 | 13.36 | 0.303 | 62 | 0.243 | 84.02 | 15.99 | 0.292 |
| Thailand | 42 | 0.107 | 90.73 | 9.27 | 0.594 | 51 | 0.116 | 92.08 | 7.92 | 0.590 |
| Vietnam | 34 | 0.328 | 99.96 | 0.04 | 0.405 | 33 | 0.343 | 99.26 | 0.74 | 0.379 |
Note: (1) Store-based retailing channels consist of modern grocery retailers, traditional grocery retailers, non-grocery specialists, and mixed retailers; non-store-based retailing channels consist of vending, home shopping, e-commerce, and direct selling. Source: Author’s calculation and data from Euromonitor (2021).
References
- Dietz, W.H. You Are What You Eat—What You Eat is What You Are. J. Adolesc. Health Care 1990, 11, 76–81. [Google Scholar] [CrossRef]
- Earl, S. Inform or A Study of Double. Nutr. Food Sci. 1986, 86, 10–12. [Google Scholar] [CrossRef]
- Shapin, S. ‘You Are What You Eat’: Historical Changes in Ideas about Food and Identity. Hist. Res. 2014, 87, 377–392. [Google Scholar] [CrossRef]
- Brüssow, H.; Parkinson, S.J. You Are What You Eat. Nat. Biotechnol. 2014, 32, 243–245. [Google Scholar] [CrossRef]
- Zmora, N.; Suez, J.; Elinav, E. You Are What You Eat: Diet, Health and the Gut Microbiota. Nat. Rev. Gastroenterol. Hepatol. 2019, 16, 35–56. [Google Scholar] [CrossRef]
- Vartanian, L.R.; Herman, C.P.; Polivy, J. Consumption Stereotypes and Impression Management: How You Are What You Eat. Appetite 2007, 48, 265–277. [Google Scholar] [CrossRef] [PubMed]
- Steils, N.; Obaidalahe, Z. “Social Food”: Food Literacy Co-construction and Distortion on Social Media. Food Policy 2020, 95, 101932. [Google Scholar] [CrossRef]
- Pietrykowski, B. You Are What You Eat: The Social Economy of the Slow Food Movement. Rev. Soc. Econ. 2004, 62, 307–321. [Google Scholar] [CrossRef]
- Ogunniyi, A.I.; Mavrotas, G.; Olagunju, K.O.; Fadare, O.; Adedoyin, R. Governance quality, remittances and their implications for food and nutrition security in Sub-Saharan Africa. World Dev. 2020, 127, 104752. [Google Scholar] [CrossRef]
- Schutter, O.D.; Jacobs, N.; Clément, C. A ‘Common Food Policy’ for Europe: How Governance Reforms can Spark a Shift to Healthy Diets and Sustainable Food Systems. Food Policy 2020, 96, 101849. [Google Scholar] [CrossRef]
- Nakat, Z.; Bou-Mitri, C. COVID-19 and the Food Industry: Readiness Assessment. Food Control. 2021, 121, 107661. [Google Scholar] [CrossRef]
- Cobre, A.F.; Surek, M.; Vilhena, R.O.; Böger, B.; Fachi, M.M.; Momade, D.R.; Tonin, F.S.; Sarti, F.M.; Pontarolo, R. Influence of Foods and Nutrients on COVID-19 Recovery: A Multivariate Analysis of Data from 170 Countries Using a Generalized Linear Model. Clin. Nutr. 2021, in press. [Google Scholar] [CrossRef] [PubMed]
- Jaeger, S.R.; Vidal, L.; Ares, G.; Chheang, S.L.; Spinelli, S. Healthier eating: COVID-19 disruption as a catalyst for positive change. Food Qual. Prefer. 2021, 92, 104220. [Google Scholar] [CrossRef]
- Han, S.; Roy, P.K.; Hossain, M.I.; Byun, K.-H.; Choi, C.; Ha, S.-D. COVID-19 pandemic crisis and food safety: Implications and inactivation strategies. Trends Food Sci. Technol. 2021, 109, 25–36. [Google Scholar] [CrossRef] [PubMed]
- Fan, S.; Teng, P.; Chew, P.; Smith, G.; Copeland, L. Food system resilience and COVID-19—Lessons from the Asian experience. Glob. Food Sec. 2021, 28, 100501. [Google Scholar] [CrossRef]
- Galanakis, C.M. The Food Systems in the Era of the Coronavirus (COVID-19) Pandemic Crisis. Foods 2020, 9, 523. [Google Scholar] [CrossRef]
- Cranfield, J. Framing consumer food demand responses in a viral pandemic. Can. J. Agric. Econ. 2020, 68, 151–156. [Google Scholar] [CrossRef]
- Goddard, E. The impact of COVID-19 on food retail and food service in Canada: Preliminary assessment. Can. J. Agric. Econ. 2020, 68, 157–161. [Google Scholar] [CrossRef]
- Galanakis, C.H.; Rizou, M.; Aldawoud, T.M.S.; Ucak, I.; Rowan, N.J. Innovations and technology disruptions in the food sector within the COVID-19 pandemic and post-lockdown era. Trends Food Sci. Technol. 2021, 110, 193–200. [Google Scholar] [CrossRef]
- Ali, S.; Khalid, N.; Javed, H.M.U.; Islam, D.M.Z. Consumer Adoption of Online Food Delivery Ordering (OFDO) Services in Pakistan: The Impact of the COVID-19 Pandemic Situation. J. Open Innov. Technol. Mark. Complex. 2021, 7, 10. [Google Scholar] [CrossRef]
- International Telecommunication Union (ITU). The ICT Development Index (IDI): Conceptual Framework and Methodology. Available online: https://www.itu.int/en/ITU-D/Statistics/Pages/publications/mis/methodology.aspx (accessed on 4 July 2021).
- Nunes, R.; Silva, V.L.; Consiglio-Kasemodel, M.G.; Polizer, Y.J.; Saes, M.S.M.; Fávaro-Trindade, C.S. Assessing global changing food patterns: A country-level analysis on the consumption of food products with health and wellness claims. J. Clean. Prod. 2020, 264, 121613. [Google Scholar] [CrossRef]
- Euromonitor International, Health and Wellness [Data Set]. Available online: https://www-portal-euromonitor-com.proxy.library.mfu.ac.th/portal/statisticsevolution/index. (accessed on 1 March 2021).
- Fanzo, J. Healthy and Sustainable Diets and Food Systems: The Key to Achieving Sustainable Development Goal 2? Food Ethics 2019, 4, 159–174. [Google Scholar] [CrossRef]
- Khan, R.S.; Grigor, J.; Winger, R.; Win, A. Functional food product development—Opportunities and challenges for food manufacturers. Trends Food Sci. Technol. 2013, 30, 27–37. [Google Scholar] [CrossRef]
- Falguera, V.; Aliguer, N.; Falguera, M. An integrated approach to current trends in food consumption: Moving toward functional and organic products? Food Control 2012, 26, 274–281. [Google Scholar] [CrossRef]
- Ali, T.; Ali, J. Factors affecting the consumers’ willingness to pay for health and wellness food products. J. Sci. Food Agric. 2020, 2, 100076. [Google Scholar] [CrossRef]
- Chen, M.-F. The joint moderating effect of health consciousness and healthy lifestyle on consumers’ willingness to use functional foods in Taiwan. Appetite 2011, 57, 253–262. [Google Scholar] [CrossRef] [PubMed]
- Kushwah, S.; Dhir, A.; Sagar, M.; Gupta, B. Determinants of organic food consumption. A systematic literature review on motives and barriers. Appetite 2019, 143. [Google Scholar] [CrossRef]
- Nagaraj, S. Role of consumer health consciousness, food safety & attitude on organic food purchase in emerging market: A serial mediation model. J. Retail. Consum. Serv. 2021, 59, 102423. [Google Scholar] [CrossRef]
- Pham, T.H.; Nguyen, T.N.; Phan, T.T.H.; Nguyen, N.T. Evaluating the purchase behaviour of organic food by young consumers in an emerging market economy. J. Strateg. Mark. 2019, 27, 540–556. [Google Scholar] [CrossRef]
- Liu, C.; Zheng, Y.; Cao, D. An analysis of factors affecting selection of organic food: Perception of consumers in China regarding weak signals. Appetite 2021, 161, 105145. [Google Scholar] [CrossRef]
- Sumi, R.S.; Kabir, G. Factors Affecting the Buying Intention of Organic Tea Consumers of Bangladesh. J. Open Innov. Technol. Mark. Complex. 2018, 4, 24. [Google Scholar] [CrossRef] [Green Version]
- Miranda-Ackerman, M.A.; Colín-Chávez, C. Food Supply Chain Demand and Optimization. In Encyclopedia of Food Security and Sustainability; Pasquale, F., Elliot, M.B., Jock, R.A., Eds.; Elsevier: Amsterdam, The Netherlands, 2019; pp. 455–464. [Google Scholar] [CrossRef]
- Samoggia, A.; Monticone, F.; Bertazzoli, A. Innovative Digital Technologies for Purchasing and Consumption in Urban and Regional Agro-Food Systems: A Systematic Review. Foods 2021, 10, 208. [Google Scholar] [CrossRef] [PubMed]
- Li, C.; Mirosa, M.; Bremer, P. Review of Online Food Delivery Platforms and their Impacts on Sustainability. Sustainability 2020, 12, 5528. [Google Scholar] [CrossRef]
- Maimaiti, M.; Zhao, X.; Jia, M.; Ru, Y.; Xhu, S. How we eat determines what we become: Opportunities and challenges brought by food delivery industry in a changing world in China. Eur. J. Clin. Nutr. 2018, 72, 1282–1286. [Google Scholar] [CrossRef] [PubMed]
- Chen, H.-S.; Liang, C.-H.; Liao, S.-Y.; Kuo, H.-Y. Consumer Attitudes and Purchase Intentions toward Food Delivery Platform Services. Sustainability 2020, 12, 177. [Google Scholar] [CrossRef]
- Elms, J.; de Kervenoael, R.; Hallsworth, A. Internet or store? An ethnographic study of consumers’ internet and store-based grocery shopping practices. J. Retail. Consum. Serv. 2016, 32, 234–243. [Google Scholar] [CrossRef] [Green Version]
- Lemke, M.; Schifferstein, H.N.J. The use of ICT devices as part of the solo eating experience. Appetite 2021, 105297. [Google Scholar] [CrossRef]
- Malenkov, Y.; Kapustina, I.; Kudryavtseva, G.; Shishkin, V.V.; Shishkin, V.I. Digitalization and Strategic Transformation of Retail Chain Stores: Trends, Impacts, Prospects. J. Open Innov. Technol. Mark. Complex. 2021, 7, 108. [Google Scholar] [CrossRef]
- Dubé, L.; McRae, C.; Wu, Y.-H.; Ghosh, S.; Allen, S.; Ross, D.; Ray, S.; Joshi, P.K.; McDermott, J.; Jha, S.; et al. Impact of the eKutir ICT-enabled social enterprise and its distributed micro-entrepreneur strategy on fruit and vegetable consumption: A quasi-experimental study in rural and urban communities in Odisha, India. Food Policy 2020, 90, 101787. [Google Scholar] [CrossRef]
- Davies, A.R. Co-creating sustainable eating futures: Technology, ICT and citizen–consumer ambivalence. Futures 2014, 62, 181–193. [Google Scholar] [CrossRef]
- Hassen, T.B.; Bilali, H.E.; Allahyari, M.S.; Berjan, S.; Fotina, O. Food purchase and eating behavior during the COVID-19 pandemic: A cross-sectional survey of Russian Adults. Appetite 2021, 165, 105309. [Google Scholar] [CrossRef] [PubMed]
- Sarkar, S.; Costa, A.I.A. Dynamics of open innovation in the food industry. Trends Food Sci. Technol. 2008, 19, 574–580. [Google Scholar] [CrossRef]
- Nambisan, S.; Siegel, D.; Kenney, M. On open innovation, platforms, and entrepreneurship. Strateg. Entrep. J. 2018, 12, 354–368. [Google Scholar] [CrossRef]
- Dam, I.V.; Wood, B.; Sacks, G.; Allais, O.; Vandevijvere, S. A detailed mapping of the food industry in the European single market: Similarities and differences in market structure across countries and sectors. Int. J. Behav. Nutr. Phys. Act. 2021, 18, 54. [Google Scholar] [CrossRef]
- Brezina, I.; Pekár, J.; Čičková, Z.; Reiff, M. Herfindahl–Hirschman index level of concentration values modification and analysis of their change. Cent Eur. J. Oper. Res. 2016, 24, 49–72. [Google Scholar] [CrossRef]
- Tanusondjaja, A.; Dunn, S.; Miari, C. Examining manufacturer concentration metrics in consumer packaged goods. Int. J. Mark. Res. 2020, 1–23. [Google Scholar] [CrossRef]
- Ali, T.; Alam, A. Understanding Competition across Retail Distribution Channels of Health and Wellness Food Products in India. J. Asia Pac. Bus. 2017, 18, 117–130. [Google Scholar] [CrossRef]
- Ali, T.; Alam, A.; Ali, J. Market structure analysis of health and wellness food products in India. Br. Food J. 2015, 117, 1859–1871. [Google Scholar] [CrossRef]
- Mulenga, B.P.; Ngoma, H.; Nkonde, C. Produce to eat or sell: Panel data structural equation modeling of market participation and food dietary diversity in Zambia. Food Policy 2021, 102035. [Google Scholar] [CrossRef]
- Hovhannisyan, V.; Bozic, M. The effects of retail concentration on retail dairy product prices in the United States. Int. J. Dairy Sci. 2016, 99, 4928–4938. [Google Scholar] [CrossRef] [Green Version]
- Aalto-Setälä, V. The effect of concentration and market power on food prices: Evidence from Finland. J. Retail. 2002, 78, 207–216. [Google Scholar] [CrossRef]
- Tsartsou, E.; Proutsos, N.; Papadopoulos, I.; Tzouvelekas, V.; Castanas, E.; Kampa, M. Consumers’ attitude toward dietary supplements and functional food: A prospective survey in a Greek population sample. Hormones 2021, 20, 177–188. [Google Scholar] [CrossRef]
- Chesbrough, H.W. Open Innovation. The New Imperative for Creating and Profiting from Technology; Harvard Business School Press: Cambridge, MA, USA, 2003; pp. 43–62. [Google Scholar]
- Tomlinson, P.R.; Fai, F.M. The nature of SME co-operation and innovation: A multi-scalar and multi-dimensional analysis. Int. J. Prod. Econ. 2013, 141, 316–326. [Google Scholar] [CrossRef] [Green Version]
- Valdez-Juárez, L.E.; Gallardo-Vázquez, D.; Ramos-Escobar, E.A. Online buyers and open innovation: Security, experience, and satisfaction. J. Open Innov. Technol. Mark. Complex. 2021, 7, 37. [Google Scholar] [CrossRef]
- Mikheev, A.A.; Krasnov, A.; Griffith, R.; Draganov, M. The interaction model within Phygital environment as an implementation of the open innovation concept. J. Open Innov. Technol. Mark. Complex. 2021, 7, 114. [Google Scholar] [CrossRef]
- Markovic, S.; Koporcic, N.; Arslanagic-Kalajdzic, M.; Kadic-Maglajlic, S.; Bagherzadeh, M.; Islam, N. Business-to-business open innovation: COVID-19 lessons for small and medium-sized enterprises from emerging markets. Technol. Forecast Soc. Chang. 2021, 170, 120883. [Google Scholar] [CrossRef]
- Nuthalapati, C.S.R.; Nuthalapati, C. Has Open innovation taken root in India? Evidence from startups working in food value chains. Circ. Econ. Sustain. 2021. [Google Scholar] [CrossRef]
- Kafetzopoulos, D.; Vouzas, F.; Skalkos, D. Developing and validating an innovation drivers’ measurement instrument in the agri-food sector. Br. Food J. 2020, 122, 1199–1214. [Google Scholar] [CrossRef]
- Bogers, M.; Chesbrough, H.; Strand, R. Sustainable open innovation to address a grand challenge: Lessons from Carlsberg and the Green Fiber Bottle. Br. Food J. 2020, 122, 1505–1517. [Google Scholar] [CrossRef]
- Alvarez-Meaza, I.; Pikatza-Gorrotxategi, N.; Rio-Belver, R.M. Sustainable business model based on open innovation: Case study of Iberdrola. Sustainability 2020, 12, 645. [Google Scholar] [CrossRef]
- Mahdad, M.; Marco, C.E.D.; Piccaluga, A.; Minin, A.D. Harnessing adaptive capacity to close the Pandora’s Box of open innovation. Ind. Innov. 2020, 27, 264–284. [Google Scholar] [CrossRef]
- Osterwalder, A.; Pigneur, Y. Business Model Generation: A Handbook for Visionaries, Game Changers, and Challengers; John Wiley & Sons: Hoboken, NJ, USA, 2010. [Google Scholar]
- Curtis, S.K. Business model patterns in the sharing economy. Sustain. Prod. Consum. 2021, 27, 1650–1671. [Google Scholar] [CrossRef]
- Bocken, N.M.P.; Weissbrod, I.; Antikainen, M. Business model experimentation for the circular economy: Definition and approaches. Circ. Econ. Sustain. 2021, 1, 49–81. [Google Scholar] [CrossRef]
- Barth, H.; Ulvenblad, P.; Ulvenblad, P.O.; Hoveskog, M. Unpacking sustainable business models in the Swedish agricultural sector—The challenges of technological, social and organisational innovation. J. Clean. Prod. 2021, 304, 127004. [Google Scholar] [CrossRef]
- Danse, M.; Klerkx, L.; Reintjes, J.; Rabbinge, R.; Leeuwis, C. Unravelling inclusive business models for achieving food and nutrition security in BOP markets. Glob. Food Sec. 2020, 24, 100354. [Google Scholar] [CrossRef]
- Björklund, T.A.; Mikkonen, M.; Mattila, P.; van der Marel, F. Expanding entrepreneurial solution spaces in times of crisis: Business model experimentation amongst packaged food and beverage ventures. J. Bus. Ventur. Insights 2020, 14, e00197. [Google Scholar] [CrossRef]
- Branstad, A.; Solem, B.A. Emerging theories of consumer-driven market innovation, adoption, and diffusion: A selective review of consumer-oriented studies. J. Bus. Res. 2020, 116, 561–571. [Google Scholar] [CrossRef]
- Frenkel, A.; Maital, A.; Leck, E.; Israel, E. Demand-driven innovation: An integrative systems-based review of the literature. Int. J. Innov. Technol. Manag. 2015, 12, 1550008. [Google Scholar] [CrossRef]
- Pesaran, M.H. General diagnostic tests for cross-sectional dependence in panels. Empir. Econ. 2021, 60, 13–50. [Google Scholar] [CrossRef]
- Im, K.S.; Pesaran, M.H.; Shin, Y. Testing for unit roots in heterogeneous panels. J. Econ. 2003, 115, 53–74. [Google Scholar] [CrossRef]
- Pesaran, M.H. A simple panel unit root test in the presence of cross-section dependence. J. Appl. Econ. 2007, 22, 265–312. [Google Scholar] [CrossRef] [Green Version]
- Shapiro, S.S.; Wilk, M.B. An analysis of variance test for normality (complete samples). Biometrika 1965, 52, 591–611. [Google Scholar] [CrossRef]
- Powell, D. Quantile Regression with Nonadditive Fixed Effects. Unpublished Paper. 2020. Available online: https://sites.google.com/site/davidmatthewpowell/quantile-regression-with-nonadditive-fixed-effects (accessed on 5 July 2021).
- Powell, D.; Wagner, J. The exporter productivity premium along the productivity distribution: Evidence from quantile regression with nonadditive firm fixed effects. Rev. World Econ. 2014, 150, 763–785. [Google Scholar] [CrossRef]
- IMD World Competitiveness Center (IMD), IMD World Digital Competitiveness Ranking 2020. Available online: https://www.imd.org/centers/world-competitiveness-center/rankings/world-digital-competitiveness/ (accessed on 5 July 2021).
Figure 1.
The retail value of health and wellness packaged food by region, 2006–2020. Source: Author’s compilation using data from [23].
Figure 1.
The retail value of health and wellness packaged food by region, 2006–2020. Source: Author’s compilation using data from [23].

Figure 2.
The retail value by health and wellness packaged foods in the Asian market, 2006–2020. Source: Author’s compilation using data from [23].
Figure 2.
The retail value by health and wellness packaged foods in the Asian market, 2006–2020. Source: Author’s compilation using data from [23].

Figure 3.
A conceptual framework of this study.

Table 1.
Descriptive statistics of estimation model variables.
| Variables | Abbreviation | Obs. | Mean | Std. Dev. | Min | Max |
|---|---|---|---|---|---|---|
| Health and wellness food consumption | hwfood | 210 | 7836 | 14,024 | 503 | 73,413 |
| Unit price | hwpu | 210 | 5328 | 2497 | 2385 | 15,221 |
| Brand concentration | hwbc | 210 | 0.128 | 0.130 | 0.076 | 0.495 |
| Distribution channel concentration | hwdc | 210 | 0.524 | 0.131 | 0.287 | 0.802 |
| Health trends | chgw | 210 | 3.785 | 3.864 | −13.895 | 15.144 |
| Mobile internet | mintn | 210 | 107,429 | 250,059 | 96 | 1.70 × 10⁶ |
| Mobile telephone | mtel | 210 | 205,216 | 364,185 | 3802 | 1.80 × 10⁶ |
| Income | inc | 210 | 1.02 × 10⁶ | 1.67 × 10⁶ | 72,861 | 9.10 × 10⁶ |
| Income per capita | incpc | 210 | 13,707 | 12,405 | 975 | 42,207 |
Note: The number of observations is 210. Source: Author’s calculation.
Table 2.
Results of the cross-section dependence test and the first- and second-generation panel unit root tests.
Table 2.
Results of the cross-section dependence test and the first- and second-generation panel unit root tests.
| Testing | IPS | Pesaran-CD | CIPS | CADF | |||
|---|---|---|---|---|---|---|---|
| Level | First Diff. | Level | First Diff. | Level | First Diff. | ||
| ln(hw) | −1.366 | −3.218 * | 35.249 * | −2.135 | −3.126 * | −1.738 | −3.126 * |
| ln(hwpu) | −1.234 | −2.452 * | 1.698 *** | −1.142 | −2.519 ** | −0.990 | −2.519 * |
| hwbc | −1.346 | −3.703 * | 35.887 * | −1.727 | −2.578 * | −1.879 | −2.578 * |
| hwdc | −2.111 *** | −2.950 * | −0.757 | −1.364 | −2.683 * | −1.364 | −2.683 * |
| chgw | −3.099 * | −5.823 * | 10.319 * | −2.168 *** | −3.818 * | −2.178 *** | −3.818 * |
| ln(mintn) | −4.426 * | −9.080 * | 30.467 * | −5.135 * | −5.385 * | −5.135 * | −5.385 * |
| ln(mtel) | −4.779 * | −3.241 * | 34.228 * | −1.842 | −3.108 * | −1.842 | −3.108 * |
| ln(incpc) | −2.394 ** | −2.201 * | −27.565 * | −2.287 ** | −3.287 * | −2.287 ** | −3.287 * |
| ln(inc) | −2.449 * | −2.135 ** | −28.252 * | −2.109 *** | −3.146 * | −2.109 *** | −3.146 * |
Note: *, **, and *** are the level of significance at 1%, 5%, and 10%, respectively.
Table 3.
Test results of normal distribution.
| Variable | Skewness | Kurtosis | Shapiro–Wilk Test | Shapiro–Francia Test |
|---|---|---|---|---|
| ln(hw) | 0.828 | 3.408 | 5.224 * | 4.793 * |
| ln(hwpu) | 0.264 | 2.806 | 5.497 * | 5.047 * |
| hwbc | 0.870 | 2.650 | 5.909 * | 4.355 * |
| hwdc | −0.294 | 2.300 | 4.606 * | 4.150 * |
| chgw | −1.044 | 4.525 | 3.051 * | 3.234 * |
| ln(mintn) | −1.062 | 2.719 | 7.952 * | 7.296 * |
| ln(mtel) | 0.273 | 2.438 | 3.487 * | 3.030 * |
| ln(incpc) | −0.112 | 1.408 | 6.656 * | 6.072 * |
| ln(inc) | 0.705 | 2.532 | 5.563 * | 5.077 * |
Note: * is the level of significance at 1%.
Table 4.
Effects of trends, digital technology, and market concentration on health and wellness food consumption.
Table 4.
Effects of trends, digital technology, and market concentration on health and wellness food consumption.
| ln(hwfood) | 0.1 | 0.2 | 0.3 | 0.4 | 0.5 | 0.6 | 0.7 | 0.8 | 0.9 |
|---|---|---|---|---|---|---|---|---|---|
| chgw | 0.0006 | 0.001 * | 0.002 * | 0.002 * | 0.002 * | 0.002 * | 0.002 * | 0.0009 * | 0.002 * |
| −1.57 | −54.98 | −13.45 | −12.46 | −10.03 | −8.91 | −9.51 | −6 | −89.03 | |
| ln(mintn) | −0.003 * | −0.002 * | −0.0006 * | 0.0009 * | −0.0009 * | 0.0001 | 0.0002 | 0.001 * | 0.004 * |
| (−8.80) | (−6.43) | (−2.35) | −4.7 | (−3.07) | −1.03 | −0.25 | −10.34 | −135.06 | |
| ln(mtel) | 0.091 * | 0.073 * | 0.079 * | 0.070 * | 0.045 * | 0.087 * | 0.202 ** | 0.164 * | 0.196 * |
| −5.13 | −14.63 | −22.8 | −8.56 | −3.53 | −4.53 | −2.13 | −6.78 | −67.17 | |
| hwbc | 0.008 | 0.034 * | 0.040 * | 0.024 * | 0.191 * | 0.008 | −0.002 | 0.0002 | −0.005 * |
| −0.39 | −2.59 | −5.86 | −6.45 | −3.73 | −1.02 | (−0.33) | −0.04 | (−5.13) | |
| hwdc | −0.793 * | −1.032 * | −1.638 * | −1.755 * | −1.487 * | −2.193 * | −2.668 * | −3.085 * | −3.489 * |
| (−5.35) | (−37.49) | (−25.17) | (−14.04) | (−5.74) | (−30.02) | (−26.45) | (−69.21) | (−287.11) | |
| ln(hwpu) | 0.951 * | 0.666 * | 0.555 * | 0.404 * | 0.407 * | 0.203 * | 0.218 * | 0.032 | 0.100 * |
| −31.13 | −124.8 | −22.48 | −19.76 | −7.22 | −7.05 | −4.95 | −1.05 | −36.96 | |
| ln(incpc) | −0.141 | −0.613 * | −0.28 * | −0.286 * | 0.257 * | 0.200 *** | 0.162 | 1.094 * | 0.920 * |
| (−0.80) | (−38.17) | (−4.56) | (−3.69) | −3.41 | −1.79 | −0.97 | −42.57 | −40.92 | |
| Ln(inc) | 0.474 * | 0.763 * | 0.475 * | 0.513 * | −0.103 | 0.104 | 0.131 | −0.831 * | −0.587 * |
| −2.44 | −49.04 | −7.43 | −5.94 | (−1.01) | −1.2 | −0.67 | (−26.95) | (−35.69) | |
| Obs. | 196 | 196 | 196 | 196 | 196 | 196 | 196 | 196 | 196 |
Note: t-statistics are in parentheses; * significant with p < 0.01; ** significant with p < 0.05; *** significant with p < 0.1. Source: Author’s calculation.
Table 5.
Effects of trends, digital technology, and market concentration on each type of health and wellness food consumption.
Table 5.
Effects of trends, digital technology, and market concentration on each type of health and wellness food consumption.
| 0.10 | 0.20 | 0.30 | 0.40 | 0.50 | 0.60 | 0.70 | 0.80 | 0.90 | |
|---|---|---|---|---|---|---|---|---|---|
| Dependent variable: ln(ffufood) | |||||||||
| chgw | 0.004 * (8.06) | 0.003 * (7.64) | 0.003 * (36.06) | 0.003 * (5.14) | 0.004 * (9.51) | 0.002 * (13.21) | 0.0008 * (10.36) | −0.0001 (−0.19) | 0.003 * (14.28) |
| ln(mintn) | −0.005 * (−11.36) | −0.003 * (−4.21) | −0.003 * (−9.75) | −0.00001 (−0.02) | −0.002 * (−6.47) | −0.002 * (−8.47) | −0.0009 * (−4.14) | 0.001 (1.31) | 0.002 * (7.44) |
| ln(mtel) | 0.140 * (5.47) | 0.132 * (11.45) | 0.025 * (4.40) | 0.006 (0.16) | 0.079 * (2.98) | 0.035 * (6.50) | 0.197 * (71.50) | 0.200 * (12.80) | 0.226 * (16.87) |
| ffubc | 0.086 (1.32) | −0.152 (−1.26) | 0.238 * (11.34) | −0.120 ** (−2.38) | 0.352 * (8.87) | 0.062 * (3.99) | 0.198 * (40.79) | 0.050 (0.57) | 0.151 * (3.45) |
| ffudc | −0.219 (−1.49) | 0.041 (0.31) | 0.262 * (3.51) | −0.565 * (−8.55) | −0.450 ** (−2.16) | −1.180 * (−22.03) | −2.493 * (−56.37) | −2.994 * (−6.03) | −3.967 * (−47.91) |
| ln(ffupu) | 0.765 * (8.07) | 0.651 * (9.09) | 0.428 * (32.09) | 0.342 * (4.31) | 0.366 * (15.01) | 0.473 * (45.40) | 0.557 * (73.94) | 0.266 * (2.77) | 0.070 *** (1.75) |
| ln(incpc) | −0.888 * (−3.45) | −0.523 * (−2.38) | −0.545 * (−9.66) | −0.290 ** (−2.02) | −0.325 * (−3.75) | −0.356 * (−7.52) | −0.015 (−0.27) | 0.545 *** (1.86) | 1.165 * (9.04) |
| ln(inc) | 1.210 * (4.93) | 0.621 * (2.50) | 0.675 * (14.20) | 0.619 * (3.94) | 0.370 * (5.06) | 0.521 * (13.56) | 0.013 (0.26) | −0.155 (−0.62) | −0.961 * (−7.24) |
| Dependent variable: ln(bfyfood) | |||||||||
| chgw | 0.001 * (6.83) | 0.001 * (4.42) | 0.003 * (11.43) | 0.001 * (11.72) | 0.0004 (1.08) | 2.81 × 10⁻⁶ (0.01) | −0.0006 *** (−1.74) | 0.001 * (3.25) | 0.005 * (20.20) |
| ln(mintn) | 0.002 * (3.86) | 0.002 * (4.19) | 0.002 * (12.27) | 0.0003 (0.64) | 0.002 * (10.08) | 0.0005 (0.39) | 0.003 * (10.28) | 0.002 * (2.86) | 0.007 * (23.28) |
| ln(mtel) | −0.018 (−1.31) | −0.012 (−1.03) | 0.023 * (8.93) | 0.017 (0.76) | 0.136 * (22.15) | 0.106 * (8.86) | 0.175 * (11.31) | 0.044 (0.48) | −0.013 (−1.55) |
| bfybc | 0.064 (0.181) | 0.095 ** (2.10) | 0.177 * (10.22) | 0.094 * (9.29) | 0.099 * (4.03) | 0.070 * (2.93) | 0.142 * (12.66) | 0.115 * (2.70) | −0.004 (−0.59) |
| bfydc | −0.260 * (−32.54) | −2.418 * (−23.26) | −0.137 * (−12.41) | −0.194 * (−19.16) | −0.140 * (−19.92) | −0.113 * (−8.26) | −0.170 * (−13.66) | −0.041 * (−2.44) | −0.103 * (−14.18) |
| ln(bfypu) | 0.190 * (4.59) | 0.187 * (5.29) | 0.262 * (11.70) | 0.403 * (16.51) | 0.310 * (16.21) | 0.220 * (10.40) | 0.436 * (10.01) | 0.640 * (7.95) | 0.186 * (10.05) |
| ln(incpc) | 1.111 * (7.45) | 1.091 * (6.11) | 1.373 * (60.47) | 0.708 * (7.43) | 1.056 * (22.70) | 1.158 * (11.41) | 1.791 * (17.07) | 1.417 * (3.07) | 1.311 * (11.81) |
| ln(inc) | −0.735 * (−4.45) | −0.747 * (−4.35) | −1.203 * (−49.20) | −0.664 * (−7.12) | −0.831 * (−18.16) | −0.854 * (−13.90) | −1.434 * (−13.62) | −1.133 * (−2.43) | −0.975 * (−9.58) |
| Dependent variable: ln(fffood) | |||||||||
| chgw | 4.84 × 10⁻⁵ (−1.28) | 0.0009 * (3.21) | 0.002 * (3.94) | 0.001 * (3.53) | 0.003 * (3.67) | 0.002 * (13.70) | 0.003 * (10.02) | 0.003 * (5.10) | 0.002 * (4.02) |
| ln(mintn) | −0.001 * (−29.06) | −0.001 *** (−1.78) | −0.001 *** (−1.66) | 0.0006 (1.31) | −0.001 (−0.93) | 0.0001 (0.31) | 0.001 (1.45) | 0.005 * (7.65) | 0.007 * (6.13) |
| ln(mtel) | 0.014 * (46.81) | −0.030 * (−4.81) | 0.001 (0.09) | 0.026 (1.32) | 0.031 * (2.39) | 0.076 * (9.52) | 0.047 * (3.27) | −0.014 *** (−1.86) | 0.0007 (0.03) |
| ffbc | 0.002 ** (2.18) | 0.075 * (2.72) | 0.084 * (3.90) | 0.086 * (2.91) | 0.121 * (4.13) | 0.083 * (14.72) | −0.041 ** (−1.96) | 0.111 (1.61) | 0.095 * (3.41) |
| ffdc | −0.545 * (−62.24) | −0.025 (−0.28) | 0.037 (0.74) | 0.075 *** (1.79) | −0.120 (−1.55) | 0.295 * (2.53) | 0.236 *** (1.73) | 0.193 (1.54) | 0.650 * (8.61) |
| ln(ffpu) | 0.152 * (112.47) | 0.065 * (2.46) | 0.091 (1.45) | 0.151 * (3.70) | 0.003 (0.03) | 0.165 * (9.09) | −0.059 *** (−1.68) | −0.084 * (−2.97) | −0.091 ** (−2.12) |
| ln(incpc) | 0.332 * (41.64) | 0.587 * (3.38) | 0.578 (1.20) | −0.327 (−0.91) | −0.675 (−1.50) | −0.624 * (−2.68) | −0.822 * (−3.41) | −0.476 (−0.70) | 1.092 * (7.23) |
| ln(inc) | −0.081 * (−11.07) | −0.414 * (−2.52) | −0.461 (−0.95) | 0.363 (1.16) | 0.545 (0.95) | 0.430 (1.52) | 1.000 * (4.05) | 0.605 (0.96) | −1.084 * (−9.15) |
| Dependent variable: ln(nhfood) | |||||||||
| chgw | 0.0006 * (17.91) | 0.003 * (25.64) | 0.0003 *** (1.71) | 0.0006 * (4.80) | 0.0004 * (2.56) | −0.0005 * (−27.43) | 8.09 × 10⁻⁵ (1.19) | −0.001 * (−7.55) | 6.85 × 10⁻⁵ (−0.15) |
| ln(mintn) | −0.0003 * (−3.32) | −0.0005 ** (−2.30) | −0.0006 * (−2.47) | 0.0004 * (9.30) | 0.001 * (5.15) | −0.0002 * (−10.53) | −0.0002 * (−3.22) | 0.0007 ** (2.11) | 0.001 *** (1.70) |
| ln(mtel) | −0.189 * (−115.01) | −0.112 * (−40.56) | −0.002 (−0.21) | 0.001 (0.37) | 0.025 (0.49) | 0.042 * (89.13) | 0.056 * (16.74) | 0.095 * (10.61) | 0.181 * (19.96) |
| nhbc | −0.155 * (−186.96) | 0.006 (1.03) | −0.030 * (−2.44) | −0.035 * (−7.31) | 0.030 * (3.87) | 0.011 * (14.92) | 0.014 * (7.25) | −0.001 (−0.21) | −0.019 (−1.14) |
| nhdc | 1.644 * (78.99) | 0.751 * (22.92) | 0.042 (0.48) | −0.136 * (−3.47) | −0.432 * (−5.95) | −1.017 * (−199.75) | −0.634 * (−50.92) | −0.394 * (−3.13) | −1.532 * (−23.47) |
| ln(nhpu) | 0.527 * (76.70) | 0.537 * (40.34) | 0.672 * (14.61) | 0.584 * (12.86) | 0.452 * (4.62) | 0.721 * (572.44) | 0.640 * (64.84) | 0.938 * (21.67) | 1.069 * (58.14) |
| ln(incpc) | 0.788 * (76.89) | 0.289 * (7.23) | −0.379 (−4.98) | 0.18 (1.11) | 0.728 * (4.10) | 0.150 * (60.54) | 0.323 * (19.24) | 0.047 (0.27) | −0.127 *** (−1.65) |
| ln(inc) | −0.467 * (−40.49) | −0.163 * (−4.79) | 0.501 * (5.53) | −0.163 (−1.00) | −0.649 * (−4.02) | −0.118 * (−48.82) | −3.103 * (−18.59) | −0.072 (−0.42) | −0.030 (−0.57) |
| Dependent variable: ln(orgfood) | |||||||||
| chgw | −0.0001 *** (−1.74) | 5.27 × 10⁻⁵ (−0.26) | −0.001 * (−5.99) | 0.0003 (1.48) | 0.0005 (0.70) | 0.001 * (62.88) | −0.003 * (−6.90) | −0.006 * (−78.48) | −0.010 * (−21.75) |
| ln(mintn) | 0.0001 (0.99) | 0.0001 (0.11) | 0.004 * (11.28) | 0.004 * (4.43) | 0.004 * (7.83) | 0.007 * (124.61) | 0.001 ** (2.26) | 0.012 * (112.46) | 0.004 * (10.39) |
| ln(mtel) | −0.004 (−1.34) | 0.028 (0.87) | 0.094 * (7.28) | −0.074 * (−5.74) | −0.148 * (−6.05) | 0.133 * (70.09) | 0.141 * (9.43) | 0.353 * (247.66) | 0.660 * (18.06) |
| orgbc | 0.019 * (5.85) | 0.018 ** (2.12) | −0.040 * (−11.23) | −0.034 (−0.63) | −0.014 (−0.26) | −0.090 * (−102.76) | −0.182 * (−12.28) | 0.411 * (161.72) | 0.222 * (9.25) |
| orgdc | −0.023 * (−18.76) | −0.020 * (−3.19) | −0.049 * (−7.83) | 0.001 (0.13) | 0.073 (1.16) | 0.136 * (96.49) | 0.198 * (12.16) | 0.322 * (81.46) | 0.433 * (31.68) |
| ln(orgpu) | 0.190 * (2196) | 0.191 * (288.14) | 0.188 * (778.00) | 0.187 * (461.43) | 0.179 * (40.53) | 0.170 * (1569) | 0.170 * (175.66) | 0.151 * (602.12) | 0.117 * (68.69) |
| ln(incpc) | −0.010 (−0.22) | 0.655 * (2.54) | 0.264 * (3.34) | 0.173 (0.75) | −0.313 (−0.99) | 1.152 * (78.92) | 1.371 * (9.51) | 2.950 * (60.63) | 11.709 * (12.20) |
| ln(inc) | 0.005 (0.11) | −0.618 * (−2.93) | 0.004 (0.05) | 0.208 (0.73) | 0.742 (1.60) | −0.787 * (−54.21) | −0.714 * (−5.53) | −2.408 * (−63.27) | −9.863 * (−13.06) |
Note: t-statistics are in parentheses; * significant with p < 0.01; ** significant with p < 0.05; *** significant with p < 0.1. Source: Author’s calculation.
Table 6.
Robustness results of health and wellness food consumption per capita.
| 0.10 | 0.20 | 0.30 | 0.40 | 0.50 | 0.60 | 0.70 | 0.80 | 0.90 | |
|---|---|---|---|---|---|---|---|---|---|
| Dependent variable: ln(hwpc) | |||||||||
| chgw | 0.143 * (13.76) | 0.079 *** (1.92) | 0.107 * (16.24) | 0.095 * (20.42) | 0.135 * (18.21) | 0.113 * (76.88) | 0.024 * (4.34) | 0.094 (1.47) | −0.603 * (−4.21) |
| ln(mintn) | −0.056 ** (−2.31) | −0.117 ** (−2.44) | −0.052 ** (−2.44) | −0.075 * (−33.10) | 0.141 * (5.55) | 0.209 * (86.10) | 0.254 * (35.00) | 0.059 (0.59) | 1.258 * (2.88) |
| ln(mtel) | 5.172 * (3.25) | 3.787 * (4.65) | 2.024 ** (2.32) | −1.241 * (−10.74) | −0.969 * (−5.18) | −0.186 (−1.49) | 5.839 * (13.20) | 6.721 * (7.72) | 26.157 * (10.01) |
| hwbc | 8.503 * (5.84) | 3.886 * (3.04) | 2.764 * (5.35) | 3.424 * (17.99) | 4.524 * (3.22) | 3.727 * (24.61) | 12.230 * (16.99) | 16.616 * (6.90) | 12.872 ** (2.43) |
| hwdc | −111.717 * (−13.02) | −49.601 * (−7.34) | −51.811 * (−29.45) | −58.740 * (−36.05) | −72.439 * (−9.33) | −152.883 * (−243.20) | −293.721 * (−155.81) | −358.725 * (−24.49) | −239.033 * (−3.95) |
| ln(hwpu) | 101.573 * (15.50) | 30.969 * (7.72) | 29.204 * (15.49) | 21.642 * (53.05) | 27.818 * (25.39) | 39.717 * (272.40) | 72.307 * (49.39) | 72.955 * (13.49) | 134.461 * (6.10) |
| ln(incpc) | −3.923 (−0.52) | 89.436 * (3.00) | 70.634 * (8.62) | 45.645 * (24.84) | 94.255 * (20.87) | 59.509 * (26.21) | 55.086 * (45.73) | 36.875 *** (1.94) | 31.108 (0.56) |
| Ln(inc) | 32.714 * (3.33) | −79.346 * (−2.58) | −71.167 * (−7.54) | −41.693 * (−16.66) | −87.706 * (−20.23) | −55.368 * (−25.96) | −57.350 * (−58.00) | −41.772 ** (−2.11) | −32.120 (−0.67) |
| Dependent variable: ln(hwpc-owp) | |||||||||
| chgw | 0.021 (0.38) | 0.385 * (10.64) | 0.684 * (14.28) | 0.578 * (41.83) | 0.846 * (14.14) | 1.191 * (5.92) | 0.625 * (16.36) | −0.469 * (−7.03) | −3.128 * (−12.09) |
| ln(mintn) | −0.564 * (−10.18) | −0.874 * (−5.58) | −0.804 * (−20.57) | −0.301 * (−11.04) | −0.229 * (−2.59) | 0.498 * (5.33) | 1.765 * (92.59) | 0.998 * (6.60) | −1.542 * (−7.27) |
| ln(mtel) | 27.906 * (26.21) | 12.841 (1.39) | 0.915 (0.26) | 6.455 * (9.68) | −2.268 (−0.83) | 2.617 (1.22) | 43.730 * (63.74) | 61.866 * (32.37) | 92.981 * (7.39) |
| hwbc | 32.448 * (31.05) | 35.990 * (4.04) | 12.886 * (3.73) | 12.521 * (36.11) | −0.026 (−0.01) | 36.629 * (2.89) | 64.132 * (61.70) | 105.961 * (143.37) | 121.047 * (11.91) |
| hwdc | −814.840 * (−77.89) | −401.672 * (−13.61) | −253.674 * (−27.96) | −318.781 * (−45.97) | −253.467 * (−8.76) | −595.582 * (−20.02) | −2109.25 * (−175.06) | −2831.89 * (−190.62) | −4114.88 * (−57.94) |
| ln(hwpu) | 471.323 * (58.70) | 263.020 * (18.41) | 148.625 * (87.66) | 116.055 * (56.23) | 130.078 * (14.49) | 170.126 * (10.35) | 473.401 * (259.22) | 561.470 * (175.84) | 570.088 * (14.54) |
| ln(incpc) | 40.871 * (2.95) | 245.847 * (4.79) | 146.488 * (3.45) | 141.212 * (16.83) | 595.817 * (6.89) | 391.820 * (14.72) | −97.605 * (−9.85) | 488.771 * (47.36) | 878.762 * (6.61) |
| Ln(inc) | 36.216 * (2.82) | −177.512 * (−2.87) | −109.080 * (−2.85) | −120.887 * (−12.13) | −621.792 * (−6.74) | −318.265 * (−7.23) | 145.639 * (14.40) | −452.472 * (−43.35) | −712.144 * (−5.89) |
| Dependent variable: ln(hwpc-obp) | |||||||||
| chgw | 0.279 * (8.43) | 2.511 * (3.09) | 2.652 * (17.72) | 2.519 * (3.98) | 3.638 * (18.58) | 1.567 * (8.80) | 2.121 * (5.14) | −5.095 * (−4.62) | −9.205 * (−8.25) |
| ln(mintn) | −14.128 * (−68.60) | −6.709 * (−7.00) | −4.419 * (−8.54) | −4.020 * (−6.60) | 1.905 * (5.03) | −2.849 * (−2.91) | 3.580 * (2.61) | 9.055 * (19.20) | 1.943 (0.61) |
| ln(mtel) | −15.492 * (−8.93) | −72.844 *** (−1.77) | 96.273 * (6.33) | 67.337 ** (2.32) | 155.140 * (19.59) | 120.211 * (9.02) | 180.679 * (7.74) | 530.461 * (8.55) | 354.010 * (4.03) |
| hwbc | 5.577 * (2.61) | 249.141 * (5.28) | 103.034 ** (2.13) | 218.808 ** (1.89) | 85.141 * (25.59) | 117.600 * (6.28) | 114.348 * (4.63) | 279.130 * (3.16) | 375.730 * (5.04) |
| hwdc | −5645.792 * (−296.39) | −1626.795 * (−6.07) | −2452.611 * (−19.11) | −1732.012 * (−10.09) | −1876.842 * (−18.01) | −2354.531 * (−6.10) | −3946.42 * (−60.66) | −15371.1 * (−71.94) | −20661.6 * (−33.30) |
| ln(hwpu) | 3132.294 * (243.01) | 2108.473 * (18.07) | 1668.942 * (36.47) | 1562.774 * (11.08) | 1133.001 * (33.30) | 1351.051 * (9.67) | 785.469 * (8.76) | 2391.274 * (37.51) | 1322.978 * (3.40) |
| ln(incpc) | −1326.453 * (−127.49) | −3413.275 * (−10.18) | −2391.463 * (−15.52) | −986.022 * (−2.71) | −399.072 * (−3.31) | −605.307 *** (−1.85) | 1606.63 * (5.77) | 810.88 *** (1.72) | 6997.146 * (5.64) |
| Ln(inc) | 2654.533 * (196.65) | 3855.438 * (11.92) | 2594.303 * (16.51) | 1094.606 * (2.65) | 399.609 * (3.40) | 768.680 ** (2.01) | −1524.89 * (−5.70) | −392.153 (−0.90) | −5742.37 * (−5.72) |
Note: t-statistics are in parentheses; * significant with p < 0.01; ** significant with p < 0.05; *** significant with p < 0.1. Source: Author’s calculation.
Publisher’s Note: MDPI stays neutral with regard to jurisdictional claims in published maps and institutional affiliations. |
© 2021 by the author. Licensee MDPI, Basel, Switzerland. This article is an open access article distributed under the terms and conditions of the Creative Commons Attribution (CC BY) license (https://creativecommons.org/licenses/by/4.0/).
Share and Cite
MDPI and ACS Style
Uttama, N.P. Open Innovation and Business Model of Health Food Industry in Asia. J. Open Innov. Technol. Mark. Complex. 2021, 7, 174. https://0-doi-org.brum.beds.ac.uk/10.3390/joitmc7030174
AMA Style
Uttama NP. Open Innovation and Business Model of Health Food Industry in Asia. Journal of Open Innovation: Technology, Market, and Complexity. 2021; 7(3):174. https://0-doi-org.brum.beds.ac.uk/10.3390/joitmc7030174
Chicago/Turabian StyleUttama, Nathapornpan Piyaareekul. 2021. "Open Innovation and Business Model of Health Food Industry in Asia" Journal of Open Innovation: Technology, Market, and Complexity 7, no. 3: 174. https://0-doi-org.brum.beds.ac.uk/10.3390/joitmc7030174