Article

Sitagliptin Potentiates the Anti-Neoplastic Activity of Doxorubicin in Experimentally-Induced Mammary Adenocarcinoma in Mice: Implication of Oxidative Stress, Inflammation, Angiogenesis, and Apoptosis

by
Mohamed M. Salama
1,2,
Randa A. Zaghloul
2,
Rania M. Khalil
1 and
Mamdouh M. El-Shishtawy
2,*
1
Department of Biochemistry, Faculty of Pharmacy, Delta University for Science and Technology, Gamasa 35712, Egypt
2
Department of Biochemistry, Faculty of Pharmacy, Mansoura University, Mansoura 35516, Egypt
*
Author to whom correspondence should be addressed.
Submission received: 6 May 2022 / Revised: 7 June 2022 / Accepted: 14 June 2022 / Published: 7 July 2022

Abstract

:
Sitagliptin (STG) is a highly selective dipeptidyl peptidase-4 inhibitor recently used in the treatment of type 2 diabetes. The current study aimed to investigate the anti-neoplastic effect of STG alone and in combination with Doxorubicin (Dox), a known chemotherapeutic agent but with ominous side effects. After intramuscular inoculation of 2 × 10⁶ Ehrlich tumor cells, Female Swiss mice were divided into tumor-bearing control, STG-treated, Dox-treated, and a combination of STG and Dox-treated groups. The results showed a significant reduction in the tumor growth of the treated animals in comparison with those of the positive control group with a more prominent effect in the co-treated group. Where, the anti-proliferative and apoptotic effect of STG, and its chemo-sensitizing ability, when used in combination with Dox, was mediated by modulation of oxidative stress (MDA and GSH), attenuation of tumor inflammation (IL-6 and IL-1β), and angiogenesis (VEGF), suppressing proliferation (β-catenin and cyclin-D1) and enhancement of apoptosis (survivin, p53, caspase 3). Thus, in conclusion, STG as adjunctive therapy for Dox could be a strategy for the treatment of breast cancer patients, by their ability in hindering cell proliferation and minimizing the associated oxidative and inflammatory adverse reactions.

Graphical Abstract

1. Introduction

Breast cancer is the most common type of invasive cancer in females and the second leading cause of cancer-related deaths worldwide with an estimated 2.1 million newly diagnosed cases [1]. Ehrlich solid carcinoma (ESC), a neoplasm of epithelial malignant origin corresponding to the murine mammary adenocarcinoma, has been frequently utilized as an in-vivo experimental model of breast cancer. Similar to human tumors, the cancer cells of ESC are known for their aggressiveness, fast growth, and sensitivity to chemotherapy. As a result, ESC has been utilized to investigate the possible antitumor activities of different therapeutic products [2].
Doxorubicin (Dox) is a cytotoxic anthracycline antibiotic, widely used for the treatment of various types of cancer including both solid and hematological malignancies [3]. However, the therapeutic value of Dox has been hampered by its severe toxicity with adverse side effects, mediated mainly by the oxidative stress and inflammatory response [4]. Chemo-resistance is another major obstacle to Dox resulting in poor prognosis and survival [5]. The tumor microenvironment can promote drug resistance through the upregulation of inflammatory mediators’ synthesis such as interleukin-6 (IL-6) and interleukin-1β (IL-1β), along with angiogenesis [6,7]. Angiogenesis itself plays a pivotal role in tumor progression, dissemination, and metastasis of solid tumors. This process is driven by vascular endothelial growth factor (VEGF), the key regulatory cytokine of angiogenesis [8]. These complications observed with cancer therapies have mandated finding proper adjuvants to increase the chemo-sensitivity, overcoming some of the established side effects, as well as improving the patient survival and quality of life.
Sitagliptin (STG) is a highly selective dipeptidyl peptidase-4 (DPP-4) inhibitor that has been recently used for the treatment of type-2 diabetes mellitus by blocking the cleavage of incretin hormones, prolonging their insulinotropic activity [9]. Recent studies have suggested that DPP-4, widely expressed in different types of cells, plays an important role in tumor progression in several human malignancies [10,11,12,13]. By altering the fate of many regulatory factors together with chemokines, growth factors, and other peptides, DPP-4 could normally control cellular growth, differentiation, and intracellular signal transduction [10,14]. Abnormal expression of DPP-4 and/or its catalytic function results in an altered peptide activation or inactivation, contributing to the disruption of normal cellular homeostasis, neoplastic transformation, or tumor progression [10]. Accordingly, inhibitors of DPP-4 have been considered a new potential therapeutic modality for cancer therapy, possibly due to their cytotoxic effects on tumor cells together with their antioxidant and anti-inflammatory properties [15,16].
Therefore, our study aimed to investigate the potential anti-tumor effect of STG in ESC-bearing mice and highlight the possible underlying molecular mechanisms. In addition, the possibility of combining STG with Dox, to potentiate their chemotherapeutic effects, was also assessed.

2. Materials and Methods

2.1. Drugs and Chemicals

STG was purchased as Januvia® tablets, 50 mg (Merck Sharp and Dohme Ltd., Northumberland, UK), crushed and dispersed in normal saline. Dox was obtained as Adriablastina® vial (Pharmacia Italia S.P.A., Nerviano, Italy). All other used reagents and chemicals purchased were of analytical grade.

2.2. Cell Line

Ehrlich ascites carcinoma (EAC) is of a mammary origin and functions as the original tumor from which Ehrlich solid tumor was obtained. The EAC cell line (RRID: CVCL_3873) was obtained from the Pharmacology and Experimental Oncology Unit of the National Cancer Institute, Cairo University, Cairo, Egypt. The cells were maintained in ascetic form through transplantation of 2.5 × 10⁶ tumor cells into the peritoneal cavity and allowed to multiply. The ascetic fluid containing Ehrlich tumor cells was developed within 10 days and then collected followed by the dilution with normal saline (1:10) and counted via a Hemocytometer (Sigma-Aldrich, St. Louis, MO, USA). The viability of the cells used is set to be not less than 95% as confirmed by the trypan blue (Sigma-Aldrich, St. Louis, MO, USA) exclusion assay [17].

2.3. Animals

Female Swiss albino mice (body weight of 20–25 g) were purchased from Theodor Bilharz Research Institute, Cairo, Egypt. Male mice were excluded because of their poor tumor growth [18]. Mice were kept in steel-mesh cages, in a standard animal facility under controlled environmental conditions at room temperature of 22 ± 2 °C, 45–55% humidity, and a 12-h light–dark cycle. They were fed standard pellet chow (23% protein and 4% fat) and allowed free access to tap water. The animal care and experiments described in this study comply with the ethical principles and guidelines for the care and use of laboratory animals adopted by the “Research Ethics Committee” of Faculty of Pharmacy, Mansoura University, Mansoura, Egypt with approval number (2021-387) which is in accordance with the ARRIVE guidelines and the National Research Council’s Guide for the Care and Use of Laboratory Animals (Committee for the Update of the Guide for the Care and Use of Laboratory Animals, 2011).

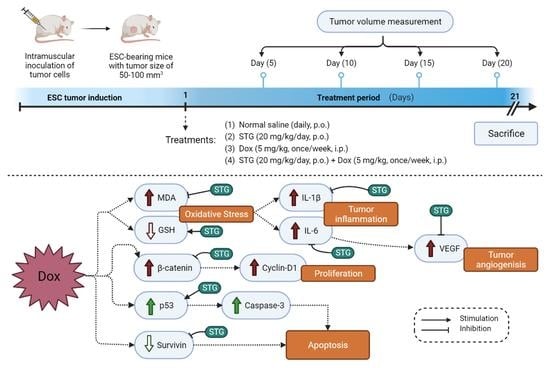
2.4. Experimental Design

Following a period of 7 days for acclimatization, solid tumors were induced by intramuscular inoculation of 0.2 mL of the ascetic fluid, containing approximately 2 × 10⁶ of EAC cells, in the right thigh of the hind limb of each mouse [19]. When all the solid tumors have reached a size of 50–100 mm3, animals were randomly divided into 4 groups (10 mice per group) as followings:
  • Positive control group: mice daily received normal saline by oral gavage for 21 days;
  • STG group: mice received STG (20 mg/kg/day, orally) for 21 days [14,20];
  • Dox group: mice received Dox (5 mg/kg, once/week by i.p.) for 21 days [21]; and
  • STG + Dox group: mice received STG (20 mg/kg/day, orally) and Dox (5 mg/kg, once/week by i.p.) for 21 days.

2.5. Tumor Volume and Growth Inhibition Rate

The tumor mass was measured five days after the tumor cell injection (day 0) and then every other five days for 21 days. The volume of the solid tumor was measured using a Vernier caliper (Tricle Brand, Shanghai, China) according to the following formula [22]:
Tumor volume (mm3) = 0.5 (Length × Width2)
While the tumor growth inhibition percentage was calculated using the following formula [23]:
Tumor growth inhibition (%) = [(Mean tumor volume of the positive control group − Mean tumor volume of the treated group)/Mean tumor volume of positive control group] × 100

2.6. Tissue Samples Collection

After 21 days, mice were sacrificed using isoflurane in chamber induction according to IACUC guidelines and the tumor mass was harvested, weighed, and separated into three fragments. The first part was weighted, and homogenized (10% w/v) in phosphate-buffered saline (PBS) (0.02 M, pH 7.4) using a tissue homogenizer (Heidolph SilentCrusher M, Schwabach, Germany). The homogenates were then centrifuged at 5000 rpm for 5 min at 4 °C. The resulting supernatants were stored at −80 °C for the subsequent evaluation of the inflammatory parameters and oxidative stress biomarkers. The second part was immersed immediately in 10 volumes of RNAlater® RNA Stabilization Reagent (Qiagen, Hilden, Germany, Catalog No. 76104), incubated overnight at 2–8 °C, and then stored at −80 °C for further nuclear extraction. The last part was fixed in 10% neutral buffered formalin (pH 7.4) (El-Nasr Chemicals Co., Cairo, Egypt) to be embedded in paraffin wax for histopathological and immunohistochemical examination.

2.7. Assessment of Oxidative Stress Markers

Malondialdehyde (MDA) and glutathione (GSH) were measured spectrophotometrically in the homogenate of the tumor tissue using commercially available kits (Bio Diagnostic, Giza, Egypt). All procedures were performed as per the manufacturer’s instructions.

2.8. Enzyme-Linked Immunosorbent Assay (ELISA)

In accordance with the given instructions, the concentrations of IL-6 and IL-1β of the tumor homogenate were determined using ELISA kits obtained from Aviva Systems Biology (San Diego, CA, USA).

2.9. Quantitative Real-Time Polymerase Chain Reaction (qRT-PCR)

Total RNA was extracted from the tumor-bearing thigh collected from different mice groups using Qiagen RNeasy® Mini Kit (Qiagen, Hilden, Germany, Catalog No. 74104) in RNase-free environment, following the manufacturer’s protocol. The RNA concentration and purity were measured spectrophotometrically (260, 260/280 nm ratio, respectively) using the NanoPhotometer® P330 (Implen, Schatzbogen, München, Germany). A total of 1 μg of the purified RNA was reverse-transcribed into complementary DNA (cDNA) using RevertAid First Strand cDNA Synthesis Kit (Thermo Fisher Scientific Inc., Vantaa, Finland, Catalog No. K1622). VEGF, β-catenin, cyclin-D1, and survivin mRNA levels were measured using Bioline SensiFAST™ SYBR® No-ROX Kit (Meridian Bioscience™, Memphis, TN, USA, Catalog No. BIO-65053) and PikoReal 96™ Real-Time PCR System (Thermo Fisher Scientific Inc., Vantaa, Finland). Meanwhile, mouse glyceraldehyde 3-phosphate dehydrogenase (GAPDH) was used as a housekeeping gene and an internal reference control. The sequences of forward and reverse primers are illustrated in Table 1. Relative expression of the studied genes was calculated using the 2−ΔΔCT method [24], normalized with respect to GAPDH mRNA, and relative to a calibrator sample. Untreated positive control samples were used as calibrators.

2.10. Histopathological Examination

Paraffin-embedded tumor tissues of the different groups were cut into 4 μm thick sections and processed to be stained by hematoxylin and eosin (H&E) for light microscopic evaluation. All sections were blindly photographed and examined by an independent pathologist.

2.11. Terminal dUTP Nick-End Labeling (TUNEL) Assay

For the detection of nuclear DNA fragmentation in the apoptotic cells, paraffin-embedded tumor tissue sections were stained with the TUNEL technique using the Apo-BrdU In Situ DNA Fragmentation Assay Kit (Biovision, Milpitas, CA, USA, Catalog No. K401-60) in terms of the manufacturer’s instructions. Photographs were taken with a Leica fluorescence microscope (Buffalo Grove, IL, USA), and the number of apoptotic TUNEL-positive cells (red) was counted at a magnification of 400×.

2.12. Immunohistochemical (IHC) Analysis

p53 and caspase-3 markers were measured immunohistochemically using the BioModule™ IHC Staining Kit (Invitrogen™, Carlsbad, CA, USA, Catalog No. WFGE11), according to the manufacturer’s protocol. Paraffin-embedded tumor tissue sections were cleared in xylene, rehydrated, and treated with Peroxo-Block™, a specific inhibitor of endogenous peroxidase activity, to efficiently remove endogenous peroxidase activity followed by heat-induced epitope retrieval through immersing in diluted citrate buffer (pH 6.0) and boiling the solution for 15 min. The sections were incubated with p53 polyclonal antibody (ABclonal, Woburn, MA, USA, Catalog No. A3185; 1:100 dilution) or caspase-3 monoclonal antibody (GeneTex, Irvine, CA, USA, Catalog No. GTX30246; 1:200 dilution). After washing with PBS, the slides were incubated with a horseradish peroxidase enzyme (HRP) polymer conjugate, visualized with diaminobenzidine (DAB) chromogen, and finally, counterstained with Mayer’s hematoxylin. Slides were photographed using an Olympus® digital camera that was attached to an Olympus® microscope (Shinjuku, Tokyo, Japan), and then the brown color density, which represents p53 or caspase-3 protein expression, was analyzed using ImageJ software version 1.2.4, RRID: SCR_003070 (National Institutes of Health, Bethesda, MD, USA).

2.13. Statistical Analysis

Statistical analysis was performed using GraphPad Prism software version 6, RRID: SCR_002798 (La Jolla, CA, USA). The dissimilarities between the groups were evaluated by one-way ANOVA followed by Tukey’s post-hoc test. The data are expressed as Mean ± SD. The differences between the groups were considered statistically significant when p value < 0.05.

3. Results

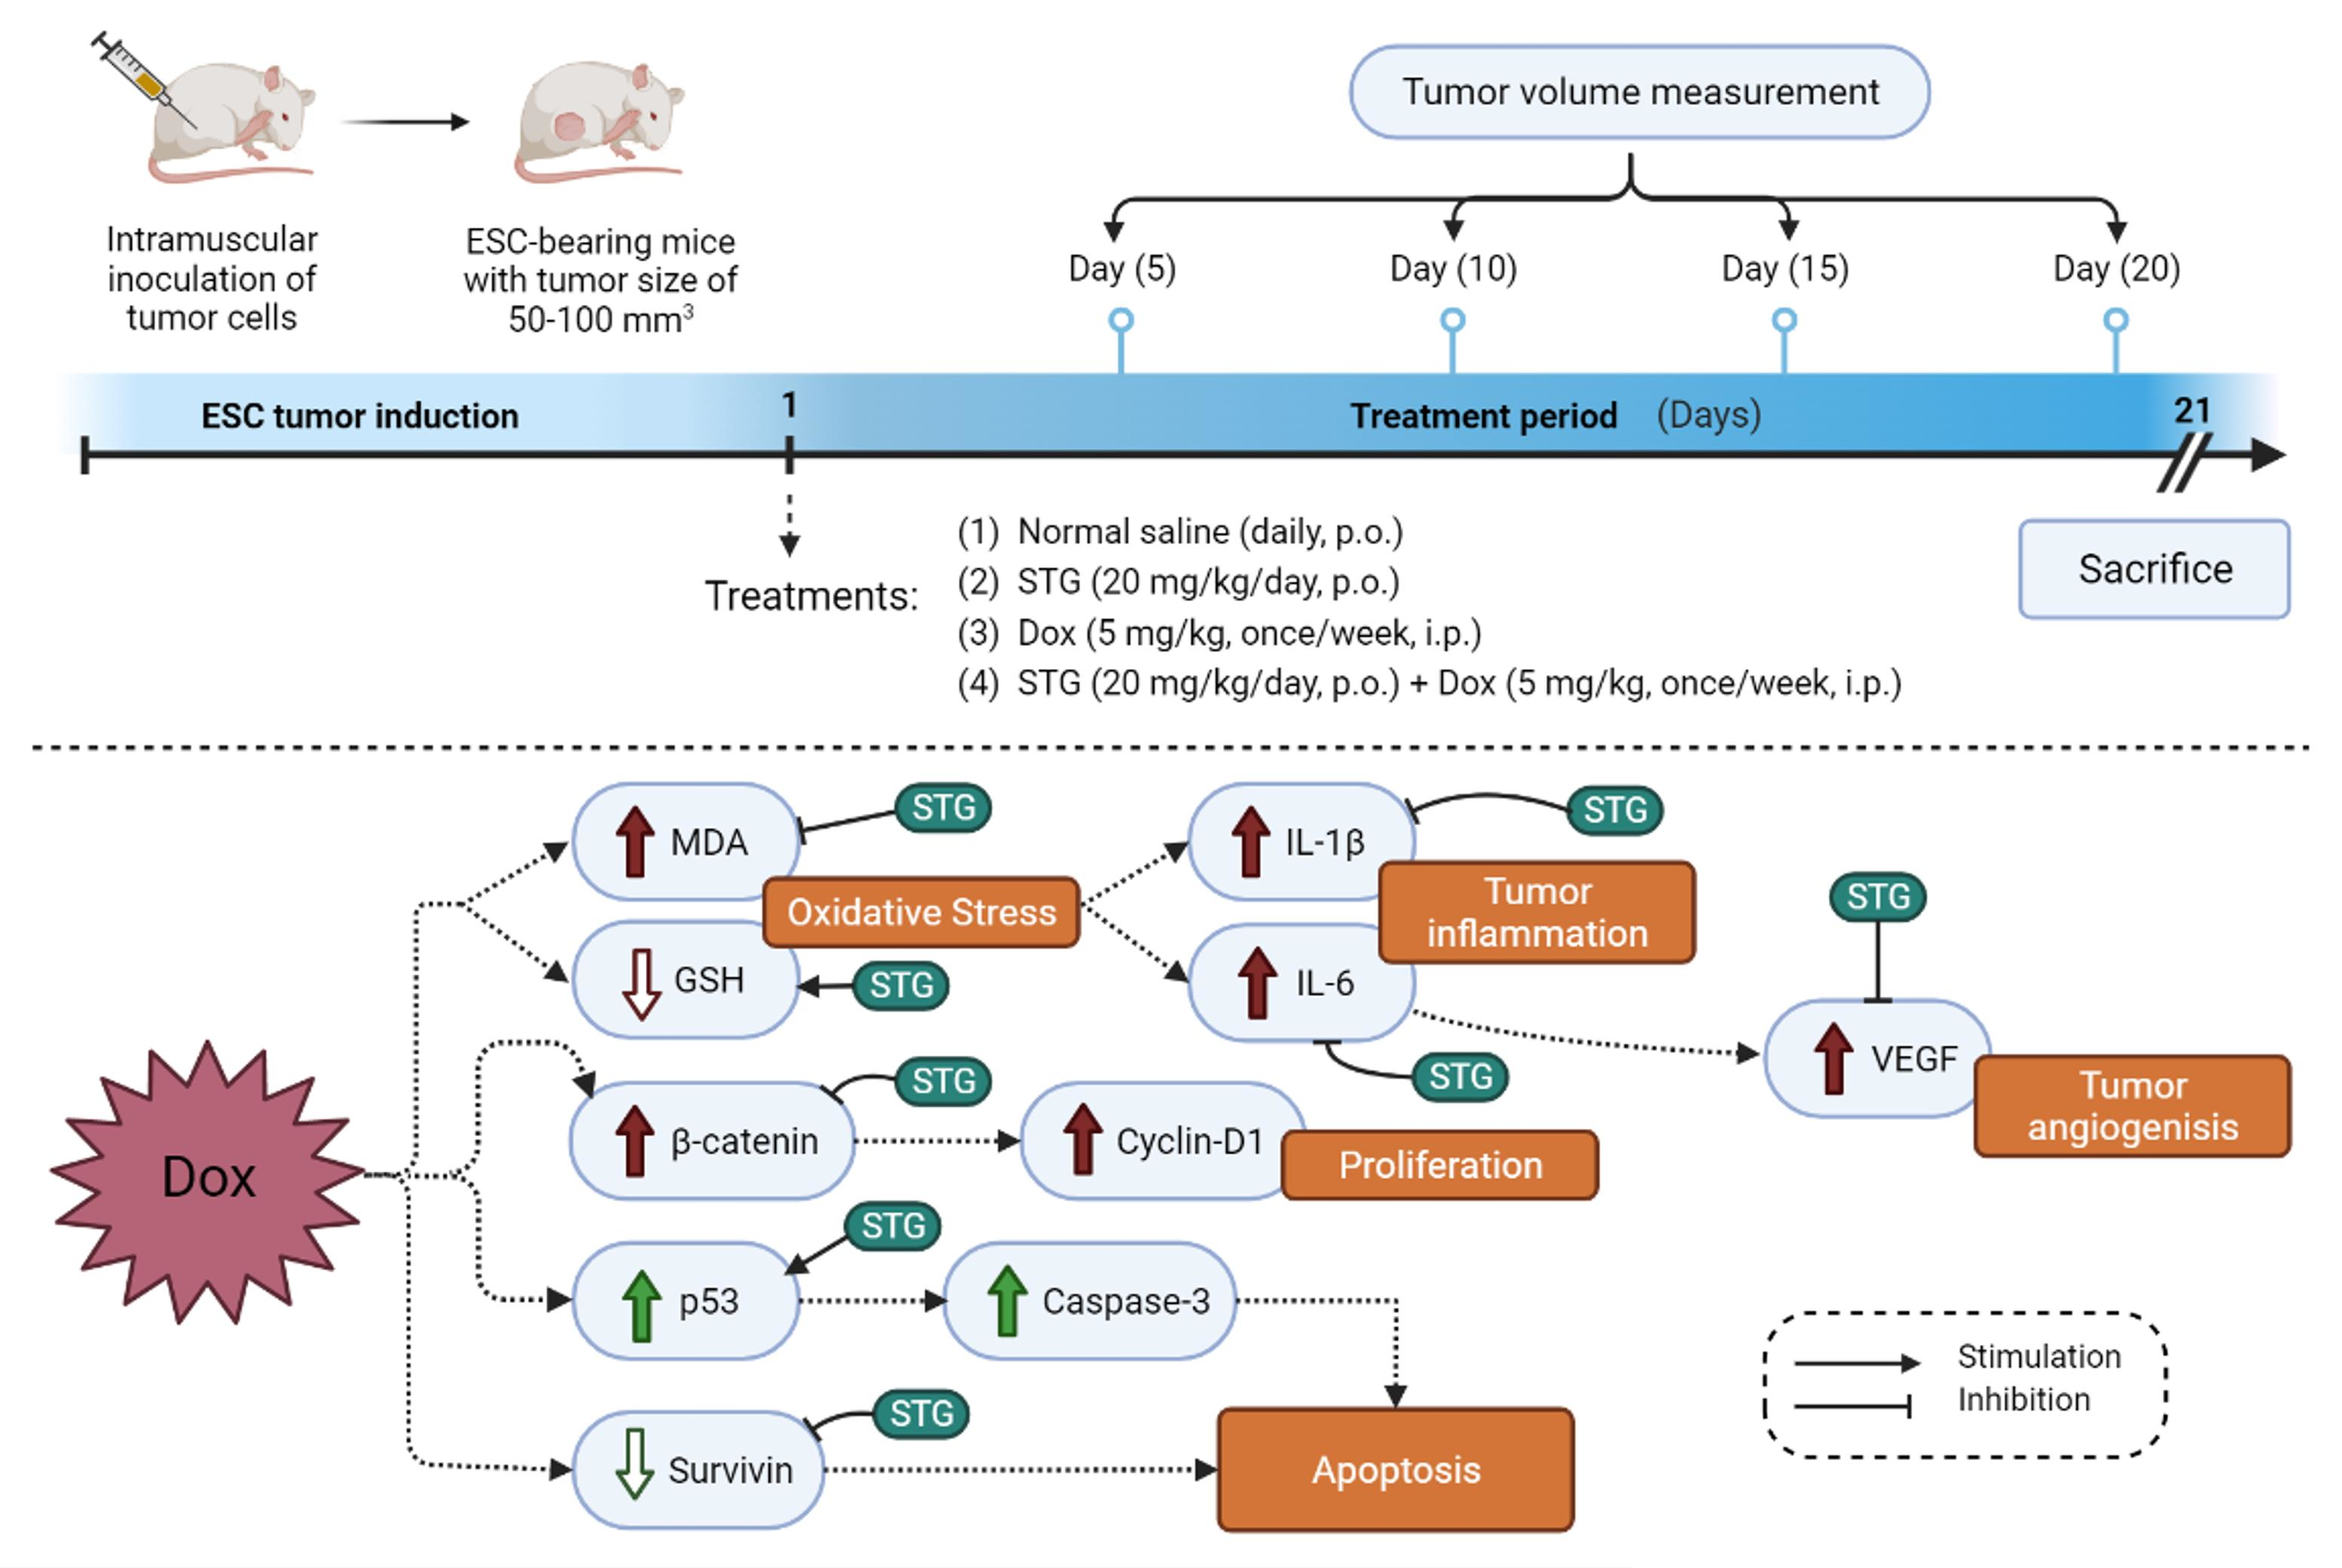
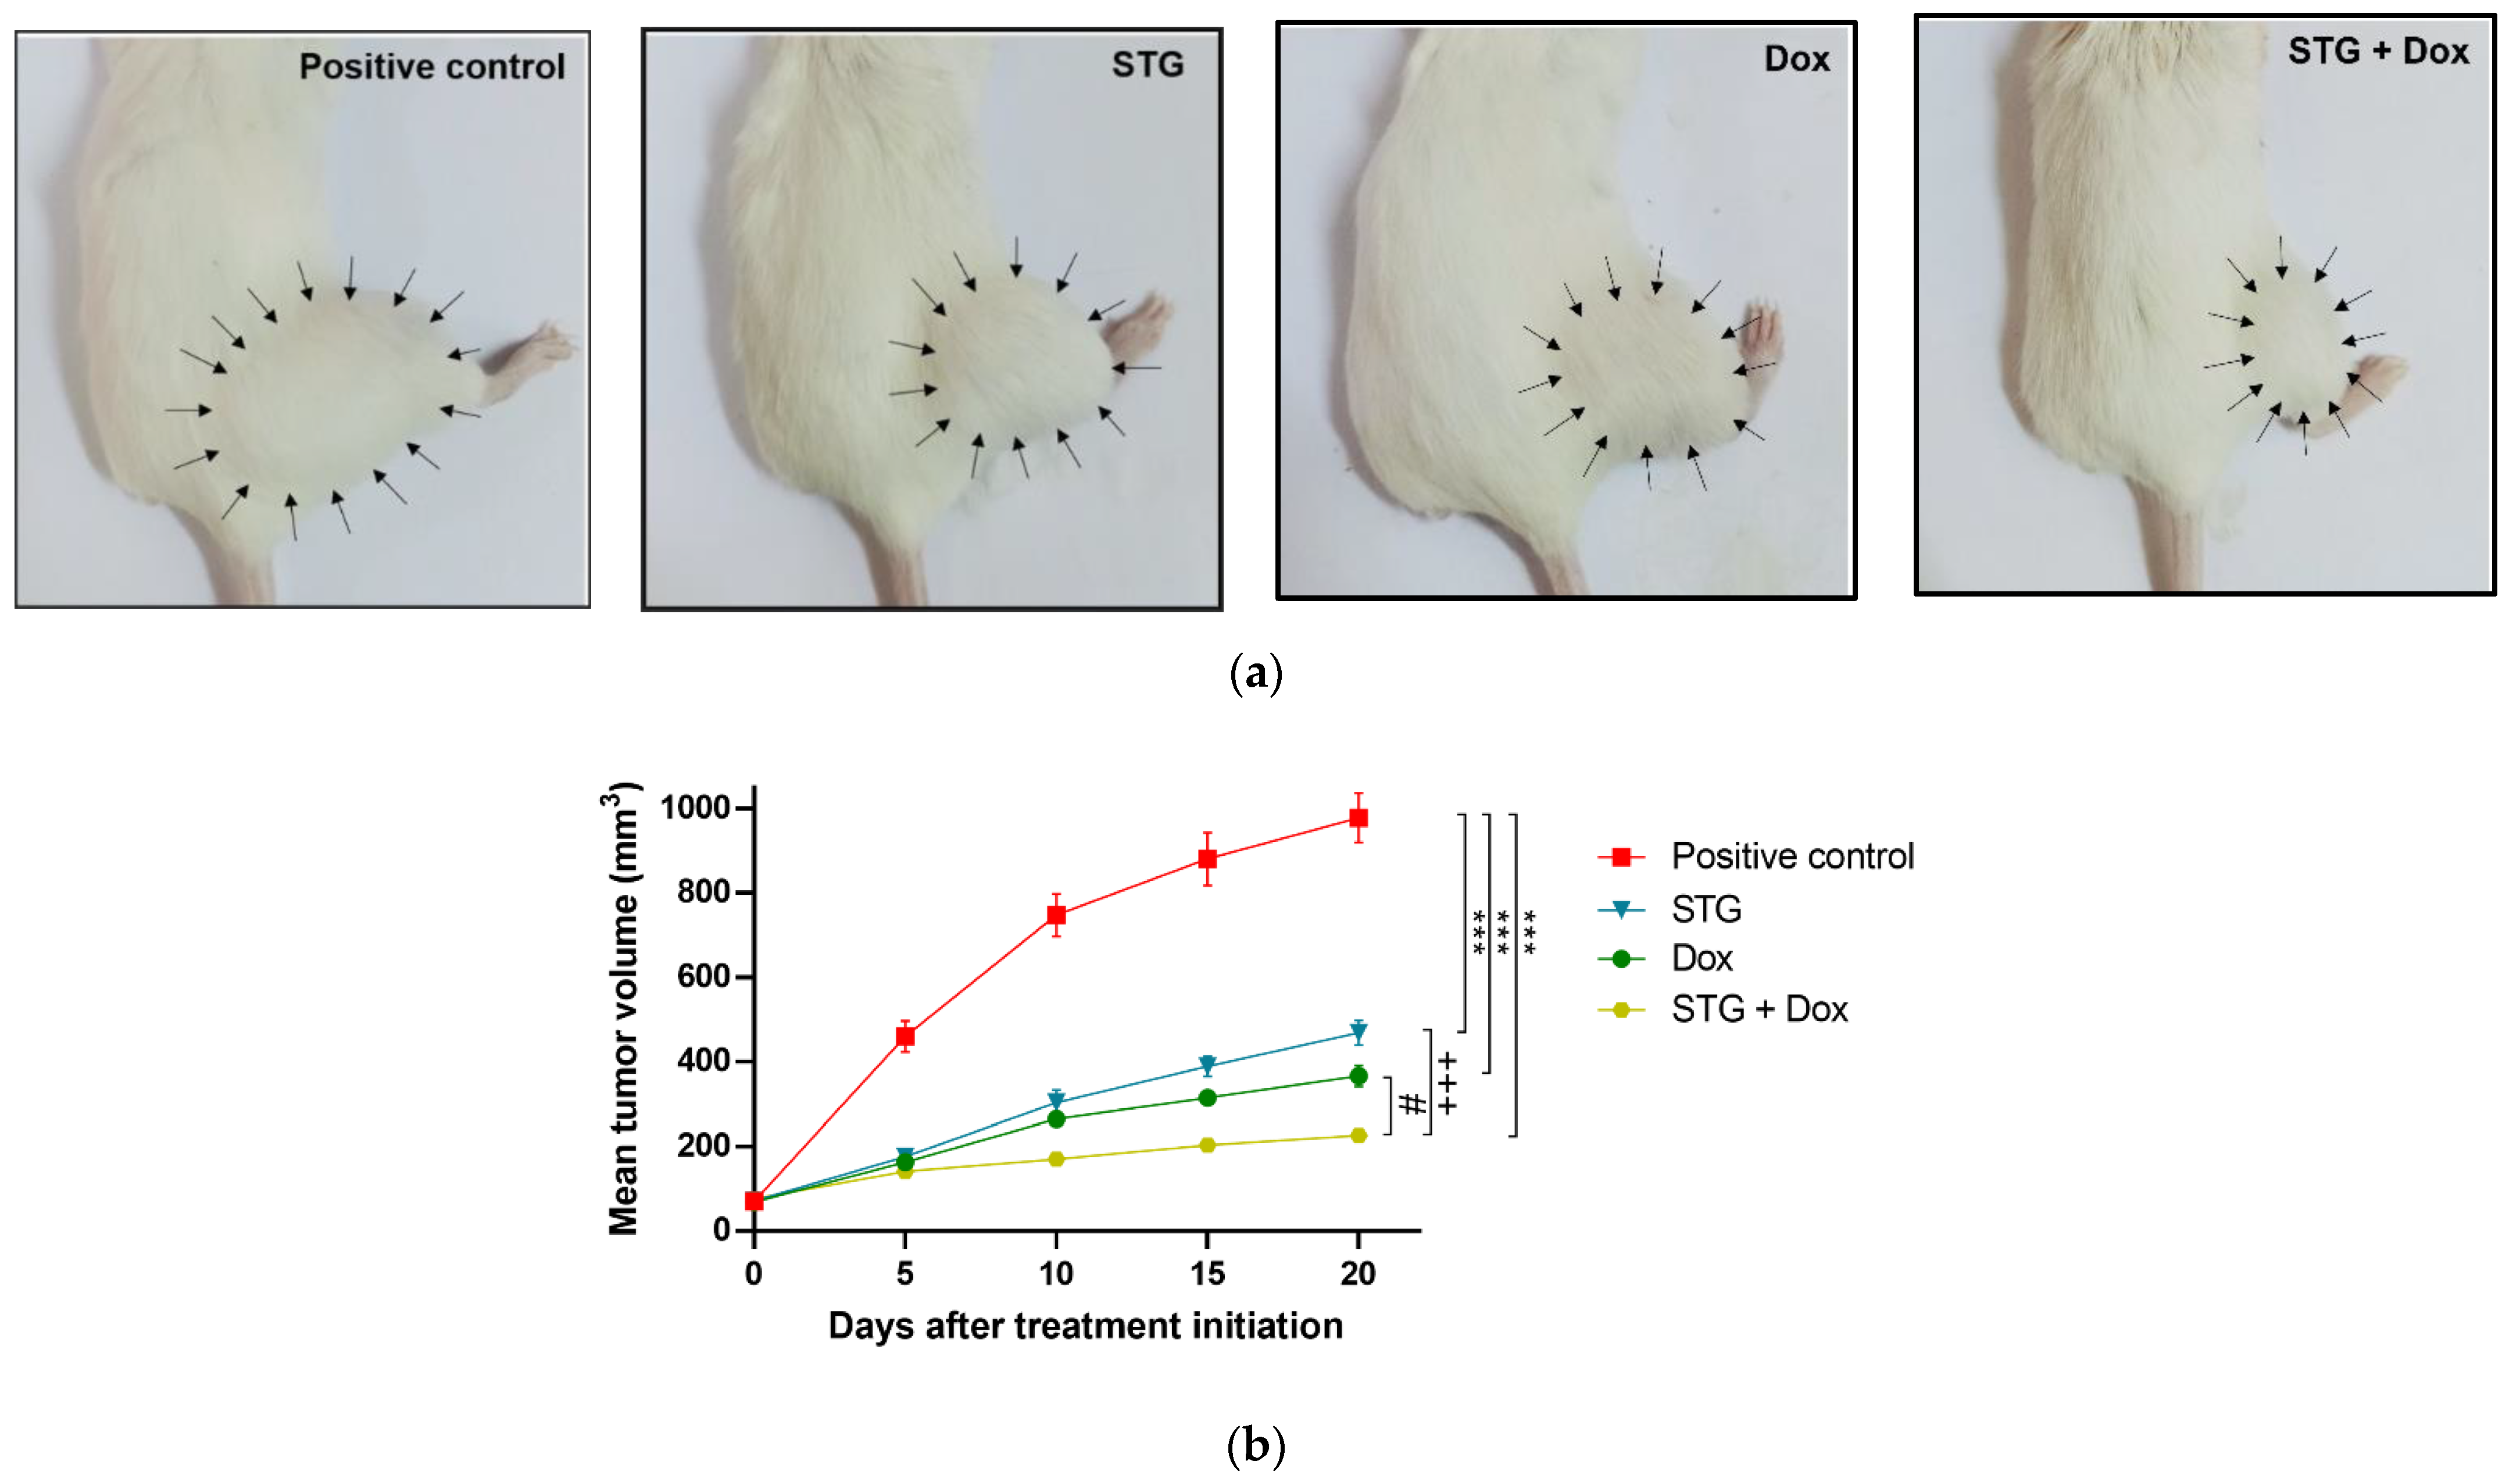
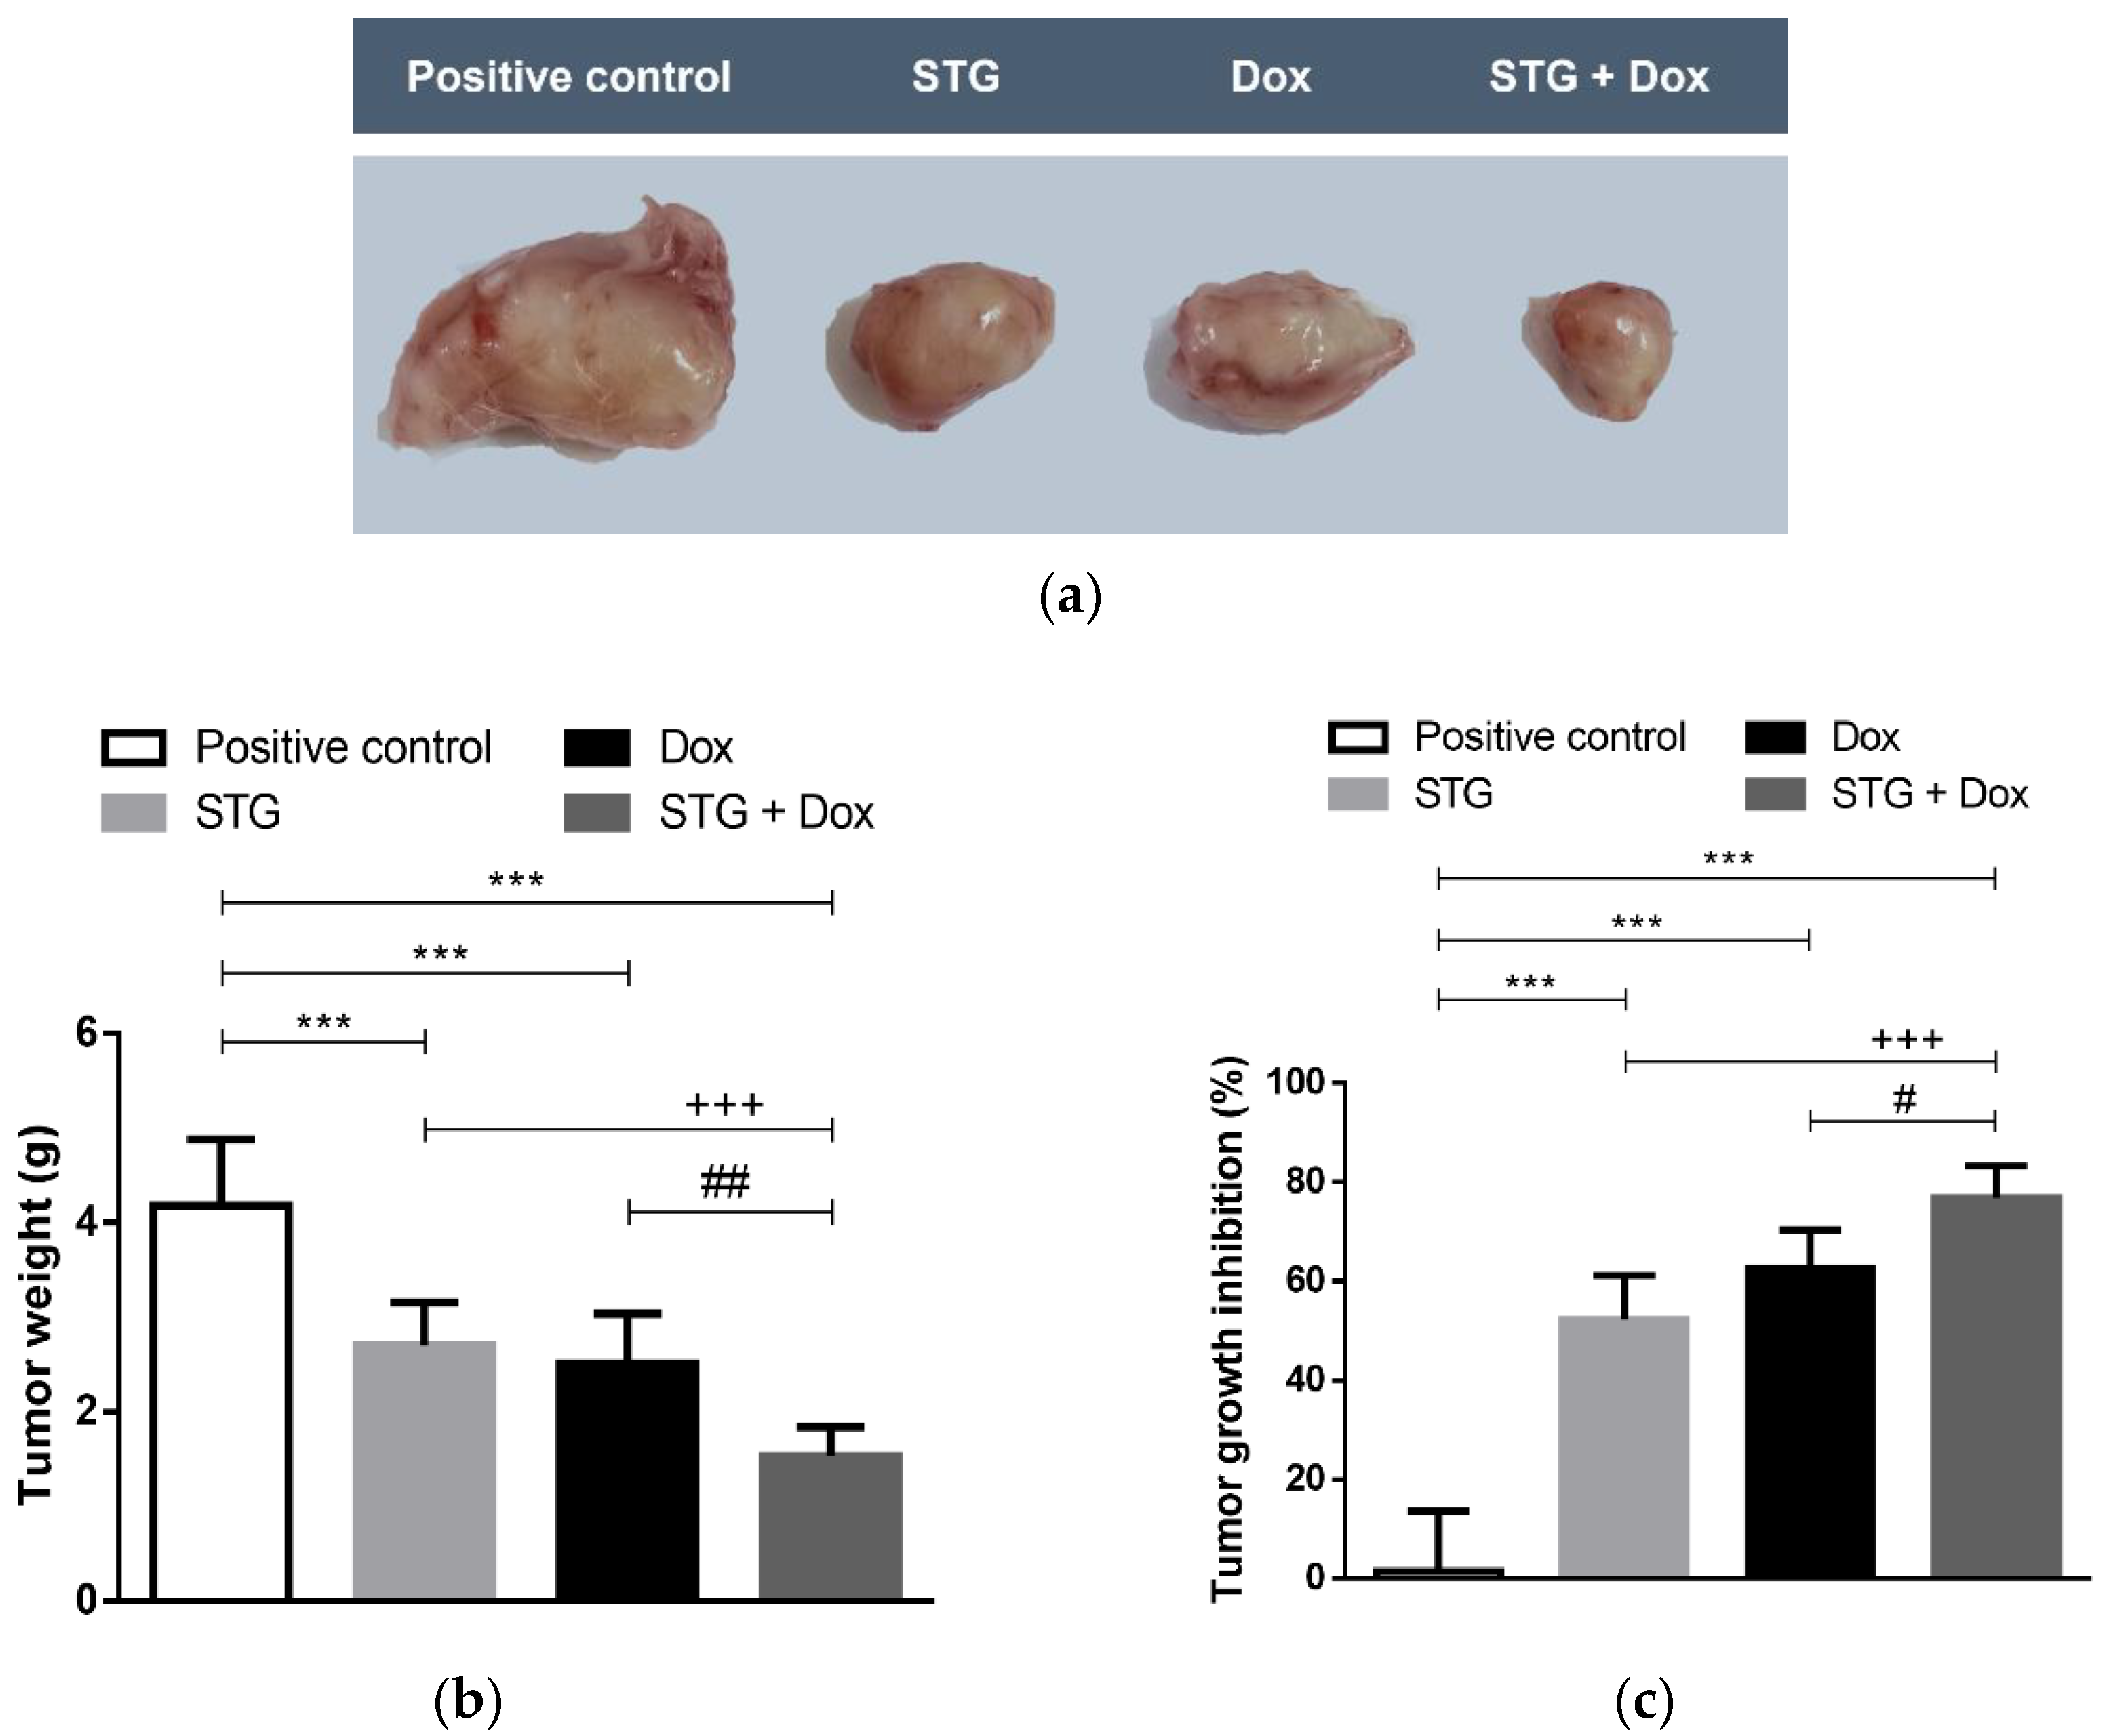
3.1. Growth Suppressive Effect of STG, Dox, and Their Combination on ESC-Bearing Mice

The growth-suppression effect of STG, Dox, and their combination was evaluated by assessing the mean tumor volume (mm3) of the ESC in the right thigh (Figure 1) and the weight (g) of the solid tumors (Figure 2a,b), as well as the tumor growth inhibition percentage (Figure 2c). After 21 days of initial treatment, all treated ESC-bearing mice showed a significant decrease in the mean tumor volume and weight when compared to the positive control group.
These findings were accompanied by a regression in the tumor growth by 52.3%, 62.47% and 76.86% in the STG, Dox, and STG + Dox groups, respectively, when compared to the positive control group. A significant difference was observed in the % tumor growth inhibition in STG + Dox group when compared with Dox (p < 0.05) or STG (p < 0.001) groups.

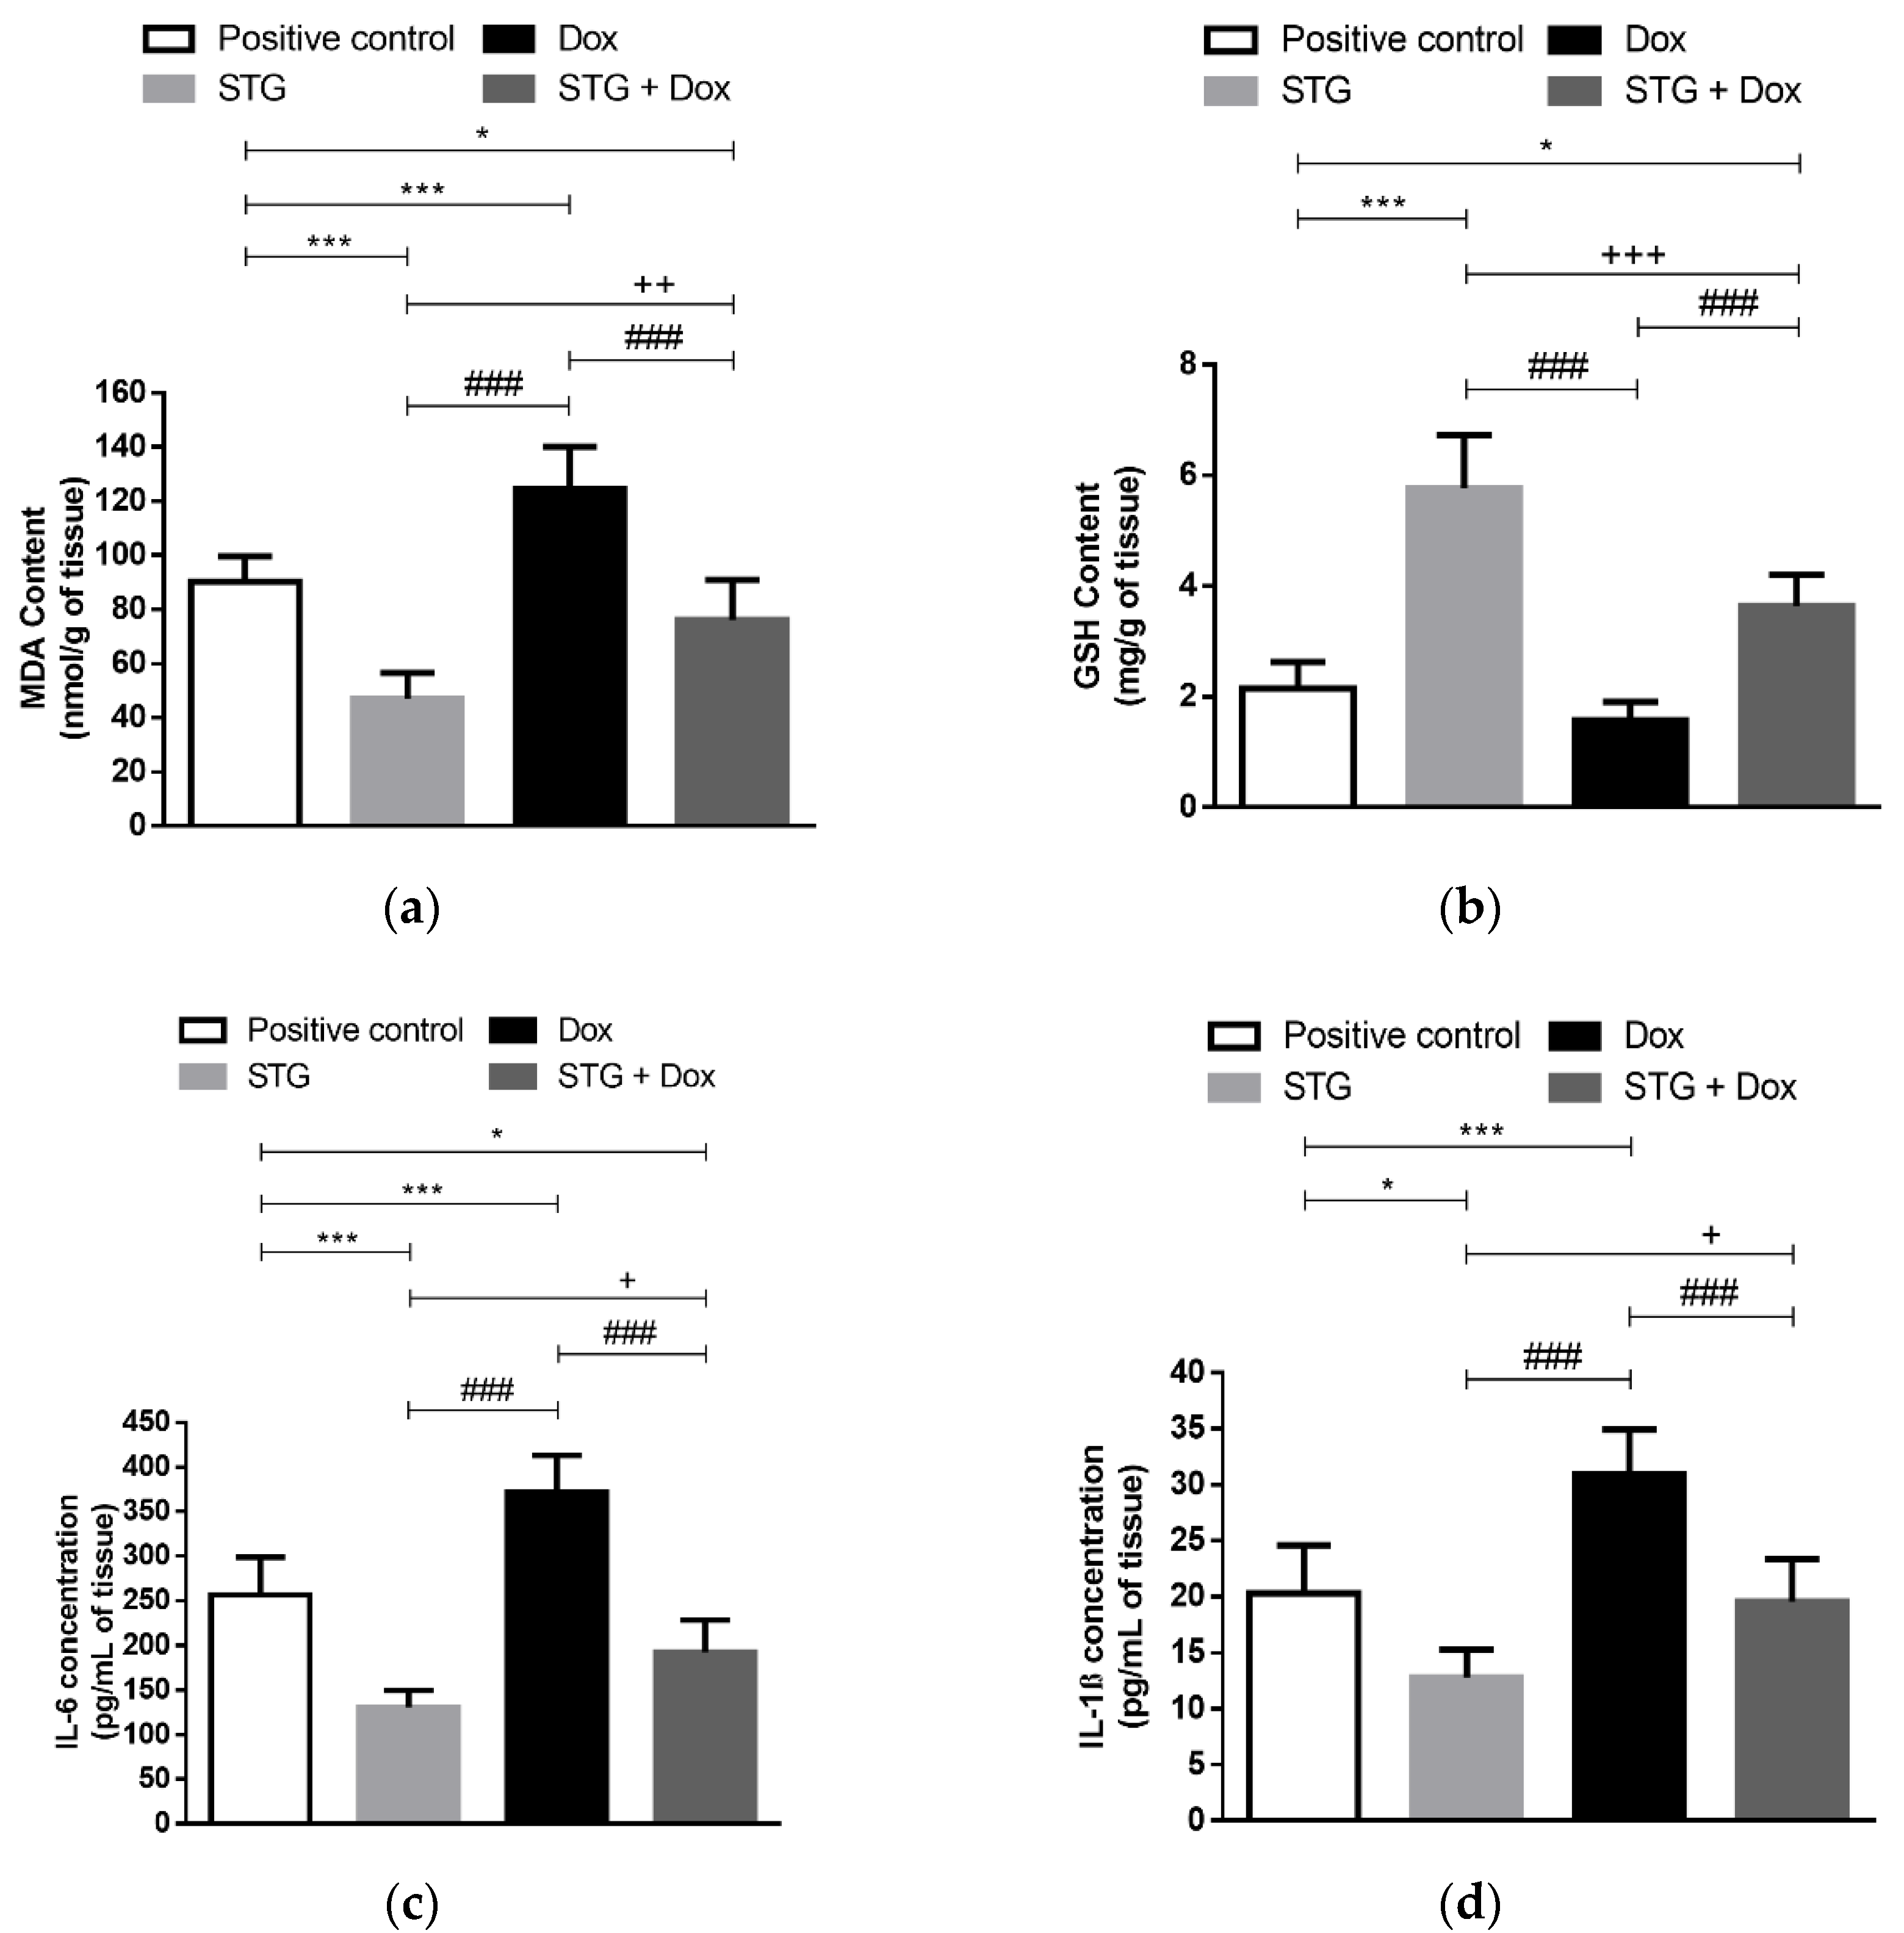
3.2. Effect of Treatment with STG, Dox, and Their Combination on Oxidative Status and Inflammatory Parameters in Tumor Tissue

Tumor lipid peroxidation marker, MDA, and the antioxidant molecule, GSH, of the different experimental groups are shown in Figure 3a,b. Unfortunately, treatment with Dox exhibited a significant increase in the tumor content of MDA as compared to the positive control group (p < 0.001). In contrast, treatment with STG alone or in combination with Dox significantly decreased the tumor content of MDA when compared to either the positive control group (p < 0.001 and <0.05, respectively) or Dox group (p < 0.001 and <0.001, respectively). Moreover, no significant difference in the GSH content was detected between both Dox and the positive control groups. On the other hand, treatment with STG alone or in combination with Dox significantly increased the GSH content when compared to the positive control (p < 0.001 and <0.05, respectively) and Dox group (p < 0.001 and <0.001, respectively).
In the Dox group, tumor levels of IL-6 and IL-1β were significantly increased when compared to the positive control group (p < 0.001) (Figure 3c,d). On the other hand, when STG was administered, these inflammatory cytokines were significantly reduced to levels lower than the positive control (p < 0.001 and <0.05, respectively) and Dox group (p < 0.001 and <0.001, respectively). Consequently, combining the treatment STG with Dox significantly decreased the tumor tissue inflammation as compared to the Dox group (p < 0.001).

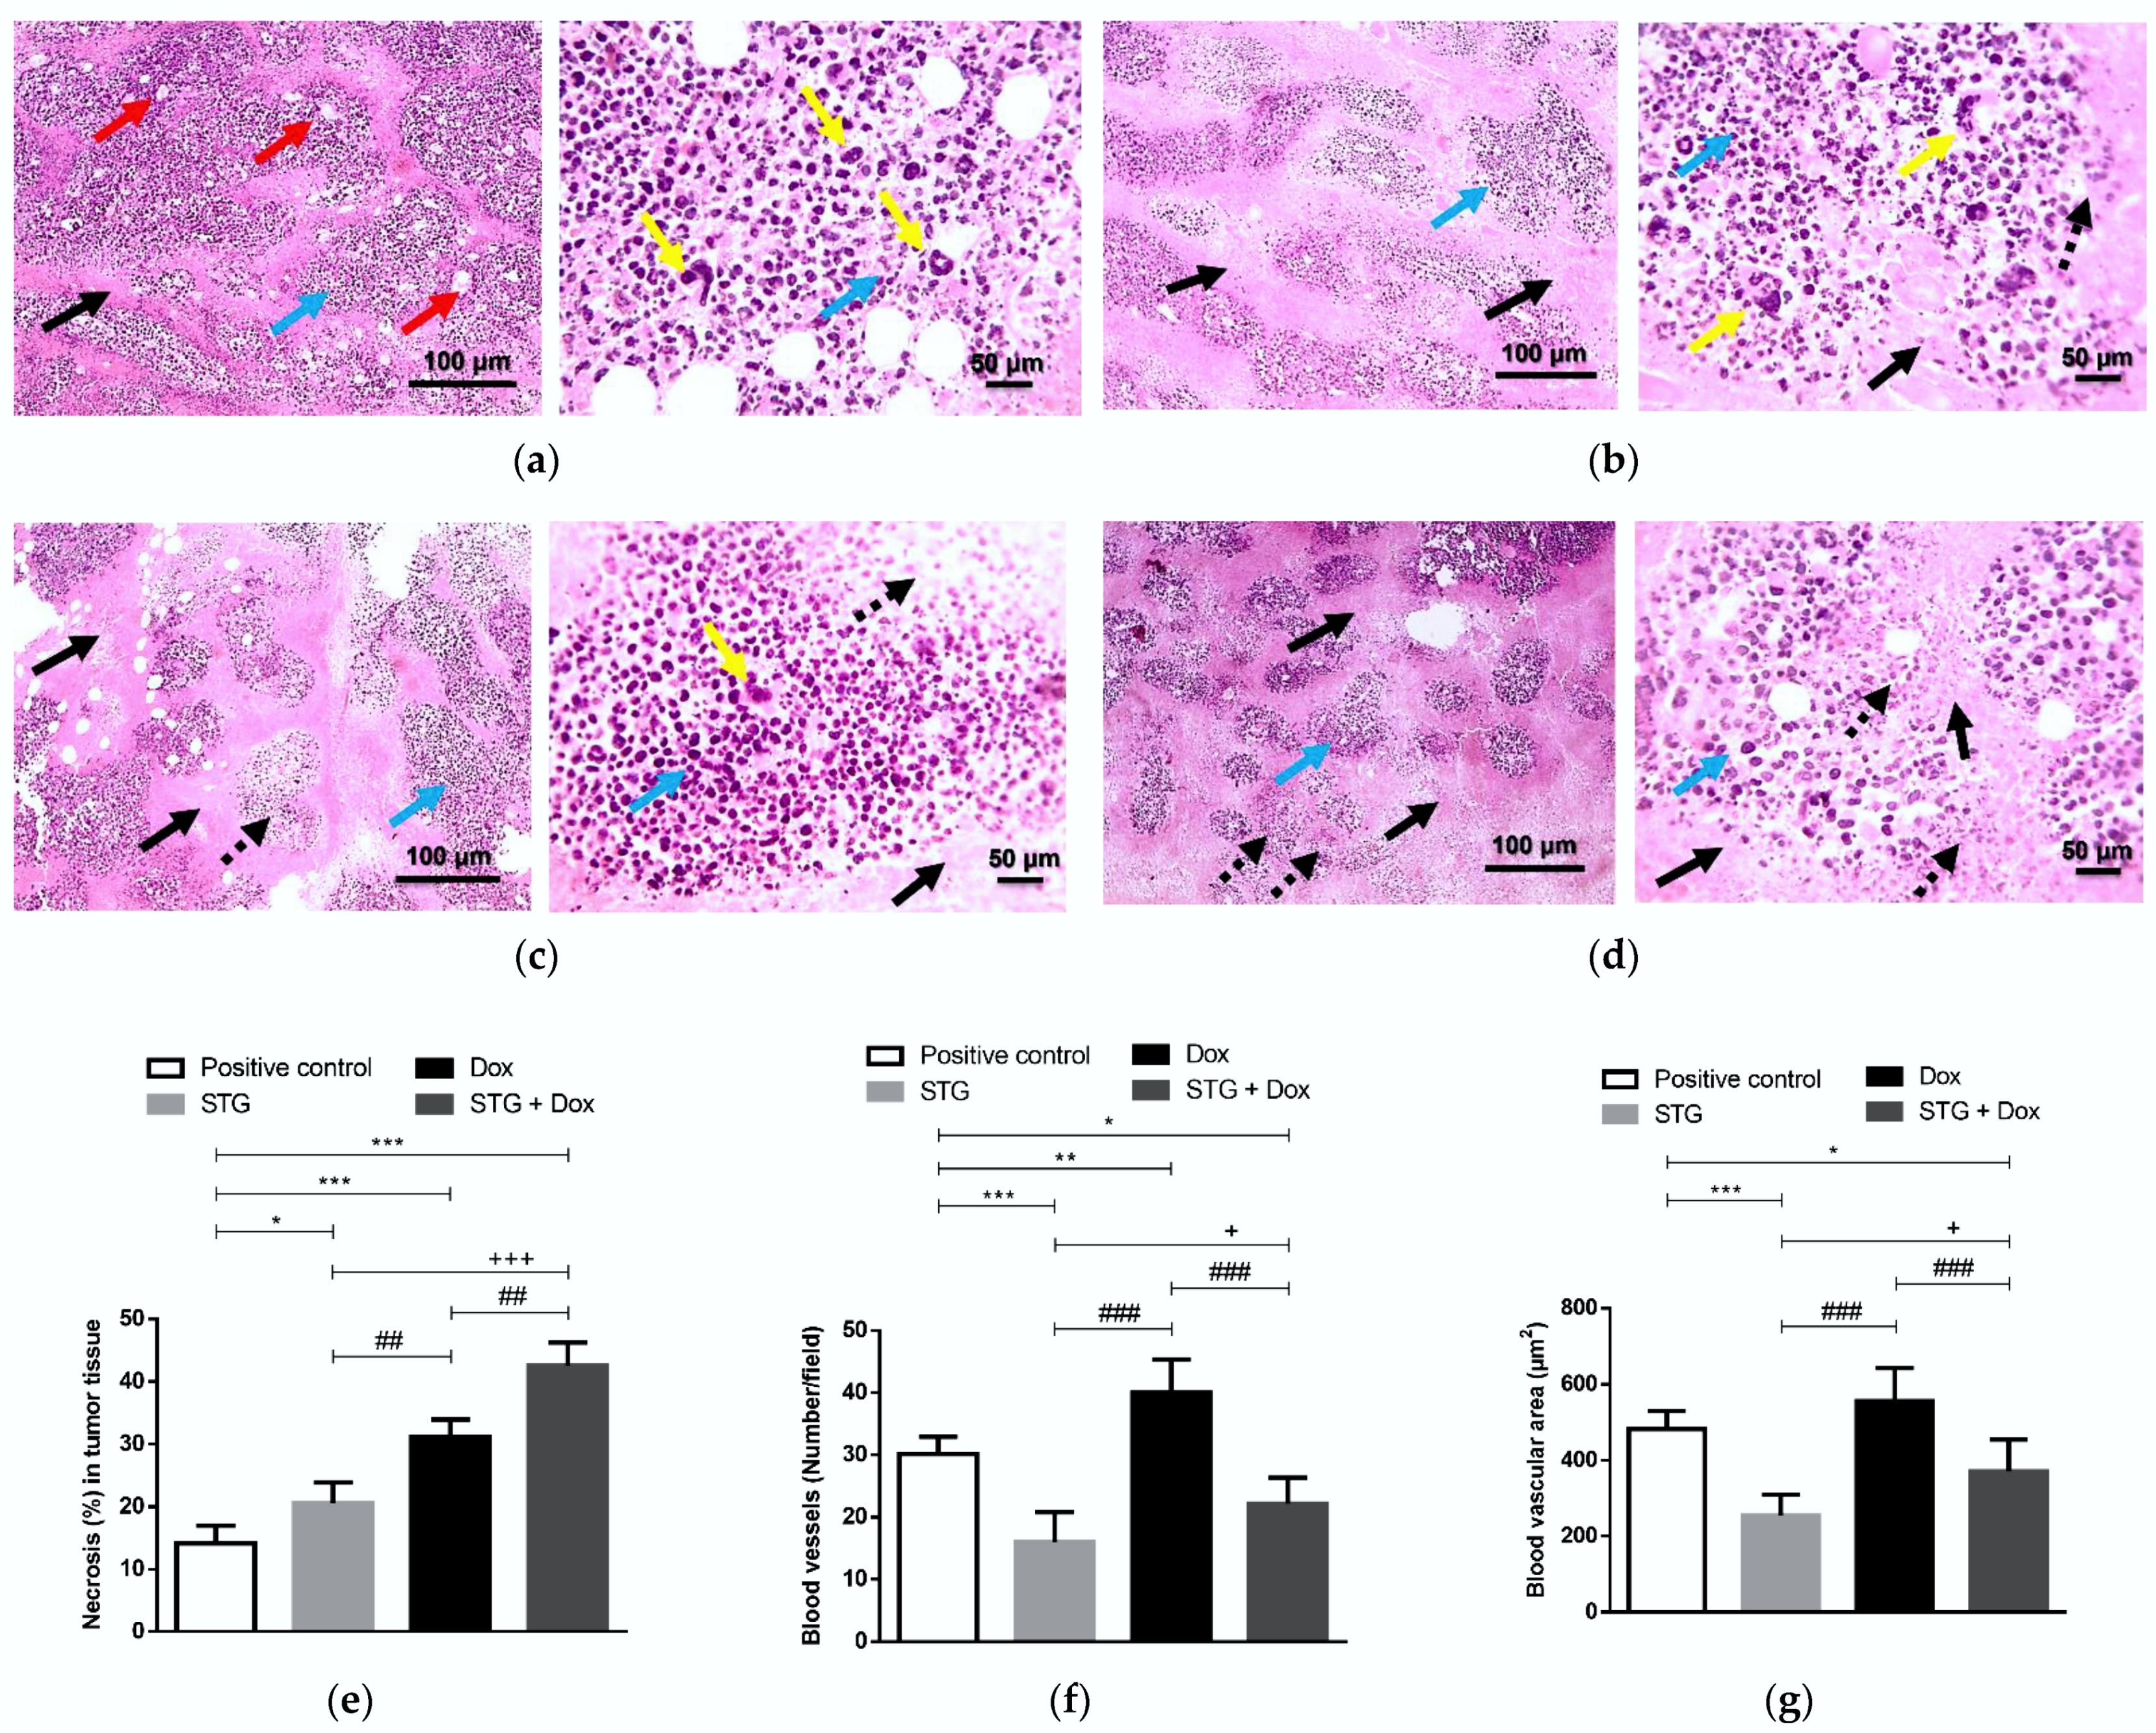
3.3. Effect of Treatment with STG, Dox, and Their Combination on the Tumor Tissue Visualized by the Histopathological Examination

The tumor tissue sections of the positive control group have shown multiple large-sized viable tumor areas consisting of pleomorphic EAC cells with numerous tumor giant cells, surrounded by minimal necrosis with numerous newly formed blood capillaries within the tumor tissue (Figure 4a). Treatment with either STG (Figure 4b) or Dox (Figure 4c) suppressed the tumor growth as indicated by the increased size of the necrotic areas and several ghost cells with fewer numbers of neoplastic and tumor giant cells in the viable areas. Likewise, the co-treatment of STG and Dox showed a more pronounced reduction in the tumor growth than in mono-treated groups (Figure 4d).
The histological scoring revealed a marked increase in the percentage of the necrotic areas in STG- or Dox-treated mice compared to the positive control group (p < 0.05 and <0.001, respectively) (Figure 4e). The increase in the percentage of necrotic areas was more pronounced in the STG + Dox group when compared to the positive control, STG, and Dox groups (p < 0.001, <0.001, and <0.01, respectively). Moreover, a significant decrease in the number of tumor vessels (Figure 4f) and tumor vascular area (Figure 4g) was observed in groups treated with either STG alone or in combination with Dox compared to the positive control group (p < 0.001 and <0.05, respectively). In contrast, Dox-treated group exerted a slight increase in tumor vasculature compared to the positive control group (p < 0.01).

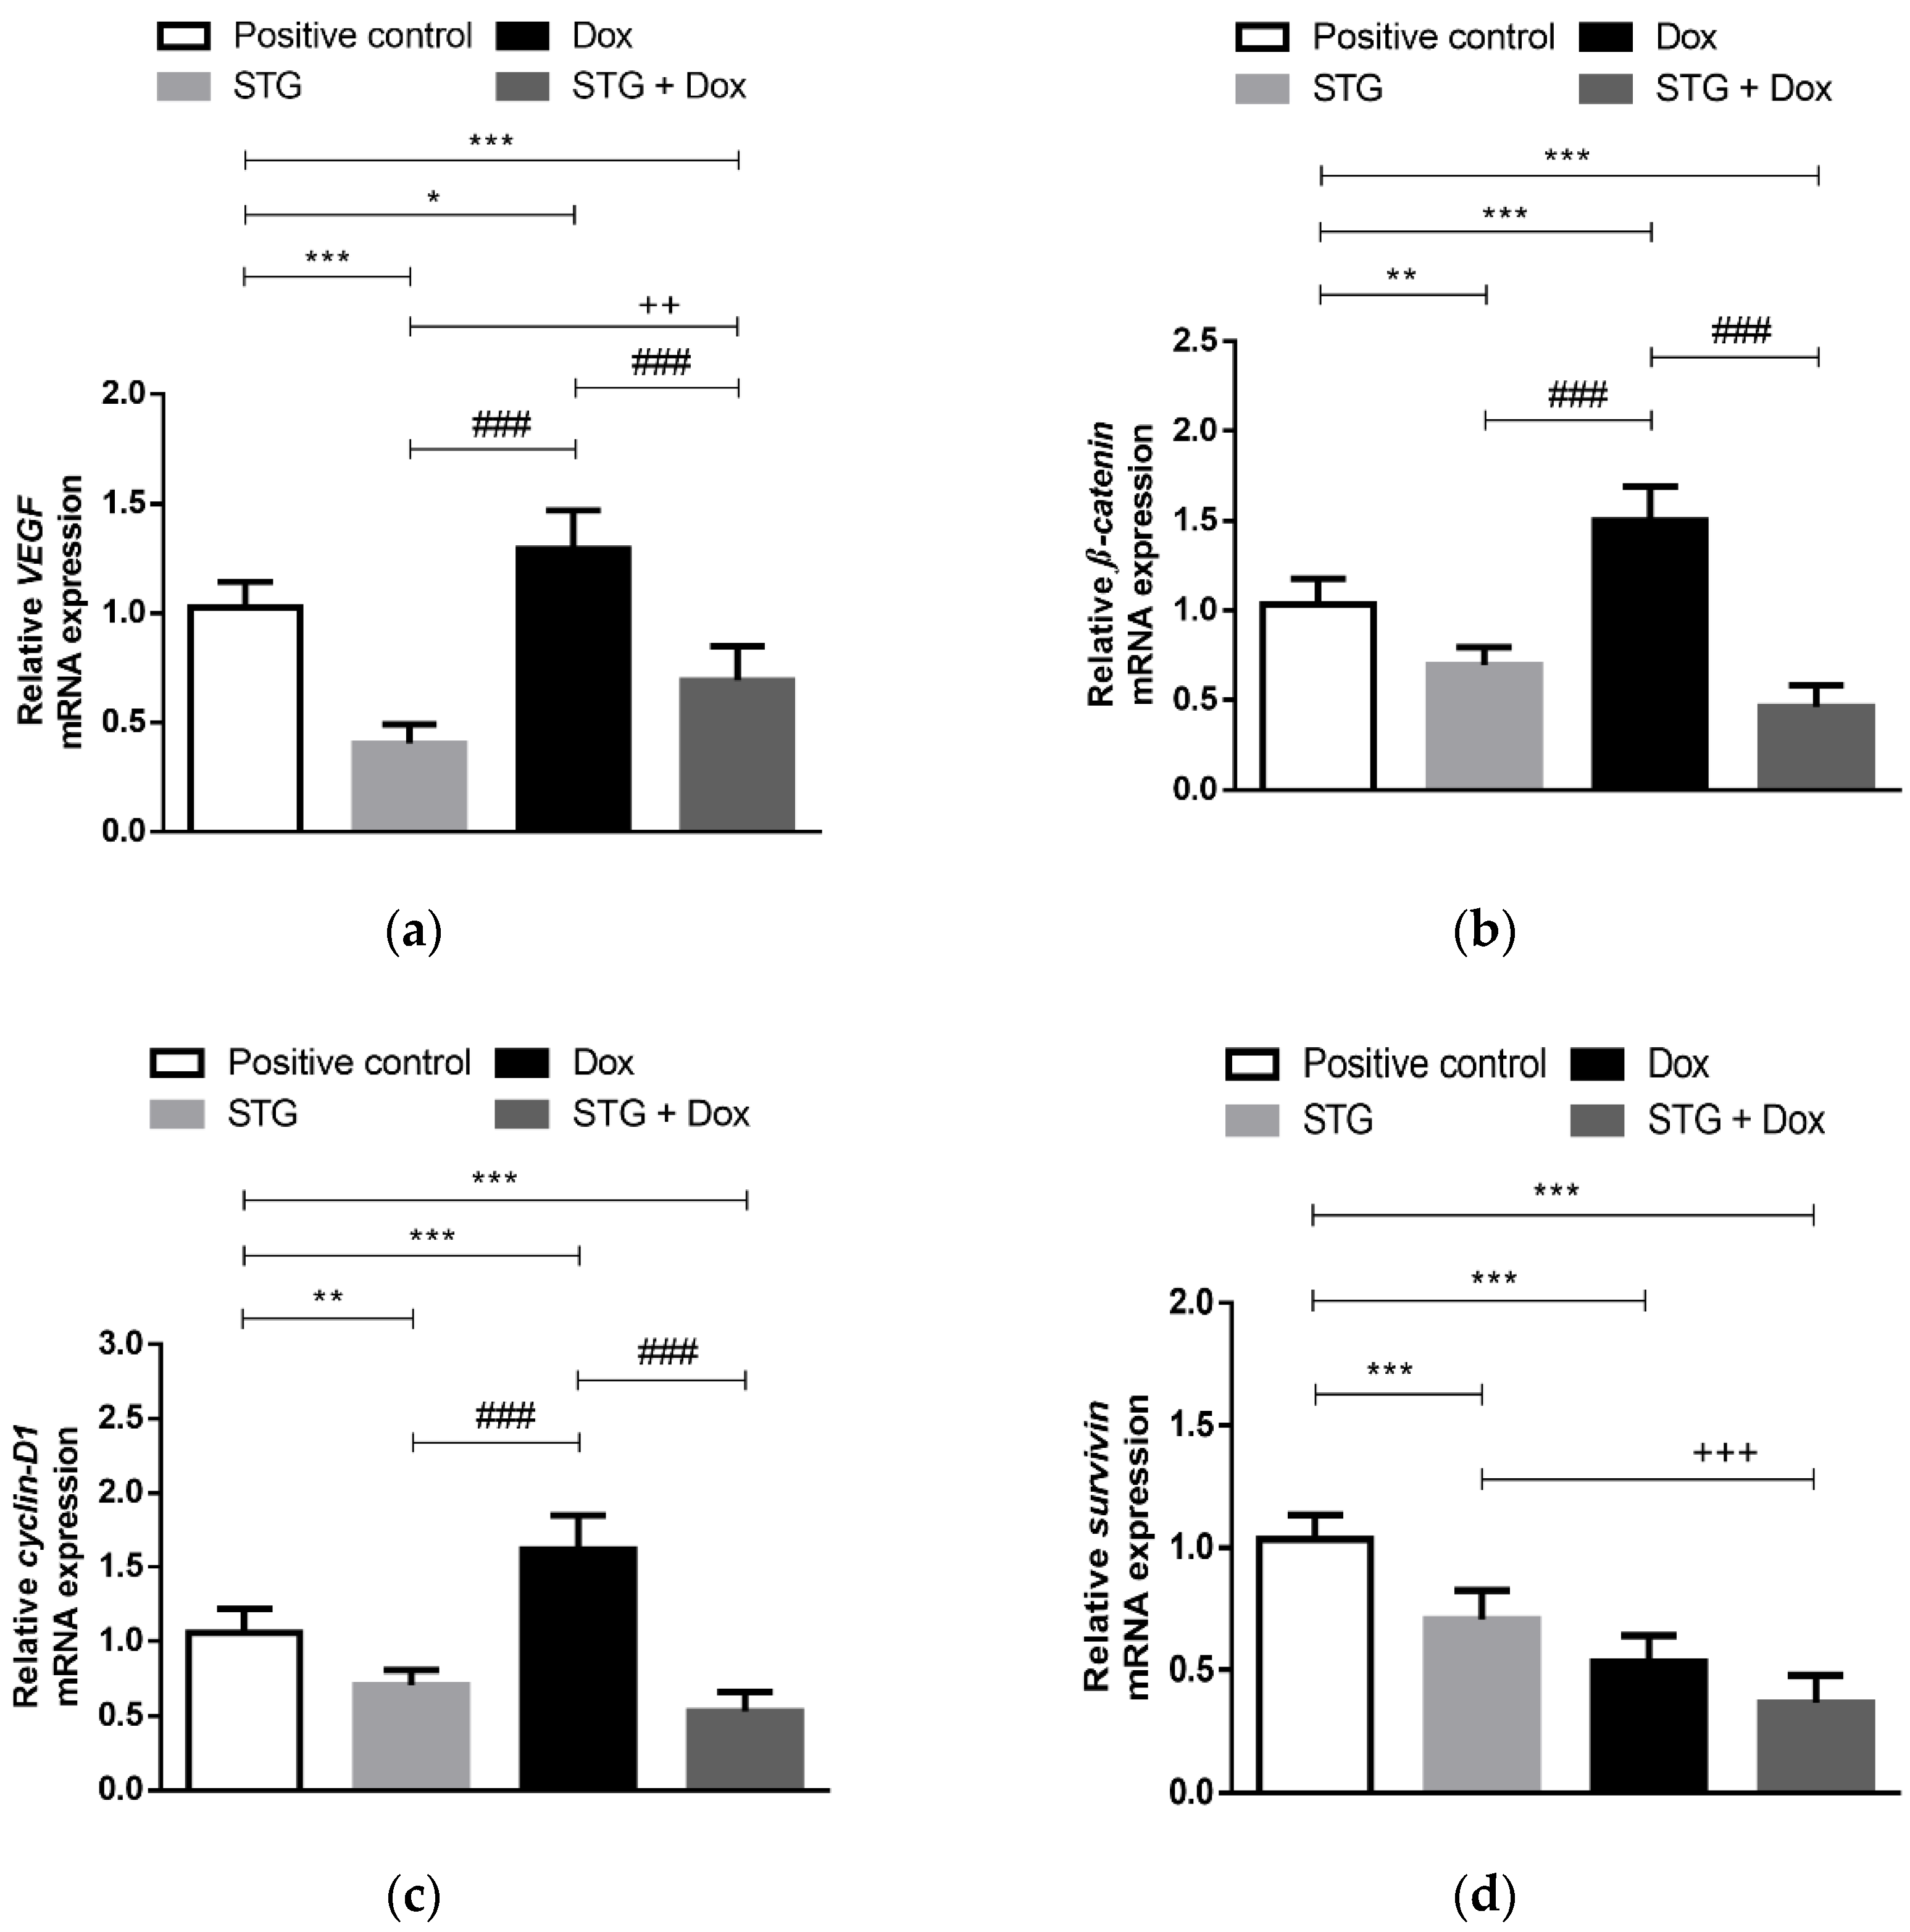
3.4. Effect of Treatment with STG, Dox and Their Combination on the Gene Expression of the Angiogenic Marker, VEGF, and the Oncogenic β-Catenin, Cyclin-D1, and Survivin in EAC Tissues

Consistent with the histopathological observations, VEGF gene expression showed a significant increase in the mice treated with Dox when compared to the positive control group (p < 0.05) (Figure 5a). Groups treated with STG either alone or combined with Dox showed a significant decrease in the gene expression of VEGF when compared to both the positive control (p < 0.001) and Dox-treated groups (p < 0.001).
In order to estimate the proliferative capacity of tumor cells, relative gene expression of β-catenin and cyclin-D1, a target gene induced by β-catenin, was measured in the Ehrlich tumor of the different experimental groups (Figure 5b,c). The treatment with Dox was not able to downregulate these genes, causing their overexpression as compared to the positive control group (p < 0.001). Whereas STG alone or in combination with Dox significantly downregulated their expression when compared to the positive control group (p < 0.01 and <0.001, respectively) and Dox group (p < 0.001).
Survivin, an inhibitor of apoptosis and another targeted gene of β-catenin, was also examined (Figure 5d). A significant decrease in its relative gene expression in all treated groups was detected compared to the positive control group (p < 0.001).

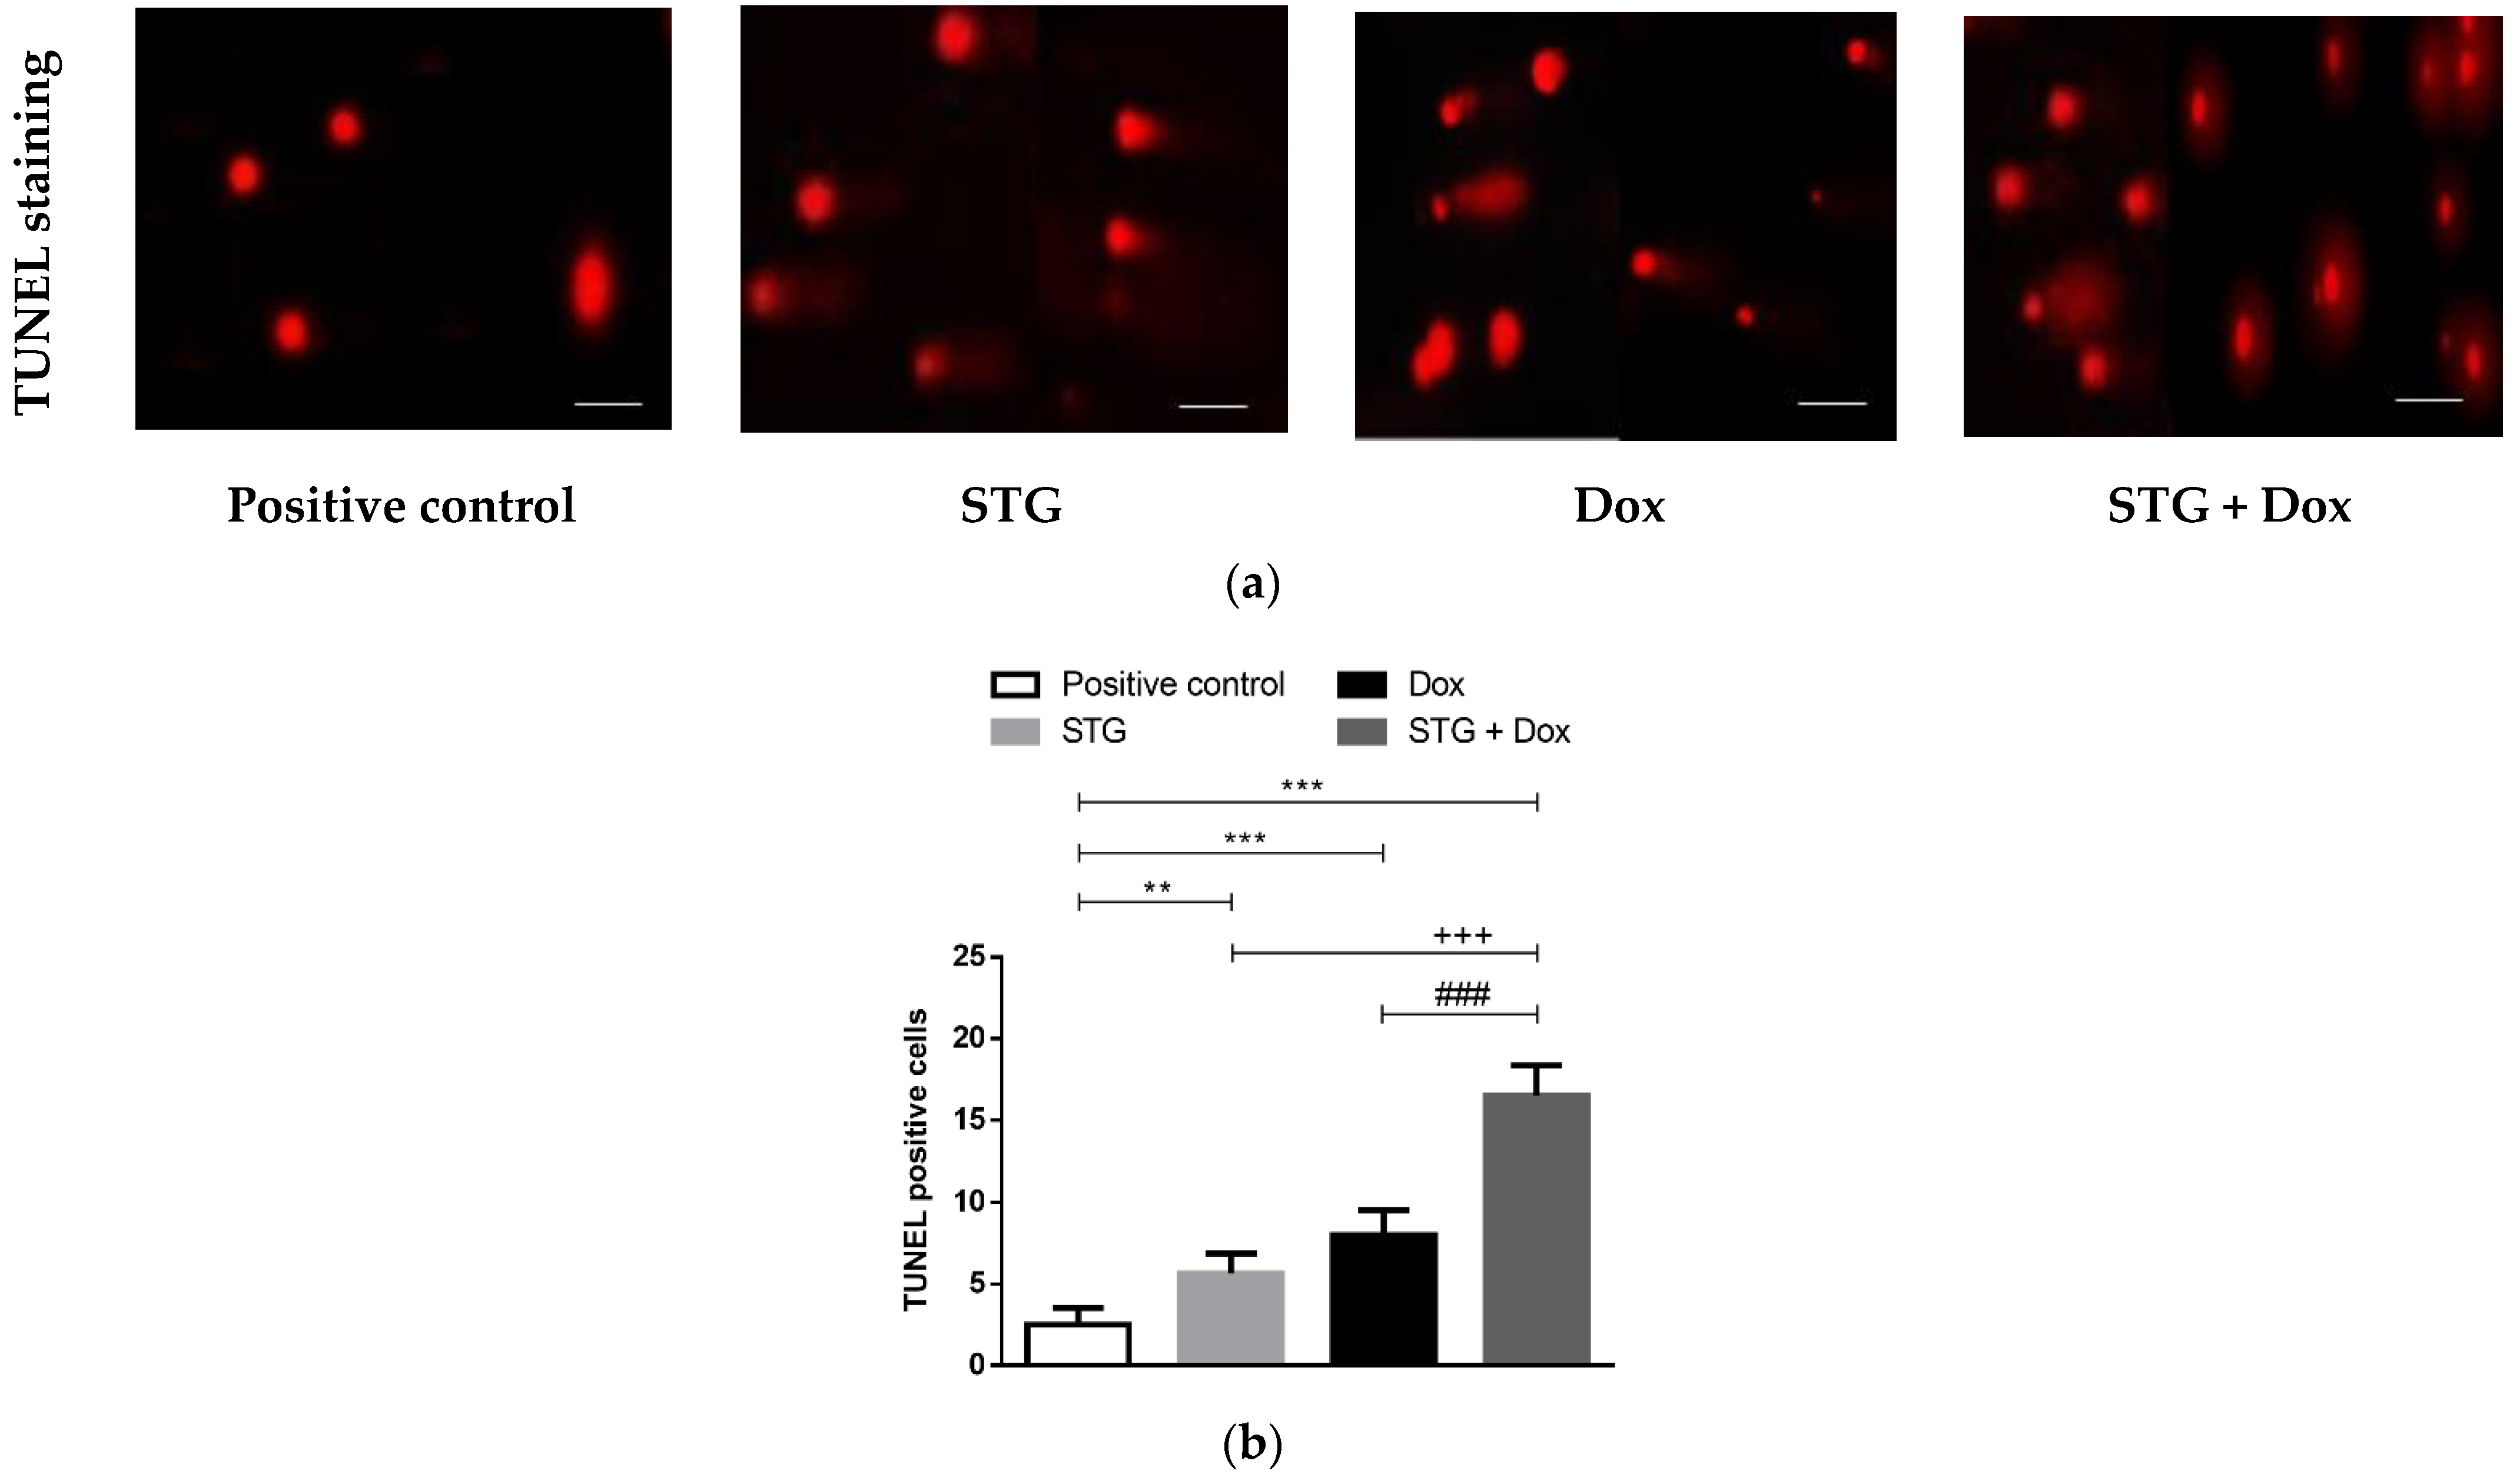
3.5. Effect of Treatment with STG, Dox, and Their Combination on nuclear DNA Fragmentation Illustrated by TUNEL Staining Assay

In the current study, the TUNEL assay was performed to detect nuclear DNA fragmentation, one of the final stages of apoptosis (Figure 6). As apparent, few TUNEL+ cells were observed in the solid tumor tissue of the positive control group. In contrast, treatment with STG or Dox moderately increases the number of TUNEL+ cells compared to the positive control group. The combined treatment of STG and Dox showed a greater increase in the number of TUNEL+ cells when compared to either compound when administered alone. These data indicate the apoptotic effect of STG alone or in combination with Dox was related to the induction of p53 and caspase-3 which could induce subsequent cleavage of nuclear DNA.

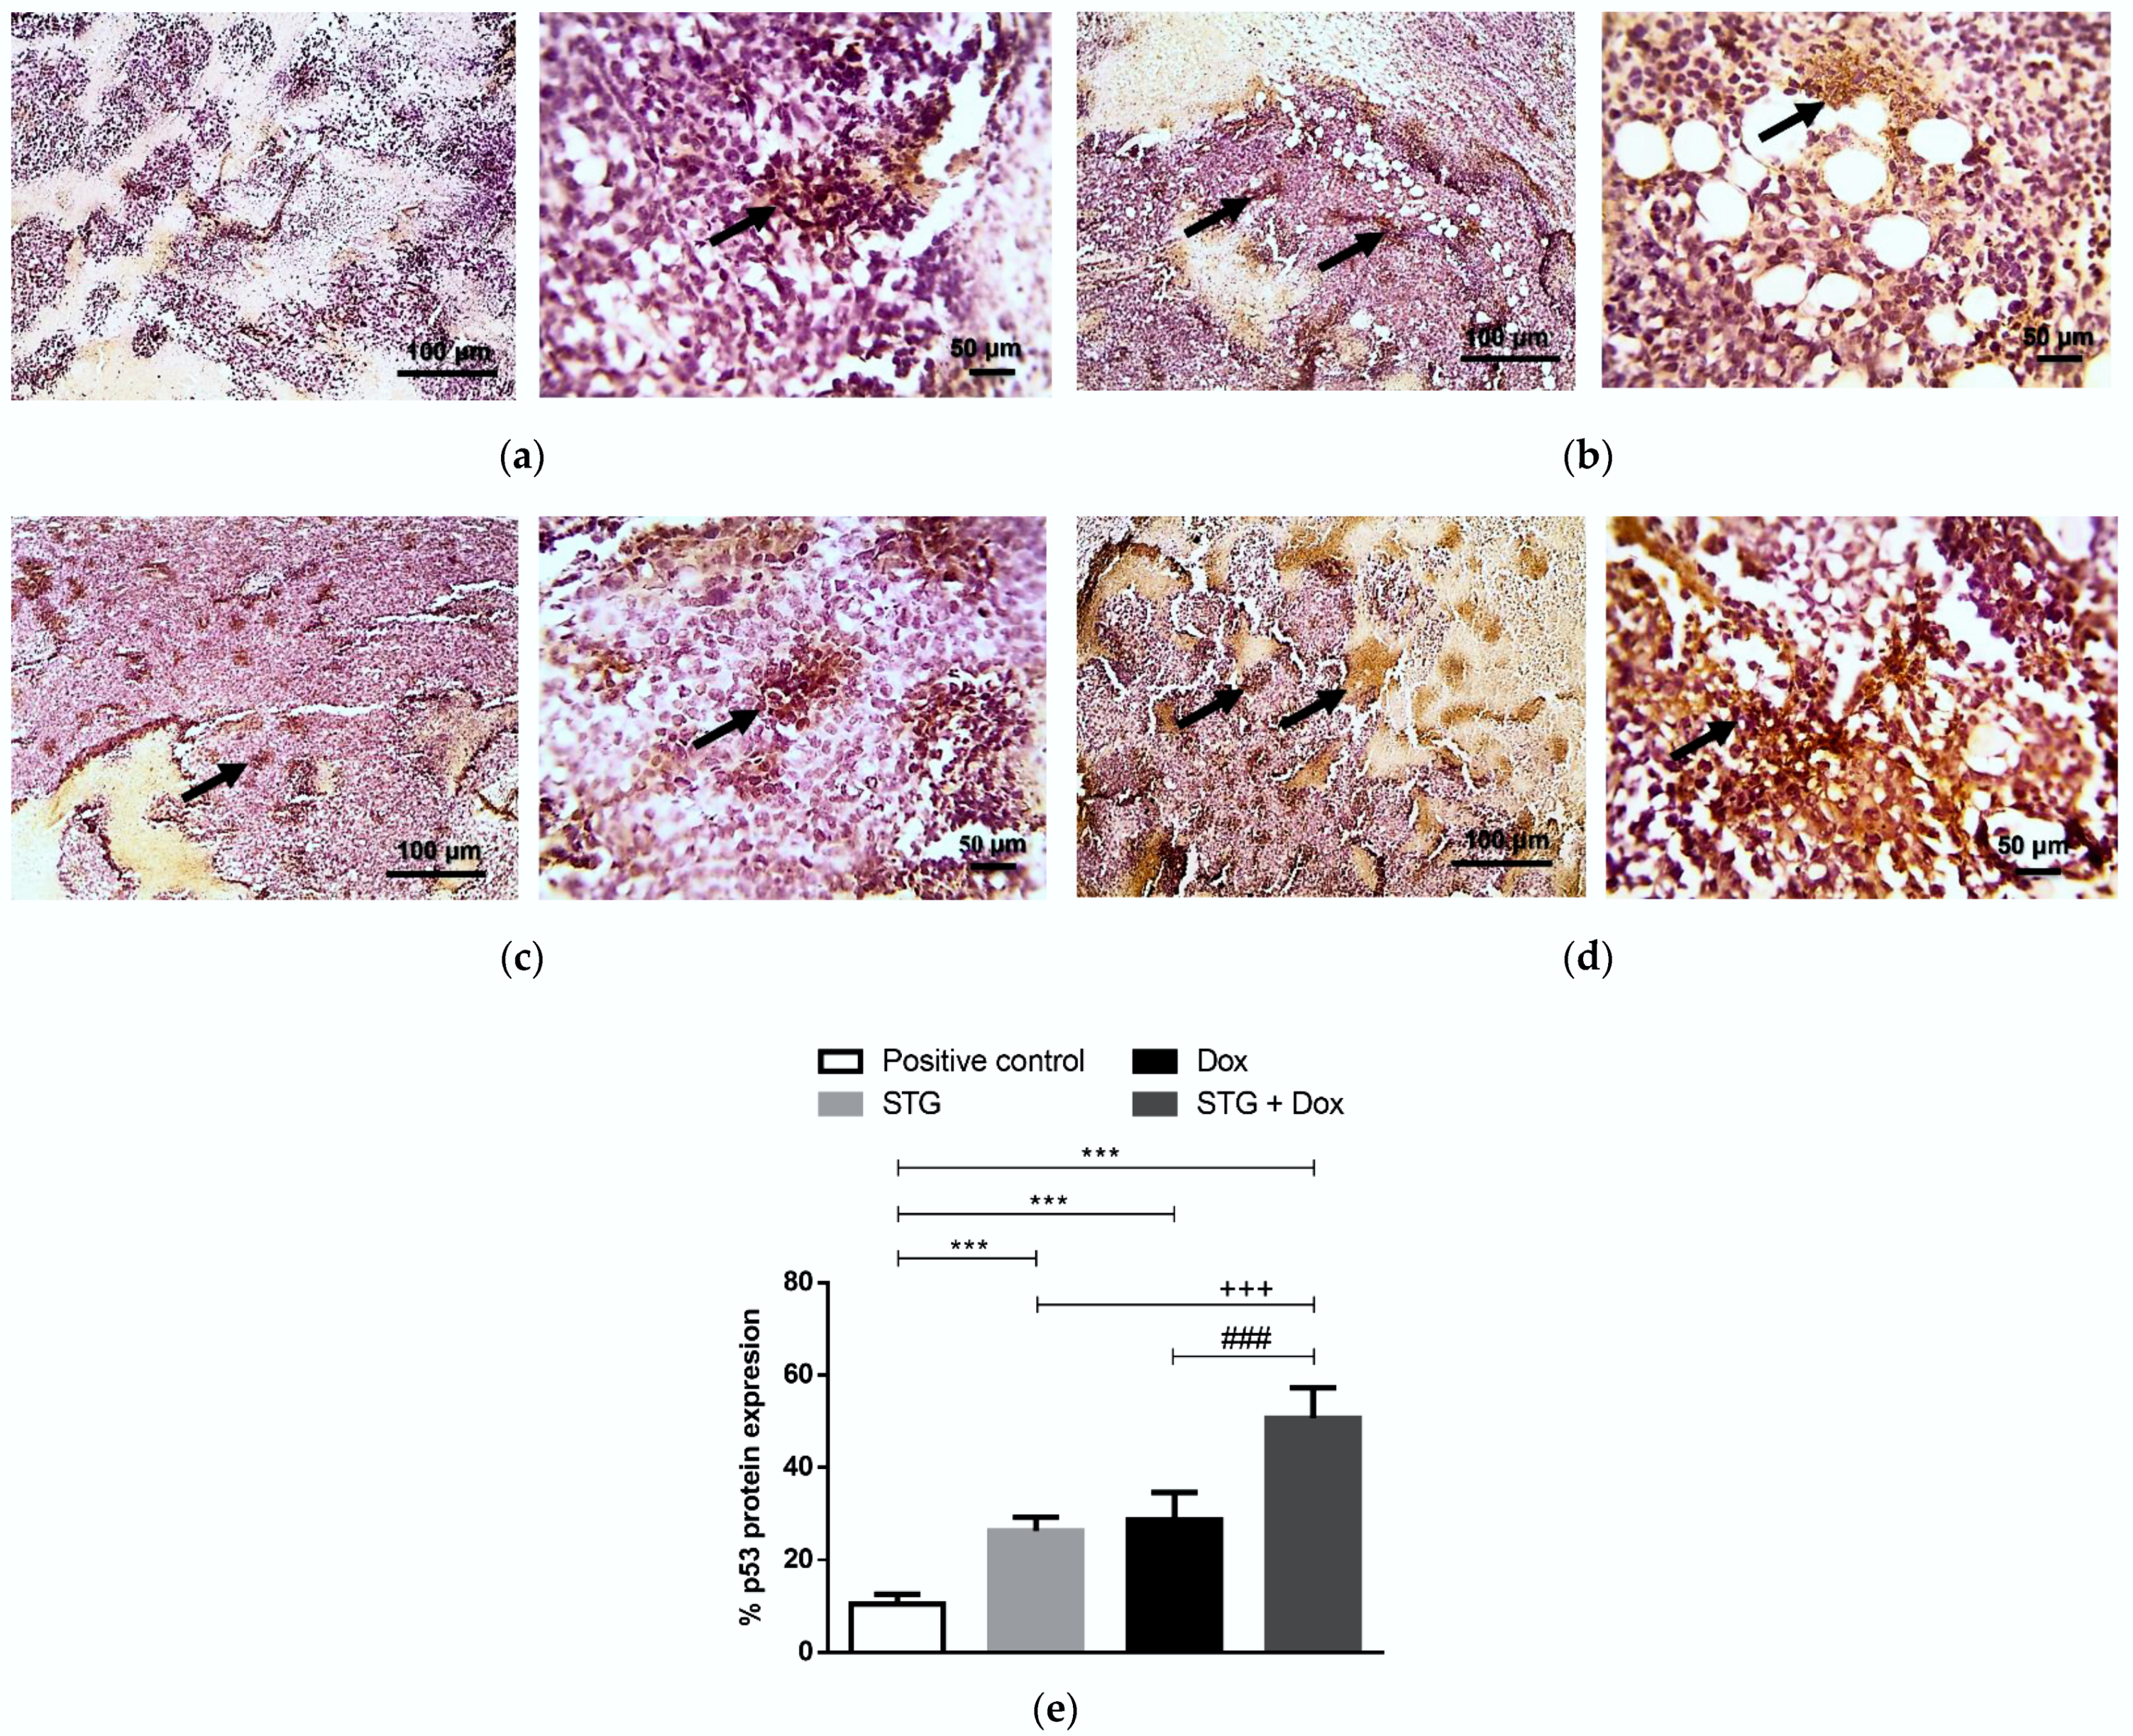
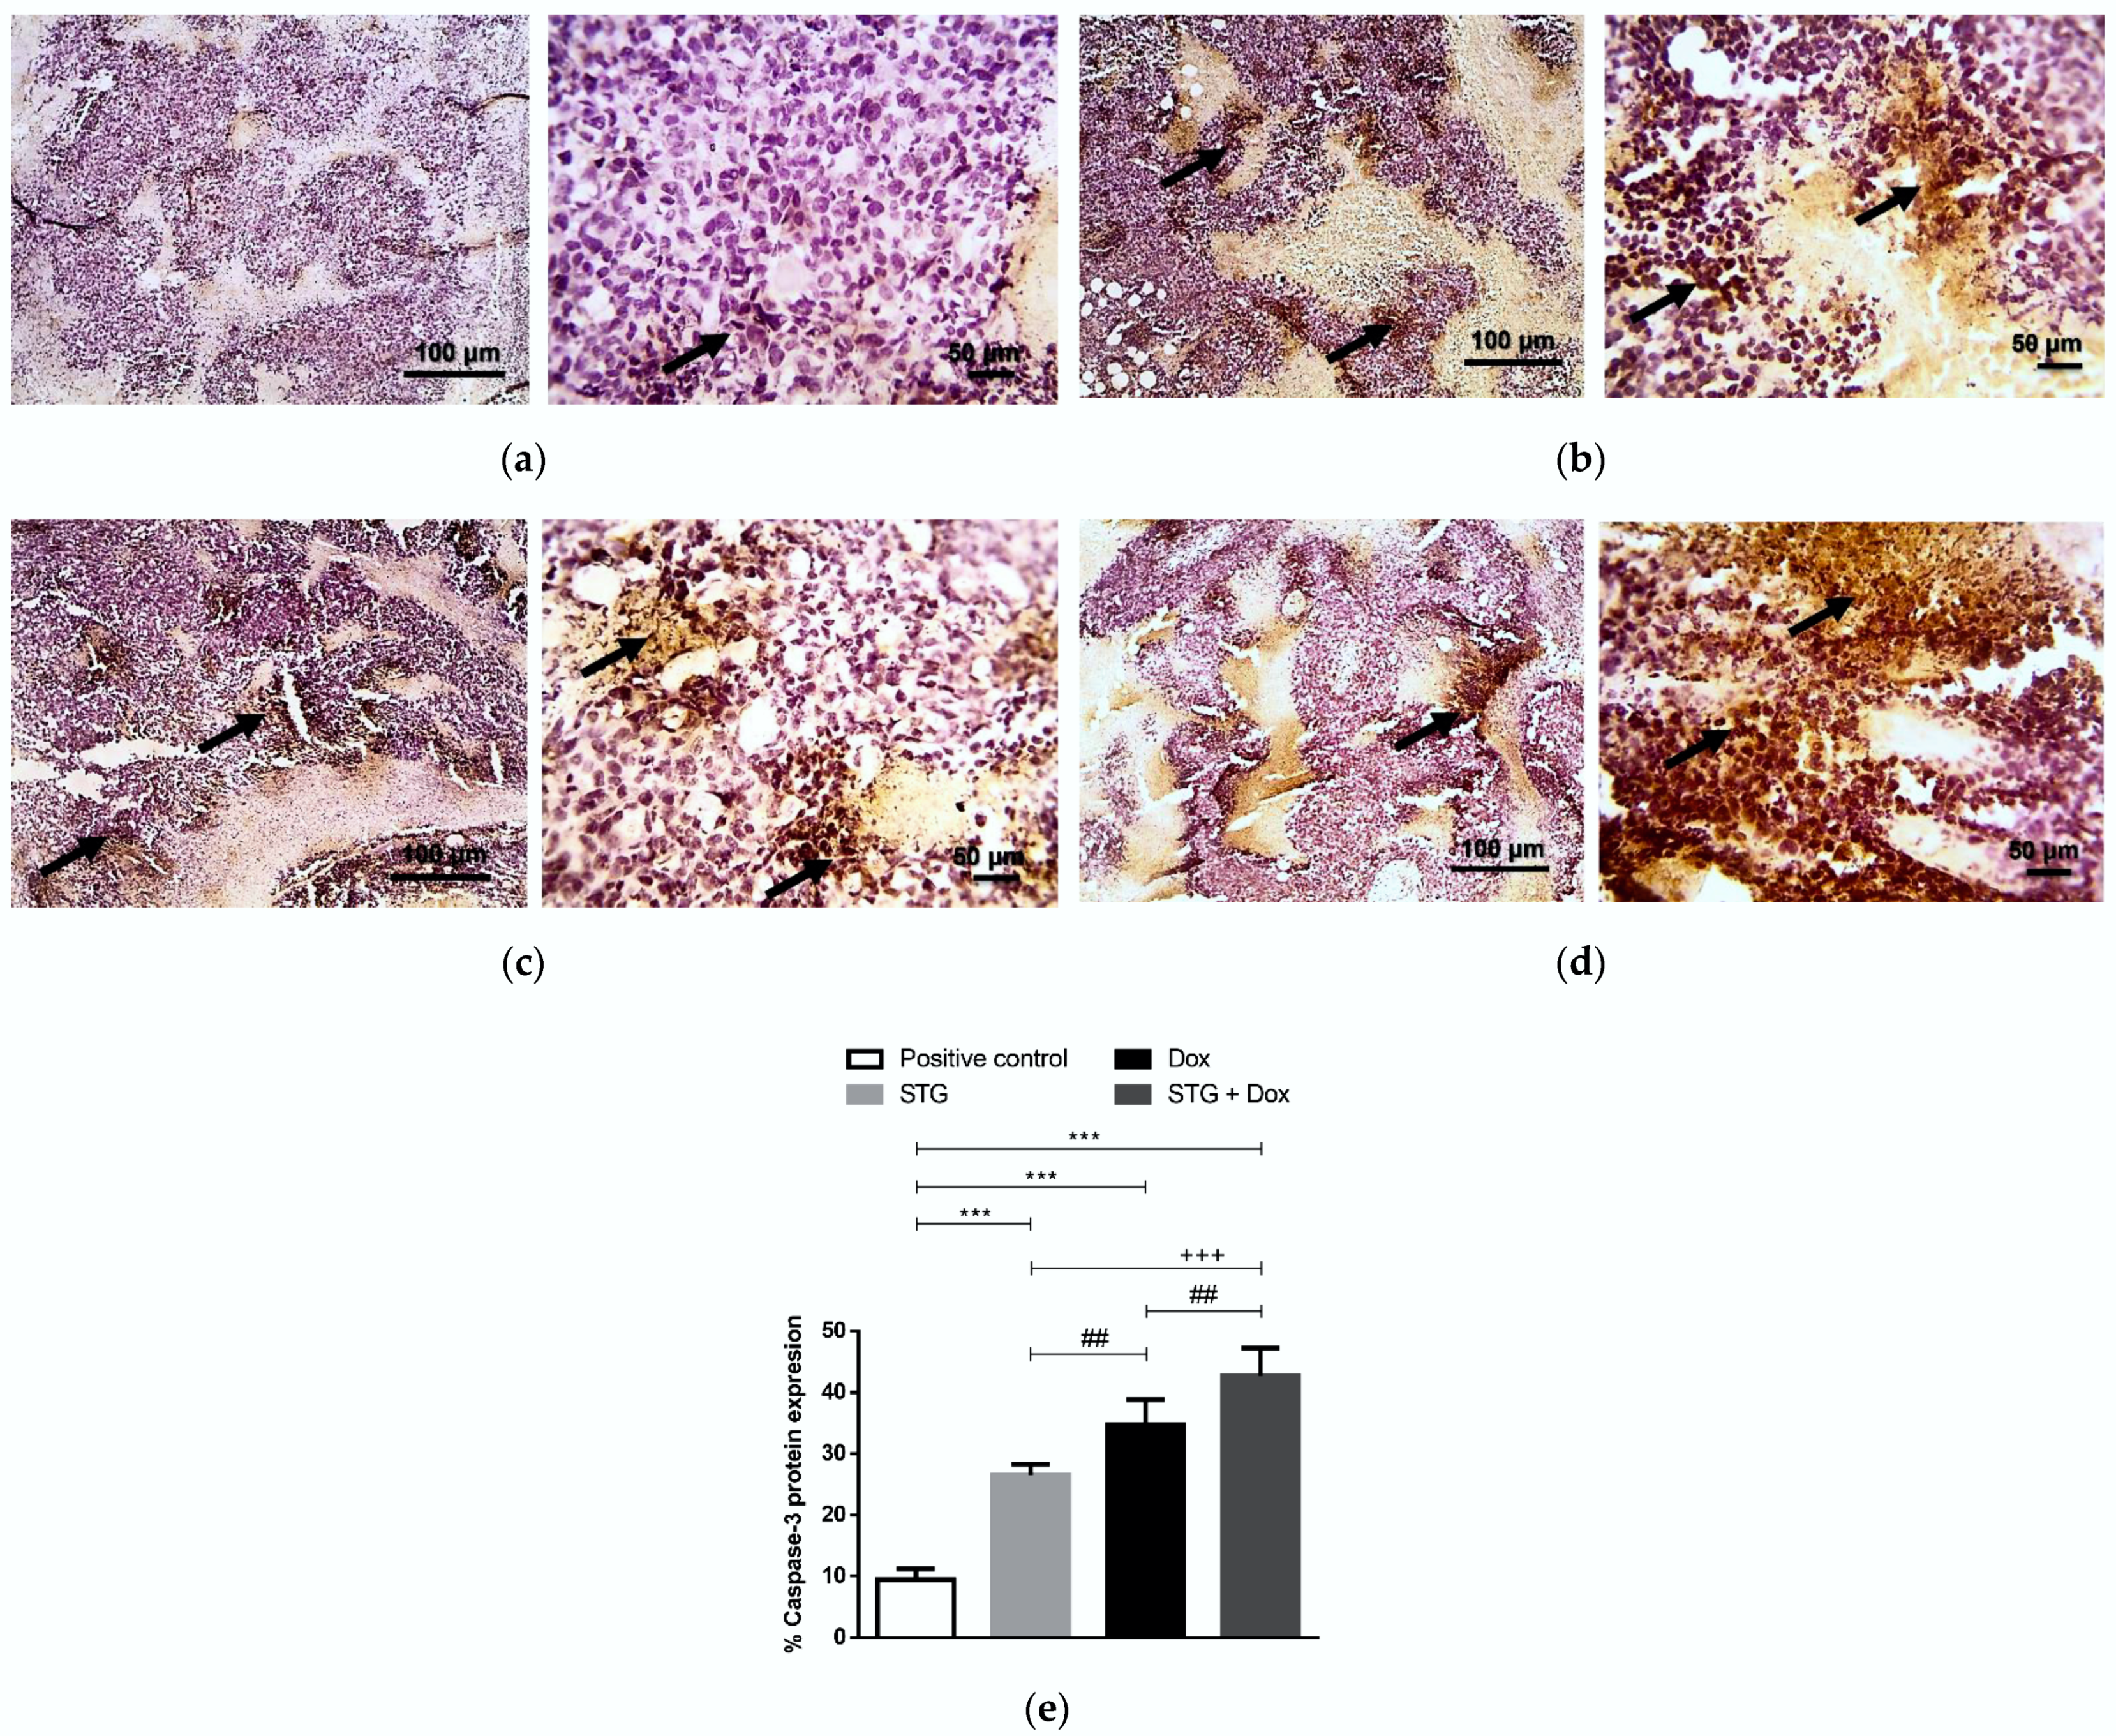
3.6. Effect of Treatment with STG, Dox, and Their Combination on the Protein Levels of Tumor p53 and Caspase-3

The impact of STG and Dox treatment on cell apoptosis was assessed via the intrinsic pathway inducer and the tumor suppressor, p53 (Figure 7), and its effector, activated caspase-3 (Figure 8), by immunohistochemical assessment of the tumor tissues. Stained tumor p53 (Figure 7a) and caspase-3 (Figure 8a) demonstrated low expression in the solid tumor tissue of the positive control group. In contrast, treatment with STG (Figure 7b) or Dox (Figure 7c) up-regulated p53 protein when compared with the positive control group. Similarly, the protein level of activated caspase-3 was also enhanced by treatment with STG (Figure 8b) or Dox (Figure 8c). The combined treatment of STG and Dox exhibited a more superior apoptotic effect compared to either compound when administered alone, shown by higher p53 (Figure 7d) and caspase-3 (Figure 8d).

4. Discussion

Numerous side effects have been associated with different chemotherapeutic agents, including anthracycline antibiotics, like Dox. As a result, a continuous search has become necessary for safer and more effective anti-cancer compounds, as a successful approach to combat cancer, either alone or in combination with typical chemotherapy, radiation, and/or surgery [25]. The current study aimed to evaluate the potential anti-tumor activity of STG in ESC-bearing mice. ESC was used as an in-vivo experimental model for breast cancer as its cells are known for their undifferentiation with rapid proliferation and sensitivity to chemotherapies, similar to human tumors [26]. Moreover, we combined STG with Dox to investigate the impact of the combination on its anti-tumor efficacy and the associated inflammatory reaction and oxidative imbalance present in the tumor micro-environment.
Monitoring the tumor volume of the ESC-bearing mice, during the 21 days of the study, revealed the anti-tumor effect of orally administered STG (20 mg/kg/day), alone or in combination with Dox. Interestingly, there was no significant difference in reducing the volume of the tumor between STG and Dox. However, by combining both, the tumor volume was significantly reduced than if Dox or STG were used alone. The potency of STG was further confirmed by the histopathological findings, which demonstrated suppression of tumor growth as indicated by the increase of necrotic areas. To explore the impact of STG on the tumor microenvironment; oxidative stress, inflammation, angiogenesis, and apoptosis were studied.
Oxidative stress is the result of excessive production of reactive oxygen species (ROS), which causes mitochondrial dysfunction with subsequent initiation of apoptosis [27]. Dox, a widely used chemotherapy for treating cancer, has a short-lived toxic metabolite that interacts with molecular oxygen with the initiation of a cascade of reactions to generate ROS and relies primarily on oxidative stress to trigger DNA damage, senescence, and tumor cell death [28]. However, high levels of ROS are also responsible for its cytotoxic side effects [29]. Therefore, combining Dox has been considered with other compounds with antioxidant and anti-inflammatory properties to diminish toxicity without affecting its anti-cancer effect.
To assess oxidative stress, MDA, as a marker of lipid peroxidation, and GSH, as an antioxidant molecule, were measured. MDA content in mice receiving STG was significantly decreased, unlike GSH content which was significantly increased as compared to the positive control group. Our results are consistent with several studies showing the potential antioxidant effect of STG in other experimental models including diabetic nephropathy [30] and Alzheimer’s disease [31]. As expected, treatment of ESC with Dox showed a significant increase in MDA level, indicating a worsening of the oxidative balance, even when sparing the reduced GSH content, compared to the untreated ESC mice. By combining STG with Dox, MDA content was significantly reduced as compared to both the positive control and Dox-treated group. Also, more replenishment of the reduced GSH molecules was obtained indicating a somewhat recovery from the oxidative imbalance. The antioxidant effect of STG could be attributed to its ability to enhance the activity of nuclear factor erythroid 2-related factor 2 (Nrf2), an inducer of a variety of antioxidant enzymes [31], which are known to be decreased during Dox treatment [32].
Oxidative stress has been critically considered a trigger of inflammation; leading to tumor cell survival, proliferation, invasion, and angiogenesis [33]. Two inflammatory mediators, IL-1β and IL-6, with significant impact on tumor progression have been evaluated [34,35]. Our data revealed an opposing effect between STG and Dox mono-treatments regarding tumor levels of these inflammatory cytokines. On one hand, STG significantly decreased both, while Dox significantly increased them when compared to the positive control group. Several studies have demonstrated that Dox induces pathways controlling the production of downstream pro-inflammatory cytokines that includes IL-6 and IL-1β which subsequently leads to therapeutic resistance and toxicity [36,37,38]. The produced IL-6 has been found to regulate nearly all the hallmarks of cancer, such as inhibition of apoptosis, promotion of survival, proliferation, angiogenesis, invasiveness, and metastasis [34]. In contrast, STG has been reported to decrease the expression of IL-6 and IL-1β through the suppression of ROS [39]. Consequently, combining STG with Dox has overturned the Dox-associated inflammation. These findings suggest not only the potential cytotoxic effect of this combination on the tumor cells but also the minimization of probable Dox-induced toxicity resulting from aggravation of both oxidative stress and inflammation.
Another process that we investigated is ESC-reported angiogenesis. Our results revealed a significant increase in tumor angiogenesis and VEGF gene expression in Dox-treated ESC-bearing mice when compared to the positive control group, a setback to Dox as an anti-cancer agent. This finding has been previously reported, indicating the positive effect of Dox on upregulating hypoxia-inducing factor-1α in tumor cells. Hypoxia-inducing factor-1α is known to increase VEGF expression and stimulate tumor angiogenesis in return [40]. In addition, cytokines as IL-6 and IL-1β, highly produced with Dox treatment, contribute to cancer dissemination and invasion through stimulation of VEGF synthesis and neo-angiogenesis [35,41]. By combining STG with Dox, we have found a significant downregulation of VEGF gene expression, which may be attributed to the ability of STG to regulate tumor inflammation and thereby downregulated angiogenesis and VEGF gene expression. Moreover, DPP-4, a glycoprotein expressed in various tissues and selectively inhibited by STG, has been suggested to stimulate tumorigenesis and invasion through activating hypoxia-inducing factor-1α/VEGF signaling [42].
The signaling pathway of Wnt/β-catenin is a key pathway in multiple aspects of cellular processes, including cell proliferation, differentiation, and morphogenesis. It has been associated with tumor aggressiveness and uncontrolled proliferation [43]. β-catenin regulates the expression of a considerable number of oncogenes, such as c-myc and cyclin-D1, both acting as important checkpoint regulators of the G1 phase [44,45].
To the best of our knowledge, our results revealed, for the first time, the possible anti-neoplastic effect of STG through the downregulation of the expression of β-catenin and, subsequently, cyclin-D1. This may be attributed to the anti-inflammatory effect of STG since inflammation induces the activation of the Wnt/β-catenin pathway [46]. In addition, STG-induced reduction of IL-6 may have attenuated pathways, such as signal transducer and activator of transcription-3 (STAT3) signaling, which in turn, downregulated cyclin-D1 and ultimately arrests the tumor cells at the G1/G0 phase [34]. Moreover, DPP-4 upregulates cyclin-D1 [10], suggesting that DPP-4 inhibition by STG could be a strategy for the treatment of patients with breast cancer by hindering cell proliferation.
However, when ESC-bearing mice were treated with Dox alone, a significant increase in β-catenin and cyclin-D1 gene expression was found. The acquired chemoresistance of chemotherapeutic drugs, such as Dox, has been associated with the activation of Wnt/β-catenin signaling and the upregulation of its target genes, such as cyclin-D1 [47,48]. An increase in cyclin-D1 has been found in Dox-resistant HL-60 cells [49]. Fortunately, compared to Dox alone, the combination of STG with Dox showed a greater inhibitory effect on the expression of both β-catenin and cyclin-D1, enhancing Dox’s chemotherapeutic effect.
Of the mechanisms by which cancer cells thrive is the suppression of apoptosis by manipulating the balance between the pro- and anti-apoptotic proteins. Effective anti-cancer treatments stimulate the apoptotic pathways, mediated mainly by p53 and the caspases to eradicate cancer cells [50]. Regarding the present study, either STG or Dox was able to remarkably upregulate the expression of pro-apoptotic proteins, p53 and caspase-3, while downregulating the gene expression of the anti-apoptotic protein, survivin. The highest apoptotic effect was obtained in the co-treated group which could reflect the efficacy of such a combination. These results are consistent with the ability of STG to suppress IL6/signal transducer and activator of transcription-3 signaling, with the subsequent inhibition of survivin production and the upregulation of p53-mediated apoptosis [34,51]. Furthermore, by downregulating β-catenin, STG has decreased the expression of survivin, a downstream target gene of the Wnt/β-catenin signaling pathway [52]. However, Dox induces apoptosis by generating high levels of ROS in tumor cells leading to lipid peroxidation, DNA damage, and the trigger of apoptosis [28]. Beside the apoptotic effect of STG, several studies reported its impact in halting some of the Dox-induced multiple organ toxicity including cardiotoxicity [53,54,55] and nephrotoxicity [56].

5. Conclusions

Our results suggest STG as a potential anti-cancer agent in the ESC experimental model. Various mechanisms have been proposed for such potential, including modulation of oxidative stress, suppression of inflammation, inhibition of angiogenesis, and canonical β-catenin-induction of cell proliferation, as well as induction of tumor apoptosis. In addition, the study also opened a new perspective of combining STG with other established chemotherapeutic agents, such as Dox, in breast cancer patients to achieve a more effective anti-cancer therapeutic regimen, while minimizing chemotherapy toxicity and drug resistance. However, more future studies should be conducted to assess the impact of STG on other types of experimental cancer models and further investigate its potential implications on metastasis.

Author Contributions

Conceptualization, R.A.Z. and M.M.E.-S.; methodology, M.M.S., R.A.Z., R.M.K. and M.M.E.-S.; formal analysis, M.M.S.; investigation, M.M.S.; resources, M.M.S.; data curation, M.M.S.; writing—original draft preparation, M.M.S.; writing—review and editing, R.A.Z., R.M.K. and M.M.E.-S.; supervision, R.A.Z., R.M.K. and M.M.E.-S.; project administration, M.M.E.-S.; funding acquisition, M.M.S. All authors have read and agreed to the published version of the manuscript.

Funding

This research received no external funding.

Institutional Review Board Statement

The animal study protocol was approved by the Ethics Committee of Faculty of Pharmacy, Mansoura University, Mansoura, Egypt (protocol code: 2021-387 and date of approval: 28 November 2021).

Informed Consent Statement

Not applicable.

Data Availability Statement

All data generated during this research are presented in the manuscript.

Conflicts of Interest

The authors declare no conflict of interest.

References

  1. Sung, H.; Ferlay, J.; Siegel, R.L.; Laversanne, M.; Soerjomataram, I.; Jemal, A.; Bray, F. Global Cancer Statistics 2020: GLOBOCAN Estimates of Incidence and Mortality Worldwide for 36 Cancers in 185 Countries. CA Cancer J. Clin. 2021, 71, 209–249. [Google Scholar] [CrossRef] [PubMed]
  2. Feitosa, I.B.; Mori, B.; Teles, C.B.G.; da Costa, A.G. What are the immune responses during the growth of Ehrlich’s tumor in ascitic and solid form? Life Sci. 2020, 264, 118578. [Google Scholar] [CrossRef] [PubMed]
  3. Bailly, C.; Thuru, X.; Quesnel, B. Combined cytotoxic chemotherapy and immunotherapy of cancer: Modern times. NAR Cancer 2020, 2, zcaa002. [Google Scholar] [CrossRef] [PubMed] [Green Version]
  4. Podyacheva, E.Y.; Kushnareva, E.A.; Karpov, A.A.; Toropova, Y.G. Analysis of Models of Doxorubicin-Induced Cardiomyopathy in Rats and Mice. A Modern View from the Perspective of the Pathophysiologist and the Clinician. Front. Pharmacol. 2021, 12, 670479. [Google Scholar] [CrossRef]
  5. Christowitz, C.; Davis, T.; Isaacs, A.; van Niekerk, G.; Hattingh, S.; Engelbrecht, A.-M. Mechanisms of doxorubicin-induced drug resistance and drug resistant tumour growth in a murine breast tumour model. BMC Cancer 2019, 19, 757. [Google Scholar] [CrossRef] [Green Version]
  6. Mentoor, I.; Engelbrecht, A.-M.; van Jaarsveld, P.J.; Nell, T. Chemoresistance: Intricate Interplay between Breast Tumor Cells and Adipocytes in the Tumor Microenvironment. Front. Endocrinol. 2018, 9, 758. [Google Scholar] [CrossRef] [Green Version]
  7. Ji, X.; Lu, Y.; Tian, H.; Meng, X.; Wei, M.; Cho, W.C. Chemoresistance mechanisms of breast cancer and their countermeasures. Biomed. Pharmacother. 2019, 114, 108800. [Google Scholar] [CrossRef]
  8. Majidpoor, J.; Mortezaee, K. Angiogenesis as a hallmark of solid tumors—Clinical perspectives. Cell Oncol. 2021, 44, 715–737. [Google Scholar] [CrossRef]
  9. Yazbeck, R.; Jaenisch, S.E.; Abbott, C.A. Dipeptidyl peptidase 4 inhibitors: Applications in innate immunity? Biochem. Pharmacol. 2021, 188, 114517. [Google Scholar] [CrossRef]
  10. Choi, H.J.; Kim, J.Y.; Lim, S.C.; Kim, G.; Yun, H.J.; Choi, H.S. Dipeptidyl peptidase 4 promotes epithelial cell transformation and breast tumourigenesis via induction of PIN1 gene expression. Br. J. Pharmacol. 2015, 172, 5096–5109. [Google Scholar] [CrossRef]
  11. Beckenkamp, A.; Davies, S.; Willig, J.B.; Buffon, A. DPPIV/CD26: A tumor suppressor or a marker of malignancy? Tumor Biol. 2016, 37, 7059–7073. [Google Scholar] [CrossRef] [PubMed]
  12. Qin, C.J.; Zhao, L.H.; Zhou, X.; Zhang, H.L.; Wen, W.; Tang, L.; Zeng, M.; Wang, M.D.; Fu, G.B.; Huang, S.; et al. Inhibition of dipeptidyl peptidase IV prevents high fat diet-induced liver cancer angiogenesis by downregulating chemokine ligand 2. Cancer Lett. 2018, 420, 26–37. [Google Scholar] [CrossRef] [PubMed]
  13. Kawakita, E.; Koya, D.; Kanasaki, K. CD26/DPP-4: Type 2 Diabetes Drug Target with Potential Influence on Cancer Biology. Cancers 2021, 13, 2191. [Google Scholar] [CrossRef] [PubMed]
  14. Jiang, W.; Wen, D.; Cheng, Z.; Yang, Y.; Zheng, G.; Yin, F. Effect of sitagliptin, a DPP-4 inhibitor, against DENA-induced liver cancer in rats mediated via NF-κB activation and inflammatory cytokines. J. Biochem. Mol. Toxicol. 2018, 32, e22220. [Google Scholar] [CrossRef]
  15. Amritha, C.A.; Kumaravelu, P.; Chellathai, D.D. Evaluation of Anti Cancer Effects of DPP-4 Inhibitors in Colon Cancer—An Invitro Study. J. Clin. Diagn. Res. 2015, 9, FC14–FC16. [Google Scholar]
  16. Trocha, M.; Fleszar, M.G.; Fortuna, P.; Lewandowski, Ł.; Gostomska-Pampuch, K.; Sozański, T.; Merwid-Ląd, A.; Krzystek-Korpacka, M. Sitagliptin Modulates Oxidative, Nitrative and Halogenative Stress and Inflammatory Response in Rat Model of Hepatic Ischemia-Reperfusion. Antioxidants 2021, 10, 1168. [Google Scholar] [CrossRef]
  17. Louis, K.S.; Siegel, A.C. Cell viability analysis using trypan blue: Manual and automated methods. Methods Mol. Biol. 2011, 740, 7–12. [Google Scholar]
  18. Vincent, P.C.; Nicholls, A. Comparison of the growth of the Ehrlich ascites tumor in male and female mice. Cancer Res. 1967, 27, 1058–1065. [Google Scholar]
  19. Adami, E.R.; Corso, C.R.; Turin-Oliveira, N.M.; Galindo, C.M.; Milani, L.; Stipp, M.C.; da Silva, L.C.M.; do Nascimento, G.E.; Chaves, P.F.P.; Chequin, A.; et al. Polysaccharides from green sweet pepper increase the antineoplastic effect of methotrexate on mammary tumor cells. Int. J. Biol. Macromol. 2020, 158, 1071–1081. [Google Scholar] [CrossRef]
  20. Dong, Q.; Teng, S.-W.; Wang, Y.; Qin, F.; Li, Y.; Ai, L.-L.; Yu, H. Sitagliptin protects the cognition function of the Alzheimer’s disease mice through activating glucagon-like peptide-1 and BDNF-TrkB signalings. Neurosci. Lett. 2019, 696, 184–190. [Google Scholar] [CrossRef]
  21. Rana, T.; Chakrabarti, A.; Freeman, M.; Biswas, S. Doxorubicin-mediated bone loss in breast cancer bone metastases is driven by an interplay between oxidative stress and induction of TGFβ. PLoS ONE 2013, 8, e78043. [Google Scholar] [CrossRef]
  22. Higuchi, T.; Miyake, K.; Sugisawa, N.; Oshiro, H.; Zhang, Z.; Razmjooei, S.; Yamamoto, N.; Hayashi, K.; Kimura, H.; Miwa, S.; et al. Olaratumab combined with doxorubicin and ifosfamide overcomes individual doxorubicin and olaratumab resistance of an undifferentiated soft-tissue sarcoma in a PDOX mouse model. Cancer Lett. 2019, 451, 122–127. [Google Scholar] [CrossRef] [PubMed]
  23. Facchini, J.M.; Alves, E.P.; Aguilera, C.; Gern, R.M.; Silveira, M.L.; Wisbeck, E.; Furlan, S.A. Antitumor activity of Pleurotus ostreatus polysaccharide fractions on Ehrlich tumor and Sarcoma 180. Int. J. Biol Macromol. 2014, 68, 72–77. [Google Scholar] [CrossRef] [PubMed]
  24. Livak, K.J.; Schmittgen, T.D. Analysis of Relative Gene Expression Data Using Real-Time Quantitative PCR and the 2−ΔΔCT Method. Methods 2001, 25, 402–408. [Google Scholar] [CrossRef]
  25. Prieto-Callejero, B.; Rivera, F.; Fagundo-Rivera, J.; Romero, A.; Romero-Martín, M.; Gómez-Salgado, J.; Ruiz-Frutos, C. Relationship between chemotherapy-induced adverse reactions and health-related quality of life in patients with breast cancer. Medicine 2020, 99, e21695. [Google Scholar] [CrossRef]
  26. Abrahamyan, S.; Sahakyan, I.; Tumasyan, N.; Kocharyan, N.; Simonyan, A.; Aroutiounian, R.; Chailyan, G.; Chailyan, S.; Davtyan, T.; Galoian, K. Morpho-functional study of the hypothalamic proline-rich polypeptide apoptotic activity against mouse Ehrlich ascites carcinoma. Oncol. Rep. 2020, 44, 196–212. [Google Scholar] [CrossRef]
  27. Liu, Q.; Wu, D.; Ma, Y.; Cao, Y.; Pang, Y.; Tang, M.; Pu, Y.; Zhang, T. Intracellular reactive oxygen species trigger mitochondrial dysfunction and apoptosis in cadmium telluride quantum dots-induced liver damage. NanoImpact 2022, 25, 100392. [Google Scholar] [CrossRef]
  28. Thorn, C.F.; Oshiro, C.; Marsh, S.; Hernandez-Boussard, T.; McLeod, H.; Klein, T.E.; Altman, R.B. Doxorubicin pathways: Pharmacodynamics and adverse effects. Pharmacogenet. Genom. 2011, 21, 440–446. [Google Scholar] [CrossRef]
  29. Cappetta, D.; De Angelis, A.; Sapio, L.; Prezioso, L.; Illiano, M.; Quaini, F.; Rossi, F.; Berrino, L.; Naviglio, S.; Urbanek, K. Oxidative Stress and Cellular Response to Doxorubicin: A Common Factor in the Complex Milieu of Anthracycline Cardiotoxicity. Oxid. Med. Cell Longev. 2017, 2017, 1521020. [Google Scholar] [CrossRef]
  30. Marques, C.; Gonçalves, A.; Pereira, P.M.R.; Almeida, D.; Martins, B.; Fontes-Ribeiro, C.; Reis, F.; Fernandes, R. The dipeptidyl peptidase 4 inhibitor sitagliptin improves oxidative stress and ameliorates glomerular lesions in a rat model of type 1 diabetes. Life Sci. 2019, 234, 116738. [Google Scholar] [CrossRef]
  31. Li, Y.; Tian, Q.; Li, Z.; Dang, M.; Lin, Y.; Hou, X. Activation of Nrf2 signaling by sitagliptin and quercetin combination against β-amyloid induced Alzheimer’s disease in rats. Drug Dev. Res. 2019, 80, 837–845. [Google Scholar] [CrossRef]
  32. Zhang, Y.Y.; Yi, M.; Huang, Y.P. Oxymatrine Ameliorates Doxorubicin-Induced Cardiotoxicity in Rats. Cell Physiol. Biochem. 2017, 43, 626–635. [Google Scholar] [CrossRef] [PubMed]
  33. Reuter, S.; Gupta, S.C.; Chaturvedi, M.M.; Aggarwal, B.B. Oxidative stress, inflammation, and cancer: How are they linked? Free Radic. Biol. Med. 2010, 49, 1603–1616. [Google Scholar] [CrossRef] [PubMed] [Green Version]
  34. Kumari, N.; Dwarakanath, B.S.; Das, A.; Bhatt, A.N. Role of interleukin-6 in cancer progression and therapeutic resistance. Tumor Biol. 2016, 37, 11553–11572. [Google Scholar] [CrossRef] [PubMed]
  35. Rébé, C.; Ghiringhelli, F. Interleukin-1β and Cancer. Cancers 2020, 12, 1791. [Google Scholar] [CrossRef] [PubMed]
  36. Guo, R.M.; Xu, W.M.; Lin, J.C.; Mo, L.Q.; Hua, X.X.; Chen, P.X.; Wu, K.; Zheng, D.D.; Feng, J.Q. Activation of the p38 MAPK/NF-κB pathway contributes to doxorubicin-induced inflammation and cytotoxicity in H9c2 cardiac cells. Mol. Med. Rep. 2013, 8, 603–608. [Google Scholar] [CrossRef] [Green Version]
  37. Hajra, S.; Patra, A.R.; Basu, A.; Saha, P.; Bhattacharya, S. Indole-3-Carbinol (I3C) enhances the sensitivity of murine breast adenocarcinoma cells to doxorubicin (DOX) through inhibition of NF-κβ, blocking angiogenesis and regulation of mitochondrial apoptotic pathway. Chem. Biol. Interact. 2018, 290, 19–36. [Google Scholar] [CrossRef]
  38. Arunachalam, S.; Nagoor Meeran, M.F.; Azimullah, S.; Sharma, C.; Goyal, S.N.; Ojha, S. Nerolidol Attenuates Oxidative Stress, Inflammation, and Apoptosis by Modulating Nrf2/MAPK Signaling Pathways in Doxorubicin-Induced Acute Cardiotoxicity in Rats. Antioxidants 2021, 10, 984. [Google Scholar] [CrossRef]
  39. He, Y.; Yang, G.; Yao, F.; Xian, Y.; Wang, G.; Chen, L.; Lv, X.; Gao, H.; Zheng, Z.; Sun, L.; et al. Sitagliptin inhibits vascular inflammation via the SIRT6-dependent signaling pathway. Int. Immunopharmacol. 2019, 75, 105805. [Google Scholar] [CrossRef]
  40. Syukri, A.; Hatta, M.; Amir, M.; Rohman, M.S.; Mappangara, I.; Kaelan, C.; Wahyuni, S.; Bukhari, A.; Junita, A.R.; Primaguna, M.R.; et al. Doxorubicin induced immune abnormalities and inflammatory responses via HMGB1, HIF1-α and VEGF pathway in progressive of cardiovascular damage. Ann. Med. Surg. 2022, 76, 103501. [Google Scholar] [CrossRef]
  41. Setrerrahmane, S.; Xu, H. Tumor-related interleukins: Old validated targets for new anti-cancer drug development. Mol. Cancer 2017, 16, 153. [Google Scholar] [CrossRef]
  42. Yang, X.; Zhang, X.; Wu, R.; Huang, Q.; Jiang, Y.; Qin, J.; Yao, F.; Jin, G.; Zhang, Y. DPPIV promotes endometrial carcinoma cell proliferation, invasion and tumorigenesis. Oncotarget 2017, 8, 8679–8692. [Google Scholar] [CrossRef] [PubMed] [Green Version]
  43. Azbazdar, Y.; Karabicici, M.; Erdal, E.; Ozhan, G. Regulation of Wnt Signaling Pathways at the Plasma Membrane and Their Misregulation in Cancer. Front. Cell Dev. Biol. 2021, 9, 631623. [Google Scholar] [CrossRef] [PubMed]
  44. Lecarpentier, Y.; Schussler, O.; Hébert, J.-L.; Vallée, A. Multiple Targets of the Canonical WNT/β-Catenin Signaling in Cancers. Front. Oncol. 2019, 9, 1248. [Google Scholar] [CrossRef] [PubMed]
  45. Ji, Y.; Lv, J.; Sun, D.; Huang, Y. Therapeutic strategies targeting Wnt/β-catenin signaling for colorectal cancer (Review). Int. J. Mol. Med. 2022, 49, 1. [Google Scholar] [CrossRef]
  46. Ren, R.; Yu, J.; Zhang, Y.; Wang, S.F.; Guo, X.; Shen, M.; Xu, M.D.; Jiang, M.; Zhi, Q.; Chen, K.; et al. Inflammation Promotes Progression of Pancreatic Cancer through WNT/β-Catenin Pathway-Dependent Manner. Pancreas 2019, 48, 1003–1014. [Google Scholar] [CrossRef]
  47. Zhou, Y.; Liang, C.; Xue, F.; Chen, W.; Zhi, X.; Feng, X.; Bai, X.; Liang, T. Salinomycin decreases doxorubicin resistance in hepatocellular carcinoma cells by inhibiting the β-catenin/TCF complex association via FOXO3a activation. Oncotarget 2015, 6, 10350–10365. [Google Scholar] [CrossRef] [PubMed] [Green Version]
  48. Li, Z.; Sun, Y.; Qu, M.; Wan, H.; Cai, F.; Zhang, P. Inhibiting the MNK-eIF4E-β-catenin axis increases the responsiveness of aggressive breast cancer cells to chemotherapy. Oncotarget 2017, 8, 2906–2915. [Google Scholar] [CrossRef] [Green Version]
  49. Zuryń, A.; Litwiniec, A.; Klimaszewska-Wiśniewska, A.; Nowak, J.M.; Gackowska, L.; Myśliwiec, B.J.; Pawlik, A.; Grzanka, A. Expression of cyclin D1 after treatment with doxorubicin in the HL-60 cell line. Cell Biol. Int. 2014, 38, 857–867. [Google Scholar] [CrossRef]
  50. Pistritto, G.; Trisciuoglio, D.; Ceci, C.; Garufi, A.; D’Orazi, G. Apoptosis as anticancer mechanism: Function and dysfunction of its modulators and targeted therapeutic strategies. Aging 2016, 8, 603–619. [Google Scholar] [CrossRef] [Green Version]
  51. Cheteh, E.H.; Sarne, V.; Ceder, S.; Bianchi, J.; Augsten, M.; Rundqvist, H.; Egevad, L.; Östman, A.; Wiman, K.G. Interleukin-6 derived from cancer-associated fibroblasts attenuates the p53 response to doxorubicin in prostate cancer cells. Cell Death Discov. 2020, 6, 42. [Google Scholar] [CrossRef] [PubMed]
  52. Xia, Y.; He, Z.; Liu, B.; Wang, P.; Chen, Y. Downregulation of Meg3 enhances cisplatin resistance of lung cancer cells through activation of the WNT/β-catenin signaling pathway. Mol. Med. Rep. 2015, 12, 4530–4537. [Google Scholar] [CrossRef] [PubMed] [Green Version]
  53. Kelleni, M.T.; Amin, E.F.; Abdelrahman, A.M. Effect of Metformin and Sitagliptin on Doxorubicin-Induced Cardiotoxicity in Rats: Impact of Oxidative Stress, Inflammation, and Apoptosis. J. Toxicol. 2015, 2015, 424813. [Google Scholar] [CrossRef] [PubMed] [Green Version]
  54. Zhou, Y.; Guo, Z.; Yan, W.; Wang, W. Cardiovascular effects of sitagliptin—An anti-diabetes medicine. Clin. Exp. Pharmacol. Physiol. 2018, 45, 628–635. [Google Scholar] [CrossRef] [PubMed] [Green Version]
  55. Aziz, T.A. Cardioprotective Effect of Quercetin and Sitagliptin in Doxorubicin-Induced Cardiac Toxicity in Rats. Cancer Manag. Res. 2021, 13, 2349–2357. [Google Scholar] [CrossRef]
  56. Jo, C.H.; Kim, S.; Park, J.S.; Kim, G.H. Anti-Inflammatory Action of Sitagliptin and Linagliptin in Doxorubicin Nephropathy. Kidney Blood Press Res. 2018, 43, 987–999. [Google Scholar] [CrossRef]
Figure 1. Growth suppressive effect of sitagliptin (STG) alone or in combination with Doxorubicin (Dox) on Ehrlich solid carcinoma (ESC)-bearing mice. (a) Photographs of representative ESC mouse models from each treatment group on the last day of treatment. Arrows indicate the margins of the tumors. (b) Tumor volume (mm3) at each time point after the onset of treatment. Results are expressed as Mean ± SD. Statistical analysis was performed using one-way ANOVA, followed by Tukey’s post-hoc test. *** significant at p < 0.001 vs. positive control group; +++ significant at p < 0.001 vs. STG-treated group; # significant at p < 0.05 vs. Dox-treated group.
Scipharm 90 00042 g001
Figure 2. Effect of sitagliptin (STG) alone or in combination with Doxorubicin (Dox) on tumor weight. (a) The gross appearance of excised tumors from Ehrlich solid carcinoma (ESC)-bearing mice and different treatment groups on the last day of treatment. All tumor images were taken at the same magnification power, zooming, and distance from the camera. (b) Excised tumor weight (g) on the last day of treatment. (c) Tumor growth inhibition percentage compared to positive control ESC-bearing mice. Results are expressed as Mean ± SD. Statistical analysis was performed using one-way ANOVA, followed by Tukey’s post-hoc test. *** significant at p < 0.001 vs. positive control group; +++ significant at p < 0.001 vs. STG-treated group; ##, # significant at p < 0.01, p < 0.05, respectively vs. Dox-treated group.
Scipharm 90 00042 g002
Figure 3. Effect of sitagliptin (STG) alone or in combination with Doxorubicin (Dox) on oxidative status and inflammatory parameters in tumor tissue. (a) Malondialdehyde (MDA). (b) Glutathione (GSH). (c) Interleukin 6 (IL-6). (d) Interleukin 1β (IL-1β). Results are expressed as Mean ± SD (n = 10). Statistical analysis was performed using one-way ANOVA, followed by Tukey’s post-hoc test. ***, * significant at p < 0.001, p < 0.05, respectively vs. positive control group; +++, ++, + significant at p < 0.001, p < 0.01, p < 0.05, respectively vs. STG-treated group; ### significant at p < 0.001 vs. Dox-treated group.
Scipharm 90 00042 g003
Figure 4. Photomicrograph of tumor sections stained with hematoxylin and eosin (H&E) from Ehrlich solid carcinoma (ESC)-bearing mice. (a) Positive control group. (b) Sitagliptin (STG)-treated group. (c) Doxorubicin (Dox)-treated group. (d) STG + Dox-treated group. Black arrows indicate necrotic areas, blue arrows indicate viable areas, red arrows indicate newly formed blood capillaries, dashed black arrows indicate ghosts’ cells, and yellow arrows indicate tumor giant cells. Low-magnification (×100) scale bars = 100 μm and high-magnification (×400) scale bars = 50 μm. (e) % necrosis in tumor tissue. Bar graphs show the percentage of necrotic areas to the total analyzed area. (f) Number of blood vessels. (g) Tumor vascular area (μm2). Data are expressed as Mean ± SD (n = 10). Statistical analysis was performed using one-way ANOVA, followed by Tukey’s post-hoc test. ***, **, * significant at p < 0.001, p < 0.01, p < 0.05, respectively vs. positive control group; +++, + significant at p < 0.001, p < 0.05, respectively vs. STG-treated group; ###, ## significant at p < 0.001, p < 0.01, respectively vs. Dox-treated group.
Scipharm 90 00042 g004
Figure 5. Relative gene expression of (a) VEGF, (b) β-Catenin, (c) Cyclin-D1, and (d) Survivin in tumor tissue from Ehrlich solid carcinoma (ESC)-bearing mice treated with Sitagliptin (STG) alone or in combination with Doxorubicin (Dox). Results are expressed as Mean ± SD (n = 10) and represent expression relative to the glyceraldehyde 3-phosphate dehydrogenase (GAPDH) reference gene. Statistical analysis was performed using one-way ANOVA, followed by Tukey’s post-hoc test. ***, **, * significant at p < 0.001, p < 0.01, p < 0.05, respectively vs. positive control group; +++, ++ significant at p < 0.001, p < 0.01, respectively vs. STG-treated group; ### significant at p < 0.001 vs. Dox-treated group.
Scipharm 90 00042 g005
Figure 6. Sitagliptin (STG) alone or in combination with Doxorubicin (Dox) induces Ehrlich solid carcinoma (ESC) nuclear DNA fragmentation detected by terminal dUTP nick-end labeling (TUNEL) assay. (a) Photomicrograph of tumor sections subjected to TUNEL staining assay (magnification: X400, scale bars = 50 μm). (b) The number of TUNEL-positive cells. Results are expressed as Mean ± SD (n = 10). Statistical analysis was performed using one-way ANOVA, followed by Tukey’s post-hoc test. *** significant at p < 0.001 vs. positive control group; ** significant at p < 0.01 vs. positive control group; +++ p < 0.001 vs. STG-treated group; ### significant at p < 0.001 vs. Dox-treated group.
Scipharm 90 00042 g006
Figure 7. Immunohistochemical staining (IHC) of p53. (a) Positive control group. (b) Sitagliptin (STG)-treated group. (c) Doxorubicin (Dox)-treated group. (d) STG + Dox-treated group. IHC counterstained with Mayer’s hematoxylin. Black arrows point to a positive reaction. Low-magnification (×100) scale bars = 100 μm and high-magnification (×400) scale bars = 50 μm. (e) % p53 protein expression. p53 positive areas were measured using Image J software and expressed as a percentage of the total analyzed area. Results are expressed as Mean ± SD (n = 10). Statistical analysis was performed using one-way ANOVA, followed by Tukey’s post-hoc test. *** significant at p < 0.001 vs. positive control group; +++ p < 0.001 vs. STG-treated group; ### significant at p < 0.001 vs. Dox-treated group.
Scipharm 90 00042 g007
Figure 8. Immunohistochemical staining (IHC) of caspase-3. (a) Positive control group. (b) Sitagliptin (STG)-treated group. (c) Doxorubicin (Dox)-treated group. (d) STG + Dox-treated group. IHC counterstained with Mayer’s hematoxylin. Black arrows point to a positive reaction. Low-magnification (×100) scale bars = 100 μm and high-magnification (×400) scale bars = 50 μm. (e) % Caspase-3 protein expression. Caspase-3 positive areas were measured using Image J software and expressed as a percentage of the total analyzed area. Results are expressed as Mean ± SD (n = 10). Statistical analysis was performed using one-way ANOVA, followed by Tukey’s post-hoc test. *** significant at p < 0.001 vs. positive control group; +++ significant at p < 0.001 vs. STG-treated group; ## significant at p < 0.01 vs. Dox-treated group.
Scipharm 90 00042 g008
Table 1. The primer sequences used for the amplification of mouse GAPDH, VEGF, β-Catenin, Cyclin-D1, and Survivin genes.
Primer SequenceNCBI Reference SequenceAmplification SizeAnnealing Temperature
GAPDHF5′-ATGGTGAAGGTCGGTGTGAAC-3′NM_008084.325160 °C
R5′-TTGATGTTAGTGGGGTCTCGC-3′
VEGFF5′-CACGACAGAAGGAGAGCAGAAG-3′NM_001025250.38260 °C
R5′-CTCAATCGGACGGCAGTAGC-3′
β-CateninF5′-GTTCGCCTTCATTATGGACTGCC-3′NM_007614.314660 °C
R5′-ATAGCACCCTGTTCCCGCAAAG-3′
Cyclin-D1F5′-AGAAGTGCGAAGAGGAGGTC-3′NM_001379248.115760 °C
R5′-TTCTCGGCAGTCAAGGGAAT-3′
SurvivinF5′-GAATCCTGCGTTTGAGTCGT-3′NM_001012273.120760 °C
R5′-AATCAGGCTCGTTCTCGGTA-3′
GAPDH: Glyceraldehyde 3-phosphate dehydrogenase; VEGF: vascular endothelial growth factor; F: forward; R: reverse.
Publisher’s Note: MDPI stays neutral with regard to jurisdictional claims in published maps and institutional affiliations.

