Antibiotics Effects on the Fecal Metabolome in Preterm Infants

 , and
, and
Abstract
:
1. Introduction
2. Results
2.1. Study Population
2.2. Metabolomics-Comparison of Three Groups
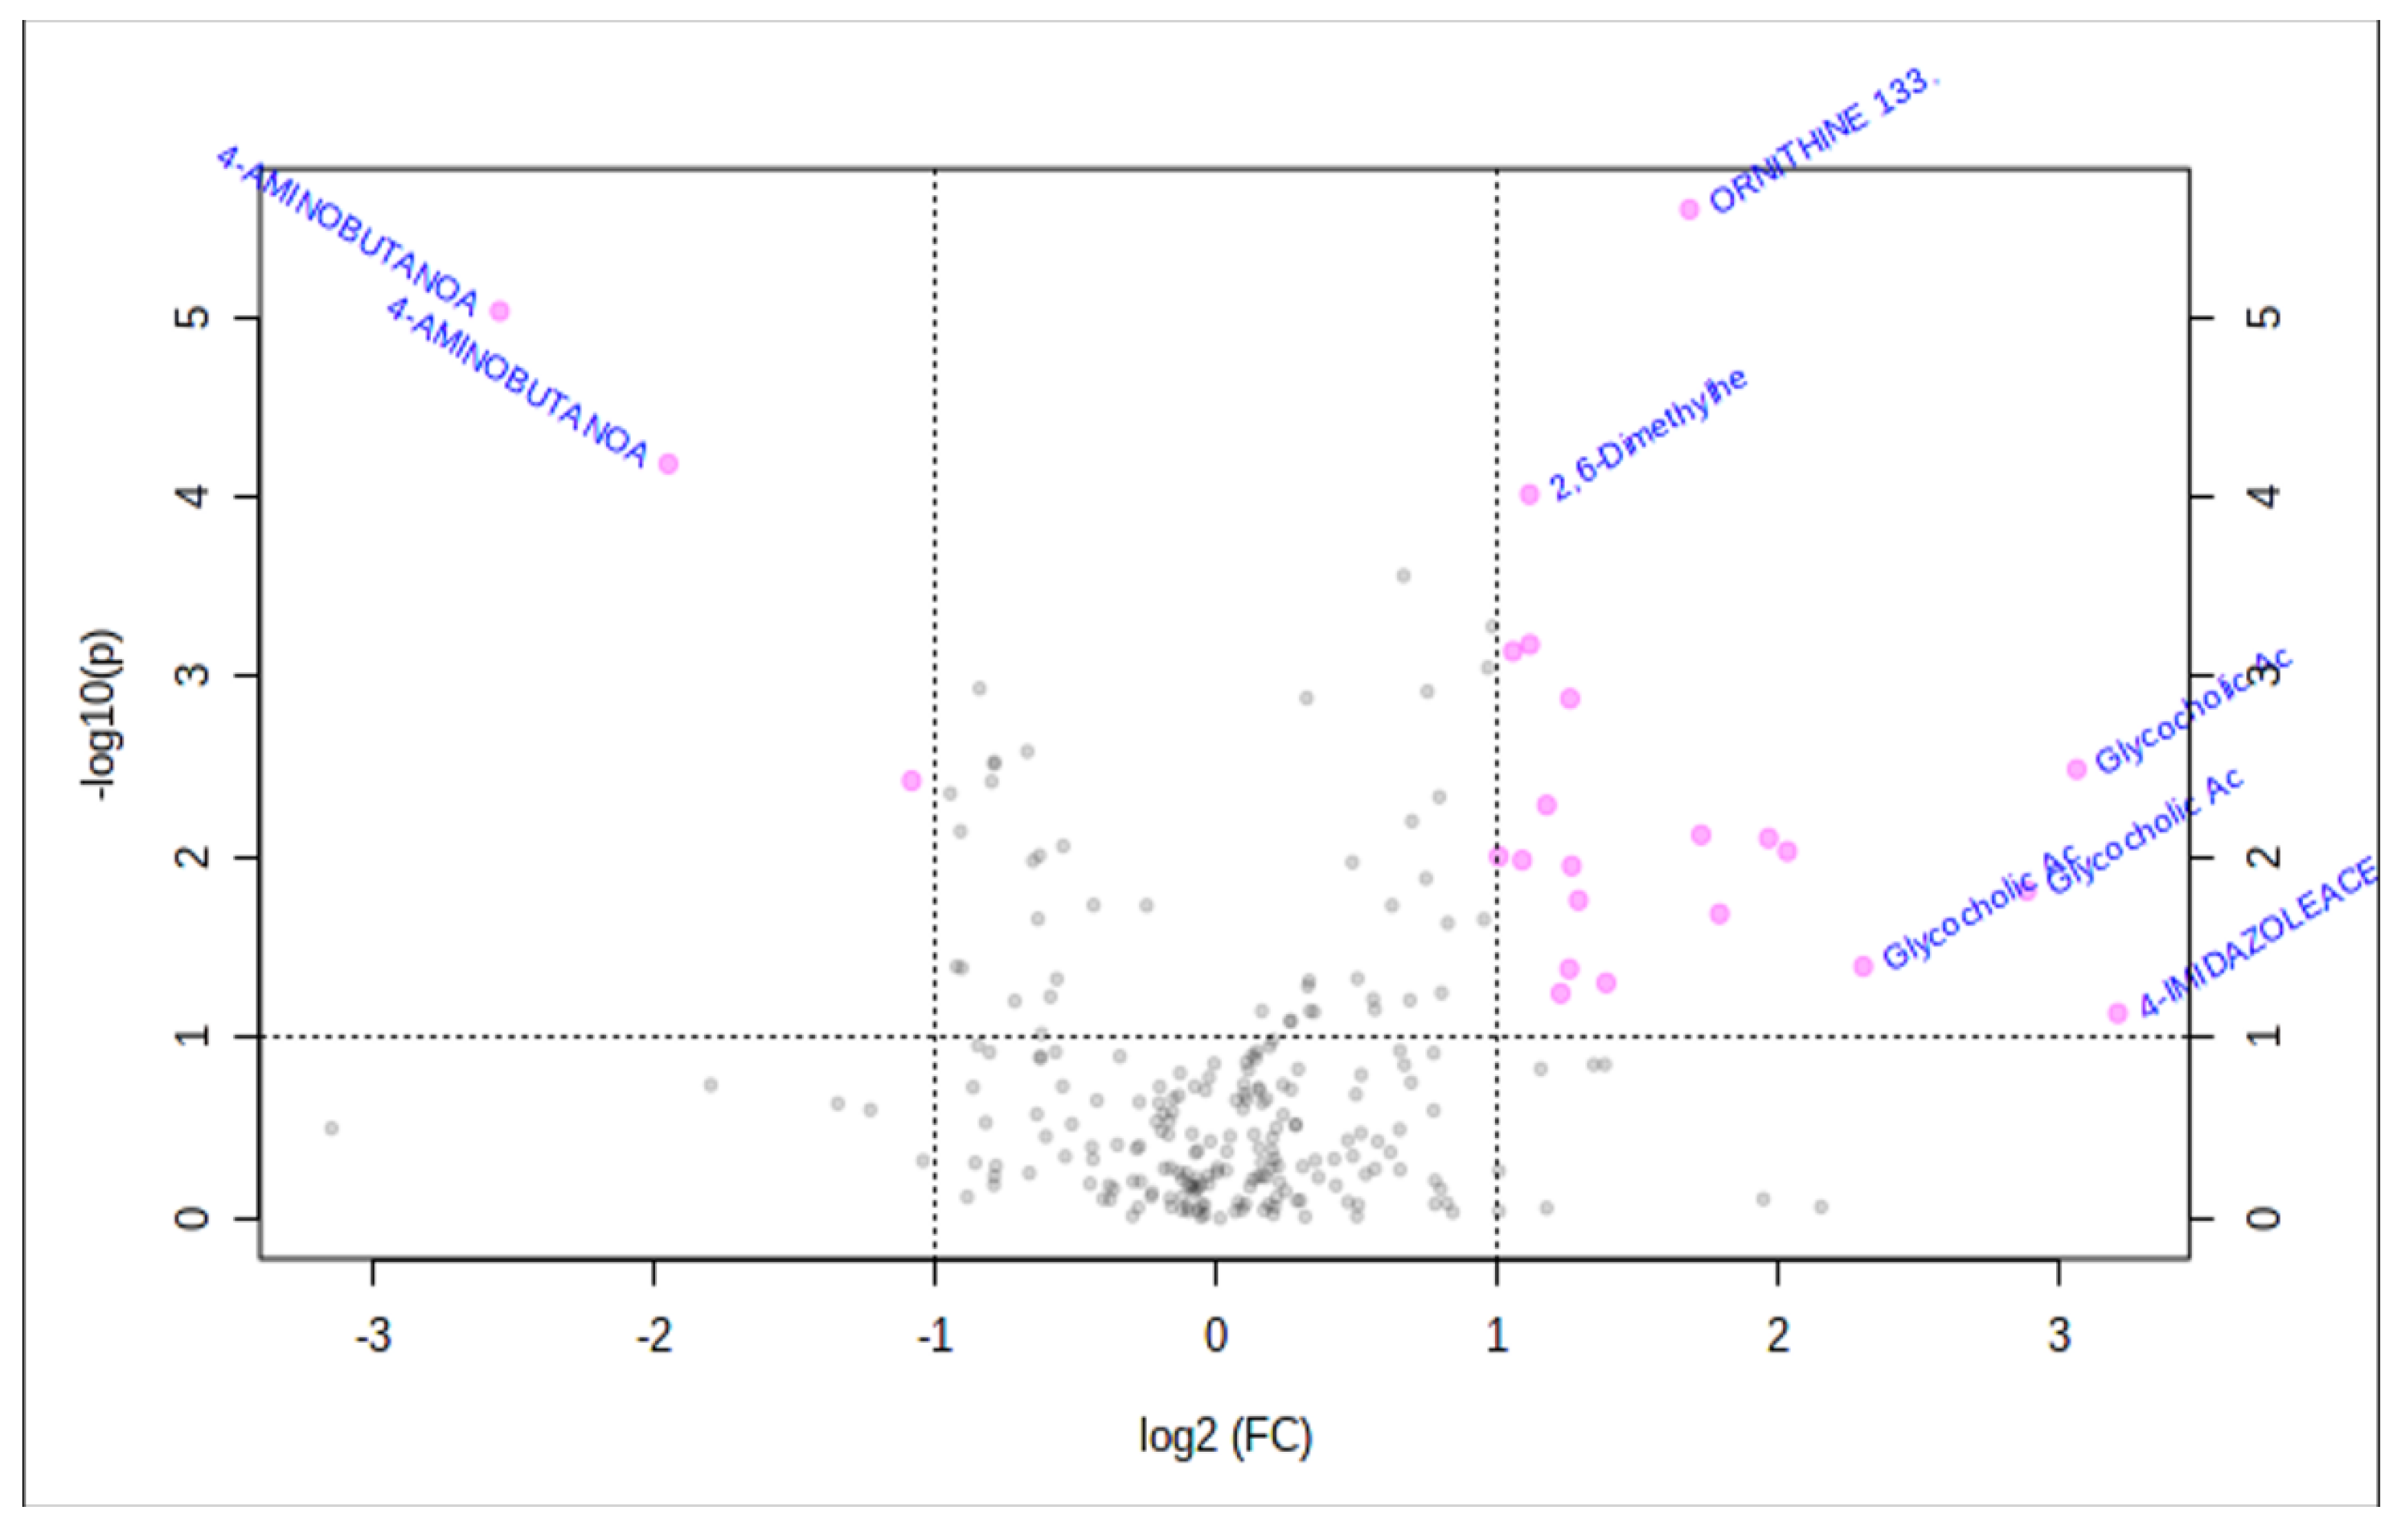
2.3. Metabolomics-Comparison of Randomized Groups
2.4. Bile Acid
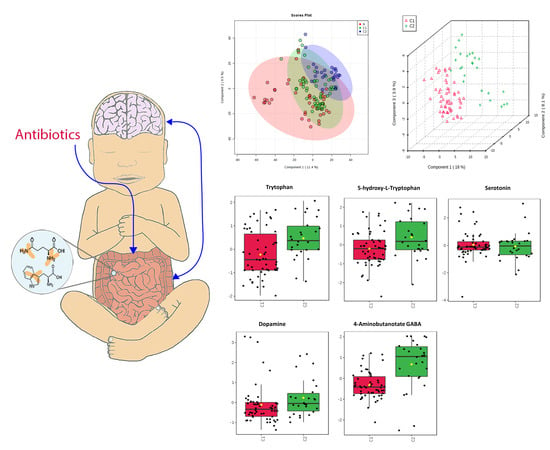
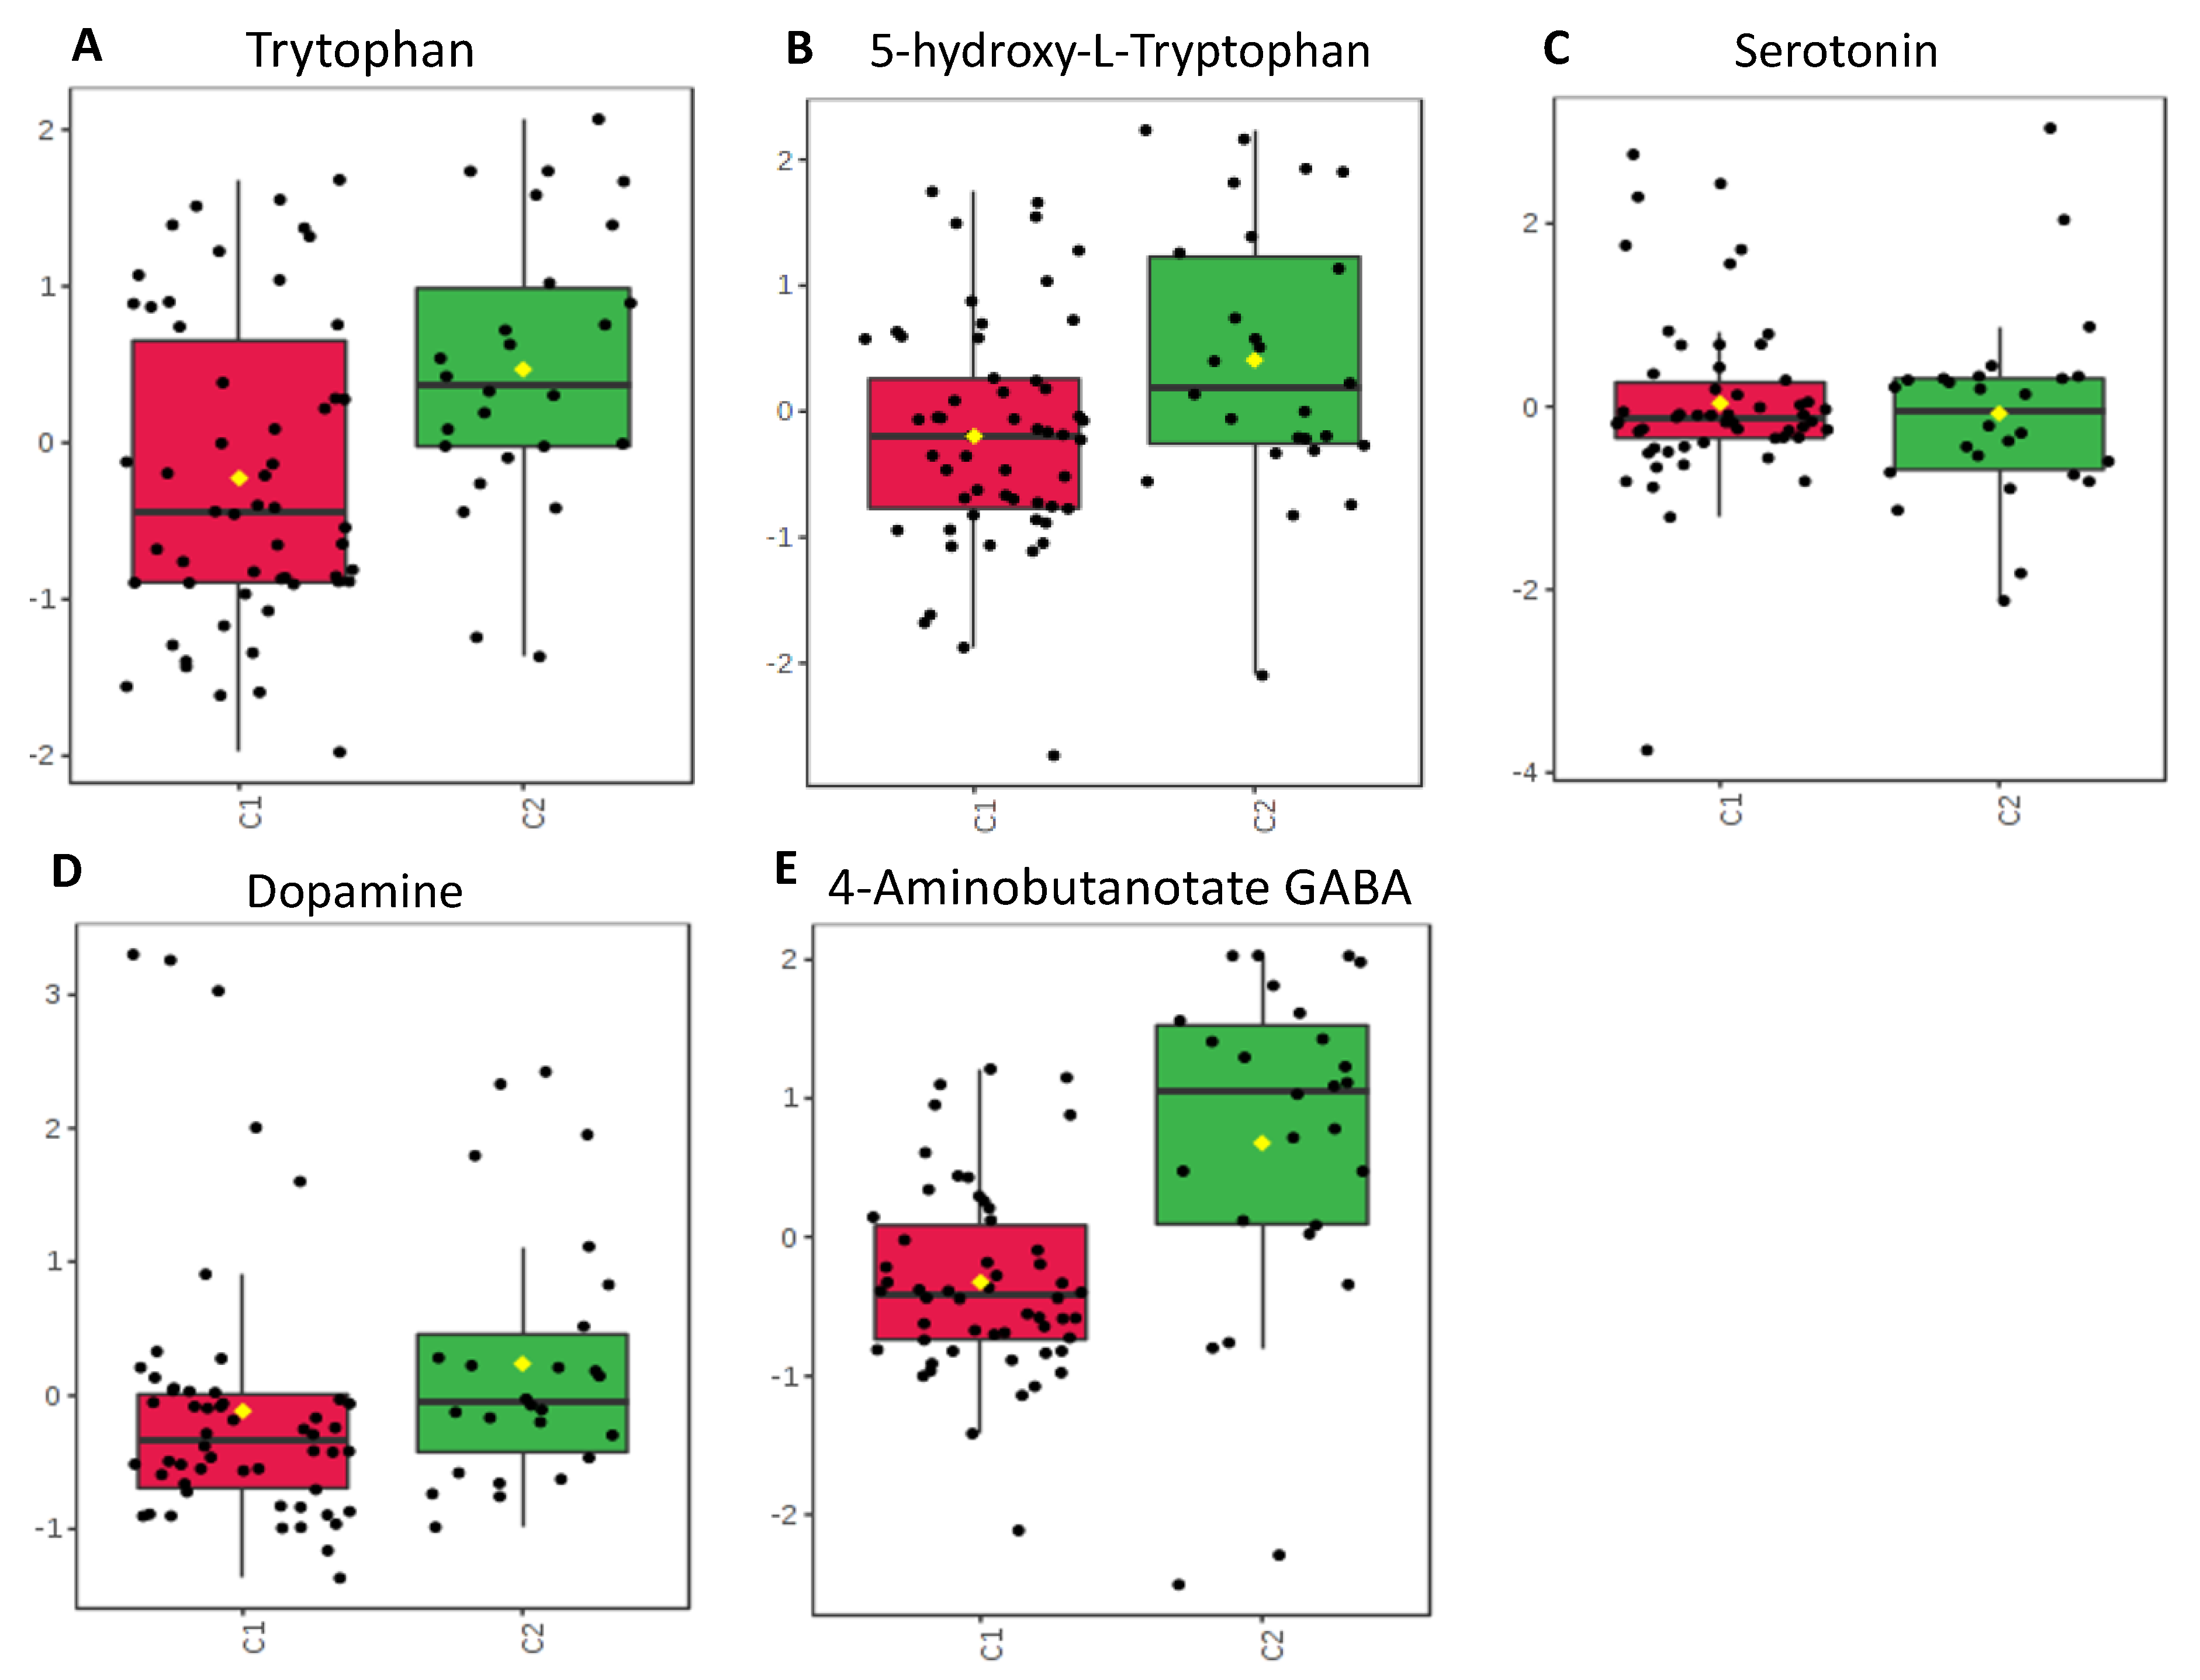
2.5. Neurotransmitters
2.6. Amino Acids Important to Intestinal Metabolism
2.7. Shikimate-Folic Acid Metabolism.
3. Discussion
3.1. Bile Acids
3.2. Neurotransmitters
3.3. Amino Acids Critical to Intestinal Metabolism
3.4. Shikimate
3.5. Strengths and Limitations
4. Methods
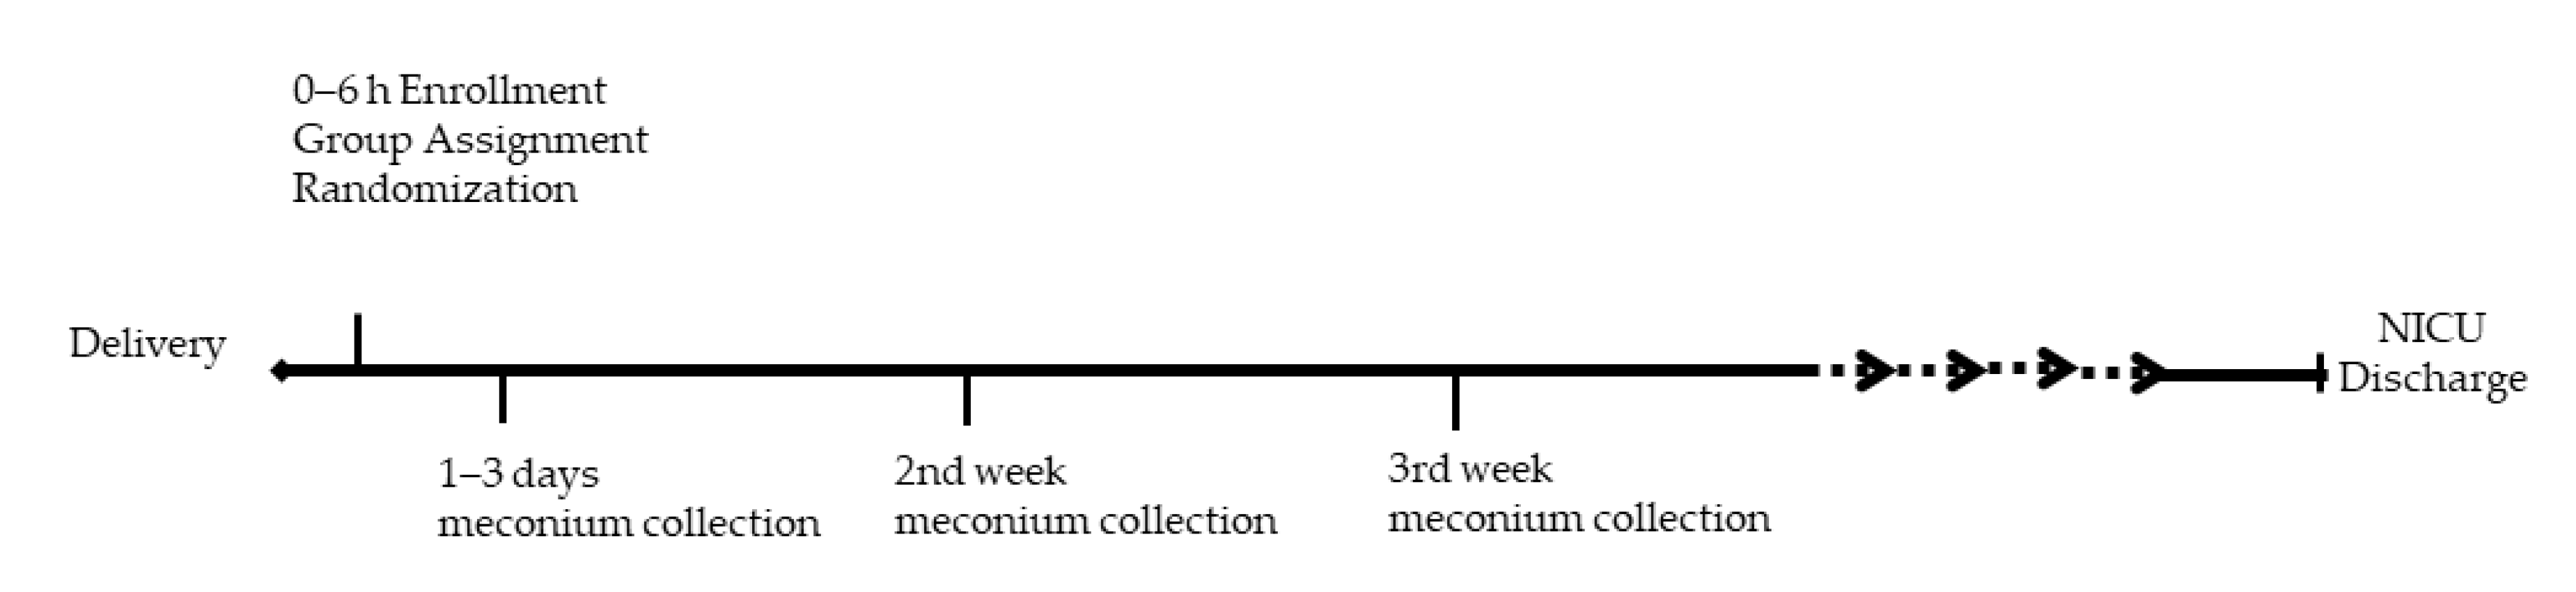
4.1. Clinical Trial
4.2. Stool Sample Collection
4.3. Metabolomic Profiling
4.4. Statistical Analysis
5. Limitations and Future Directions
Author Contributions
Funding
Conflicts of Interest
References
- Clark, R.H.; Bloom, B.T.; Spitzer, A.R.; Gerstmann, D.R. Reported medication use in the neonatal intensive care unit: Data from a large national data set. Pediatrics 2006, 117, 1979–1987. [Google Scholar] [CrossRef] [PubMed]
- Klingenberg, C.; Kornelisse, R.F.; Buonocore, G.; Maier, R.F.; Stocker, M. Culture-Negative Early-Onset Neonatal Sepsis—At the Crossroad Between Efficient Sepsis Care and Antimicrobial Stewardship. Front. Pediatr. 2018, 6, 285. [Google Scholar] [CrossRef] [PubMed] [Green Version]
- Hsieh, E.M.; Hornik, C.P.; Clark, R.H.; Laughon, M.M.; Benjamin, D.K.; Smith, P.B. Medication use in the neonatal intensive care unit. Am. J. Perinatol. 2014, 31, 811–821. [Google Scholar] [CrossRef] [PubMed] [Green Version]
- Cotten, C.M.; Taylor, S.; Stoll, B.; Goldberg, R.N.; Hansen, N.I.; Sánchez, P.J.; Ambalavanan, N.; Benjamin, D.K. Prolonged duration of initial empirical antibiotic treatment is associated with increased rates of necrotizing enterocolitis and death for extremely low birth weight infants. Pediatrics 2009, 123, 58–66. [Google Scholar] [CrossRef] [PubMed] [Green Version]
- Alexander, V.N.; Northrup, V.; Bizzarro, M.J. Antibiotic exposure in the newborn intensive care unit and the risk of necrotizing enterocolitis. J. Pediatr. 2011, 159, 392–397. [Google Scholar] [CrossRef] [Green Version]
- Kuppala, V.S.; Meinzen-Derr, J.; Morrow, A.L.; Schibler, K.R. Prolonged initial empirical antibiotic treatment is associated with adverse outcomes in premature infants. J. Pediatr. 2011, 159, 720–725. [Google Scholar] [CrossRef] [Green Version]
- Lee-Sarwar, K.A.; Lasky-Su, J.; Kelly, R.S.; Litonjua, A.A.; Weiss, S.T. Metabolome—Microbiome Crosstalk and Human Disease. Metabolites 2020, 10, 181. [Google Scholar] [CrossRef]
- Hanson, M.A.; Gluckman, P.D. Early developmental conditioning of later health and disease: Physiology or pathophysiology? Physiol. Rev. 2014, 94, 1027–1076. [Google Scholar] [CrossRef]
- Indrio, F.; Martini, S.; Francavilla, R.; Corvaglia, L.; Cristofori, F.; Mastrolia, S.A.; Neu, J.; Rautava, S.; Russo Spena, G.; Raimondi, F.; et al. Epigenetic Matters: The Link between Early Nutrition, Microbiome, and Long-term Health Development. Front. Pediatr. 2017, 5, 178. [Google Scholar] [CrossRef]
- Antunes, L.C.; Han, J.; Ferreira, R.B.; Lolić, P.; Borchers, C.H.; Finlay, B.B. Effect of antibiotic treatment on the intestinal metabolome. Antimicrob. Agents Chemother. 2011, 55, 1494–1503. [Google Scholar] [CrossRef] [Green Version]
- Antharam, V.C.; McEwen, D.C.; Garrett, T.J.; Dossey, A.T.; Li, E.C.; Kozlov, A.N.; Mesbah, Z.; Wang, G.P. An Integrated Metabolomic and Microbiome Analysis Identified Specific Gut Microbiota Associated with Fecal Cholesterol and Coprostanol in Clostridium difficile Infection. PLoS ONE 2016, 11, e0148824. [Google Scholar] [CrossRef] [PubMed] [Green Version]
- Young, V.B.; Schmidt, T.M. Antibiotic-associated diarrhea accompanied by large-scale alterations in the composition of the fecal microbiota. J. Clin. Microbiol. 2004, 42, 1203–1206. [Google Scholar] [CrossRef] [PubMed] [Green Version]
- Jump, R.L.; Polinkovsky, A.; Hurless, K.; Sitzlar, B.; Eckart, K.; Tomas, M.; Deshpande, A.; Nerandzic, M.M.; Donskey, C.J. Metabolomics analysis identifies intestinal microbiota-derived biomarkers of colonization resistance in clindamycin-treated mice. PLoS ONE 2014, 9, e101267. [Google Scholar] [CrossRef] [PubMed]
- Zhao, Y.; Wu, J.; Li, J.V.; Zhou, N.Y.; Tang, H.; Wang, Y. Gut microbiota composition modifies fecal metabolic profiles in mice. J. Proteome Res. 2013, 12, 2987–2999. [Google Scholar] [CrossRef] [PubMed]
- Langdon, A.; Crook, N.; Dantas, G. The effects of antibiotics on the microbiome throughout development and alternative approaches for therapeutic modulation. Genome Med. 2016, 8, 39. [Google Scholar] [CrossRef] [PubMed] [Green Version]
- Zhu, D.; Ziao, S.; Yu, J.; Ai, Q.; He, Y.; Cheng, C.; Zhang, Y.; Pan, Y. Effects of One-Week Empirical Antibiotic Therapy on the Early Development of Gut Microbiota and Metabolites in Preterm Infants. Sci. Rep. 2017, 7, 8025. [Google Scholar] [CrossRef]
- Stewart, C.J.; Skeath, T.; Nelson, A.; Fernstad, S.J.; Marrs, E.C.; Perry, J.D.; Cummings, S.P.; Berrington, J.E.; Embleton, N.D. Preterm gut microbiota and metabolome following discharge from intensive care. Sci. Rep. 2015, 5, 17141. [Google Scholar] [CrossRef] [Green Version]
- Wandro, S.; Osborne, S.; Enriquez, C.; Bixby, C.; Arrieta, A.; Whiteson, K. The Microbiome and Metabolome of Preterm Infant Stool Are Personalized and Not Driven by Health Outcomes, Including Necrotizing Enterocolitis and Late-Onset Sepsis. mSphere 2018, 3, 1–12. [Google Scholar] [CrossRef] [Green Version]
- Ruoss, J.L.; Bazacliu, C.; Russell, J.T.; de la Cruz, D.; Li, N.; Gurka, M.J.; Filipp, S.l.; Polin, R.; Triplett, E.w.; Neu, J. Routine Early Antibiotic use in SymptOmatic preterm Neonates (REASON): A prospective randomized controlled trial. medRxiv 2020. [Google Scholar] [CrossRef]
- Russell, J.T.; Ruoss, J.L.; de la Cruz, D.; Li, N.; Bazacliu, C.; Patton, L.; McKinley, K.L.; Garrett, T.J.; Polin, R.A.; Triplett, E.W.; et al. Antibiotics may influence gut microbiome signaling to the brain in preterm neonates. bioRxiv 2020. [Google Scholar] [CrossRef]
- Ge, X.; Ding, C.; Zhao, W.; Xu, L.; Tian, H.; Gong, J.; Zhu, M.; Li, J.; Li, N. Antibiotics-induced depletion of mice microbiota induces changes in host serotonin biosynthesis and intestinal motility. J. Transl. Med. 2017, 15, 13. [Google Scholar] [CrossRef] [Green Version]
- Behr, C.; Slopianka, M.; Haake, V.; Strauss, V.; Sperber, S.; Kamp, H.; Walk, T.; Beekmann, K.; Rietjens, I.M.C.M.; van Ravenzwaay, B. Analysis of metabolome changes in the bile acid pool in feces and plasma of antibiotic-treated rats. Toxicol. Appl. Pharmacol. 2019, 363, 79–87. [Google Scholar] [CrossRef] [PubMed]
- Ma, N.; Ma, X. Dietary Amino Acids and the Gut-Microbiome-Immune Axis: Physiologic Metabolism and Therapeutic Prospects. Compr. Rev. Food Sci. Food Saf. 2018, 18, 23. [Google Scholar] [CrossRef] [Green Version]
- Grill, J.P.; Manginot-Dürr, C.; Schneider, F.; Ballongue, J. Bifidobacteria and probiotic effects: Action of Bifidobacterium species on conjugated bile salts. Curr. Microbiol. 1995, 31, 23–27. [Google Scholar] [CrossRef] [PubMed]
- Jia, W.; Xie, G. Bile acid-microbiota crosstalk in gastrointestinal inflammation and carcinogenesis. Nat. Rev. Gastroenterol. Hepatol. 2018, 15, 111–128. [Google Scholar] [CrossRef] [PubMed] [Green Version]
- Hofmann, A.F. The continuing importance of bile acids in liver and intestinal disease. Arch. Intern. Med. 1999, 159, 2647–2658. [Google Scholar] [CrossRef]
- Kaur, H.; Bose, C.; Mande, S.S. Tryptophan Metabolism by Gut Microbiome and Gut-Brain-Axis: An in silico Analysis. Front. Neurosci. 2019, 13, 1365. [Google Scholar] [CrossRef]
- Yano, J.M.; Yu, K.; Donaldson, G.P.; Shastri, G.G.; Ann, P.; Ma, L.; Nagler, C.R.; Ismagilov, R.F.; Mazmanian, S.K.; Hsiao, E.Y. Indigenous bacteria from the gut microbiota regulate host serotonin biosynthesis. Cell 2015, 161, 264–276. [Google Scholar] [CrossRef] [Green Version]
- Camilleri, M. Serotonin in the gastrointestinal tract. Curr. Opin. Endocrinol. Diabetes Obes. 2009, 16, 53–59. [Google Scholar] [CrossRef] [Green Version]
- Shajib, M.S.; Khan, W.I. The role of serotonin and its receptors in activation of immune responses and inflammation. Acta Physiol. 2015, 213, 561–574. [Google Scholar] [CrossRef]
- Eisenhofer, G.; Aneman, A.; Friberg, P.; Hooper, D.; Fåndriks, L.; Lonroth, H.; Hunyady, B.; Mezey, E. Substantial production of dopamine in the human gastrointestinal tract. J. Clin. Endocrinol. Metab. 1997, 82, 3864–3871. [Google Scholar] [CrossRef] [PubMed]
- Auteri, M.; Zizzo, M.G.; Serio, R. GABA and GABA receptors in the gastrointestinal tract: From motility to inflammation. Pharmacol. Res. 2015, 93, 11–21. [Google Scholar] [CrossRef] [PubMed]
- Kwon, S.H.; Scheinost, D.; Lacadie, C.; Benjamin, J.; Myers, E.H.; Qiu, M.; Schneider, K.C.; Rothman, D.L.; Constable, R.T.; Ment, L.R. GABA, resting-state connectivity and the developing brain. Neonatology 2014, 106, 149–155. [Google Scholar] [CrossRef] [Green Version]
- Galland, L. The gut microbiome and the brain. J. Med. Food 2014, 17, 1261–1272. [Google Scholar] [CrossRef] [PubMed]
- Gardiner, K.R.; Kirk, S.J.; Rowlands, B.J. Novel substrates to maintain gut integrity. Nutr. Res. Rev. 1995, 8, 43–66. [Google Scholar] [CrossRef] [PubMed] [Green Version]
- El-shimi, M.S.; Awad, H.A.; Abdelwahed, M.A.; Mohamed, M.H.; Khafagy, S.M.; Saleh, G. Enteral L-Arginine and Glutamine Supplementation for Prevention of NEC in Preterm Neonates. Int. J. Pediatr. 2015, 2015, 7. [Google Scholar] [CrossRef] [Green Version]
- Cynober, L. Can arginine and ornithine support gut functions? Gut 1994, 35, S42–S45. [Google Scholar] [CrossRef]
- Ho, Y.Y.; Nakato, J.; Mizushige, T.; Kanamoto, R.; Tanida, M.; Akiduki, S.; Ohinata, K. l-Ornithine stimulates growth hormone release in a manner dependent on the ghrelin system. Food Funct. 2017, 8, 2110–2114. [Google Scholar] [CrossRef]
- Mir, R.; Jallu, S.; Singh, T.P. The shikimate pathway: Review of amino acid sequence, function and three-dimensional structures of the enzymes. Crit. Rev. Microbiol. 2015, 41, 172–189. [Google Scholar] [CrossRef]
- Chamberlain, C.A.; Hatch, M.; Garrett, T.J. Metabolomic and lipidomic characterization of Oxalobacter formigenes strains HC1 and OxWR by UHPLC-HRMS. Anal. Bioanal. Chem. 2019, 411, 4807–4818. [Google Scholar] [CrossRef]
- Pluskal, T.; Castillo, S.; Villar-Briones, A.; Oresic, M. MZmine 2: Modular framework for processing, visualizing, and analyzing mass spectrometry-based molecular profile data. BMC Bioinform. 2010, 11, 395. [Google Scholar] [CrossRef] [PubMed] [Green Version]
- Pang, Z.; Chong, J.; Li, S.; Xia, J. MetaboAnalystR 3.0: Toward an Optimized Workflow for Global Metabolomics. Metabolites 2020, 10, 186. [Google Scholar] [CrossRef] [PubMed]


| Group, Patient | Gestational Age (wks) | Antibiotics | Feeding Type * | Number of Stool Samples |
|---|---|---|---|---|
| A | Mean 29.5 | 43 | ||
| 5 | 28 | Ampicillin, Gentamicin, Piperacillin-tazobactam, Vancomycin | DBM, MBM | 9 |
| 6 | 28 | Ampicillin, Azithromycin, Fluconazole, Gentamicin, Metronidazole, Piperacillin-tazobactam, Vancomycin | DBM, MBM, formula | 12 |
| 14 | 32 | Ampicillin, Gentamicin | formula | 5 |
| 17 | 31 | Ampicillin, Gentamicin | DBM, MBM | 7 |
| 19 | 26 | Ampicillin, Cefotaxime, Fluconazole, Gentamicin, Metronidazole, Piperacillin-tazobactam, Vancomycin | DBM, MBM, formula | 9 |
| 20 | 32 | Ampicillin, Ceftazidime, Cefotaxime, Fluconazole, Gentamicin, Metronidazole, Oxacillin, Piperacillin-tazobactam, Rifampin, Vancomycin | DBM, formula | 1 |
| C1 | Mean 27 | 54 | ||
| 1 | 26 | Ampicillin, Gentamicin, Vancomycin | DBM, MBM, formula | 14 |
| 2 | 28 | Ampicillin, Azithromycin Fluconazole, Gentamicin, Metronidazole, Piperacillin-tazobactam, Vancomycin | MBM, formula | 13 |
| 3 | 25 | Azithromycin, Piperacillin-tazobactam, Fluconazole | DBM, MBM, formula | 11 |
| 7 | 28 | Ampicillin, Fluconazole, Gentamicin, Piperacillin-tazobactam | MBM | 1 |
| 10 | 29 | Ampicillin, Gentamicin | NPO | 4 |
| 11 | 24 | Ampicillin, Gentamicin, Piperacillin-tazobactam, Vancomycin | NPO | 2 |
| 13 | 28 | Ampicillin, Gentamicin | NPO | 3 |
| 15 | 29 | Ampicillin, Gentamicin | DBM, MBM, formula | 6 |
| C2 | Mean 28 | 26 | ||
| 4 | 29 | No | DBM, MBM, formula | 7 |
| 8 | 32 | No | MBM, formula | 2 |
| 12 | 27 | No | DBM, MBM, formula | 10 |
| 16 | 23 | No | NPO | 1 |
| 18 | 29 | No | DBM, EBM | 6 |
| Category | Metabolites | p-Value | Group Effect | Significance |
|---|---|---|---|---|
| Bile Acids | Primary Bile Acids: Cholate Conjugated Bile Acids Taurocholic acid Glycocholic acid | >0.05 0.043 0.047 | - C1 = C2 C1 > C2 | Increased presence of conjugated bile acids in the stool may be due to diminished absorption to enterocytes and decreased deconjugation by enteral microbes. |
| Neurotransmitters | Serotonin Pathway: Tryptophan 5-HT Serotonin Dopamine GABA | 0.047 0.17 0.82 0.4 0.001 | C1 < C2 C1 < C2 C1 = C2 C1 < C2 C1 < C2 | Decreased tryptophan in C1 but with equivalent serotonin is suggestive that enterocytes and gut microbes have altered their use of tryptophan or have a level of impairment of this pathway. May indicate decreased production or release from enterocytes into the GI tract or perturbations of GABA producing microbes. Overall changes suggest alteration of gut-brain axis and possible implications for neurodevelopment. |
| Amino Acids | Glutamine Ornithine | >0.05 0.001 | C1 < C2 C1 > C2 | Suggestive of increased transport into or use by enterocytes. Suggestive of impaired uptake by enterocytes. Implies possibility of growth impairment. |
| Microbial | Shikimate | 0.043 | C1 < C2 | Present only within bacteria. Diminished in C1 due to antibiotics. |
© 2020 by the authors. Licensee MDPI, Basel, Switzerland. This article is an open access article distributed under the terms and conditions of the Creative Commons Attribution (CC BY) license (http://creativecommons.org/licenses/by/4.0/).
Share and Cite
Patton, L.; Li, N.; Garrett, T.J.; Ruoss, J.L.; Russell, J.T.; de la Cruz, D.; Bazacliu, C.; Polin, R.A.; Triplett, E.W.; Neu, J. Antibiotics Effects on the Fecal Metabolome in Preterm Infants. Metabolites 2020, 10, 331. https://0-doi-org.brum.beds.ac.uk/10.3390/metabo10080331
Patton L, Li N, Garrett TJ, Ruoss JL, Russell JT, de la Cruz D, Bazacliu C, Polin RA, Triplett EW, Neu J. Antibiotics Effects on the Fecal Metabolome in Preterm Infants. Metabolites. 2020; 10(8):331. https://0-doi-org.brum.beds.ac.uk/10.3390/metabo10080331
Chicago/Turabian StylePatton, Laura, Nan Li, Timothy J. Garrett, J. Lauren Ruoss, Jordan T. Russell, Diomel de la Cruz, Catalina Bazacliu, Richard A. Polin, Eric W. Triplett, and Josef Neu. 2020. "Antibiotics Effects on the Fecal Metabolome in Preterm Infants" Metabolites 10, no. 8: 331. https://0-doi-org.brum.beds.ac.uk/10.3390/metabo10080331