Untargeted Metabolomics Analysis Using FTIR and UHPLC-Q-Orbitrap HRMS of Two Curculigo Species and Evaluation of Their Antioxidant and α-Glucosidase Inhibitory Activities


Abstract
:
1. Introduction
2. Results
3. Discussion
4. Materials and Methods
4.1. Chemicals and Reagents
4.2. Plant Material
4.3. Sample Preparation
4.4. Determination of Total Phenolics
4.5. Determination of Total Flavonoids
4.6. Antioxidant Activity by DPPH Method
4.7. α-Glucosidase Enzyme Inhibition Assay
4.8. Measurement of FTIR Spectrum
4.9. Identification of Metabolites by UHPLC-Q-Orbitrap HRMS
4.10. Data Analysis
5. Conclusions
Supplementary Materials
Author Contributions
Funding
Institutional Review Board Statement
Informed Consent Statement
Data Availability Statement
Acknowledgments
Conflicts of Interest
References
- Ishak, N.A.; Ismail, M.; Hamid, M.; Ahmad, Z.; Abd Ghafar, S.A. Antidiabetic and hypolipidemic activities of Curculigo latifolia fruit: Root extract in high fat fed diet and low dose STZ induced diabetic rats. J. Evid. Based Complement. Altern. Med. 2013, 2013, 601838. [Google Scholar] [CrossRef] [Green Version]
- Farzinebrahimi, R.; Mat Taha, R.; Rashid, K.A.; Ali Ahmed, B.; Danaee, M.; Rozali, S.E. Preliminary screening of antioxidant and antibacterial activities and establishment of an efficient callus induction in Curculigo latifolia Dryand (Lemba). J. Evid. Based Complement. Altern. Med. 2016, 2016, 6429652. [Google Scholar] [CrossRef] [Green Version]
- Yokosuka, A.; Sato, K.; Yamori, T.; Mimaki, Y. Triterpene glycosides from Curculigo orchioides and their cytotoxic activity. J. Nat. Prod. 2010, 73, 1102–1106. [Google Scholar] [CrossRef] [PubMed]
- Wang, Z.H.; Gong, X.Y.; Zhou, D.J.; Xu, P.F.; Huang, M.; Zhang, Q.L.; Meng, Y.L.; Niu, C.; Zhang, Y.R. Three new chlorophenolic glucosides from Curculigo orchioides Gaertn. Phytochem. Lett. 2018, 26, 9–11. [Google Scholar] [CrossRef]
- Zuo, A.X.; Shen, Y.; Jiang, Z.Y.; Zhang, X.M.; Zhou, J.; Lü, J.; Chen, J.J. Three new phenolic glycosides from Curculigo orchioides G. Fitoterapia 2010, 81, 910–913. [Google Scholar] [CrossRef] [PubMed]
- Zabidi, N.A.; Ishak, N.A.; Hamid, M.; Efliza Ashari, S. Subcritical water extraction of antioxidants from Curculigo latifolia root. J. Chem. 2019, 2019, 8047191. [Google Scholar] [CrossRef]
- Sales, P.M.; Souza, P.M.; Simeoni, L.A.; Silveira, D. α-Amylase inhibitors: A review of raw material and isolated compounds from plant source. J. Pharm. Pharm. Sci. 2012, 15, 141–183. [Google Scholar] [CrossRef] [Green Version]
- Nie, Y.; Dong, X.; He, Y.; Yuan, T.; Han, T.; Rahman, K.; Qin, L.; Zhang, Q. Medicinal plants of genus Curculigo: Traditional uses and a phytochemical and ethnopharmacological review. J. Ethnopharmacol. 2013, 147, 547–563. [Google Scholar] [CrossRef]
- Kramberger, K.; Barlič-Maganja, D.; Bandelj, D.; Baruca Arbeiter, A.; Peeters, K.; Miklavčič Višnjevec, A.; Jenko Pražnikar, Z. HPLC-DAD-ESI-QTOF-MS determination of bioactive compounds and antioxidant activity comparison of the hydroalcoholic and water extracts from two Helichrysum italicum species. Metabolites 2020, 10, 403. [Google Scholar] [CrossRef]
- Lim, V.; Gorji, S.G.; Daygon, V.D.; Fitzgerald, M. Untargeted and targeted metabolomic profiling of Australian indigenous fruits. Metabolites 2020, 10, 114. [Google Scholar] [CrossRef] [Green Version]
- Dong, X.; Guo, Y.; Xiong, C.; Sun, L. Evaluation of two major Rhodiola species and the systemic changing characteristics of metabolites of Rhodiola crenulata in different altitudes by chemical methods combined with UPLC-QqQ-MS-based metabolomics. Molecules 2020, 25, 4062. [Google Scholar] [CrossRef]
- Bystrzanowska, M.; Tobiszewski, M. Chemometrics for selection, prediction, and classification of sustainable solutions for green chemistry—A review. Symmetry 2020, 12, 2055. [Google Scholar] [CrossRef]
- Stocchero, M.; Locci, E.; d’Aloja, E.; Nioi, M.; Baraldi, E.; Giordano, G. PLS2 in metabolomics. Metabolites 2019, 9, 51. [Google Scholar] [CrossRef] [PubMed] [Green Version]
- Kim, T.J.; Park, J.G.; Ahn, S.K.; Kim, K.W.; Choi, J.; Kim, H.Y.; Ha, S.H.; Seo, W.D.; Kim, J.K. Discrimination of Adzuki bean (Vigna angularis) geographical origin by targeted and non-targeted metabolite profiling with gas chromatography time-of-flight mass spectrometry. Metabolites 2020, 10, 112. [Google Scholar] [CrossRef] [PubMed] [Green Version]
- Hawrył, A.; Hawrył, M.; Hajnos-Stolarz, A.; Abramek, J.; Bogucka-Kocka, A.; Komsta, Ł. HPLC fingerprint analysis with the antioxidant and cytotoxic activities of selected lichens combined with the chemometric calculations. Molecules 2020, 25, 4301. [Google Scholar] [CrossRef] [PubMed]
- Albergaria, E.T.; Oliveira, A.F.M.; Albuquerque, U.P. The effect of water deficit stress on the composition of phenolic compounds in medicinal plants. S. Afr. J. Bot. 2020, 131, 12–17. [Google Scholar] [CrossRef]
- Sirooeinejad, B.; Zamani, Z.; Fatahi, M.R. Study of physiological and biochemical responses to freezing stress in pomegranate (Punica granatum L.) trees during acclimation and deaclimation cycle. J. Hortic. Sci. Biotechnol. 2019, 95, 341–355. [Google Scholar] [CrossRef]
- Groenbaek, M.; Tybirk, E.; Neugart, S.; Sundekilde, U.K.; Schreiner, M.; Kristensen, H.L. Flavonoid glycosides and hydroxycinnamic acid derivatives in baby leaf rapeseed from white and yellow flowering cultivars with repeated harvest in a 2-years field study. Front. Plant Sci. 2019, 10, 355. [Google Scholar] [CrossRef] [PubMed]
- Hashim, A.M.; Alharbi, B.M.; Abdulmajeed, A.M.; Elkelish, A.; Hozzein, W.N.; Hassan, H.M. Oxidative stress responses of some endemic plants to high altitudes by intensifying antioxidants and secondary metabolites content. Plants 2020, 9, 869. [Google Scholar] [CrossRef]
- Costa, T.M.; Mayer, D.A.; Siebert, D.A.; Micke, G.A.; Alberton, M.D.; Tavares, L.B.B.; de Oliveira, D. Kinetics analysis of the inhibitory effects of alpha-glucosidase and identification of compounds from Ganoderma lipsiense Mycelium. Appl. Biochem. Biotechnol. 2020, 10, 1007. [Google Scholar] [CrossRef]
- Tacchini, M.; Spagnoletti, A.; Marieschi, M.; Caligiani, A.; Bruni, R.; Efferth, T.; Sacchetti, G.; Guerrini, A. Phytochemical profile and bioactivity of traditional ayurvedic decoctions and hydro-alcoholic macerations of Boerhaavia diffusa L. and Curculigo orchioides Gaertn. Nat. Prod. Res. 2015, 29, 2071–2079. [Google Scholar] [CrossRef]
- Alqahtani, A.S.; Hidayathulla, S.; Rehman, M.T.; ElGamal, A.A.; Al-Massarani, S.; Razmovski-Naumovski, V.; Alqahtani, M.S.; El Dib, R.A.; AlAjmi, M.F. Alpha-amylase and alpha-glucosidase enzyme inhibition and antioxidant potential of 3-Oxolupenal and katononic acid isolated from Nuxia oppositifolia. Biomolecules 2020, 10, 61. [Google Scholar] [CrossRef] [PubMed] [Green Version]
- Anacleto-Santos, J.; López-Camacho, P.; Mondragón-Flores, R.; Vega-Ávila, E.; Islas, G.B.; Mondragón-Castelán, M.; Carrasco-Ramírez, E.; Rivera-Fernández, N. Anti-toxoplasma, antioxidant and cytotoxic activities of Pleopeltis crassinervata (Fée) T. Moore hexane fraction. Saudi J. Biol. Sci. 2020, 27, 812–819. [Google Scholar] [CrossRef]
- Craft, B.D.; Kerrihard, A.L.; Amarowicz, R.; Pegg, R.B. Phenol-based antioxidants and the in vitro methods used for their assessment. Compr. Rev. Food Sci. Food Saf. 2012, 11, 148–173. [Google Scholar] [CrossRef]
- Shu, P.; Li, J.; Fei, Y.; Zhu, H.; Yu, M.; Liu, A.; Niu, H.; Zou, S.; Wei, X.; Ju, Z.; et al. Isolation, structure elucidation, tyrosinase inhibitory, and antioxidant evaluation of the constituents from Angelica dahurica roots. J. Nat. Med. 2020, 74, 456–462. [Google Scholar] [CrossRef] [PubMed]
- Teng, H.; Yuan, B.; Gothai, S.; Arulselvan, P.; Song, X.; Chen, L. Dietary triterpenes in the treatment of type 2 diabetes: To date. Trends Food Sci. Technol. 2018, 72, 34–44. [Google Scholar] [CrossRef]
- Kakar, M.; Amin, M.U.; Alghamdi, S.; Sahibzada, M.U.K.; Ahmad, N.; Ullah, N. Antimicrobial, cytotoxic, and antioxidant potential of a novel flavone “6,7,4′-Trimethyl Flavone” isolated from Wulfenia amherstiana. J. Evid. Based Complement. Altern. Med. 2020, 2020, 3903682. [Google Scholar] [CrossRef] [PubMed]
- Saleh, M.S.M.; Siddiqui, M.J.; Mat So’ad, S.Z.; Roheem, F.O.; Saidi-Besbes, S.; Khatib, A. Correlation of FT-IR fingerprint and α-glucosidase inhibitory activity of salak (Salacca zalacca) fruit extracts utilizing orthogonal partial least square. Molecules 2018, 23, 1434. [Google Scholar] [CrossRef] [Green Version]
- Xu, Z.; Meenu, M.; Chen, P.; Xu, B. Comparative study on phytochemical profiles and antioxidant capacities of chestnuts produced in different geographic area in China. Antioxidants 2020, 9, 190. [Google Scholar] [CrossRef] [Green Version]
- Daliri, E.B.-M.; Ofosu, F.K.; Chelliah, R.; Kim, J.H.; Kim, J.R.; Yoo, D.; Oh, D.H. Untargeted metabolomics of fermented rice using UHPLC Q-TOF MS/MS reveals an abundance of potential antihypertensive compounds. Foods 2020, 9, 1007. [Google Scholar] [CrossRef]
- He, Y.; Dong, X.; Jia, X.; Li, M.; Yuan, T.; Xu, H.; Qin, L.; Han, T.; Zhang, Q. Qualitative and quantitative analysis on chemical constituents from Curculigo orchioides using ultra high performance liquid chromatography coupled with electrospray ionization quadrupole time-of-flight tandem mass spectrometry. J. Pharm. Biomed. Anal. 2015, 102, 236–245. [Google Scholar] [CrossRef] [PubMed]
- Saha, N.; Trivedi, P.; Dutta Gupta, S. Surface plasmon resonance (SPR) based optimization of biosynthesis of silver nanoparticles from rhizome extract of Curculigo orchioides Gaertn. and its antioxidant potential. J. Clust. Sci. 2016, 27, 1893–1912. [Google Scholar] [CrossRef]
- Xu, M.; Shen, C.; Zheng, H.; Xu, Y.; Xue, C.; Zhu, B.; Hu, J. Metabolomic analysis of acerola cherry (Malpighia emarginata) fruit during ripening development via UPLC-Q-TOF and contribution to the antioxidant activity. Food Res. Int. 2020, 130, 108915. [Google Scholar] [CrossRef] [PubMed]
- Ghane, S.; Attar, U.; Yadav, P.; Lekhak, M. Antioxidant, anti-diabetic, acetylcholinesterase inhibitory potential and estimation of alkaloids (lycorine and galanthamine) from Crinum species: An important source of anticancer and anti-alzheimer drug. Ind. Crops. Prod. 2018, 125, 168–177. [Google Scholar] [CrossRef]
- Batsukh, Z.; Toume, K.; Javzan, B.; Kazuma, K.; Cai, S.Q.; Hayashi, S.; Kawahara, N.; Maruyama, T.; Komatsu, K. Metabolomic profiling of Saposhnikoviae radix from Mongolia by LC-IT-TOF-MS/MS and multivariate statistical analysis. J. Nat. Med. 2020, 74, 170–188. [Google Scholar] [CrossRef]
- Rohaeti, E.; Rafi, M.; Syafitri, U.D.; Heryanto, R. Fourier transform infrared spectroscopy combined with chemometrics for discrimination of Curcuma longa, Curcuma xanthorrhiza and Zingiber cassumunar. Spectrochim. Acta A Mol. Biomol. Spectrosc. 2015, 137, 1244–1249. [Google Scholar] [CrossRef]
- Tsiokanos, E.; Tsafantakis, N.; Termentzi, A.; Aligiannis, N.; Skaltsounis, L.A.; Fokialakis, N. Phytochemical characteristics of bergamot oranges from the Ionian Islands of Greece: A multi-analytical approach with emphasis in the distribution of neohesperidose flavanones. Food Chem. 2020, 128400. [Google Scholar] [CrossRef]
- Garza-Juárez, A.; de la Luz Salazar-Cavazos, M.; Salazar-Aranda, R.; Pérez-Meseguer, J.; de Torres, N.W. Correlation between chromatographic fingerprint and antioxidant activity of Turnera diffusa (Damiana). Planta Med. 2011, 77, 958–963. [Google Scholar] [CrossRef]
- Innamorato, V.; Longobardi, F.; Lippolis, V.; Cortese, M.; Logrieco, A.F.; Catucci, L.; Agostiano, A.; De Girolamo, A. Tracing the geographical origin of lentils (Lens culinaris Medik.) by infrared spectroscopy and chemometrics. Food Anal. Methods 2019, 12, 773–779. [Google Scholar] [CrossRef]
- Easmin, S.; Sarker, M.Z.I.; Ghafoor, K.; Ferdosh, S.; Jaffri, J.; Ali, M.E.; Mirhosseini, H.; Al-Juhaimi, F.Y.; Perumal, V.; Khatib, A. Rapid investigation of α-glucosidase inhibitory activity of Phaleria macrocarpa extracts using FTIR-ATR based fingerprinting. J. Food Drug Anal. 2017, 25, 306–315. [Google Scholar] [CrossRef]
- Sánchez-Marzo, N.; Lozano-Sánchez, J.; de la Luz Cádiz-Gurrea, M.; Herranz-López, M.; Micol, V.; Segura-Carretero, A. Relationships between chemical structure and antioxidant activity of isolated phytocompounds from lemon verbena. Antioxidants 2019, 8, 324. [Google Scholar] [CrossRef] [PubMed] [Green Version]
- Margraf, T.; Karnopp, A.R.; Rosso, N.D.; Granato, D. Comparison between Folin-Ciocalteu and Prussian Blue Assays to estimate the total phenolic content of juices and teas using 96-well microplates. J. Food Sci. 2015, 80, C2397–C2403. [Google Scholar] [CrossRef] [PubMed]
- Zhu, M.Z.; Wu, W.; Jiao, L.L.; Yang, P.F.; Guo, M.Q. Analysis of flavonoids in lotus (Nelumbo nucifera) leaves and their antioxidant activity using macroporous resin chromatography coupled with LC-MS/MS and antioxidant biochemical assays. Molecules 2015, 20, 10553–10565. [Google Scholar] [CrossRef] [PubMed] [Green Version]
- Ananthi, S.; Raghavendran, H.R.B.; Sunil, A.G.; Gayathri, V.; Ramakrishnan, G.; Vasanthi, H.R. In vitro antioxidant and in vivo anti-inflammatory potential of crude polysaccharide from Turbinaria ornata (marine brown alga). Food Chem. Toxicol. 2010, 48, 187–192. [Google Scholar] [CrossRef] [PubMed]
- Hamid, H.A.; Yusoff, M.M.; Liu, M.; Karim, M.R. α-Glucosidase and α-amylase inhibitory constituents of Tinospora crispa: Isolation and chemical profile confirmation by ultra-high performance liquid chromatography-quadrupole time-of-flight/mass spectrometry. J. Funct. Foods 2015, 16, 74–80. [Google Scholar] [CrossRef] [Green Version]
- Li, C.; Tu, C.; Che, Y.; Zhang, M.; Dong, B.; Zhou, X.; Shi, Y.; Li, G.; Wang, J. Bioassay based screening for the antiplatelet aggregation quality markers of Polygonum multiflorum with UPLC and chemometrics. J. Pharm. Biomed. Anal. 2019, 166, 264–272. [Google Scholar] [CrossRef]
- Hemmer, S.; Manier, S.K.; Fischmann, S.; Westphal, F.; Wagmann, L.; Meyer, M.R. Comparison of three untargeted data processing workflows for evaluating LC-HRMS metabolomics data. Metabolites 2020, 10, 378. [Google Scholar] [CrossRef]


| Sample Species | Regency (District) | Coordinate | Organ | Sample Code | Collection Time | Season | Altitude (MASL) |
|---|---|---|---|---|---|---|---|
| C. orchioides | Barru (Mallawa) | 4°12′00′′ S 19°38′31′′E | Rhizome Leaves | ROBM LOBM | July 2018 | Dry | 14 |
| Maros (Bengo-bengo) | 5°00′09′′ S 19°45′56′′ E | Rhizome Leaves | ROMB LOMB | July 2018 | Dry | 462 | |
| Gowa (Malakaji) | 5°26′06′′ S 19°50′12′′ E | Rhizome Leaves | ROGM LOGM | July 2018 | Dry | 750 | |
| C. latifolia | Sinjai (Palangka) | 5°18′04′′ S 20°06′33′′ E | Rhizome Leaves Petiole | RLSP LLSP PLSP | July 2018 | Dry | 483 |
| Sinjai (Biji Nangka) | 5°18′43′′ S 120°05′25′′ E | Rhizome Leaves Petiole | RLSB LLSB PLSB | February 2019 | Rainy | 640 | |
| Sinjai (Puncak) | 5°13′25′′ S 120°02′46′′ E | Rhizome Leaves Petiole | RLSK LLSK PLSK | February 2019 | Rainy | 959 |
| Sample Code | Total Phenolics (mgGAE/g) | Total Flavonoids (mgQE/g) | IC50 (mg/mL Extract) | |
|---|---|---|---|---|
| Antioxidant (DPPH) | α-Glucosidase Inhibitory | |||
| ROBM | 242.58 ± 0.49 e | 0.85 ± 0.01 a | 71.09 ± 2.25 b | 537.82 ± 6.87 h |
| ROMB | 288.20 ± 0.90 h | 0.89 ± 0.01 a | 102.93 ± 0.53 c | 522.00 ± 5.32 h |
| ROGM | 254.66 ± 0.44 f | 0.82 ± 0.01 a | 165.54 ± 1.26 e | 434.65 ± 5.55 fg |
| RLSP | 429.63 ± 0.42 l | 0.88 ± 0.02 a | 52.30 ± 0.07 a | 378.39 ± 8.17 cde |
| RLSB | 435.98 ± 0.32 m | 1.37 ± 0.01 b | 50.68 ± 0.41 a | 182.73 ± 3.87 a |
| RLSK | 452.47 ± 0.12 n | 1.57 ± 0.01 c | 47.08 ± 1.35 a | 155.25 ± 0.68 a |
| LOBM | 303.38 ± 0.95 j | 5.10 ± 0.01 h | 165.84 ± 0.57 e | 553.38 ± 12.22 h |
| LOMB | 170.90 ± 0.95 c | 2.72 ± 0.01 d | 161.44 ± 4.82 e | 349.14 ± 4.09 bd |
| LOGM | 194.22 ± 0.80 d | 5.44 ± 0.01 i | 205.89 ± 4.31 f | 349.93 ± 4.17 bd |
| LLSP | 168.95 ± 0.44 c | 4.21 ± 0.03 e | 363.12 ± 4.00 h | 325.45 ± 2.89 b |
| LLSB | 142.09 ± 0.63 a | 4.85 ± 0.01 g | 473.04 ± 0.12 j | 328.82 ± 21.48 bc |
| LLSK | 151,86 ± 1.16 b | 4.41 ± 0.01 f | 447.70 ± 0.76 i | 300.02 ± 0.97 b |
| PLSP | 278.23 ± 0.24 g | 4.39 ± 0.04 f | 140.45 ± 0.79 d | 462.72 ± 23.22 g |
| PLSB | 331.83 ± 0.42 k | 4.85 ± 0.01 g | 223.88 ± 0.91 g | 397.56 ± 11.19 df |
| PLSK | 229.35 ± 0.53 i | 4.18 ± 0.02 e | 213.23 ± 1.24 fg | 404.43 ± 2.53 ef |
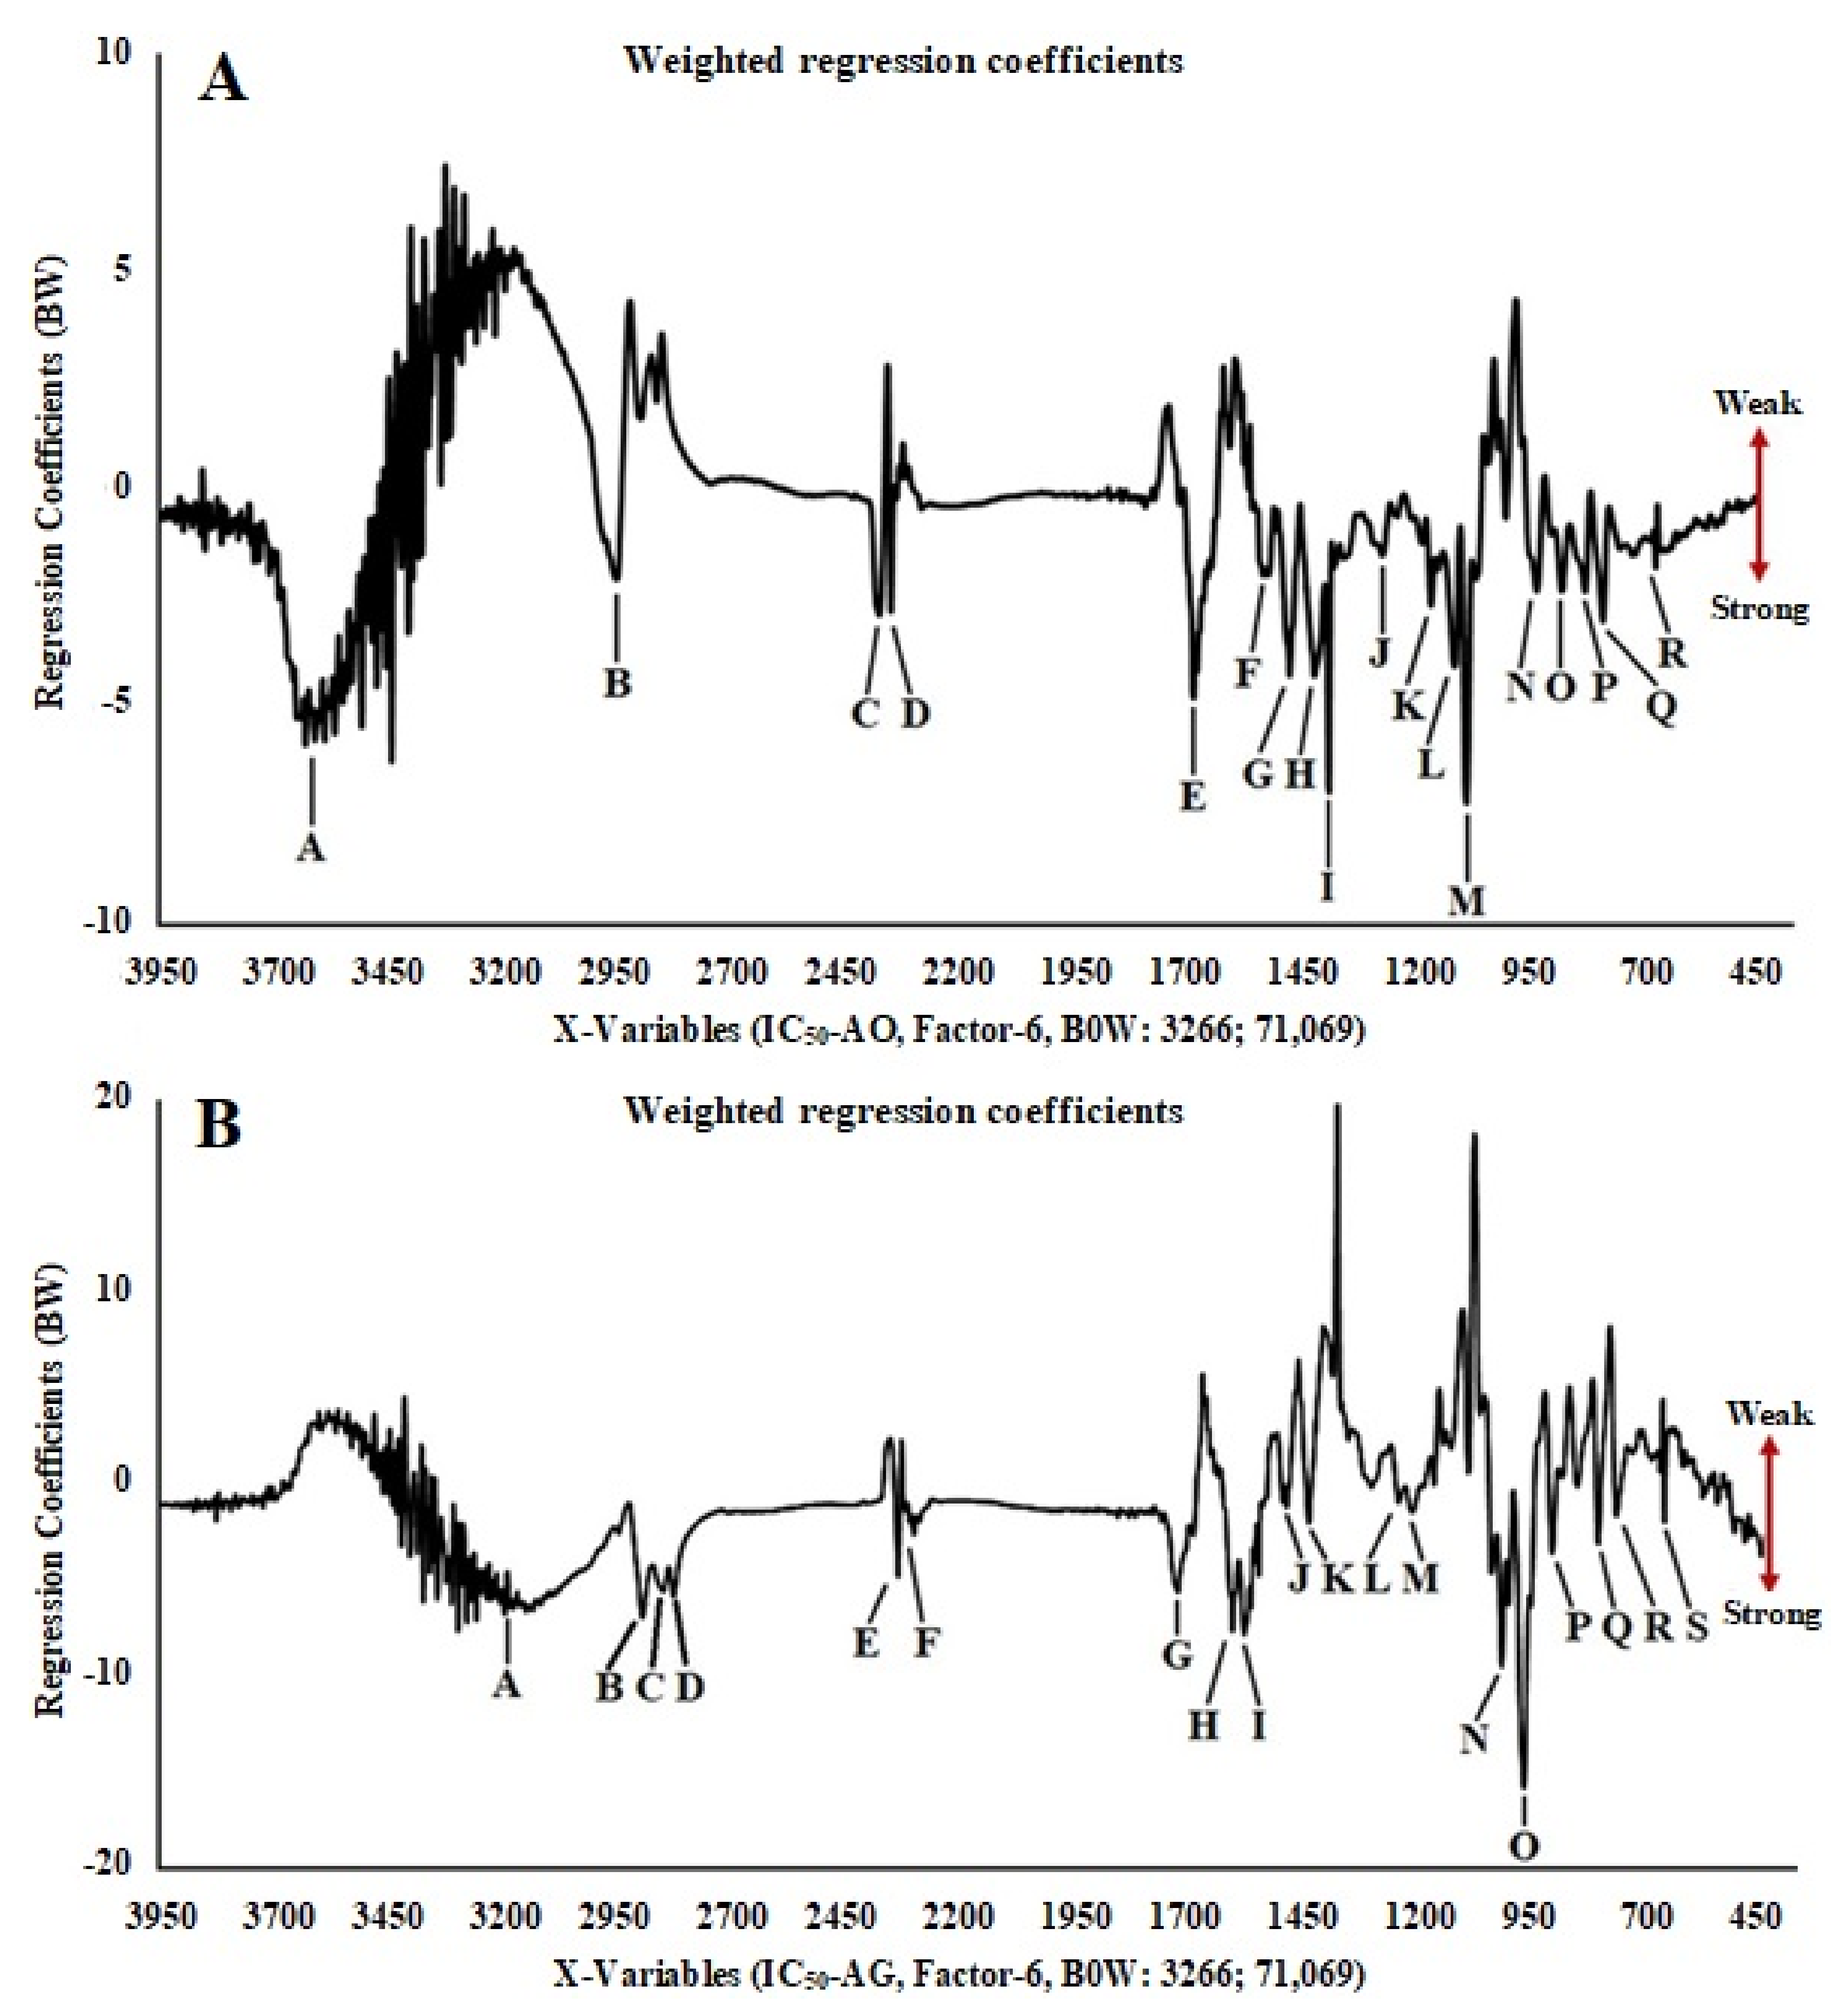
| In Vitro Assay | Peak Code | Wavenumber (cm−1) | Functional Group | Vibration Mode |
|---|---|---|---|---|
| Antioxidant activity | A | 3606.638 | O–H | Stretching |
| B | 2945.009 | C–H | Stretching | |
| C | 2370.352 | O=C=O, N–H | Stretching | |
| D | 2345.2 | O=C=O | Stretching | |
| E | 1681.812 | C=O | Stretching | |
| F | 1527.517 | C=C (aromatic) | Stretching | |
| G | 1471.584 | O–H | Bending | |
| H | 1417.582 | –C–H (CH3) | Bending | |
| I | 1384.795 | C–O | Bending | |
| J | 1267.145 | C–O (OH, COOH) | Bending | |
| K | 1162.996 | C–C | Bending | |
| L | 1108.993 | C–O | Stretching (aliphatic of ether) | |
| M | 1083.92 | C–O | Stretching (secondary alcohol) | |
| N | 933.483 | –C–H (alkene) | Bending (trans disubtituen) | |
| O | 875.622 | –C–H (aromatic) | Bending | |
| P | 821.619 | –C–H (aromatic) | Bending (trisubtituen) | |
| Q | 784.974 | C–Cl | Bending | |
| R | 669.253 | C–X (halogen) | Halogen and aromatic disubtituen | |
| α-glucosidase inhibitory activity | A | 3170.755 | O–H | Stretching |
| B | 2916.169 | C–H | Stretching | |
| C | 2869.881 | C–H | Stretching | |
| D | 2842.879 | C–H | Stretching | |
| E | 2352.994 | O=C=O | Stretching | |
| F | 2318.277 | N–H, O–H, S–H | Streching | |
| G | 1737.744 | C=O | Stretching | |
| H | 1616.237 | N–H (NH2) | Bending | |
| C=C (alkene) | Stretching | |||
| I | 1591.164 | C=C (aromatic) | Streching | |
| J | 1496.658 | C=N, N=O | Bending | |
| C=C (alkene) | Stretching | |||
| K | 1448.441 | –C–H (–CH3) | Bending | |
| L | 1251.715 | C–O | Stretching | |
| M | 1220.857 | C–O | Stretching | |
| N | 1024.131 | C–N | Stretching | |
| O | 975.914 | C–H | Bending | |
| P | 914.196 | C–N | Bending | |
| Q | 811.976 | C–H | Bending | |
| R | 775.437 | C–Cl | Stretching | |
| S | 665.396 | C–X (halogen) | Halogen and aromatic disubtituen |
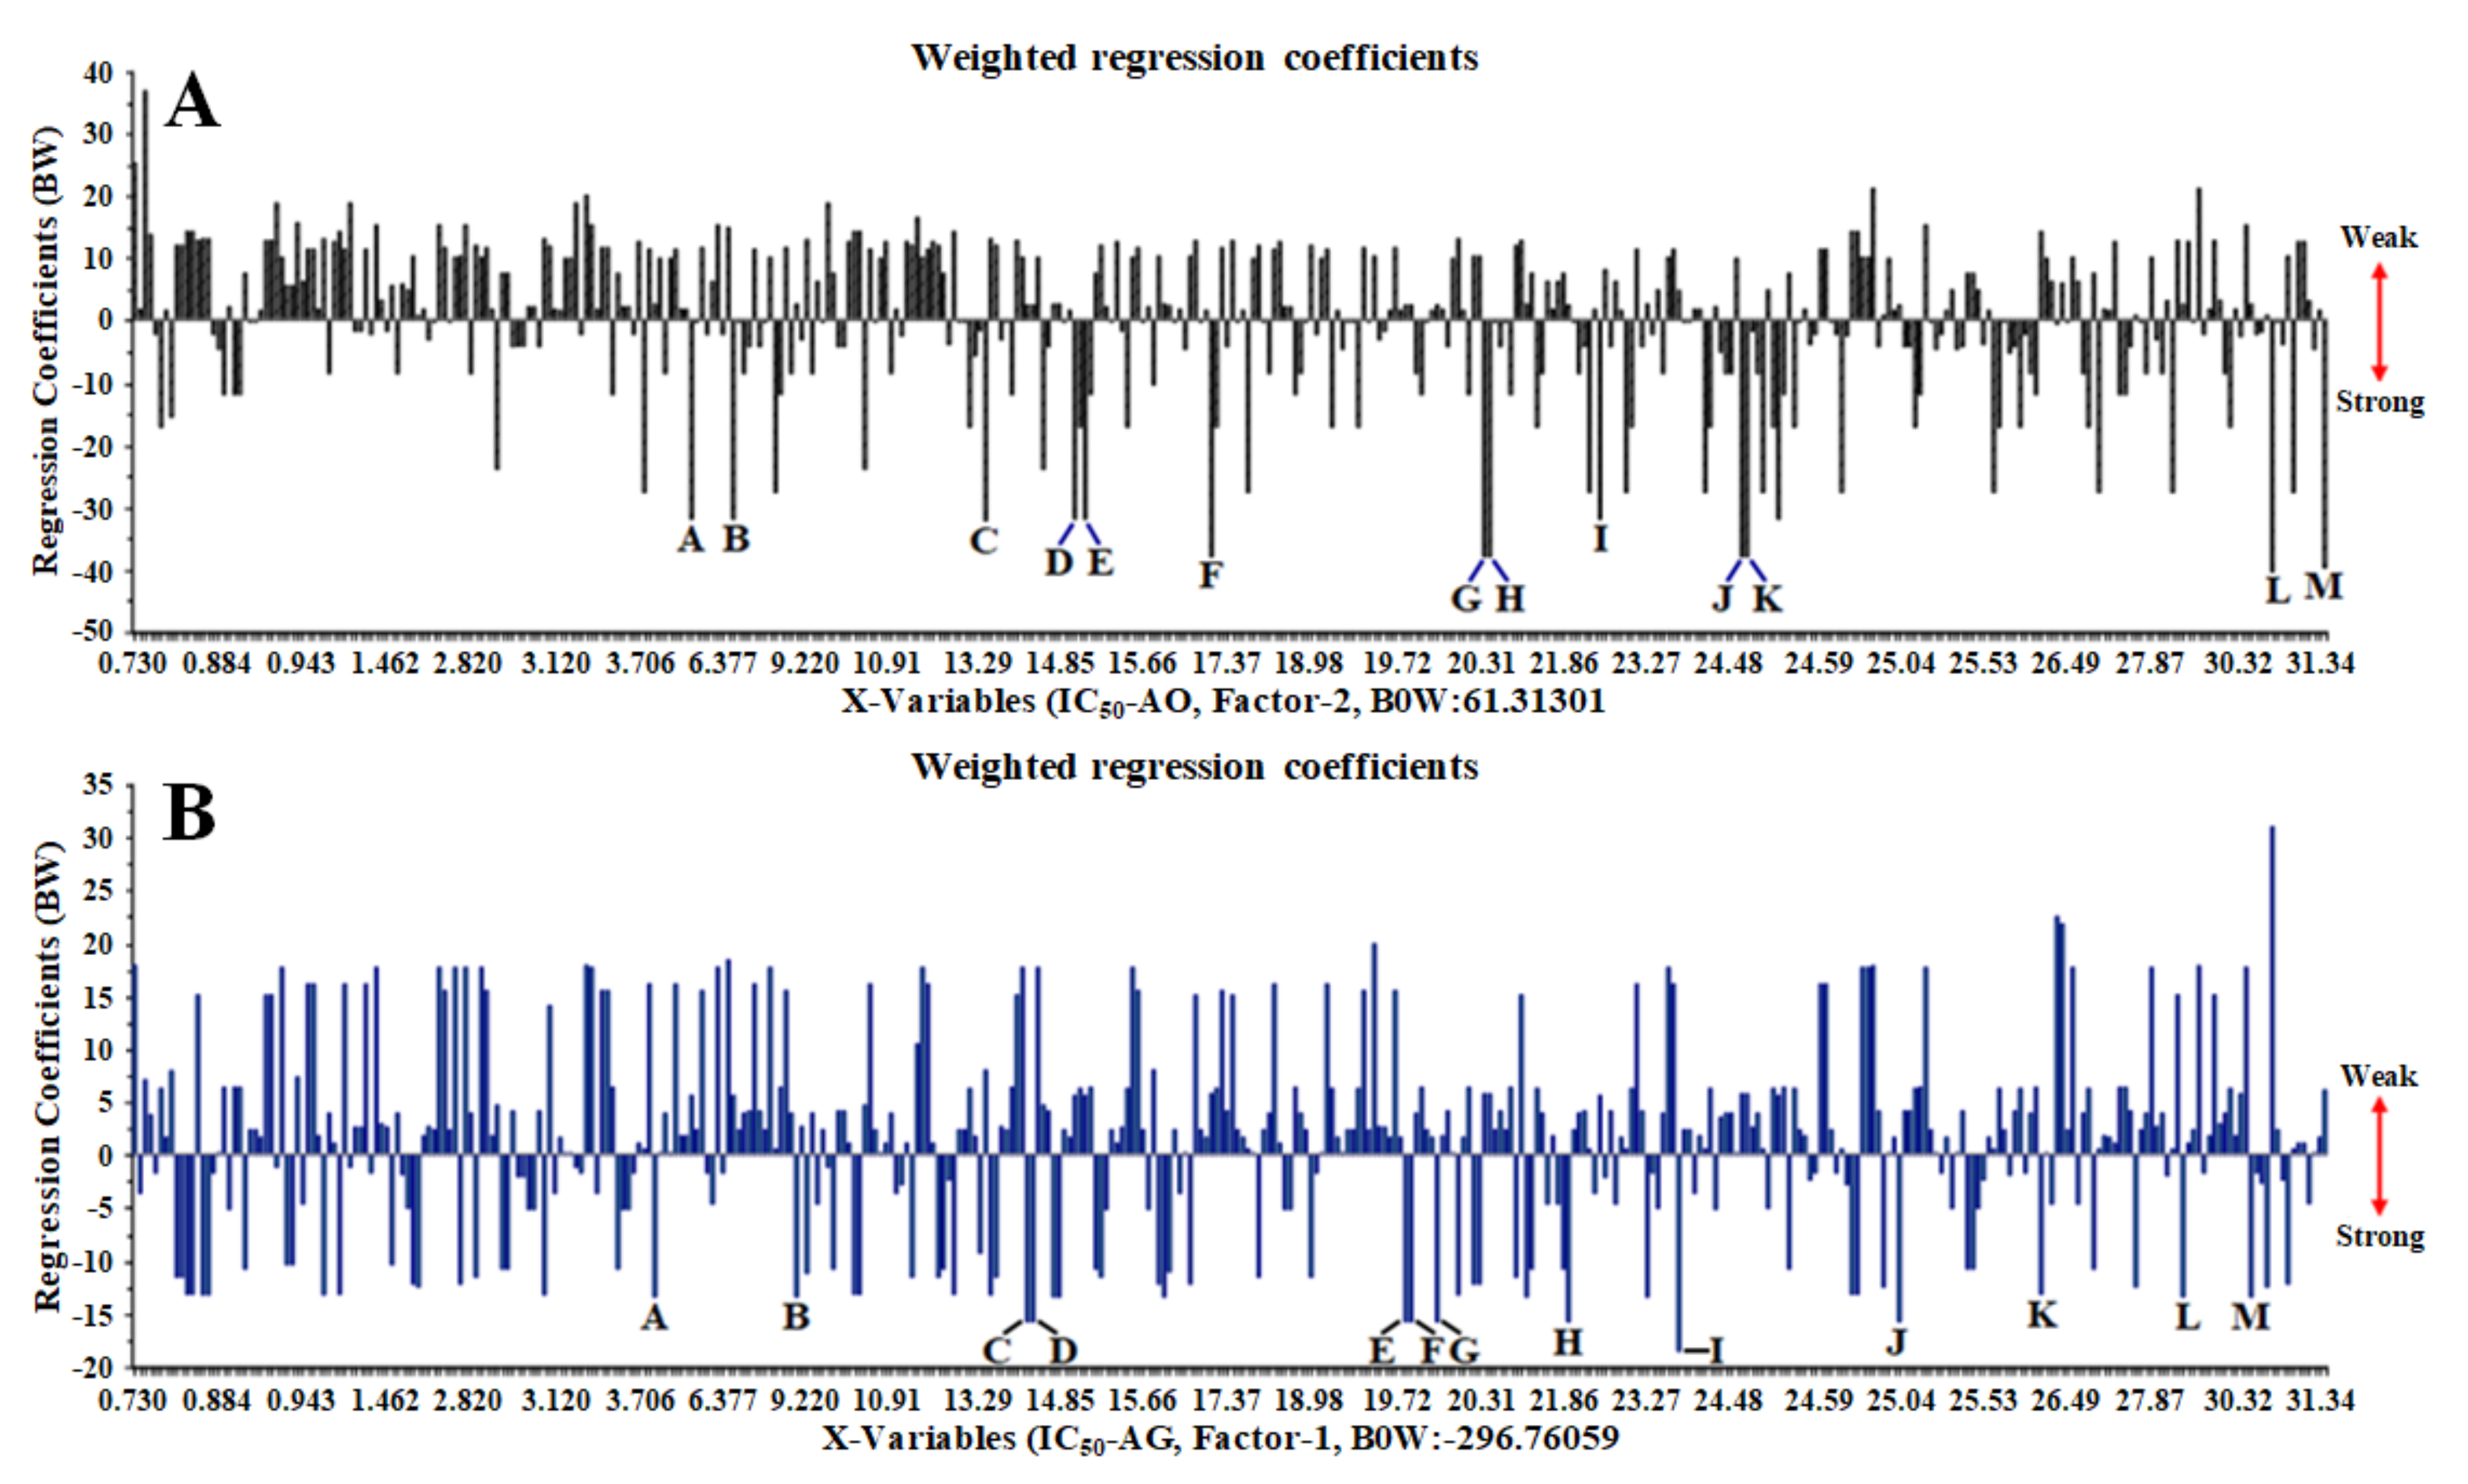
| Peak Code | RT [min] | BW | Type | Metabolite Name | Formula | Chemical Type |
|---|---|---|---|---|---|---|
| Antioxidant Activity | ||||||
| A | 5.945 | −31.8958 | [M + H]+ | Curculigoside B | C21H24O11 | Phenolic glycosides |
| B | 6.680 | −31.8958 | [M + H]+ | Unknown-173 | C6H10O13 | - |
| C | 13.320 | −32.1579 | [M − H]− | Unknown-99 | C37H39N14O20 | - |
| D | 14.930 | −31.8958 | [M + H]+ | Unknown-176 | C15H13O8 | - |
| E | 15.050 | −31.8958 | [M − H]− | Unknown-175 | C26H35O16 | - |
| F | 16.848 | −37.8736 | [M + H]+ | (1S,2R)-O-Methylnyasicoside | C24H28O11 | Norlignan |
| G | 20.320 | −37.8736 | [M − H]− | 1,1-Bis(3,4-dihydroxyphenyl-1-(2-furan)-methane | C17H14O5 | Norlignan |
| H | 20.320 | −37.8736 | [M − H]− | Curculigosaponin G | C18H18O6 | Cycloartane (Triterpene) |
| I | 22.410 | −31.8958 | [M + H]+ | Unknown-179 | C47H49O | - |
| J | 24.506 | −37.8736 | [M − H]− | Curculigoside B | C21H24O11 | Phenolic glycosides |
| K | 24.506 | −37.8736 | [M − H]− | Orchioside B | C23H26O10 | Phenolic glycosides |
| L | 30.920 | −40.3125 | [M + H]+ | Unknown-185 | C47H59O7 | - |
| M | 31.435 | −39.7257 | [M − H]− | 2,4-Dichloro-5-methoxy-3-methylphenol | C8H8Cl2O2 | Phenolic |
| α-Glucosidase inhibitory | ||||||
| A | 4.060 | −13.3962 | [M + H]+ | Unknown-76 | C13H9O11 | - |
| B | 8.770 | −13.3962 | [M − H]− | Unknown-77 | C13H30N5O11 | - |
| C | 14.272 | −15.7379 | [M + H]+ | Orcinol glucoside | C13H18O7 | Phenolic glycosides |
| D | 14.272 | −15.7379 | [M + H]+ | 1,1-Bis(3,4-dihydroxyphenyl-1-(2-furan)-methane | C17H14O5 | Phenolic |
| E | 19.801 | −15.7379 | [M + H]+ | 5-Hydroxymethylfurfural | C6H6O3 | Aldehyde |
| F | 19.801 | −15.7379 | [M + H]+ | Curculigosaponin G | C42H70O13 | Cycloartane (Triterpene) |
| G | 20.049 | −15.7379 | [M + H]+ | Curculigosaponin I | C48H80O18 | Cycloartane (Triterpene) |
| H | 22.200 | −15.7379 | [M − H]− | Unknown-84 | C30H61O19 | - |
| I | 23.900 | −18.5262 | [M + H]+ | Unknown-85 | C42H51O6 | - |
| J | 25.040 | −15.7379 | [M + H]+ | Unknown-87 | C57H86N5O5 | - |
| K | 26.030 | −13.1626 | [M − H]− | Unknown-10 | C7H12NO12 | - |
| L | 29.010 | −13.3962 | [M + H]+ | Curculigosaponin H | C47H78O17 | Cycloartane (Triterpene) |
| M | 30.901 | −13.3962 | [M − H]− | Unknown-88 | C54H68O2 | - |
Publisher’s Note: MDPI stays neutral with regard to jurisdictional claims in published maps and institutional affiliations. |
© 2021 by the authors. Licensee MDPI, Basel, Switzerland. This article is an open access article distributed under the terms and conditions of the Creative Commons Attribution (CC BY) license (http://creativecommons.org/licenses/by/4.0/).
Share and Cite
Umar, A.H.; Ratnadewi, D.; Rafi, M.; Sulistyaningsih, Y.C. Untargeted Metabolomics Analysis Using FTIR and UHPLC-Q-Orbitrap HRMS of Two Curculigo Species and Evaluation of Their Antioxidant and α-Glucosidase Inhibitory Activities. Metabolites 2021, 11, 42. https://0-doi-org.brum.beds.ac.uk/10.3390/metabo11010042
Umar AH, Ratnadewi D, Rafi M, Sulistyaningsih YC. Untargeted Metabolomics Analysis Using FTIR and UHPLC-Q-Orbitrap HRMS of Two Curculigo Species and Evaluation of Their Antioxidant and α-Glucosidase Inhibitory Activities. Metabolites. 2021; 11(1):42. https://0-doi-org.brum.beds.ac.uk/10.3390/metabo11010042
Chicago/Turabian StyleUmar, Abdul Halim, Diah Ratnadewi, Mohamad Rafi, and Yohana Caecilia Sulistyaningsih. 2021. "Untargeted Metabolomics Analysis Using FTIR and UHPLC-Q-Orbitrap HRMS of Two Curculigo Species and Evaluation of Their Antioxidant and α-Glucosidase Inhibitory Activities" Metabolites 11, no. 1: 42. https://0-doi-org.brum.beds.ac.uk/10.3390/metabo11010042