
Sex-Specific Causal Relations between Steroid Hormones and Obesity—A Mendelian Randomization Study

 , , , , ,
Abstract
:
1. Introduction
2. Results
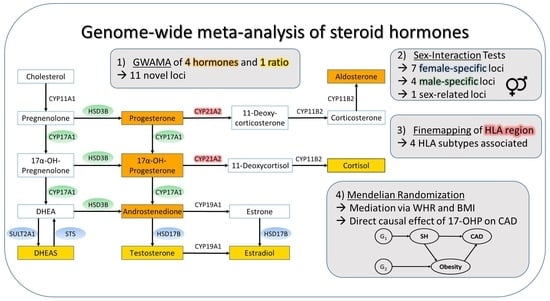
2.1. GWAMA
2.2. Fine-Mapping of the HLA Region
2.3. Mendelian Randomization
2.3.1. Causal Influence of Steroid Hormones on Obesity-Related Traits
2.3.2. Test for Reversed Causality of Obesity-Related Traits on Steroid Hormones
2.3.3. Causal Effect of Steroid Hormones on CAD and Mediation via Obesity Traits
3. Discussion
4. Materials and Methods
4.1. Cohort Description
4.2. Measurement of Steroid Hormones, Obesity Traits, and CAD
4.3. Genotyping, Imputation, and HLA Subtype Estimation
4.4. Statistical Analysis
4.4.1. GWAMA
4.4.2. HLA Association
4.4.3. Genetic Sex Interaction
4.4.4. Mendelian Randomization (MR)
Supplementary Materials
Author Contributions
Funding
Institutional Review Board Statement
Informed Consent Statement
Data Availability Statement
Acknowledgments
Conflicts of Interest
References
- van der Harst, P.; Verweij, N. Identification of 64 Novel Genetic Loci Provides an Expanded View on the Genetic Architecture of Coronary Artery Disease. Circ. Res. 2018, 122, 433–443. [Google Scholar] [CrossRef]
- Loley, C.; Alver, M.; Assimes, T.L.; Bjonnes, A.; Goel, A.; Gustafsson, S.; Hernesniemi, J.; Hopewell, J.C.; Kanoni, S.; Kleber, M.E.; et al. No Association of Coronary Artery Disease with X-Chromosomal Variants in Comprehensive International Meta-Analysis. Sci. Rep. 2016, 6, 35278. [Google Scholar] [CrossRef] [Green Version]
- Haast, R.A.M.; Gustafson, D.R.; Kiliaan, A.J. Sex differences in stroke. J. Cereb. Blood Flow Metab. 2012, 32, 2100–2107. [Google Scholar] [CrossRef] [PubMed] [Green Version]
- Iorga, A.; Cunningham, C.M.; Moazeni, S.; Ruffenach, G.; Umar, S.; Eghbali, M. The protective role of estrogen and estrogen receptors in cardiovascular disease and the controversial use of estrogen therapy. Biol. Sex Differ. 2017, 8, 33. [Google Scholar] [CrossRef] [PubMed]
- Di Giosia, P.; Giorgini, P.; Stamerra, C.A.; Petrarca, M.; Ferri, C.; Sahebkar, A. Gender Differences in Epidemiology, Pathophysiology, and Treatment of Hypertension. Curr. Atheroscler. Rep. 2018, 20, 13. [Google Scholar] [CrossRef]
- Xu, X.; Gao, B.; Guan, Q.; Zhang, D.; Ye, X.; Zhou, L.; Tong, G.; Li, H.; Zhang, L.; Tian, J.; et al. Metabolomic profile for the early detection of coronary artery disease by using UPLC-QTOF/MS. J. Pharm. Biomed. Anal. 2016, 129, 34–42. [Google Scholar] [CrossRef] [PubMed] [Green Version]
- Shufelt, C.; Bretsky, P.; Almeida, C.M.; Johnson, B.D.; Shaw, L.J.; Azziz, R.; Braunstein, G.D.; Pepine, C.J.; Bittner, V.; Vido, D.A.; et al. DHEA-S levels and cardiovascular disease mortality in postmenopausal women: Results from the National Institutes of Health—National Heart, Lung, and Blood Institute (NHLBI)-sponsored Women’s Ischemia Syndrome Evaluation (WISE). J. Clin. Endocrinol. Metab. 2010, 95, 4985–4992. [Google Scholar] [CrossRef]
- World Health Organization. Obesity-Preventing and Managing the Global Epidemic: Report on a WHO Consultation; World Health Organization: Geneva, Switzerland, 2000; ISBN 9789241208949. [Google Scholar]
- Palmer, B.F.; Clegg, D.J. The sexual dimorphism of obesity. Mol. Cell. Endocrinol. 2015, 402, 113–119. [Google Scholar] [CrossRef] [Green Version]
- Tchernof, A.; Brochu, D.; Maltais-Payette, I.; Mansour, M.F.; Marchand, G.B.; Carreau, A.-M.; Kapeluto, J. Androgens and the Regulation of Adiposity and Body Fat Distribution in Humans. Compr. Physiol. 2018, 8, 1253–1290. [Google Scholar] [CrossRef]
- Andreacchi, A.T.; Griffith, L.E.; Guindon, G.E.; Mayhew, A.; Bassim, C.; Pigeyre, M.; Stranges, S.; Anderson, L.N. Body mass index, waist circumference, waist-to-hip ratio, and body fat in relation to health care use in the Canadian Longitudinal Study on Aging. Int. J. Obes. 2021, 45, 666–676. [Google Scholar] [CrossRef]
- Mørkedal, B.; Romundstad, P.R.; Vatten, L.J. Informativeness of indices of blood pressure, obesity and serum lipids in relation to ischaemic heart disease mortality: The HUNT-II study. Eur. J. Epidemiol. 2011, 26, 457–461. [Google Scholar] [CrossRef] [Green Version]
- Pulit, S.L.; Stoneman, C.; Morris, A.P.; Wood, A.R.; Glastonbury, C.A.; Tyrrell, J.; Yengo, L.; Ferreira, T.; Marouli, E.; Ji, Y.; et al. Meta-analysis of genome-wide association studies for body fat distribution in 694 649 individuals of European ancestry. Hum. Mol. Genet. 2019, 28, 166–174. [Google Scholar] [CrossRef] [Green Version]
- Zhang, H.; Sairam, M.R. Sex hormone imbalances and adipose tissue dysfunction impacting on metabolic syndrome; a paradigm for the discovery of novel adipokines. Horm. Mol. Biol. Clin. Investig. 2014, 17, 89–97. [Google Scholar] [CrossRef]
- Even, S.E.L.; Dulak-Lis, M.G.; Touyz, R.M.; Nguyen Dinh Cat, A. Crosstalk between adipose tissue and blood vessels in cardiometabolic syndrome: Implication of steroid hormone receptors (MR/GR). Horm. Mol. Biol. Clin. Investig. 2014, 19, 89–101. [Google Scholar] [CrossRef]
- Tchernof, A.; Mansour, M.F.; Pelletier, M.; Boulet, M.-M.; Nadeau, M.; Luu-The, V. Updated survey of the steroid-converting enzymes in human adipose tissues. J. Steroid Biochem. Mol. Biol. 2015, 147, 56–69. [Google Scholar] [CrossRef]
- Campbell, K.L.; Foster-Schubert, K.E.; Makar, K.W.; Kratz, M.; Hagman, D.; Schur, E.A.; Habermann, N.; Horton, M.; Abbenhardt, C.; Kuan, L.-Y.; et al. Gene expression changes in adipose tissue with diet- and/or exercise-induced weight loss. Cancer Prev. Res. 2013, 6, 217–231. [Google Scholar] [CrossRef] [Green Version]
- Gates, M.A.; Mekary, R.A.; Chiu, G.R.; Ding, E.L.; Wittert, G.A.; Araujo, A.B. Sex steroid hormone levels and body composition in men. J. Clin. Endocrinol. Metab. 2013, 98, 2442–2450. [Google Scholar] [CrossRef] [PubMed] [Green Version]
- Gong, Y.; Xiao, H.; Li, C.; Bai, J.; Cheng, X.; Jin, M.; Sun, B.; Lu, Y.; Shao, Y.; Tian, H. Elevated t/e2 ratio is associated with an increased risk of cerebrovascular disease in elderly men. PLoS ONE 2013, 8, e61598. [Google Scholar] [CrossRef] [Green Version]
- Zhang, X.; Lv, W.-Q.; Qiu, B.; Zhang, L.-J.; Qin, J.; Tang, F.-J.; Wang, H.-T.; Li, H.-J.; Hao, Y.-R. Assessing causal estimates of the association of obesity-related traits with coronary artery disease using a Mendelian randomization approach. Sci. Rep. 2018, 8, 7146. [Google Scholar] [CrossRef] [PubMed]
- Burgess, S.; Thompson, S.G. Mendelian Randomization: Methods for Using Genetic Variants in Causal Estimation; Taylor and Francis: Hoboken, NJ, USA, 2015; ISBN 9781466573178. [Google Scholar]
- Pott, J.; Bae, Y.J.; Horn, K.; Teren, A.; Kühnapfel, A.; Kirsten, H.; Ceglarek, U.; Loeffler, M.; Thiery, J.; Kratzsch, J.; et al. Genetic Association Study of Eight Steroid Hormones and Implications for Sexual Dimorphism of Coronary Artery Disease. J. Clin. Endocrinol. Metab. 2019, 104, 5008–5023. [Google Scholar] [CrossRef] [PubMed]
- Scholz, M.; Henger, S.; Beutner, F.; Teren, A.; Baber, R.; Willenberg, A.; Ceglarek, U.; Pott, J.; Burkhardt, R.; Thiery, J. Cohort Profile: The Leipzig Research Center for Civilization Diseases-Heart Study (LIFE-Heart). Int. J. Epidemiol. 2020, 49, 1439–1440h. [Google Scholar] [CrossRef] [PubMed]
- Loeffler, M.; Engel, C.; Ahnert, P.; Alfermann, D.; Arelin, K.; Baber, R.; Beutner, F.; Binder, H.; Brähler, E.; Burkhardt, R.; et al. The LIFE-Adult-Study: Objectives and design of a population-based cohort study with 10,000 deeply phenotyped adults in Germany. BMC Public Health 2015, 15, 691. [Google Scholar] [CrossRef] [PubMed] [Green Version]
- Auton, A.; Brooks, L.D.; Durbin, R.M.; Garrison, E.P.; Kang, H.M.; Korbel, J.O.; Marchini, J.L.; McCarthy, S.; McVean, G.A.; Abecasis, G.R. A global reference for human genetic variation. Nature 2015, 526, 68–74. [Google Scholar] [CrossRef] [Green Version]
- Zhang, Y.; Jin, S. Mitigating placental injuries through up-regulating DAF in experimental APS mice: New mechanism of progesterone. Clin. Exp. Immunol. 2019, 197, 376–386. [Google Scholar] [CrossRef] [PubMed]
- Apostolakis, E.M.; Riherd, D.N.; O’Malley, B.W. PAC1 receptors mediate pituitary adenylate cyclase-activating polypeptide- and progesterone-facilitated receptivity in female rats. Mol. Endocrinol. 2005, 19, 2798–2811. [Google Scholar] [CrossRef] [PubMed] [Green Version]
- Lieberman, A.P.; Friedlich, D.L.; Harmison, G.; Howell, B.W.; Jordan, C.L.; Breedlove, S.M.; Fischbeck, K.H. Androgens regulate the mammalian homologues of invertebrate sex determination genes tra-2 and fox-1. Biochem. Biophys. Res. Commun. 2001, 282, 499–506. [Google Scholar] [CrossRef] [Green Version]
- Hewetson, A.; Chilton, B.S. Progesterone-dependent deoxyribonucleic acid looping between RUSH/SMARCA3 and Egr-1 mediates repression by c-Rel. Mol. Endocrinol. 2008, 22, 813–822. [Google Scholar] [CrossRef]
- Yadav, R.; Petrunak, E.M.; Estrada, D.F.; Scott, E.E. Structural insights into the function of steroidogenic cytochrome P450 17A1. Mol. Cell. Endocrinol. 2017, 441, 68–75. [Google Scholar] [CrossRef] [Green Version]
- Atif, F.; Patel, N.R.; Yousuf, S.; Stein, D.G. The Synergistic Effect of Combination Progesterone and Temozolomide on Human Glioblastoma Cells. PLoS ONE 2015, 10, e0131441. [Google Scholar] [CrossRef]
- Bardin, C.W.; Brown, T.; Isomaa, V.V.; Jänne, O.A. Progestins can mimic, inhibit and potentiate the actions of androgens. Pharmacol. Ther. 1983, 23, 443–459. [Google Scholar] [CrossRef]
- Raudrant, D.; Rabe, T. Progestogens with antiandrogenic properties. Drugs 2003, 63, 463–492. [Google Scholar] [CrossRef]
- Kurt, B.; Karger, C.; Wagner, C.; Kurtz, A. Control of renin secretion from kidneys with renin cell hyperplasia. Am. J. Physiol. Renal Physiol. 2014, 306, F327–F332. [Google Scholar] [CrossRef] [PubMed] [Green Version]
- Ruth, K.S.; Day, F.R.; Tyrrell, J.; Thompson, D.J.; Wood, A.R.; Mahajan, A.; Beaumont, R.N.; Wittemans, L.; Martin, S.; Busch, A.S.; et al. Using human genetics to understand the disease impacts of testosterone in men and women. Nat. Med. 2020, 26, 252–258. [Google Scholar] [CrossRef]
- Del Jimenez Rio, M.; Moreno, S.; Garcia-Ospina, G.; Buritica, O.; Uribe, C.S.; Lopera, F.; Velez-Pardo, C. Autosomal recessive juvenile parkinsonism Cys212Tyr mutation in parkin renders lymphocytes susceptible to dopamine- and iron-mediated apoptosis. Mov. Disord. 2004, 19, 324–330. [Google Scholar] [CrossRef]
- Wilson, C. Identify Polymorphisms Associated with Risk for the Development of Myopericarditis following Smallpox Vaccine. 2012. Available online: https://www.immport.org/shared/study/SDY26 (accessed on 15 June 2021).
- Dolzan, V.; Prezelj, J.; Vidan-Jeras, B.; Breskvar, K. Adrenal 21-hydroxylase gene mutations in Slovenian hyperandrogenic women: Evaluation of corticotrophin stimulation and HLA polymorphisms in screening for carrier status. Eur. J. Endocrinol. 1999, 141, 132–139. [Google Scholar] [CrossRef] [Green Version]
- Israel, S.; Weinrib, L.; Weintrob, N.; Miller, K.; Brautbar, C. Distribution of the V281L mutation of the CYP21 gene in Israeli congenital adrenal hyperplasia patients and its association with HLA-B14. Pediatr. Endocrinol. Rev. 2006, 3 (Suppl. 3), 447–450. [Google Scholar]
- Gbadegesin, R.A.; Adeyemo, A.; Webb, N.J.A.; Greenbaum, L.A.; Abeyagunawardena, A.; Thalgahagoda, S.; Kale, A.; Gipson, D.; Srivastava, T.; Lin, J.-J.; et al. HLA-DQA1 and PLCG2 Are Candidate Risk Loci for Childhood-Onset Steroid-Sensitive Nephrotic Syndrome. J. Am. Soc. Nephrol. 2015, 26, 1701–1710. [Google Scholar] [CrossRef] [PubMed] [Green Version]
- Zheng, H.-Y.; Li, Y.; Dai, W.; Wei, C.-D.; Sun, K.-S.; Tong, Y.-Q. Imbalance of testosterone/estradiol promotes male CHD development. Biomed. Mater. Eng. 2012, 22, 179–185. [Google Scholar] [CrossRef]
- Dai, W.; Ming, W.; Li, Y.; Zheng, H.-Y.; Wei, C.-D.; Rui, Z.; Yan, C. Synergistic Effect of a Physiological Ratio of Estradiol and Testosterone in the Treatment of Early-stage Atherosclerosis. Arch. Med. Res. 2015, 46, 619–629. [Google Scholar] [CrossRef] [PubMed]
- Pelletier, G.; Dupont, E.; Simard, J.; Luu-The, V.; Bélanger, A.; Labrie, F. Ontogeny and subcellular localization of 3 beta-hydroxysteroid dehydrogenase (3 beta-HSD) in the human and rat adrenal, ovary and testis. J. Steroid Biochem. Mol. Biol. 1992, 43, 451–467. [Google Scholar] [CrossRef]
- Meier, M.; Möller, G.; Adamski, J. Perspectives in understanding the role of human 17beta-hydroxysteroid dehydrogenases in health and disease. Ann. N. Y. Acad. Sci. 2009, 1155, 15–24. [Google Scholar] [CrossRef] [PubMed]
- Eriksson, A.L.; Perry, J.R.B.; Coviello, A.D.; Delgado, G.E.; Ferrucci, L.; Hoffman, A.R.; Huhtaniemi, I.T.; Ikram, M.A.; Karlsson, M.K.; Kleber, M.E.; et al. Genetic Determinants of Circulating Estrogen Levels and Evidence of a Causal Effect of Estradiol on Bone Density in Men. J. Clin. Endocrinol. Metab. 2018, 103, 991–1004. [Google Scholar] [CrossRef]
- Simonetti, L.; Bruque, C.D.; Fernández, C.S.; Benavides-Mori, B.; Delea, M.; Kolomenski, J.E.; Espeche, L.D.; Buzzalino, N.D.; Nadra, A.D.; Dain, L. CYP21A2 mutation update: Comprehensive analysis of databases and published genetic variants. Hum. Mutat. 2018, 39, 5–22. [Google Scholar] [CrossRef]
- Orentreich, N.; Brind, J.L.; Vogelman, J.H.; Andres, R.; Baldwin, H. Long-term longitudinal measurements of plasma dehydroepiandrosterone sulfate in normal men. J. Clin. Endocrinol. Metab. 1992, 75, 1002–1004. [Google Scholar] [CrossRef] [PubMed]
- Szymczak, J.; Milewicz, A.; Thijssen, J.H.; Blankenstein, M.A.; Daroszewski, J. Concentration of sex steroids in adipose tissue after menopause. Steroids 1998, 63, 319–321. [Google Scholar] [CrossRef]
- Mo, Q.; Lu, S.; Simon, N.G. Dehydroepiandrosterone and its metabolites: Differential effects on androgen receptor trafficking and transcriptional activity. J. Steroid Biochem. Mol. Biol. 2006, 99, 50–58. [Google Scholar] [CrossRef]
- Morales, A.J.; Haubrich, R.H.; Hwang, J.Y.; Asakura, H.; Yen, S.S. The effect of six months treatment with a 100 mg daily dose of dehydroepiandrosterone (DHEA) on circulating sex steroids, body composition and muscle strength in age-advanced men and women. Clin. Endocrinol. 1998, 49, 421–432. [Google Scholar] [CrossRef] [PubMed]
- Nestler, J.E.; Barlascini, C.O.; Clore, J.N.; Blackard, W.G. Dehydroepiandrosterone reduces serum low density lipoprotein levels and body fat but does not alter insulin sensitivity in normal men. J. Clin. Endocrinol. Metab. 1988, 66, 57–61. [Google Scholar] [CrossRef] [PubMed]
- Jankowski, C.M.; Gozansky, W.S.; van Pelt, R.E.; Wolfe, P.; Schwartz, R.S.; Kohrt, W.M. Oral dehydroepiandrosterone replacement in older adults: Effects on central adiposity, glucose metabolism and blood lipids. Clin. Endocrinol. 2011, 75, 456–463. [Google Scholar] [CrossRef] [Green Version]
- Hautanen, A.; Adlercreutz, H. Pituitary-adrenocortical function in abdominal obesity of males: Evidence for decreased 21-hydroxylase activity. J. Steroid Biochem. Mol. Biol. 1996, 58, 123–133. [Google Scholar] [CrossRef]
- Cakir, E.; Doğan, M.; Topaloglu, O.; Ozbek, M.; Cakal, E.; Vural, M.G.; Yeter, E.; Delibasi, T. Subclinical atherosclerosis and hyperandrogenemia are independent risk factors for increased epicardial fat thickness in patients with PCOS and idiopathic hirsutism. Atherosclerosis 2013, 226, 291–295. [Google Scholar] [CrossRef]
- Houser, S.L.; Aretz, H.T.; Quist, W.C.; Chang, Y.; Schreiber, A.D. Serum lipids and arterial plaque load are altered independently with high-dose progesterone in hypercholesterolemic male rabbits. Cardiovasc. Pathol. 2000, 9, 317–322. [Google Scholar] [CrossRef]
- Mondragón-Ceballos, R.; García Granados, M.D.; Cerda-Molina, A.L.; Chavira-Ramírez, R.; Hernández-López, L.E. Waist-to-Hip Ratio, but Not Body Mass Index, Is Associated with Testosterone and Estradiol Concentrations in Young Women. Int. J. Endocrinol. 2015, 2015, 654046. [Google Scholar] [CrossRef]
- Aragam, K.G.; Jiang, T.; Goel, A.; Kanoni, S.; Wolford, B.N.; Weeks, E.M.; Wang, M.; Hindy, G.; Zhou, W.; Grace, C.; et al. Discovery and systematic characterization of risk variants and genes for coronary artery disease in over a million participants. medRxiv 2021. [Google Scholar] [CrossRef]
- Gaudl, A.; Kratzsch, J.; Bae, Y.J.; Kiess, W.; Thiery, J.; Ceglarek, U. Liquid chromatography quadrupole linear ion trap mass spectrometry for quantitative steroid hormone analysis in plasma, urine, saliva and hair. J. Chromatogr. A 2016, 1464, 64–71. [Google Scholar] [CrossRef]
- Affymetrix. Axiom™ Analysis Suite; Thermo Fisher Scientific. Available online: http://www.affymetrix.com/support/technical/byproduct.affx?product=axiomanalysissuite (accessed on 25 October 2021).
- Howie, B.N.; Donnelly, P.; Marchini, J. A flexible and accurate genotype imputation method for the next generation of genome-wide association studies. PLoS Genet. 2009, 5, e1000529. [Google Scholar] [CrossRef] [PubMed] [Green Version]
- Dilthey, A.; Leslie, S.; Moutsianas, L.; Shen, J.; Cox, C.; Nelson, M.R.; McVean, G. Multi-population classical HLA type imputation. PLoS Comput. Biol. 2013, 9, e1002877. [Google Scholar] [CrossRef] [Green Version]
- Affymetrix. Axiom™ HLA Analysis; Thermo Fisher Scientific. Available online: http://www.affymetrix.com/support/technical/byproduct.affx?product=axiom_hla (accessed on 25 October 2021).
- Chang, C.C.; Chow, C.C.; Tellier, L.C.; Vattikuti, S.; Purcell, S.M.; Lee, J.J. Second-generation PLINK: Rising to the challenge of larger and richer datasets. Gigascience 2015, 4, 7. [Google Scholar] [CrossRef]
- Purcell, S.; Chang, C. PLINK 2.0. Available online: www.cog-genomics.org/plink/2.0/ (accessed on 25 October 2021).
- Zerbino, D.R.; Achuthan, P.; Akanni, W.; Amode, M.R.; Barrell, D.; Bhai, J.; Billis, K.; Cummins, C.; Gall, A.; Girón, C.G.; et al. Ensembl 2018. Nucleic Acids Res. 2018, 46, D754–D761. [Google Scholar] [CrossRef] [PubMed]
- Battle, A.; Brown, C.D.; Engelhardt, B.E.; Montgomery, S.B. Genetic effects on gene expression across human tissues. Nature 2017, 550, 204–213. [Google Scholar] [CrossRef]
- Buniello, A.; MacArthur, J.A.L.; Cerezo, M.; Harris, L.W.; Hayhurst, J.; Malangone, C.; McMahon, A.; Morales, J.; Mountjoy, E.; Sollis, E.; et al. The NHGRI-EBI GWAS Catalog of published genome-wide association studies, targeted arrays and summary statistics 2019. Nucleic Acids Res. 2019, 47, D1005–D1012. [Google Scholar] [CrossRef] [Green Version]
- Barbeira, A.N.; Dickinson, S.P.; Bonazzola, R.; Zheng, J.; Wheeler, H.E.; Torres, J.M.; Torstenson, E.S.; Shah, K.P.; Garcia, T.; Edwards, T.L.; et al. Exploring the phenotypic consequences of tissue specific gene expression variation inferred from GWAS summary statistics. Nat. Commun. 2018, 9, 1825. [Google Scholar] [CrossRef] [PubMed]
- Thomson, G.; Single, R.M. Conditional asymmetric linkage disequilibrium (ALD): Extending the biallelic r2 measure. Genetics 2014, 198, 321–331. [Google Scholar] [CrossRef] [PubMed] [Green Version]
- Altman, D.G.; Bland, J.M. Interaction revisited: The difference between two estimates. BMJ 2003, 326, 219. [Google Scholar] [CrossRef] [Green Version]
- Benjamini, Y.; Bogomolov, M. Selective inference on multiple families of hypotheses. J. R. Stat. Soc. Ser. B Stat. Methodol. 2014, 76, 297–318. [Google Scholar] [CrossRef]
- Burgess, S.; Dudbridge, F.; Thompson, S.G. Combining information on multiple instrumental variables in Mendelian randomization: Comparison of allele score and summarized data methods. Stat. Med. 2016, 35, 1880–1906. [Google Scholar] [CrossRef]
- Peterson, C.B.; Bogomolov, M.; Benjamini, Y.; Sabatti, C. Many Phenotypes Without Many False Discoveries: Error Controlling Strategies for Multitrait Association Studies. Genet. Epidemiol. 2016, 40, 45–56. [Google Scholar] [CrossRef] [Green Version]
- Chinn, S. A simple method for converting an odds ratio to effect size for use in meta-analysis. Stat. Med. 2000, 19, 3127–3131. [Google Scholar] [CrossRef]


| LIFE-Adult | LIFE-Heart | |||||
|---|---|---|---|---|---|---|
| Parameter | Combined | Males | Females | Combined | Males | Females |
| Sex | 1481 | 863 (58.3) | 618 (41.7%) | 2068 | 1357 (65.6%) | 711 (34.4%) |
| Age, y | 63.7 (7.8) | 64.1 (7.8) | 63.2 (7.7) | 63.0 (10.9) | 62.1 (11.1) | 64.8 (10.3) |
| Current smoker | 242 (16.7%) | 148 (17.5%) | 94 (15.6%) | 401 (19.4%) | 318 (23.4%) | 83 (11.7%) |
| Type 2 diabetes | 267 (23.9%) | 180 (26.5%) | 87 (19.9%) | 644 (31.2%) | 424 (31.3%) | 220 (30.9%) |
| CAD | --- | --- | --- | 836 (41.9%) | 646 (49.2%) | 190 (27.8%) |
| BMI, kg/m2 | 27.9 (4.5) | 28.0 (4.1) | 27.7 (5.1) | 29.7 (5.0) | 29.5 (4.6) | 30.1 (5.7) |
| WHR | 0.96 (0.08) | 1.01 (0.06) | 0.89 (0.06) | 0.97 (0.09) | 1.02 (0.06) | 0.89 (0.06) |
| P4 1, nmol/L | 0.26 | 0.32 | 0.21 | 0.34 | 0.35 | 0.31 |
| [0.20–0.37] | [0.24–0.41] | [0.16–0.32] | [0.27–0.42] | [0.28–0.44] | [0.25–0.39] | |
| 17-OHP, nmol/L | 1.66 | 2.34 | 0.80 | 1.36 | 1.78 | 0.64 |
| [0.87–2.65] | [1.75–3.20] | [0.55–1.14] | [0.77–2.14] | [1.24–2.41] | [0.42–0.94] | |
| A4, nmol/L | 2.41 | 2.65 | 2.03 | 2.16 | 2.32 | 1.85 |
| [1.79–3.19] | [2.03–3.38] | [1.46–2.86] | [1.58–2.97] | [1.75–3.11] | [1.33–2.66] | |
| Aldo, pmol/L | 131 | 122 | 145 | 112 | 112 | 113 |
| [83–195] | [83–186] | [92–207] | [61–186] | [60–186] | [62–187] | |
| T/E2 2 | 86.3 | 182.5 | 15.2 | 144.5 | 230.0 | 51.6 |
| [16.3–187.3] | [131.2–250] | [4.7–31.0] | [66.9–353.3] | [141.6–891] | [25.3–78.7] |
| Cytoband | Lead SNP | Nearest Gene (kb) | Candidate Gene (kb) | E/OA | EAF | Info | Associated Phenotypes | β (SE) | p Value | I2 | IA-FDR |
|---|---|---|---|---|---|---|---|---|---|---|---|
| 1q32.2 | rs138621610 | C1orf132 (0) | CD55 (445) | A/G | 0.010 | 0.983 | P4 (a, f) | 0.708 (0.128) | 3.27 × 10−08 | 0 | 4.97 × 10⁻⁶ |
| 7q36.3 | rs2467806 | VIPR2 (0) | VIPR2 (0) | C/T | 0.989 | 0.862 | P4 (a, m, f) | −0.373 (0.068) | 3.85 × 10−08 | 0.892 | 1.87 × 10⁻² |
| 16p13.3 | rs144711998 | RBFOX1 (0) | RBFOX1 (0) | T/C | 0.025 | 0.879 | P4 (a, f) | 0.525 (0.095) | 3.30 × 10−08 | 0 | 3.13 × 10⁻⁶ |
| 1p12 | rs947130 | HSD3BP1 (0.31) | HSD3B1 (33) | C/T | 0.731 | 0.922 | 17-OHP (a, m) | 0.112 (0.017) | 1.03 × 10⁻¹⁰ | 0 | 5.14 × 10⁻⁴ |
| 2p15 | rs17014577 | FAM161A (0) | REL (913) | C/T | 0.143 | 0.991 | 17-OHP (a, m) | 0.113 (0.021) | 4.49 × 10−08 | 0 | 7.81 × 10⁻² |
| 18q22.3 | rs1430542 | RN7SL401P (64) | CYB5A (442) | C/T | 0.724 | 0.924 | 17-OHP (a, f) | −0.166 (0.028) | 6.21 × 10−09 | 0 | 8.21 × 10⁻⁷ |
| 10q26.3 | rs11311009 | MGMT (0) | MGMT (0) | C/CT | 0.419 | 0.980 | A4 (a, m) | 0.064 (0.012) | 3.78 × 10−08 | 0.367 | 7.06 × 10⁻⁴ |
| 1q23.3 | chr1:162778017 | HSD17B7 (0) | HSD17B7 (0) | A/C | 0.015 | 0.969 | Aldo (a, f) | 0.565 (0.097) | 5.70 × 10⁻⁹ | 0.415 | 9.62 × 10⁻⁶ |
| 14q31.2 | rs117866409 | Gene desert | CNST (trans-eQTL) | C/G | 0.040 | 0.919 | Aldo (a, m) | 0.275 (0.050) | 3.42 × 10−08 | 0.716 | 2.81 × 10⁻² |
| 6q26 | rs73013706 | PACRG (0) | PARK2 (20) | G/A | 0.020 | 0.925 | T/E2 (a, m, f) | −0.374 (0.068) | 4.42 × 10−08 | 0 | 7.07 × 10⁻¹ |
| 15q21.2 | rs727479 | CYP19A1 (0) | CYP19A1 (0) | A/C | 0.659 | 0.999 | T/E2 (a, m) | −0.141 (0.015) | 4.49 × 10⁻²¹ | 0.814 | 5.44 × 10⁻² |
| HLA Subtype | Phenotype | All | Males | Females | IA FDR | |||
|---|---|---|---|---|---|---|---|---|
| Β | p Value | β | p Value | β | p Value | |||
| B*14*02 | 17-OHP | 0.543 | 6.18 × 10⁻²⁰ | 0.540 | 8.96 × 10⁻¹⁵ | 0.543 | 3.57 × 10⁻⁷ | 9.85 × 10⁻¹ |
| P4 | 0.090 | 1.54 × 10−01 | 0.235 | 1.83 × 10−05 | −0.046 | 6.78 × 10⁻¹ | 2.54 × 10⁻² | |
| C*08*02 | 17-OHP | 0.480 | 1.12 × 10⁻²⁰ | 0.509 | 2.29 × 10⁻¹⁸ | 0.416 | 1.63 × 10⁻⁵ | 7.22 × 10⁻¹ |
| P4 | 0.094 | 7.86 × 10−02 | 0.201 | 1.17 × 10−05 | −0.009 | 9.24 × 10⁻¹ | 4.88 × 10⁻² | |
| DQA1*01*01 | 17-OHP | 0.092 | 5.09 × 10−06 | 0.095 | 3.33 × 10−05 | 0.090 | 1.86 × 10⁻² | 9.85 × 10⁻¹ |
| DQB1*05*01 | 17-OHP | 0.095 | 1.37 × 10−05 | 0.100 | 5.30 × 10−05 | 0.086 | 3.66 × 10⁻² | 9.85 × 10⁻¹ |
| Exposure | Mediator | Set | α | p (α) | τ | p (τ) | indir | p (indir) | dir | p (dir) |
|---|---|---|---|---|---|---|---|---|---|---|
| 17-OHP | BMI | a | 0.059 | 1.24 × 10−05 | −0.108 | 1.06 × 10−02 | 0.010 | 5.97 × 10−03 | −0.118 | 5.30 × 10−03 |
| 17-OHP | WHR | a | −0.063 | 8.98 × 10−06 | −0.108 | 1.06 × 10−02 | −0.013 | 1.24 × 10−02 | −0.095 | 2.60 × 10−02 |
| 17-OHP | WHR | f | 0.085 | 1.16 × 10−07 | −0.095 | 7.79 × 10−03 | 0.018 | 8.58 × 10−03 | −0.113 | 1.93 × 10−03 |
| DHEAS | BMI | a | 0.081 | 7.97 × 10−08 | 0.041 | 3.72 × 10−01 | 0.014 | 3.14 × 10−03 | 0.027 | 5.61 × 10−01 |
| DHEAS | BMI | m | 0.106 | 7.61 × 10−07 | 0.066 | 1.43 × 10−01 | 0.018 | 4.01 × 10−03 | 0.047 | 2.96 × 10−01 |
| DHEAS | BMI | f | 0.051 | 2.36 × 10−03 | 0.029 | 4.60 × 10−01 | 0.009 | 2.11 × 10−02 | 0.020 | 6.07 × 10−01 |
| DHEAS | WHR | a | 0.041 | 8.75 × 10−03 | 0.041 | 3.72 × 10−01 | 0.009 | 4.75 × 10−02 | 0.032 | 4.83 × 10−01 |
| E2 | WHR | a | −0.150 | 1.13 × 10⁻¹¹ | 0.021 | 7.60 × 10−01 | −0.031 | 5.70 × 10−03 | 0.052 | 4.53 × 10−01 |
| E2 | WHR | m | −0.213 | 2.56 × 10⁻¹² | 0.020 | 7.60 × 10−01 | −0.044 | 5.47 × 10−03 | 0.064 | 3.33 × 10−01 |
| T | WHR | a | −0.136 | 1.78 × 10−05 | −0.203 | 2.76 × 10−02 | −0.028 | 1.34 × 10−02 | −0.175 | 6.01 × 10−02 |
| T/E2 | WHR | a | 0.112 | 1.13 × 10⁻¹¹ | −0.016 | 7.60 × 10−01 | 0.023 | 5.70 × 10−03 | −0.039 | 4.53 × 10−01 |
| T/E2 | WHR | m | 0.139 | 2.56 × 10⁻¹² | −0.013 | 7.60 × 10−01 | 0.029 | 5.47 × 10−03 | −0.042 | 3.33 × 10−01 |
Publisher’s Note: MDPI stays neutral with regard to jurisdictional claims in published maps and institutional affiliations. |
© 2021 by the authors. Licensee MDPI, Basel, Switzerland. This article is an open access article distributed under the terms and conditions of the Creative Commons Attribution (CC BY) license (https://creativecommons.org/licenses/by/4.0/).
Share and Cite
Pott, J.; Horn, K.; Zeidler, R.; Kirsten, H.; Ahnert, P.; Kratzsch, J.; Loeffler, M.; Isermann, B.; Ceglarek, U.; Scholz, M. Sex-Specific Causal Relations between Steroid Hormones and Obesity—A Mendelian Randomization Study. Metabolites 2021, 11, 738. https://0-doi-org.brum.beds.ac.uk/10.3390/metabo11110738
Pott J, Horn K, Zeidler R, Kirsten H, Ahnert P, Kratzsch J, Loeffler M, Isermann B, Ceglarek U, Scholz M. Sex-Specific Causal Relations between Steroid Hormones and Obesity—A Mendelian Randomization Study. Metabolites. 2021; 11(11):738. https://0-doi-org.brum.beds.ac.uk/10.3390/metabo11110738
Chicago/Turabian StylePott, Janne, Katrin Horn, Robert Zeidler, Holger Kirsten, Peter Ahnert, Jürgen Kratzsch, Markus Loeffler, Berend Isermann, Uta Ceglarek, and Markus Scholz. 2021. "Sex-Specific Causal Relations between Steroid Hormones and Obesity—A Mendelian Randomization Study" Metabolites 11, no. 11: 738. https://0-doi-org.brum.beds.ac.uk/10.3390/metabo11110738