
Metabolic Volume Measurements in Multiple Myeloma

 , , , , , and
Abstract
:
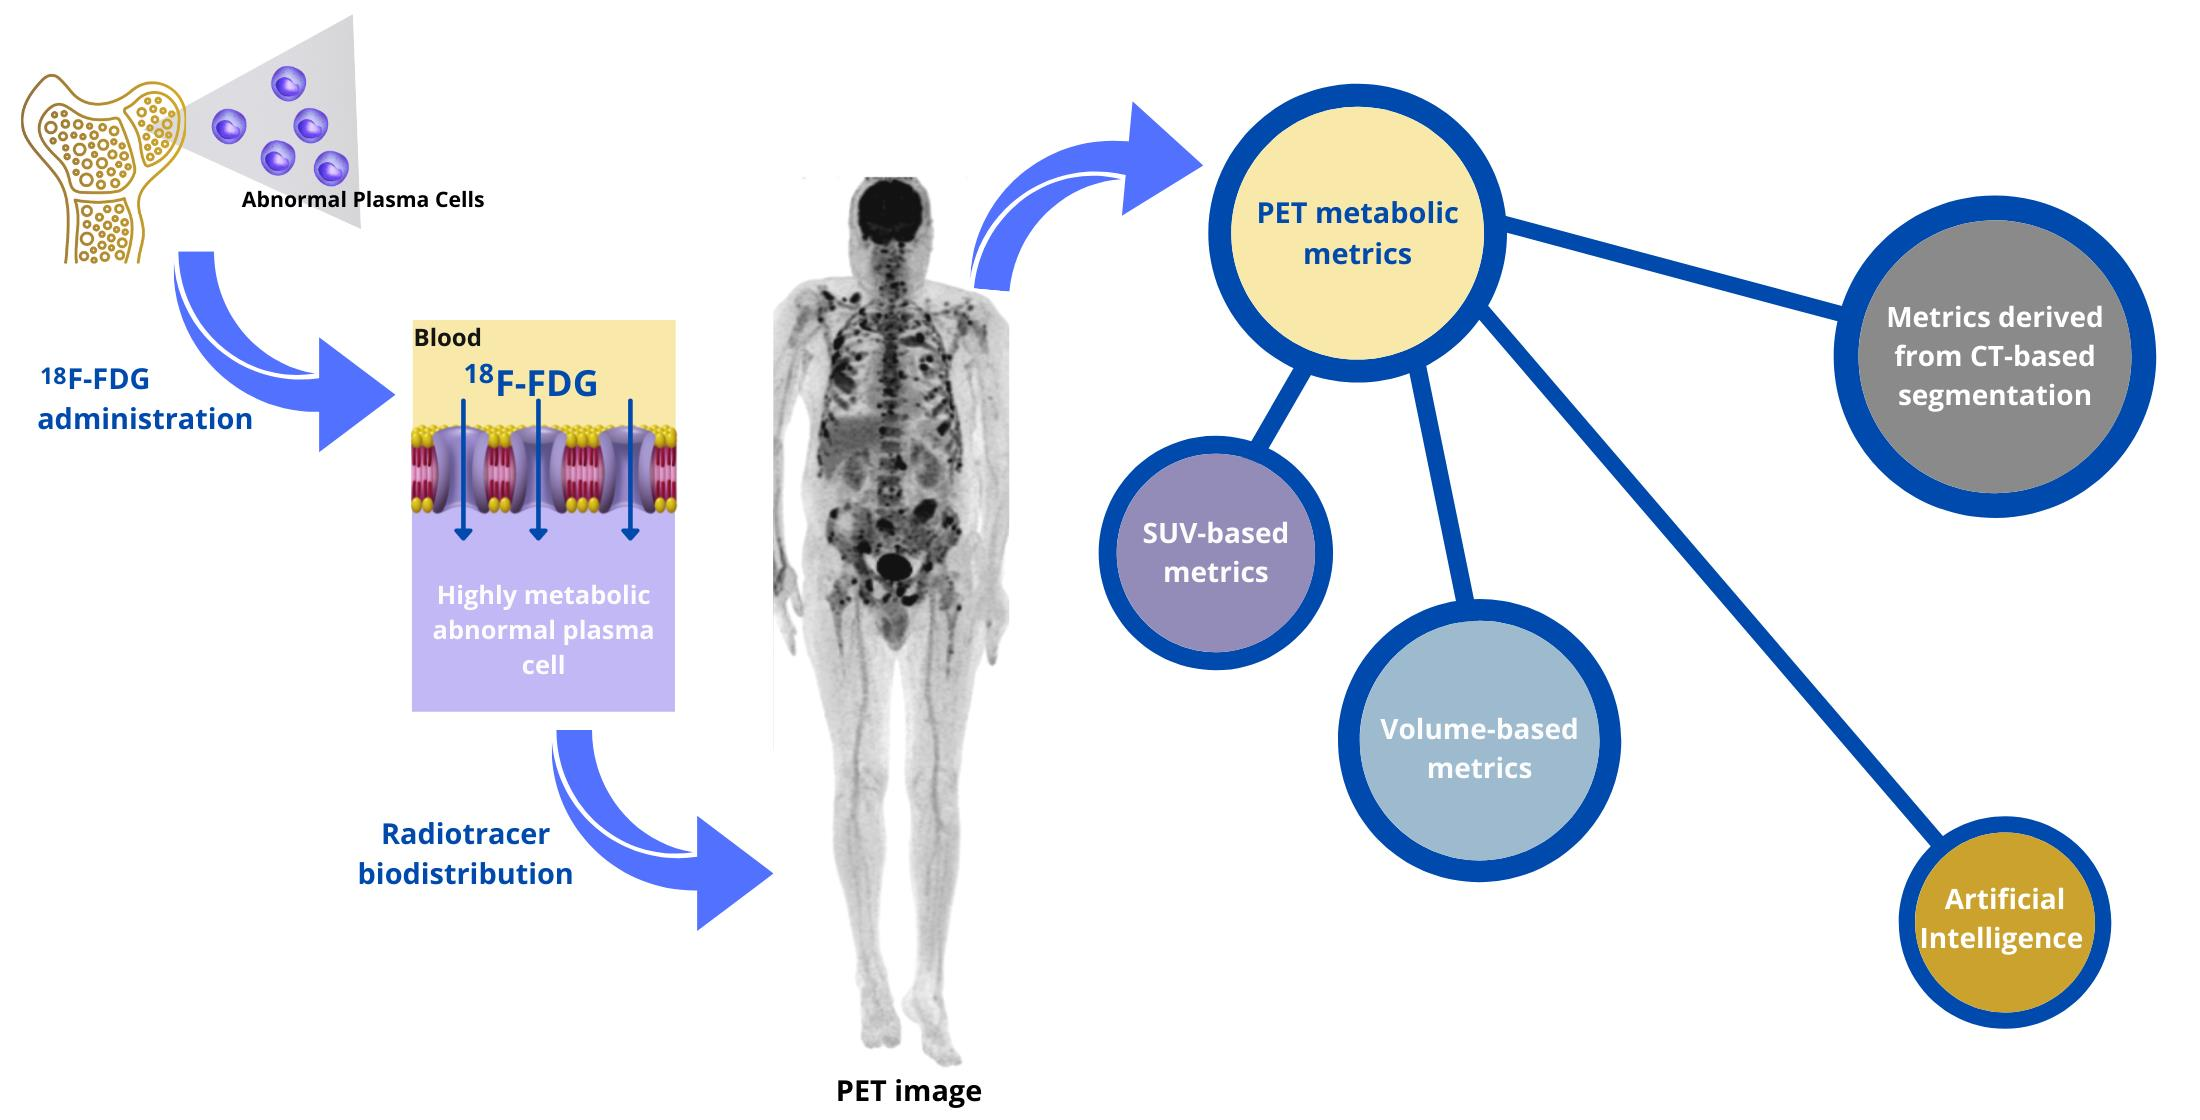
1. Introduction
2. Methods to Quantify MM Tumor Burden Using FDG-PET/CT Images
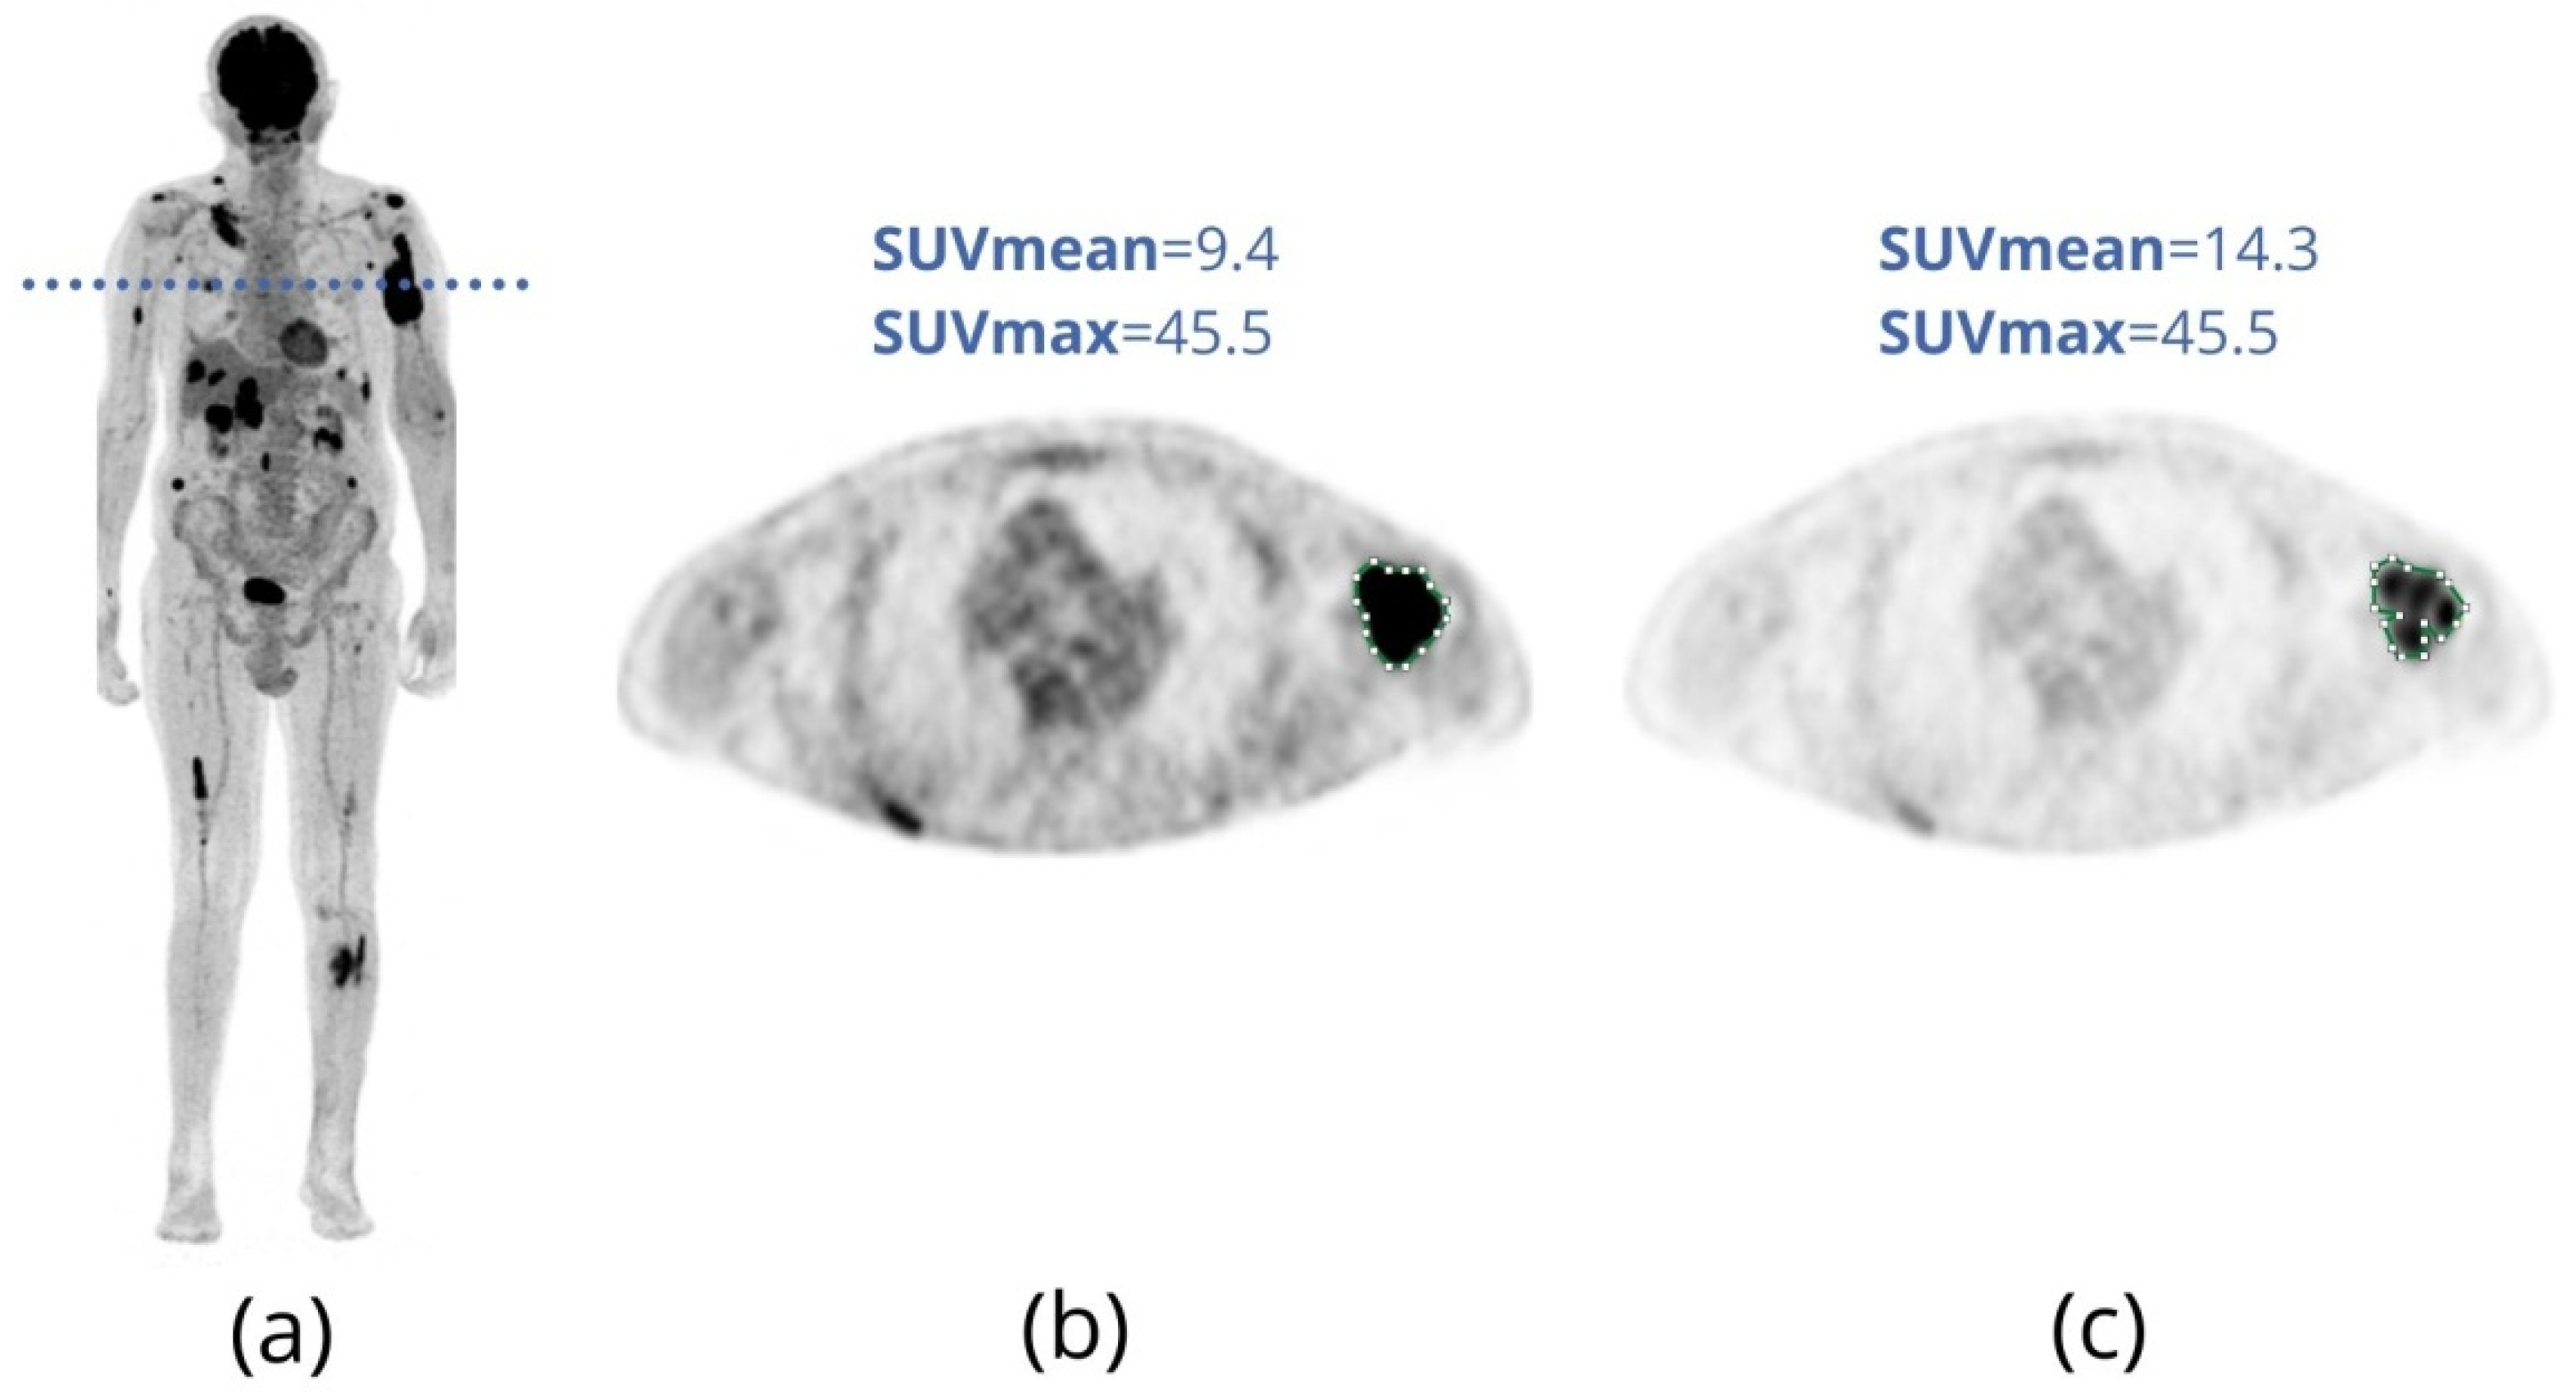
2.1. SUV and Its Derivations
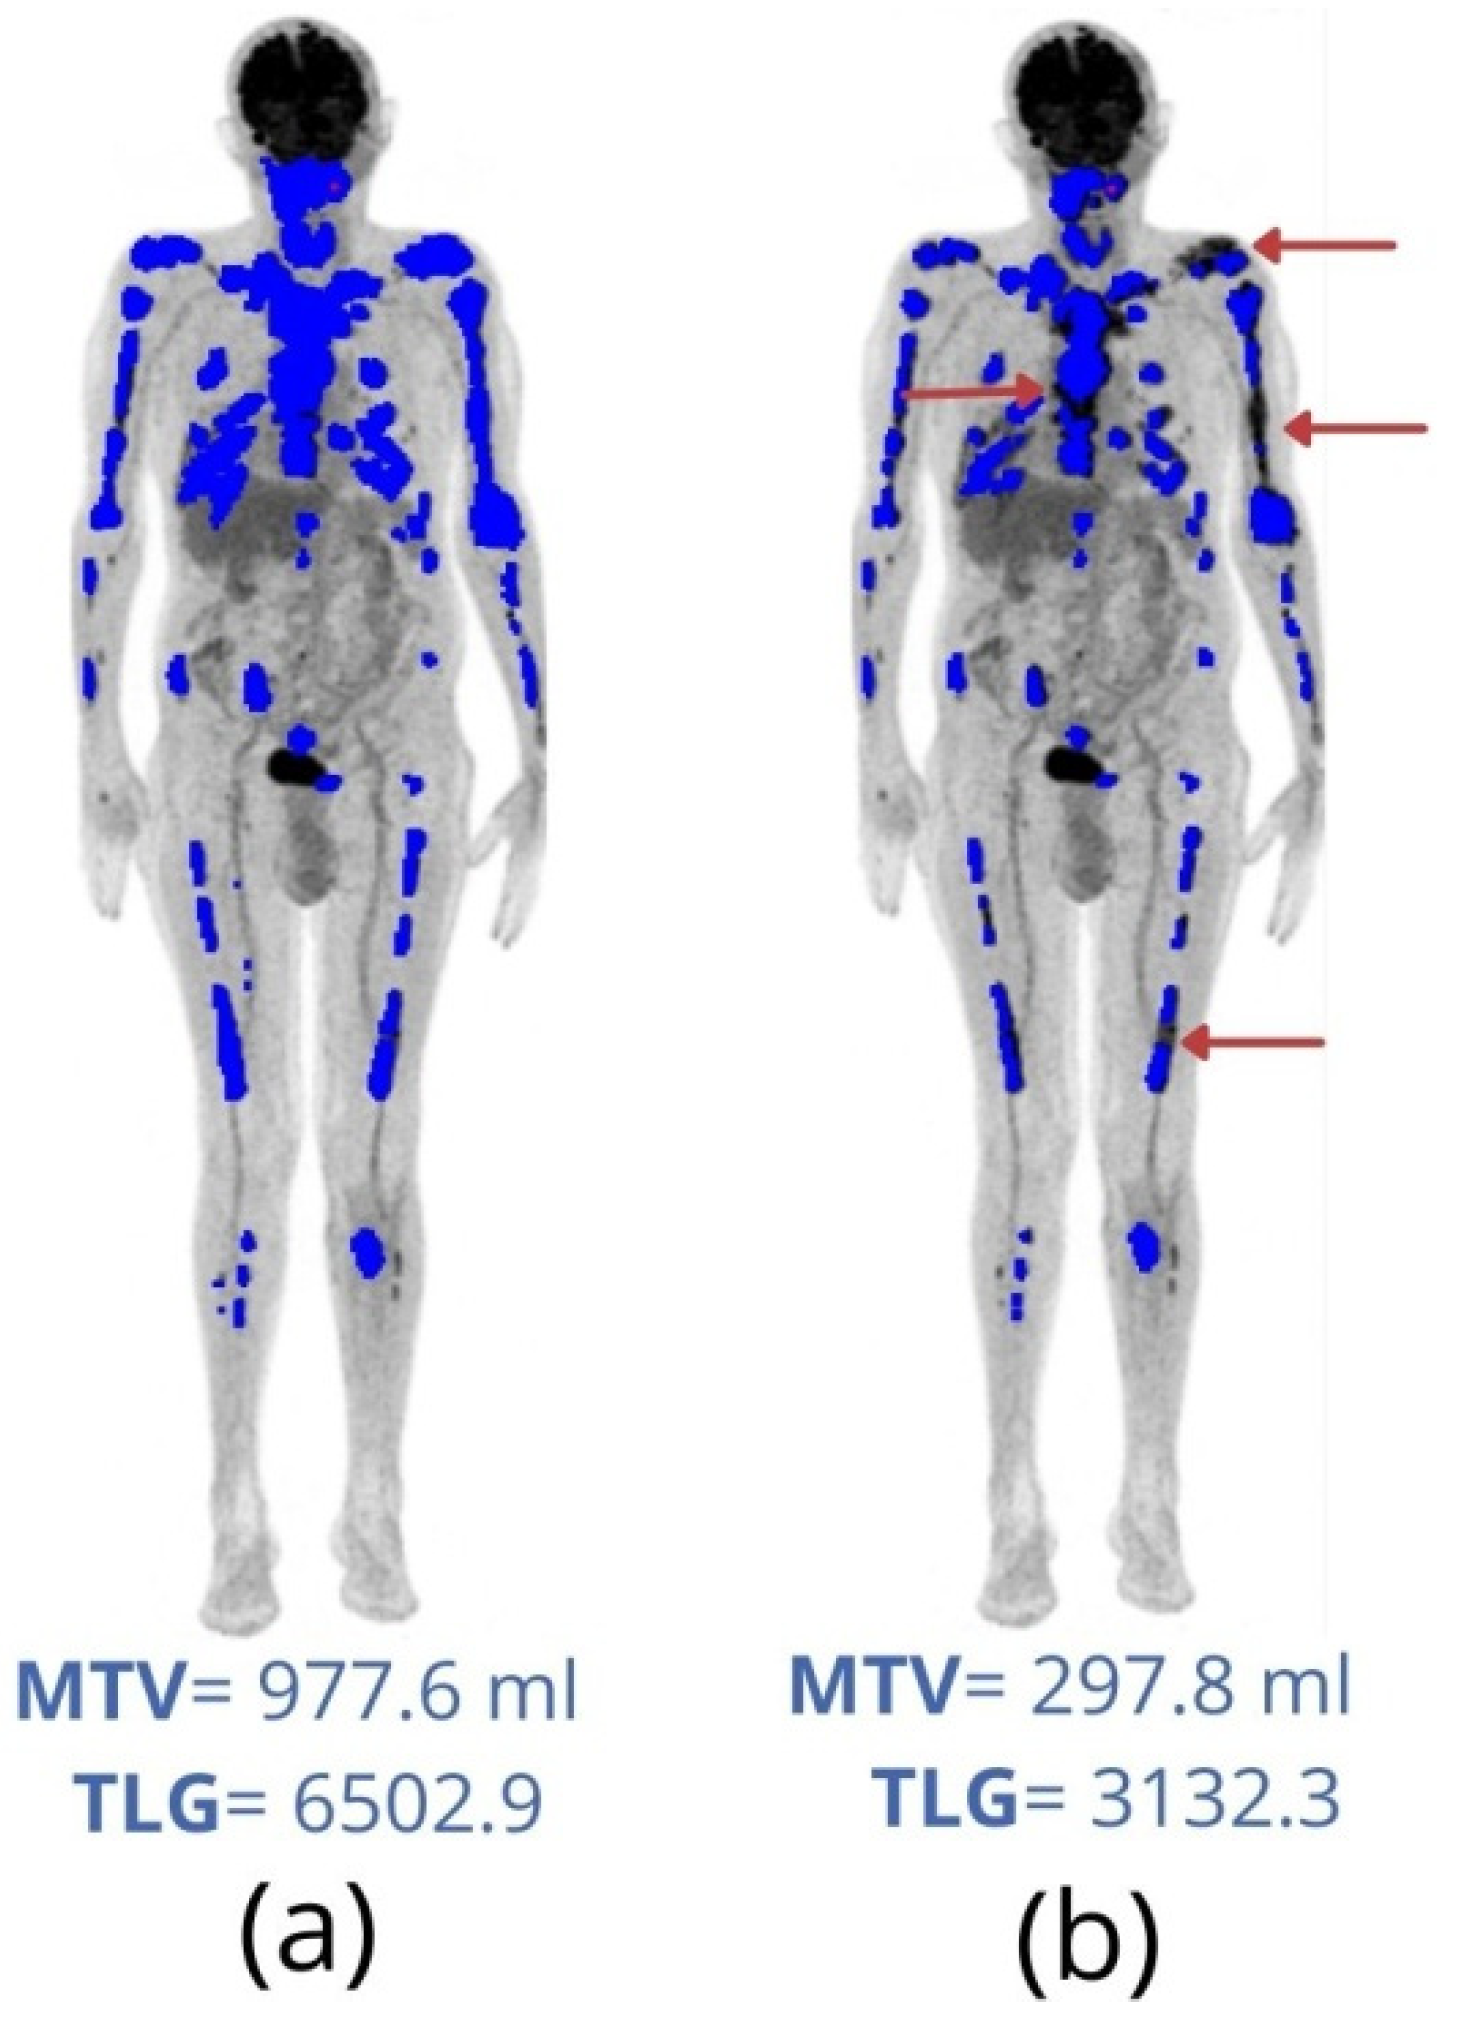
2.2. MTV and TLG
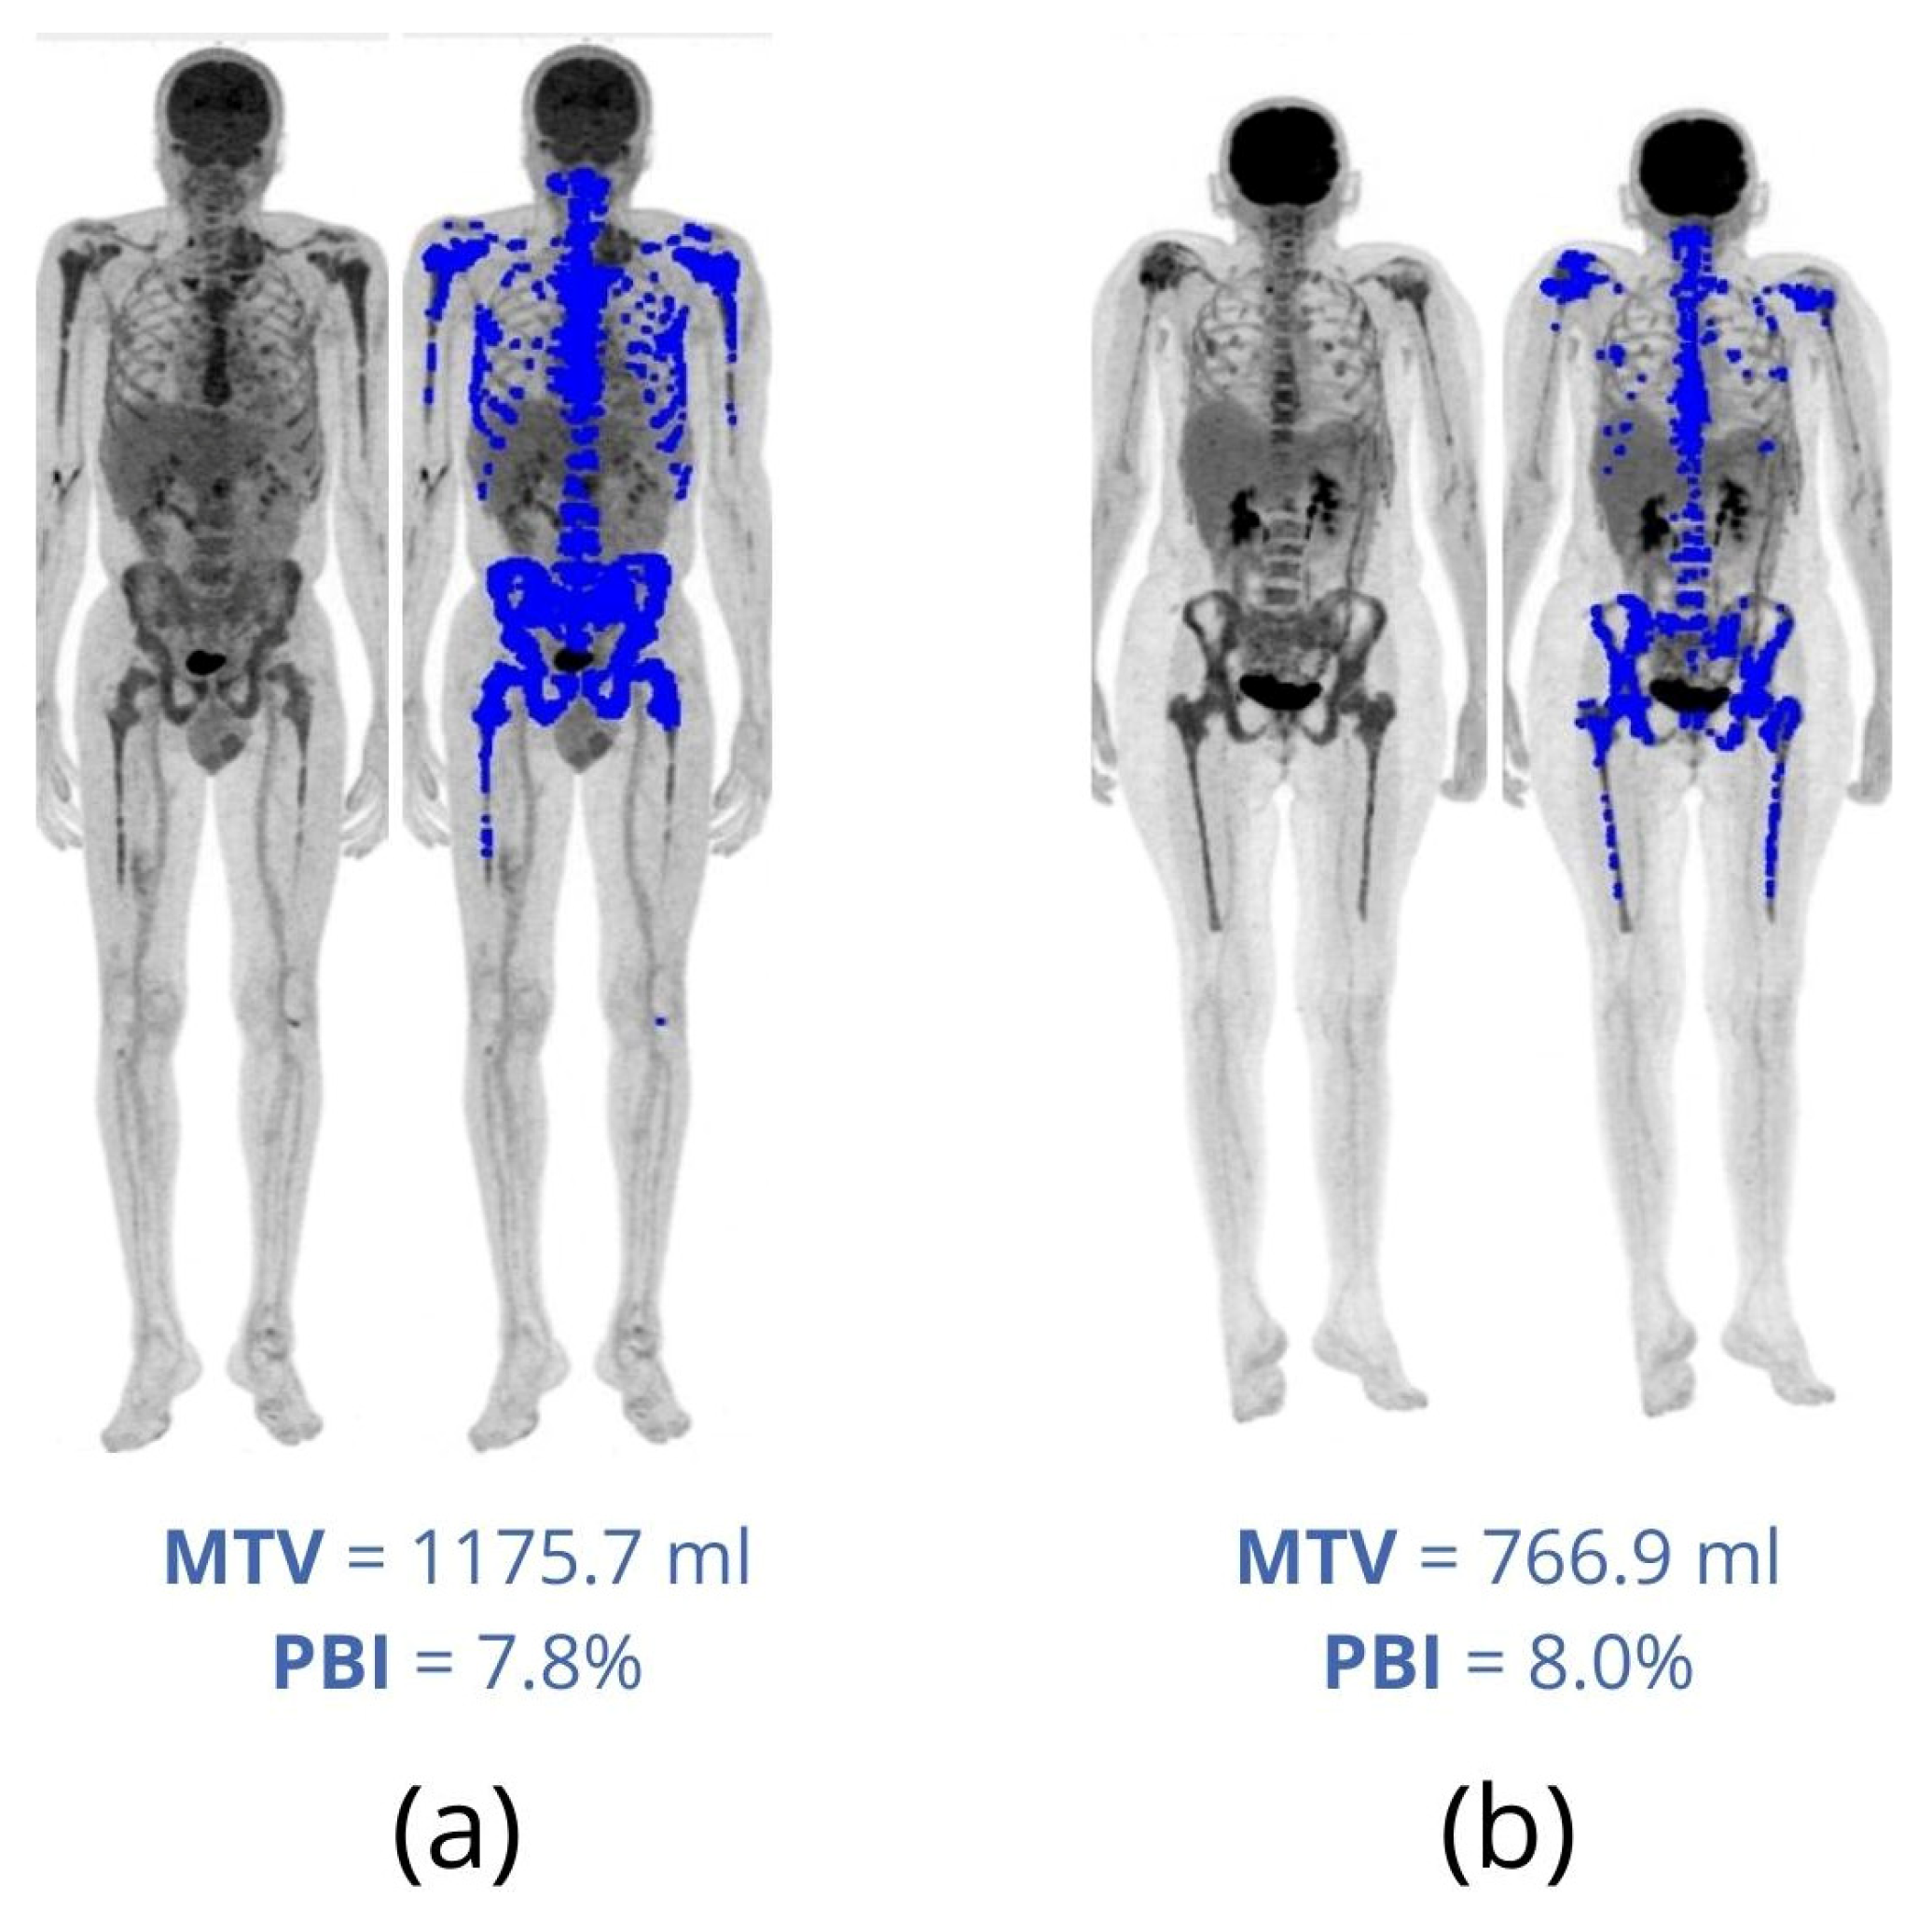
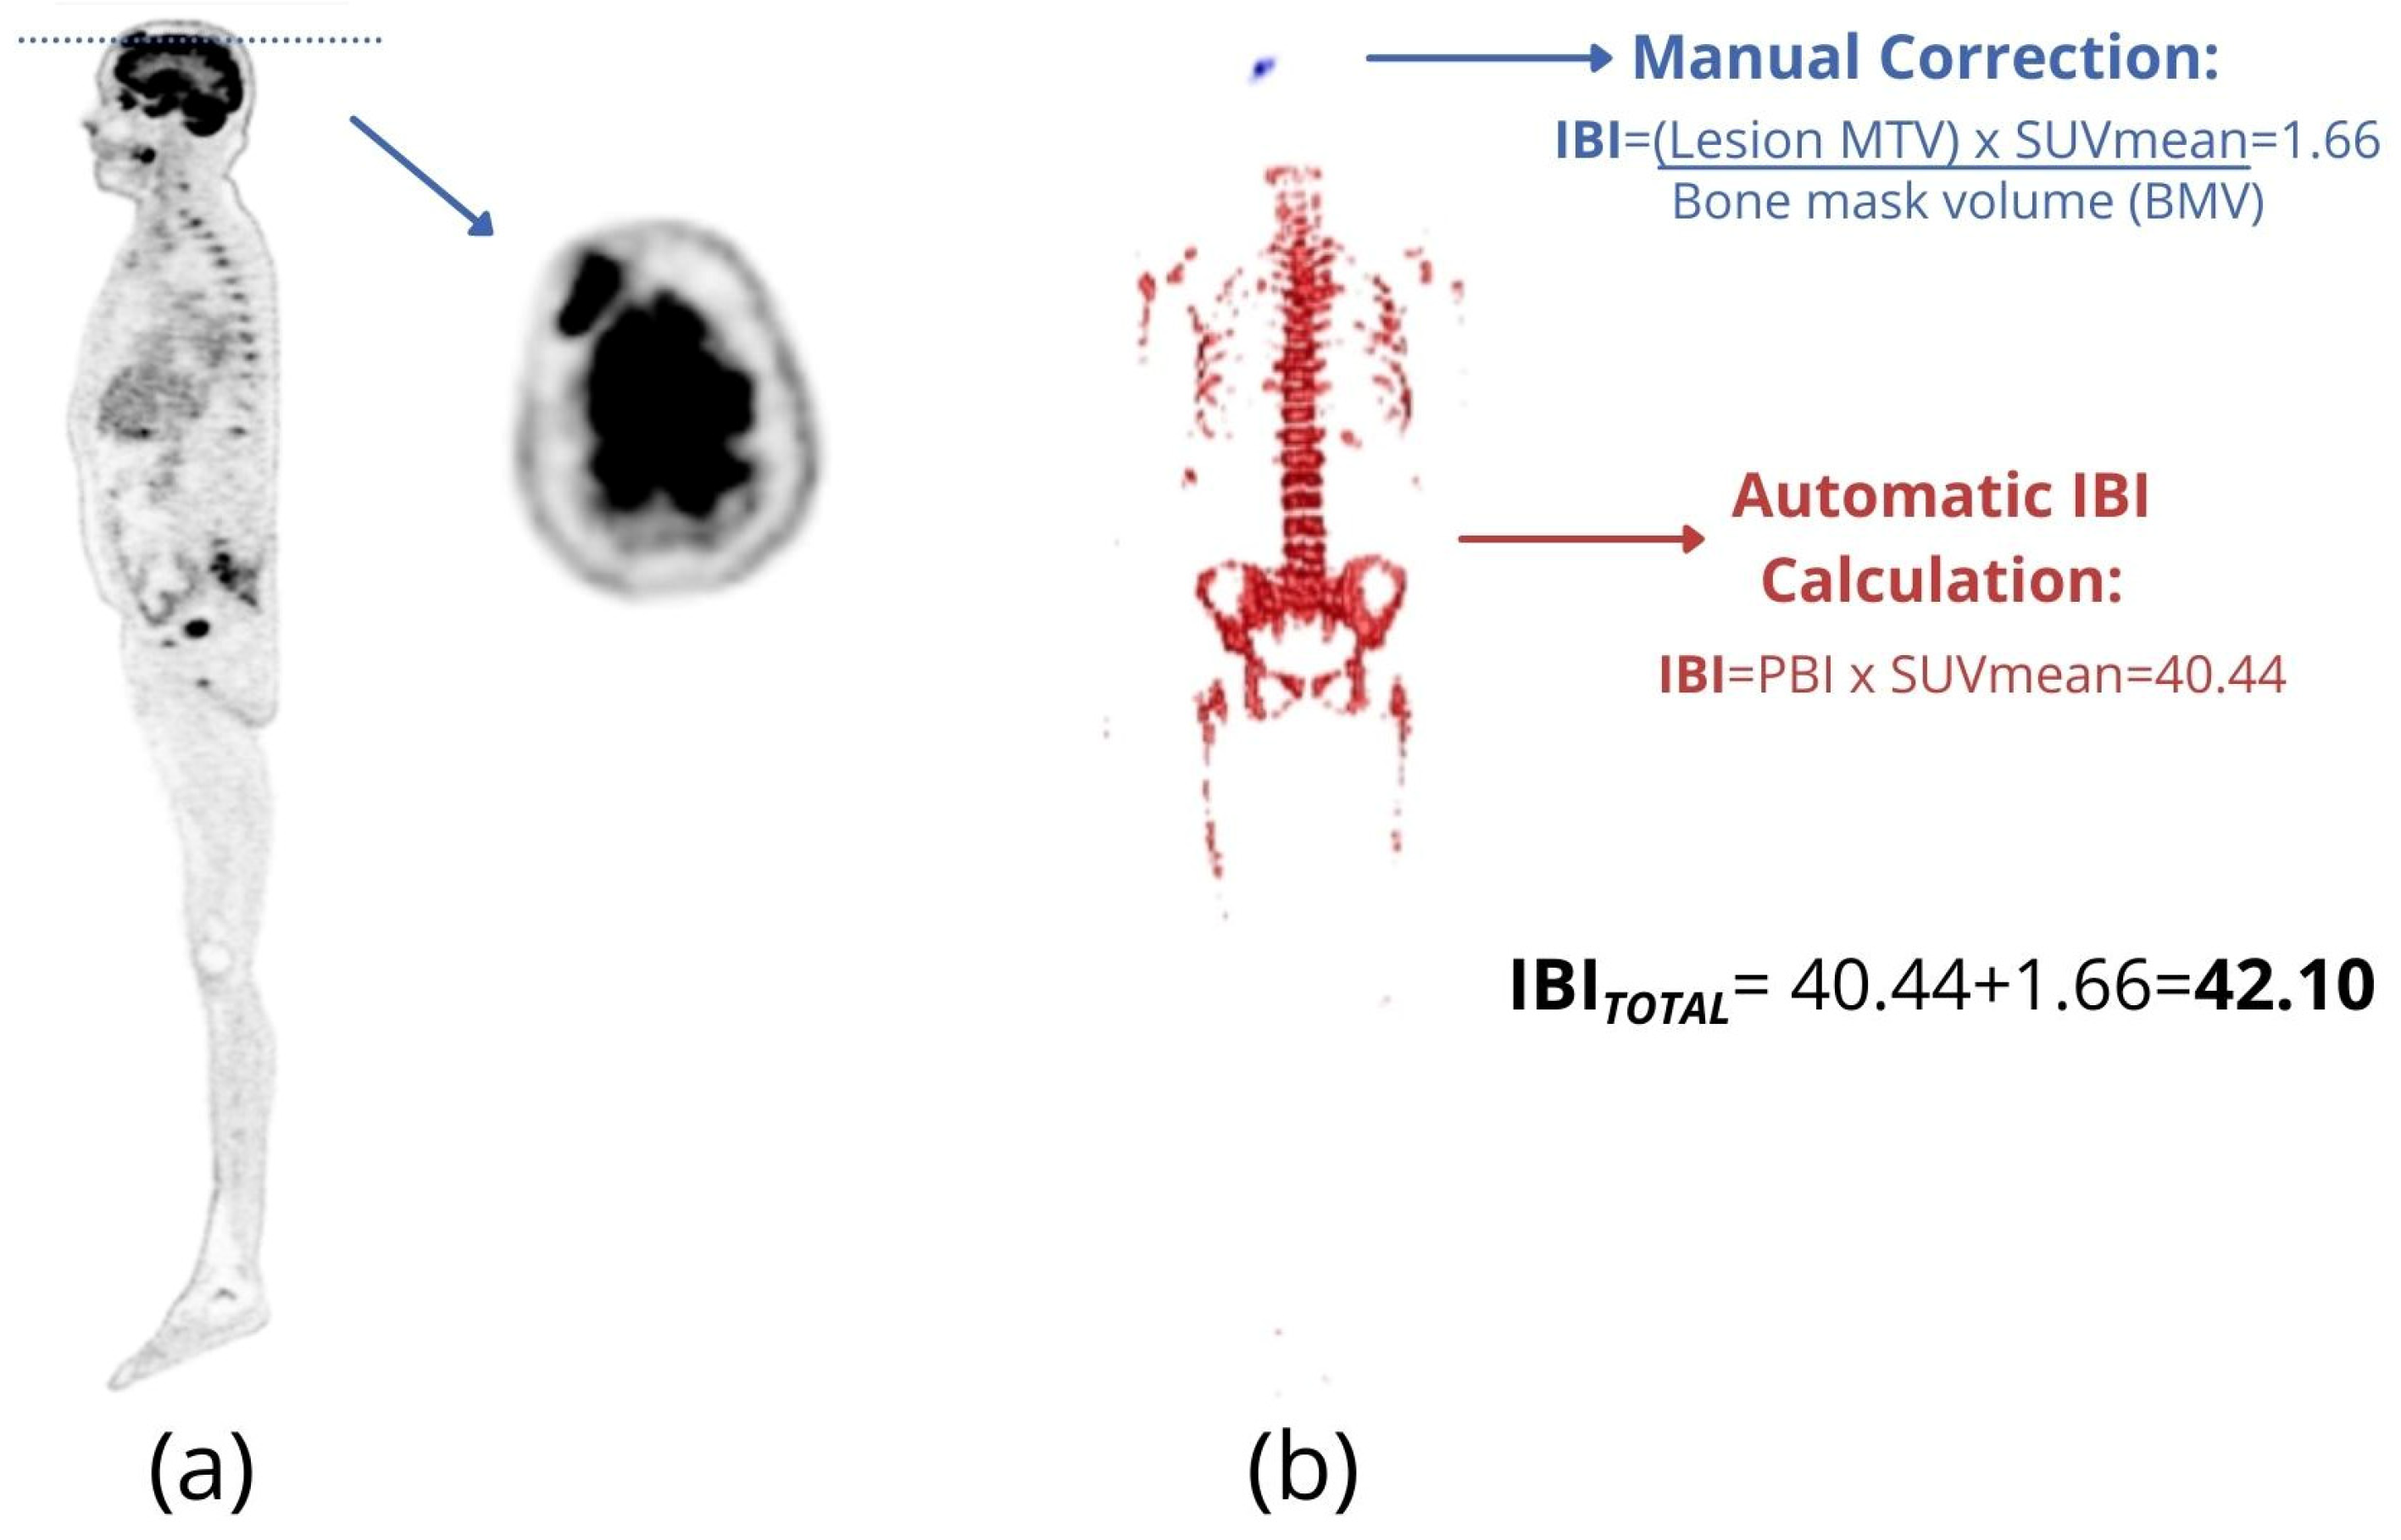
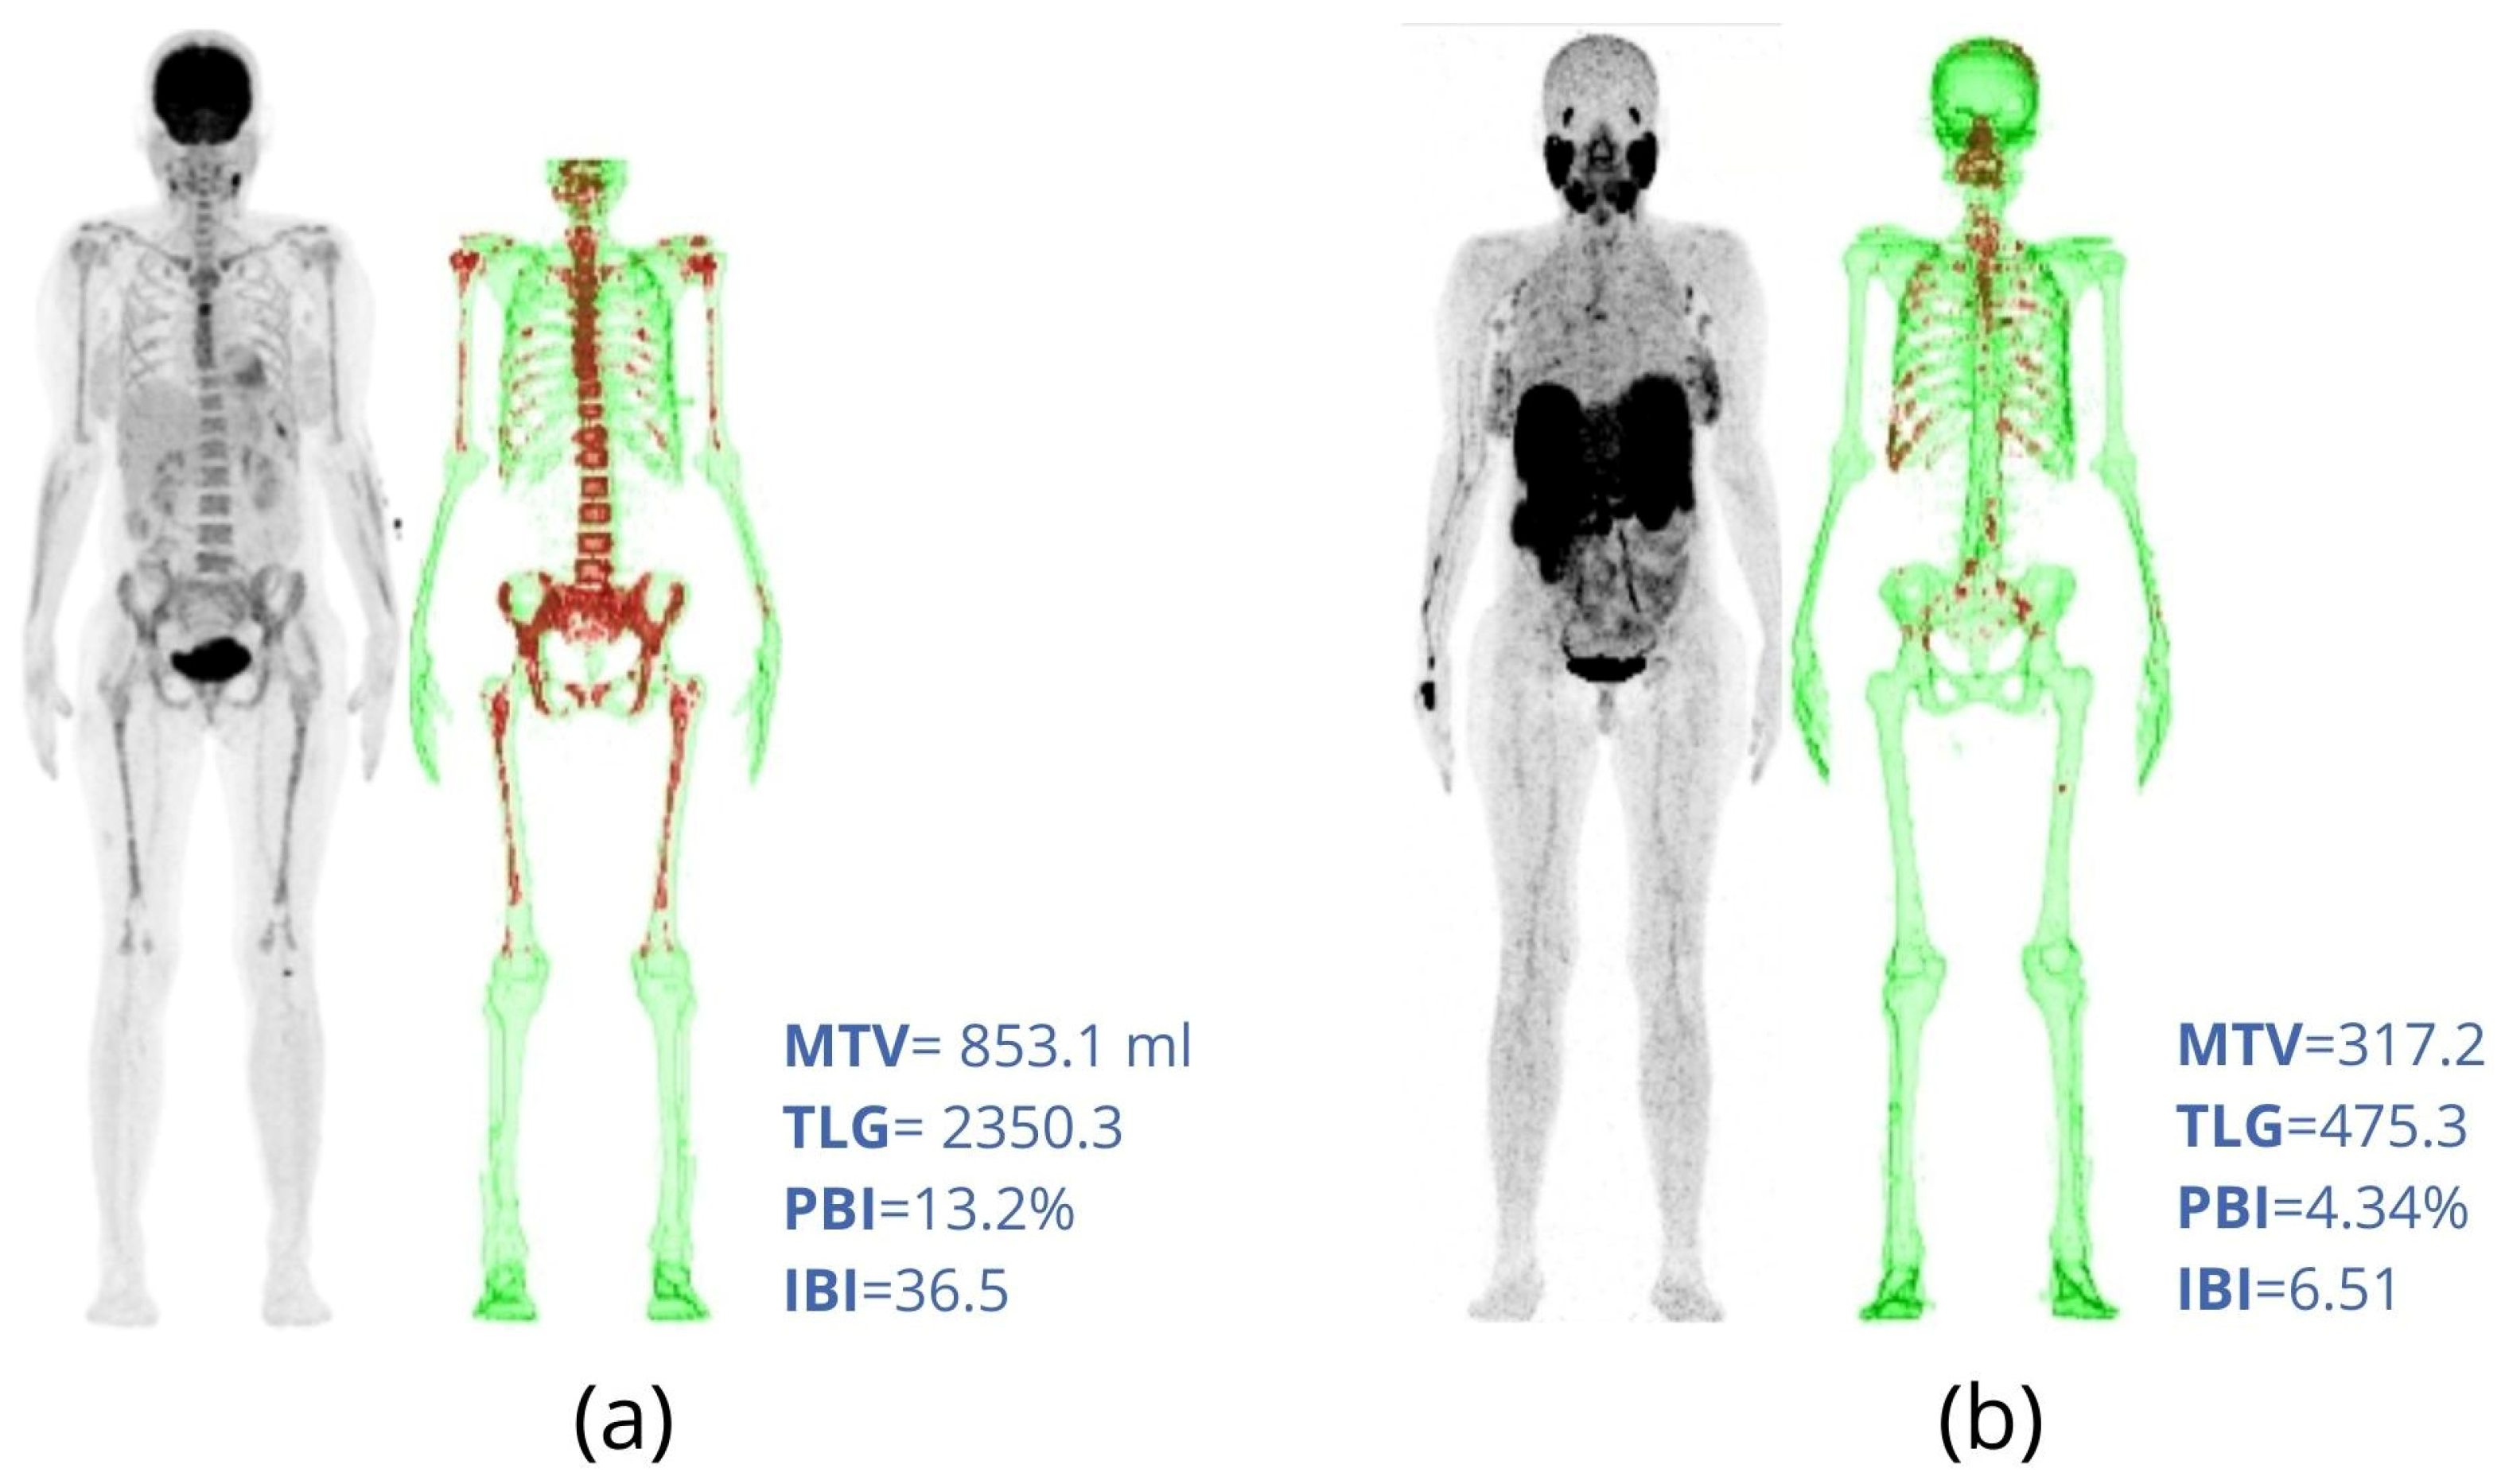
2.3. PBI and IBI
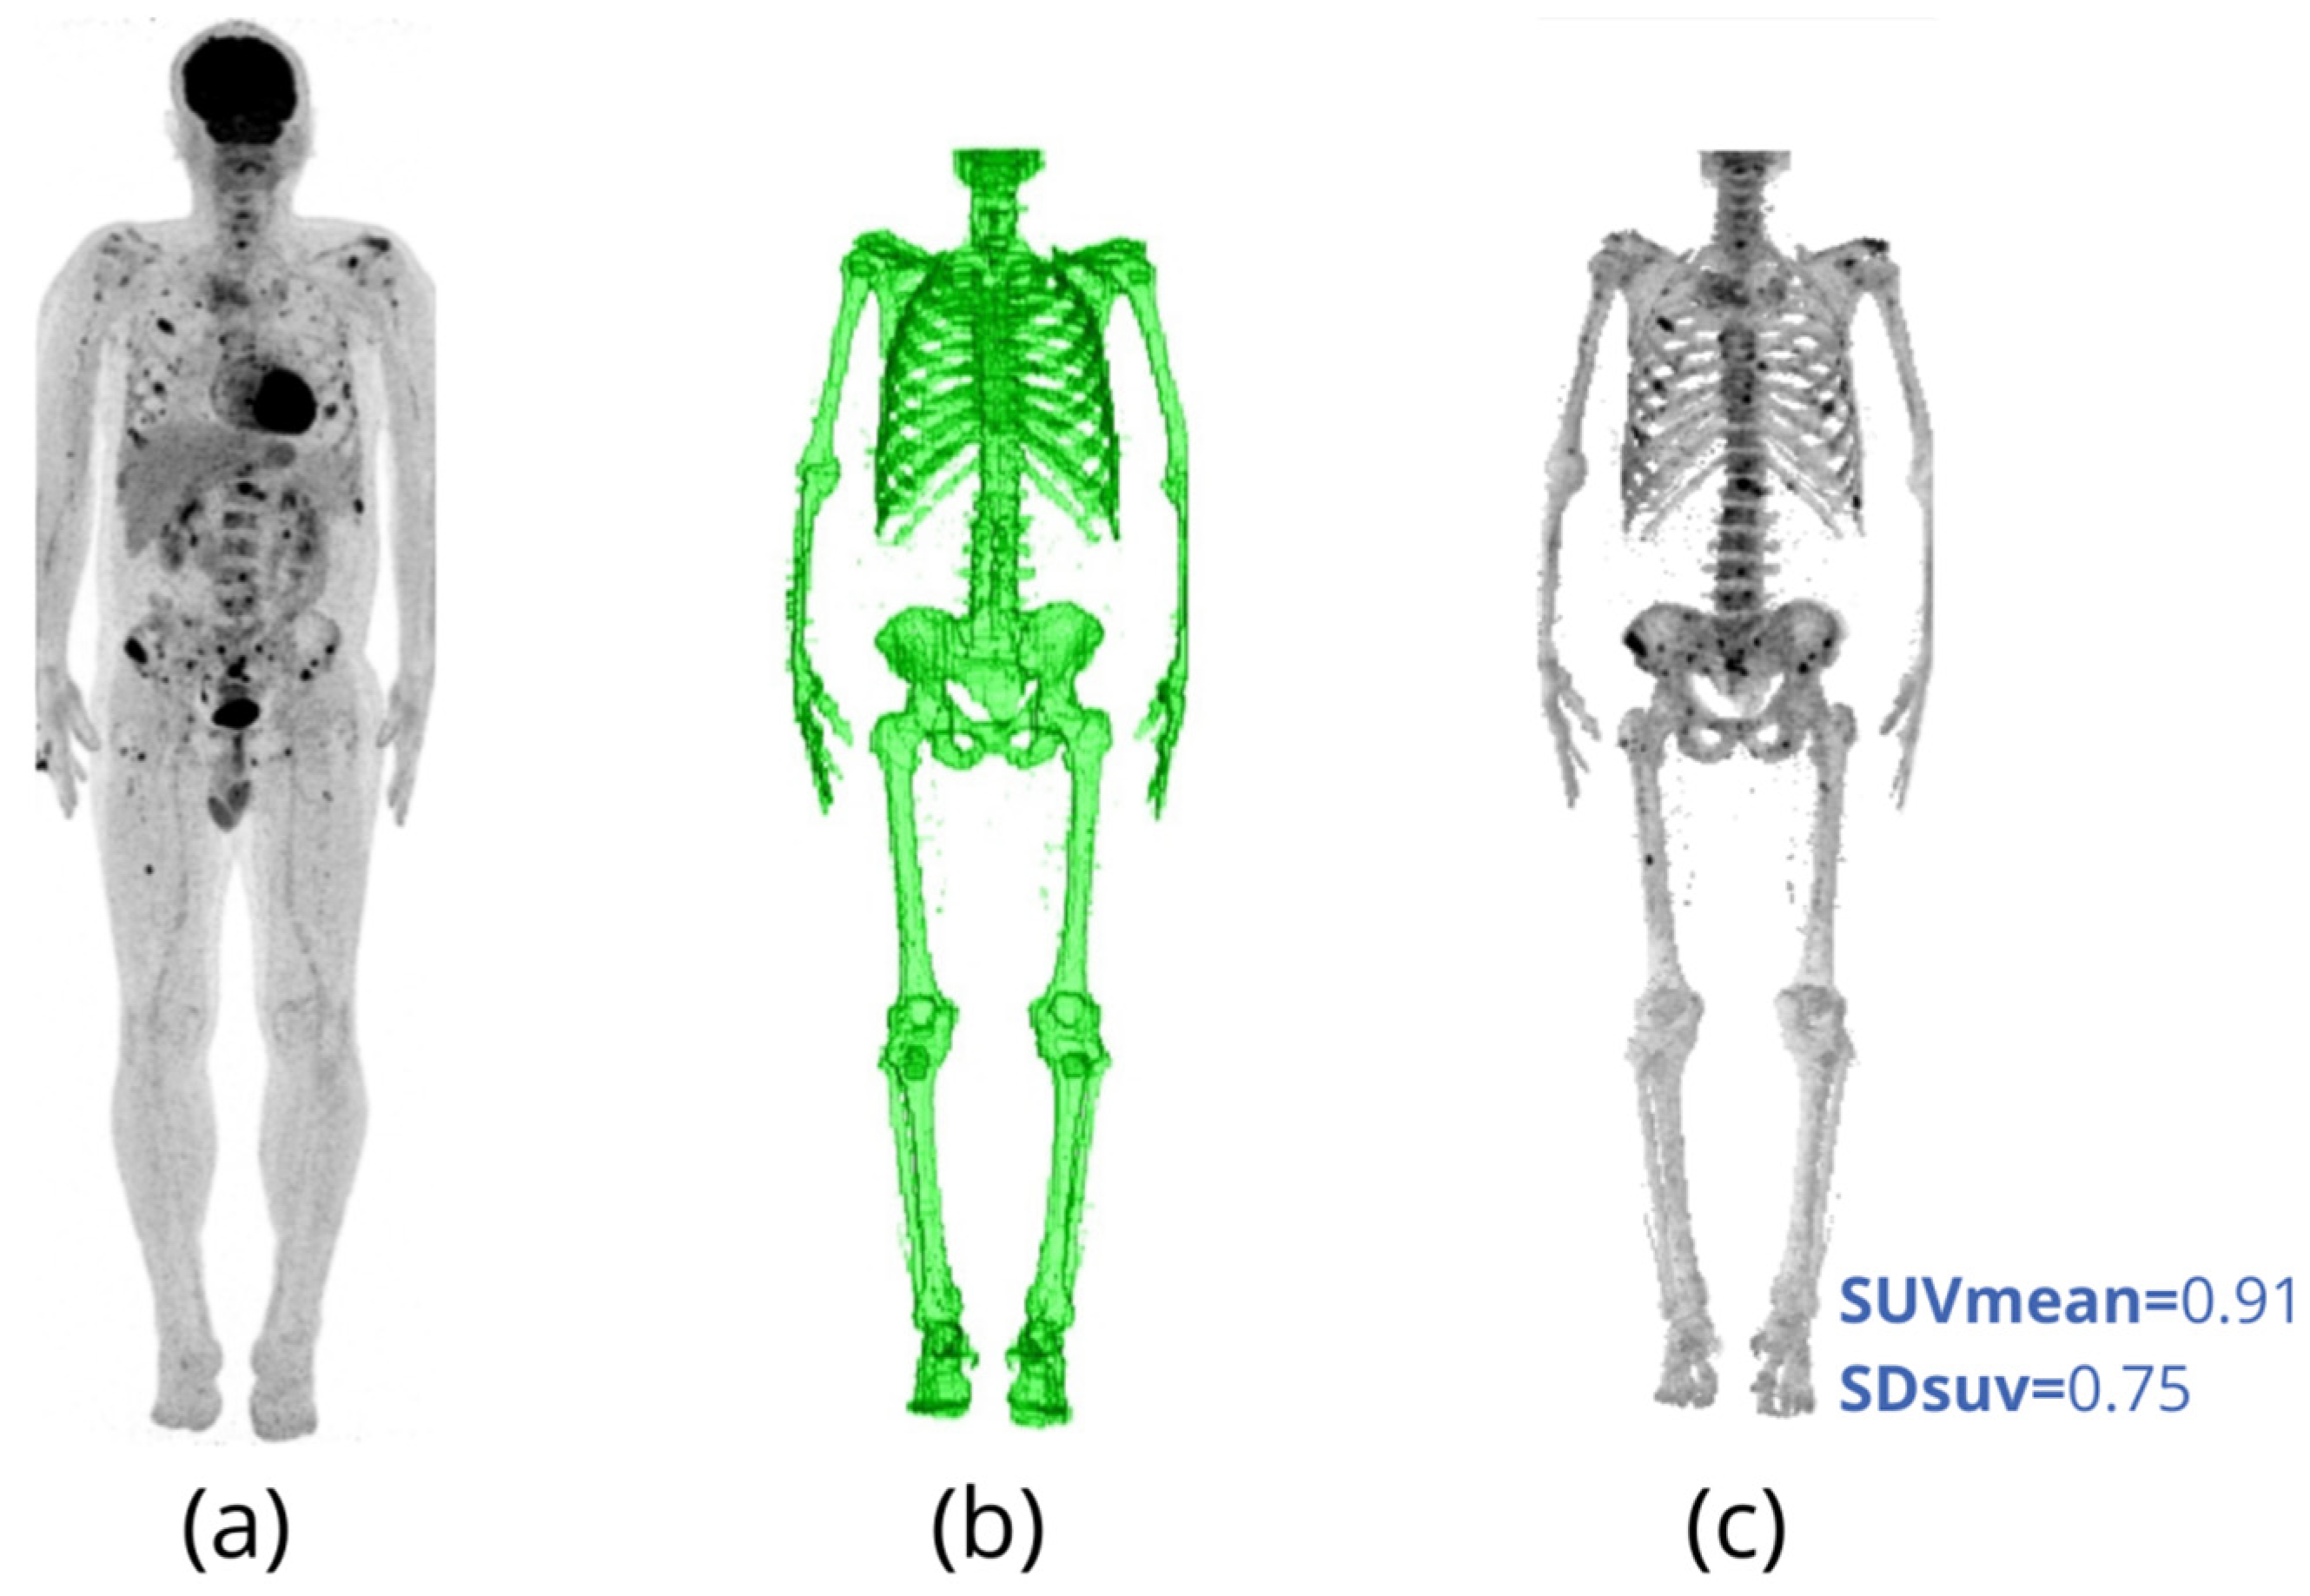
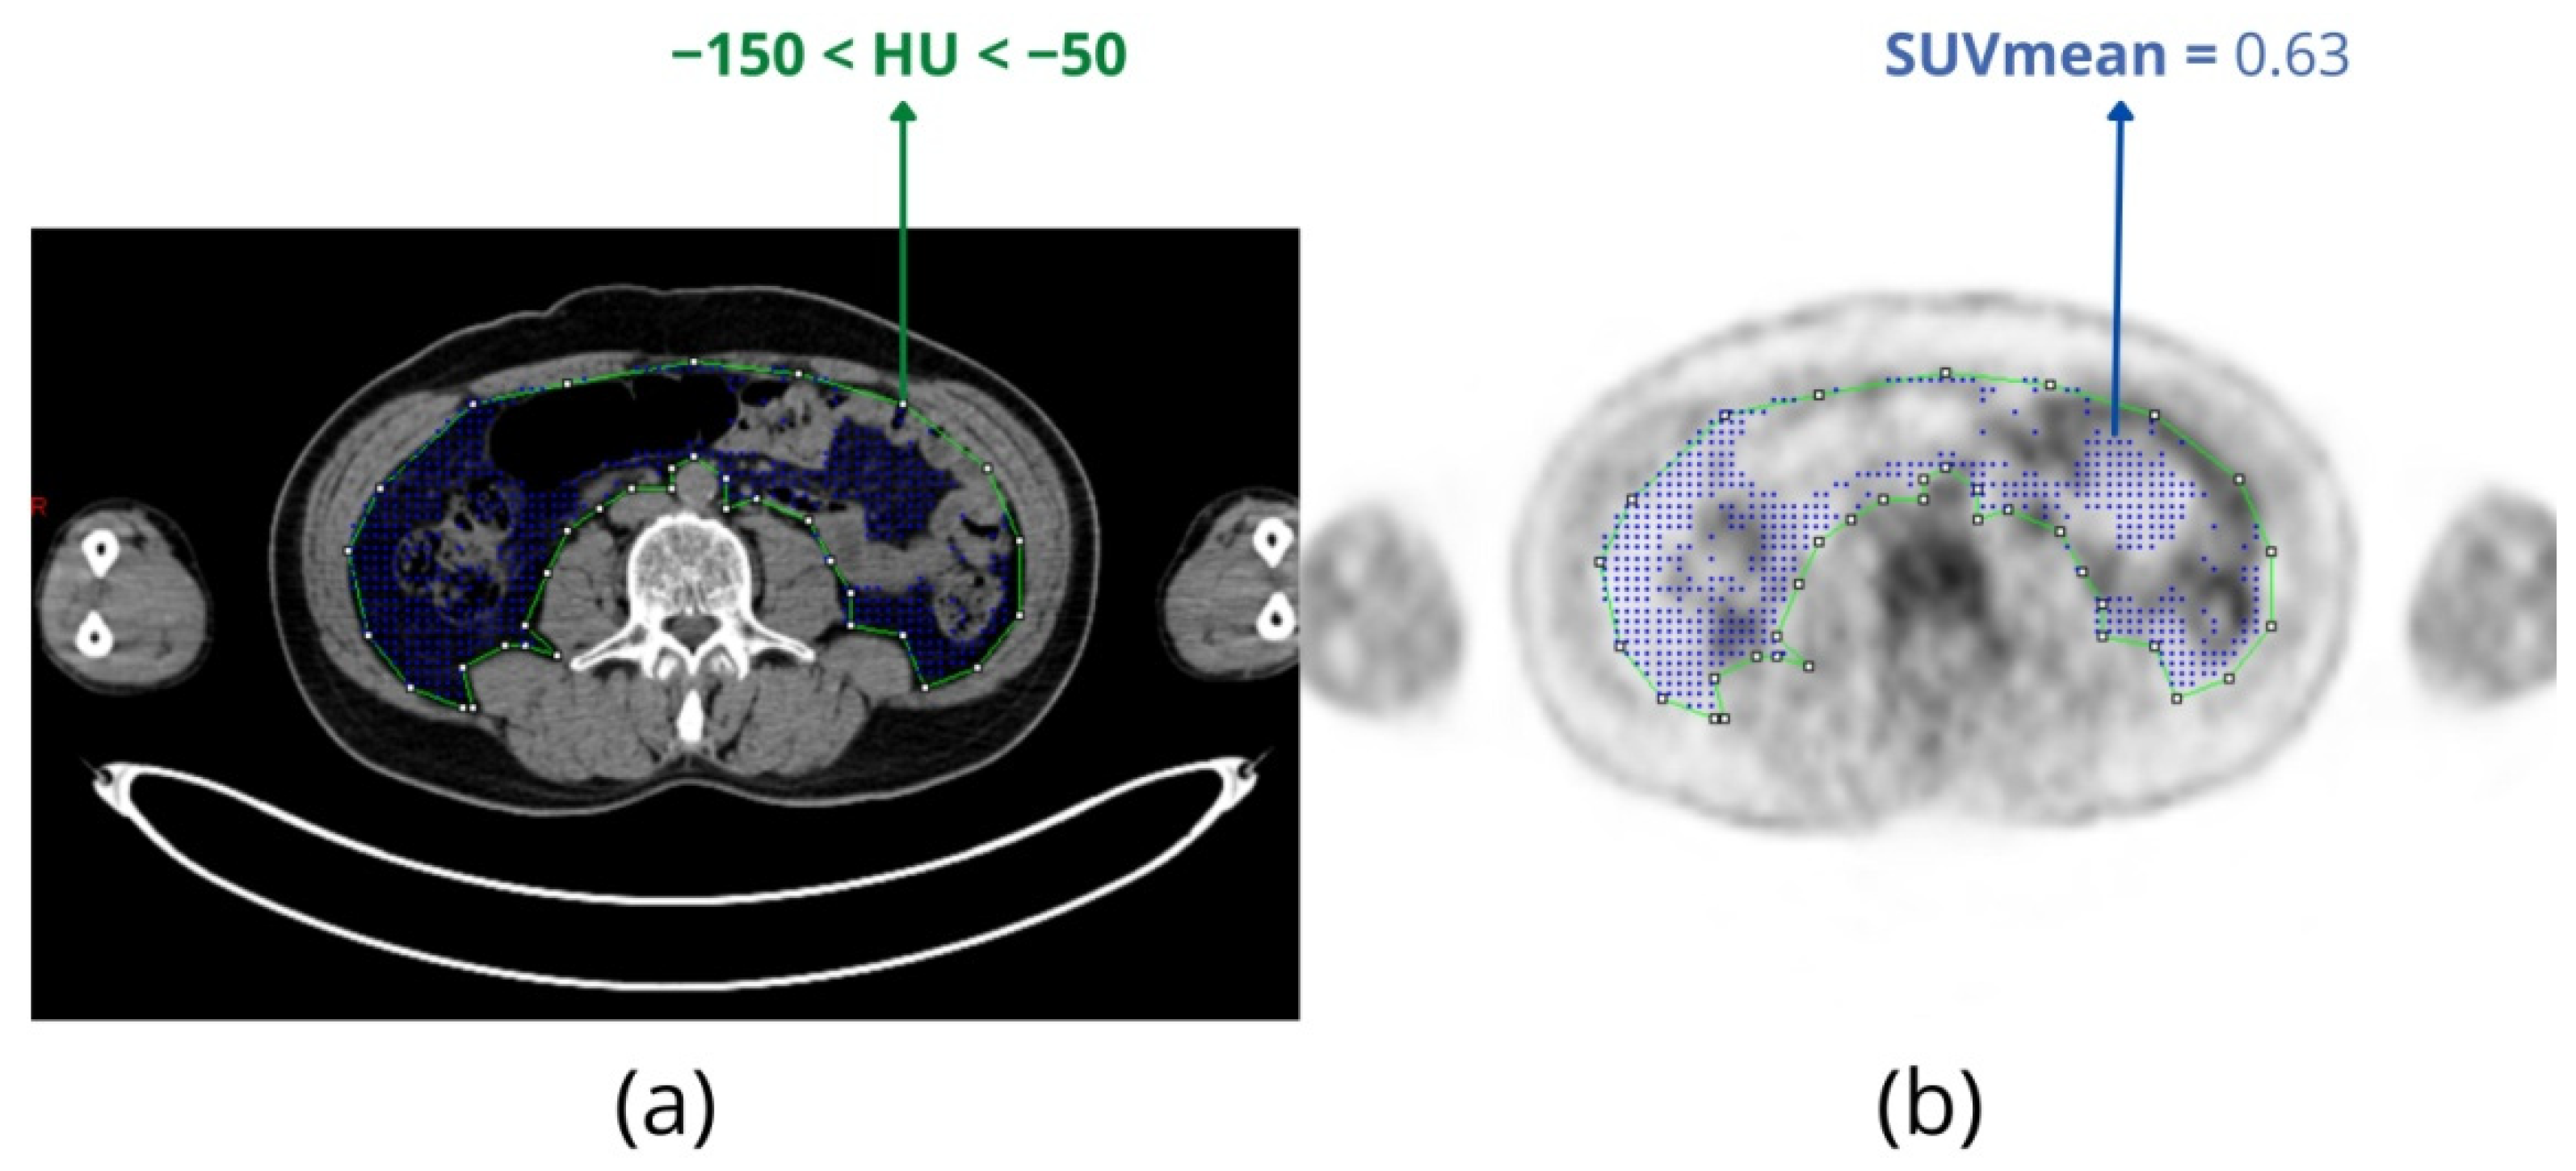
2.4. FDG Uptake of Adipose Tissue and Radiodensity
3. Artificial Intelligence for Estimating Total Metabolic Tumor Volume in Multiple Myeloma
4. Other Radiotracers Used for Multiple Myeloma
5. FDG-PET in Comparison with MRI and CT
6. Conclusions
Author Contributions
Funding
Institutional Review Board Statement
Informed Consent Statement
Data Availability Statement
Conflicts of Interest
References
- Laubach, J.; Richardson, P.; Anderson, K. Multiple myeloma. Annu Rev. Med. 2011, 62, 249–264. [Google Scholar] [CrossRef] [Green Version]
- Hungria, V.; Maiolino, A.; Martinez, G.; Colleoni, G.; Coelho, E.; Rocha, L.; Nunes, R.; Bittencourt, R.; Oliveira, L.; Faria, R.; et al. Confirmation of the utility of the International Staging System and identification of a unique pattern of disease in Brazilian patients with multiple myeloma. Haematologica 2008, 93, 791–792. [Google Scholar] [CrossRef] [Green Version]
- Kyle, R.; Child, J.; Anderson, K.; Barlogie, B.; Bataille, R.; Bensinger, W.; Blade, J.; Boccadoro, M.; Dalton, W.; Dimopoulos, M.; et al. Criteria for the classification of monoclonal gammopathies, multiple myeloma and related disorders: A report of the International Myeloma Working Group. Br. J. Haematol. 2003, 121, 749–757. [Google Scholar]
- van de Donk, N.W.C.J.; Pawlyn, C.; Yong, K.L. Multiple myeloma. Lancet 2021, 397, 410–427. [Google Scholar] [CrossRef]
- Kumar, S.; Lee, J.; Lahuerta, J.; Morgan, G.; Richardson, P.; Crowley, J.; Haessler, J.; Feather, J.; Hoering, A.; Moreau, P.; et al. Risk of progression and survival in multiple myeloma relapsing after therapy with IMiDs and bortezomib: A multicenter international myeloma working group study. Leukemia 2012, 26, 149–157. [Google Scholar] [CrossRef] [PubMed] [Green Version]
- Kumar, S.; Paiva, B.; Anderson, K.; Durie, B.; Landgren, O.; Moreau, P.; Munshi, N.; Lonial, S.; Blade, J.; Mateos, M.; et al. International Myeloma Working Group consensus criteria for response and minimal residual disease assessment in multiple myeloma. Lancet Oncol. 2016, 17, E328–E346. [Google Scholar] [CrossRef]
- Hillengass, J.; Usmani, S.; Rajkumar, S.V.; Durie, B.G.M.; Mateos, M.-V.; Lonial, S.; Joao, C.; Anderson, K.C.; García-Sanz, R.; Riva, E. International myeloma working group consensus recommendations on imaging in monoclonal plasma cell disorders. Lancet Oncol. 2019, 20, e302–e312. [Google Scholar] [CrossRef]
- Spinnato, P.; Bazzocchi, A.; Brioli, A.; Nanni, C.; Zamagni, E.; Albisinni, U.; Cavo, M.; Fanti, S.; Battista, G.; Salizzoni, E. Contrast enhanced MRI and 18F-FDG PET-CT in the assessment of multiple myeloma: A comparison of results in different phases of the disease. Eur. J. Radiol. 2012, 81, 4013–4018. [Google Scholar] [CrossRef]
- Derlin, T.; Weber, C.; Habermann, C.R.; Herrmann, J.; Wisotzki, C.; Ayuk, F.; Wolschke, C.; Klutmann, S.; Kröger, N. 18 F-FDG PET/CT for detection and localization of residual or recurrent disease in patients with multiple myeloma after stem cell transplantation. Eur. J. Nucl. Med. Mol. Imaging 2012, 39, 493–500. [Google Scholar] [CrossRef]
- Haznedar, R.; Akı, S.Z.; Akdemir, Ö.U.; Özkurt, Z.N.; Çeneli, Ö.; Yağcı, M.; Sucak, G.T.; Ünlü, M. Value of 18 F-fluorodeoxyglucose uptake in positron emission tomography/computed tomography in predicting survival in multiple myeloma. Eur. J. Nucl. Med. Mol. Imaging 2011, 38, 1046–1053. [Google Scholar] [CrossRef]
- Bartel, T.B.; Haessler, J.; Brown, T.L.Y.; Shaughnessy, J.D., Jr.; van Rhee, F.; Anaissie, E.; Alpe, T.; Angtuaco, E.; Walker, R.; Epstein, J. F18-fluorodeoxyglucose positron emission tomography in the context of other imaging techniques and prognostic factors in multiple myeloma. Blood J. Am. Soc. Hematol. 2009, 114, 2068–2076. [Google Scholar] [CrossRef] [Green Version]
- Zamagni, E.; Patriarca, F.; Nanni, C.; Zannetti, B.; Englaro, E.; Pezzi, A.; Tacchetti, P.; Buttignol, S.; Perrone, G.; Brioli, A. Prognostic relevance of 18-F FDG PET/CT in newly diagnosed multiple myeloma patients treated with up-front autologous transplantation. Blood J. Am. Soc. Hematol. 2011, 118, 5989–5995. [Google Scholar] [CrossRef] [PubMed] [Green Version]
- Cavo, M.; Terpos, E.; Nanni, C.; Moreau, P.; Lentzsch, S.; Zweegman, S.; Hillengass, J.; Engelhardt, M.; Usmani, S.Z.; Vesole, D.H. Role of 18F-FDG PET/CT in the diagnosis and management of multiple myeloma and other plasma cell disorders: A consensus statement by the International Myeloma Working Group. Lancet Oncol. 2017, 18, e206–e217. [Google Scholar] [CrossRef]
- Bertamini, L.; D’Agostino, M.; Gay, F. MRD Assessment in Multiple Myeloma: Progress and Challenges. Curr. Hematol. Malig. Rep. 2021, 16, 162–171. [Google Scholar] [CrossRef] [PubMed]
- Zamagni, E.; Nanni, C.; Dozza, L.; Carlier, T.; Bailly, C.; Tacchetti, P.; Versari, A.; Chauvie, S.; Gallamini, A.; Gamberi, B. Standardization of 18F-FDG–PET/CT According to Deauville Criteria for Metabolic Complete Response Definition in Newly Diagnosed Multiple Myeloma. J. Clin. Oncol. 2021, 39, 116–125. [Google Scholar] [CrossRef] [PubMed]
- Nanni, C.; Versari, A.; Chauvie, S.; Bertone, E.; Bianchi, A.; Rensi, M.; Bellò, M.; Gallamini, A.; Patriarca, F.; Gay, F. Interpretation criteria for FDG PET/CT in multiple myeloma (IMPeTUs): Final results. IMPeTUs (Italian myeloma criteria for PET USe). Eur. J. Nucl. Med. Mol. Imaging 2018, 45, 712–719. [Google Scholar] [CrossRef]
- Nanni, C.; Zamagni, E.; Versari, A.; Chauvie, S.; Bianchi, A.; Rensi, M.; Bellò, M.; Rambaldi, I.; Gallamini, A.; Patriarca, F.; et al. Image interpretation criteria for FDG PET/CT in multiple myeloma: A new proposal from an Italian expert panel. IMPeTUs (Italian Myeloma criteria for PET USe). Eur J. Nucl Med. Mol. Imaging 2016, 43, 414–421. [Google Scholar] [CrossRef]
- Sollini, M.; Bandera, F.; Kirienko, M. Quantitative imaging biomarkers in nuclear medicine: From SUV to image mining studies. Highlights from annals of nuclear medicine 2018. Eur. J. Nucl. Med. Mol. Imaging 2019, 46, 2737–2745. [Google Scholar] [CrossRef]
- Stolzenburg, A.; Lückerath, K.; Samnick, S.; Speer, M.; Kneer, K.; Schmid, J.-S.; Grigoleit, G.U.; Hofmann, S.; Beer, A.J.; Bunjes, D. Prognostic value of [18 F] FDG-PET/CT in multiple myeloma patients before and after allogeneic hematopoietic cell transplantation. Eur. J. Nucl. Med. Mol. Imaging 2018, 45, 1694–1704. [Google Scholar] [CrossRef]
- Fonti, R.; Larobina, M.; Del Vecchio, S.; De Luca, S.; Fabbricini, R.; Catalano, L.; Pane, F.; Salvatore, M.; Pace, L. Metabolic tumor volume assessed by 18F-FDG PET/CT for the prediction of outcome in patients with multiple myeloma. J. Nucl. Med. 2012, 53, 1829–1835. [Google Scholar] [CrossRef] [Green Version]
- McDonald, J.E.; Kessler, M.M.; Gardner, M.W.; Buros, A.F.; Ntambi, J.A.; Waheed, S.; van Rhee, F.; Zangari, M.; Heuck, C.J.; Petty, N. Assessment of total lesion glycolysis by 18F FDG PET/CT significantly improves prognostic value of GEP and ISS in myeloma. Clin. Cancer Res. 2017, 23, 1981–1987. [Google Scholar] [CrossRef] [PubMed] [Green Version]
- Terao, T.; Machida, Y.; Tsushima, T.; Miura, D.; Narita, K.; Kitadate, A.; Takeuchi, M.; Matsue, K. Pre-treatment metabolic tumour volume and total lesion glycolysis are superior to conventional positron-emission tomography/computed tomography variables for outcome prediction in patients with newly diagnosed multiple myeloma in clinical practice. Br. J. Haematol. 2020, 191, 223–230. [Google Scholar] [CrossRef]
- Powsner, R.A.; Palmer, M.R.; Powsner, E.R. Essentials of Nuclear Medicine Physics and Instrumentation, 3rd ed.; Wiley-Blackwell: Chichester, UK, 2013; 236p. [Google Scholar]
- Bailly, C.; Carlier, T.; Jamet, B.; Eugene, T.; Touzeau, C.; Attal, M.; Hulin, C.; Facon, T.; Leleu, X.; Perrot, A. Interim PET analysis in first-line therapy of multiple myeloma: Prognostic value of δSUVmax in the FDG-avid patients of the IMAJEM study. Clin. Cancer Res. 2018, 24, 5219–5224. [Google Scholar] [CrossRef] [Green Version]
- Liu, C.; Pierce Ii, L.A.; Alessio, A.M.; Kinahan, P.E. The impact of respiratory motion on tumor quantification and delineation in static PET/CT imaging. Phys. Med. Biol. 2009, 54, 7345–7362. [Google Scholar] [CrossRef] [PubMed] [Green Version]
- Lindholm, P.; Minn, H.; Leskinen-Kallio, S.; Bergman, J.; Ruotsalainen, U.; Joensuu, H. Influence of the blood glucose concentration on FDG uptake in cancer—A PET study. J. Nucl. Med. 1993, 34, 1–6. [Google Scholar]
- Ramos, C.D.; Erdi, Y.E.; Gonen, M.; Riedel, E.; Yeung, H.W.D.; Macapinlac, H.A.; Chisin, R.; Larson, S.M. FDG-PET standardized uptake values in normal anatomical structures using iterative reconstruction segmented attenuation correction and filtered back-projection. Eur. J. Nucl. Med. 2001, 28, 155–164. [Google Scholar] [CrossRef]
- Soret, M.; Bacharach, S.L.; Buvat, I. Partial-volume effect in PET tumor imaging. J. Nucl. Med. 2007, 48, 932–945. [Google Scholar] [CrossRef] [Green Version]
- Vanderhoek, M.; Perlman, S.; Jeraj, R. Impact of the Definition of Peak Standardized Uptake Value on Quantification of Treatment Response. J. Nucl. Med. 2012, 53, 4–11. [Google Scholar] [CrossRef] [Green Version]
- Zasadny, K.R.; Wahl, R.L. Standardized uptake values of normal tissues at PET with 2-[fluorine-18]-fluoro-2-deoxy-D-glucose: Variations with body weight and a method for correction. Radiology 1993, 189, 847–850. [Google Scholar] [CrossRef] [PubMed]
- Wahl, R.; Jacene, H.; Kasamon, Y.; Lodge, M. From RECIST to PERCIST: Evolving Considerations for PET Response Criteria in Solid Tumors. J. Nucl. Med. 2009, 50, 122S–150S. [Google Scholar] [CrossRef] [PubMed] [Green Version]
- Amini, B.; Nakache, Y.-P.N.; Nardo, L.; Manasanch, E.E.; Sun, J.; Lenchik, L.; Boutin, R.D. Marrow uptake on FDG PET/CT is associated with progression from smoldering to symptomatic multiple myeloma. Skelet. Radiol. 2021, 50, 79–85. [Google Scholar] [CrossRef]
- Ak, İ.; Gulbas, Z. F-18 FDG uptake of bone marrow on PET/CT scan: It’s correlation with CD38/CD138 expressing myeloma cells in bone marrow of patients with multiple myeloma. Ann. Hematol. 2011, 90, 81–87. [Google Scholar] [CrossRef]
- Takahashi, M.E.S.; Mosci, C.; Souza, E.M.; Brunetto, S.Q.; de Souza, C.; Pericole, F.V.; Lorand-Metze, I.; Ramos, C.D. Computed tomography–based skeletal segmentation for quantitative PET metrics of bone involvement in multiple myeloma. Nucl. Med. Commun. 2020, 41, 377–382. [Google Scholar] [CrossRef] [PubMed]
- Acosta-Montenegro, O.; Raynor, W.; Oestergaard, B.; Zadeh, M.Z.; Taghvaei, R.; Constantinescu, C.; Werner, T.; Abildgaard, N.; Hoilund-Carlsen, P.F.; Alavi, A. Feasibility of using global FDG uptake in bone marrow to assess treatment of multiple myeloma. Soc. Nucl. Med. 2017, 58, 189. [Google Scholar]
- Zadeh, M.Z.; Raynor, W.; Oestergaard, B.; Taghvaei, R.; Acosta-Montenegro, O.; Seraj, S.M.; Saboury, B.; Yellanki, D.; Al-Zaghal, A.; Ayubcha, C. Changes in bone marrow FDG uptake in multiple myeloma patients before and after treatment. Soc. Nucl. Med. 2018, 59, 1430. [Google Scholar]
- Takahashi, M.E.S.; Mosci, C.; Souza, E.M.; Brunetto, S.Q.; Etchebehere, E.; Santos, A.O.; Camacho, M.R.; Miranda, E.; Lima, M.C.L.; Amorim, B.J.; et al. Proposal for a Quantitative 18F-FDG PET/CT Metabolic Parameter to Assess the Intensity of Bone Involvement in Multiple Myeloma. Sci. Rep. 2019, 9, 16429. [Google Scholar] [CrossRef] [Green Version]
- Duarte, P.S.; Sapienza, M.T. Letter to the Editor: It is time for the nuclear medicine community to define a unit for the total lesion glycolysis (TLG) and similar metrics. Eur. J. Nucl. Med. Mol. Imaging 2021, 48, 2312–2313. [Google Scholar] [CrossRef]
- Starmans, M.P.A.; van der Voort, S.R.; Tovar, J.M.C.; Veenland, J.F.; Klein, S.; Niessen, W.J. Radiomics: Data mining using quantitative medical image features. In Handbook of Medical Image Computing and Computer Assisted Intervention; Elsevier: Amsterdam, The Netherlands, 2020; pp. 429–456. [Google Scholar]
- Foster, B.; Bagci, U.; Mansoor, A.; Xu, Z.; Mollura, D.J. A review on segmentation of positron emission tomography images. Comput. Biol. Med. 2014, 50, 76–96. [Google Scholar] [CrossRef] [Green Version]
- Im, H.-J.; Bradshaw, T.; Solaiyappan, M.; Cho, S.Y. Current methods to define metabolic tumor volume in positron emission tomography: Which one is better? Nucl. Med. Mol. Imaging 2018, 52, 5–15. [Google Scholar] [CrossRef] [PubMed]
- Terao, T.; Machida, Y.; Hirata, K.; Kuzume, A.; Tabata, R.; Tsushima, T.; Miura, D.; Narita, K.; Takeuchi, M.; Tateishi, U. Prognostic Impact of Metabolic Heterogeneity in Patients With Newly Diagnosed Multiple Myeloma Using 18F-FDG PET/CT. Clin. Nucl. Med. 2021, 46, 790–796. [Google Scholar] [CrossRef]
- Boellaard, R.; Delgado-Bolton, R.; Oyen, W.J.G.; Giammarile, F.; Tatsch, K.; Eschner, W.; Verzijlbergen, F.J.; Barrington, S.F.; Pike, L.C.; Weber, W.A. FDG PET/CT: EANM procedure guidelines for tumour imaging: Version 2.0. Eur. J. Nucl. Med. Mol. Imaging 2015, 42, 328–354. [Google Scholar] [CrossRef]
- Meignan, M.; Sasanelli, M.; Casasnovas, R.O.; Luminari, S.; Fioroni, F.; Coriani, C.; Masset, H.; Itti, E.; Gobbi, P.G.; Merli, F. Metabolic tumour volumes measured at staging in lymphoma: Methodological evaluation on phantom experiments and patients. Eur. J. Nucl. Med. Mol. Imaging 2014, 41, 1113–1122. [Google Scholar] [CrossRef] [PubMed]
- Eude, F.; Toledano, M.N.; Vera, P.; Tilly, H.; Mihailescu, S.-D.; Becker, S. Reproducibility of Baseline Tumour Metabolic Volume Measurements in Diffuse Large B-Cell LymphomA: Is There a Superior Method? Metabolites 2021, 11, 72. [Google Scholar] [CrossRef] [PubMed]
- Li, J.; Tan, H.; Xu, T.; Shi, H.; Liu, P. Bone marrow tracer uptake pattern of PET-CT in multiple myeloma: Image interpretation and prognostic value. Ann. Hematol. 2021, 100, 2979–2988. [Google Scholar] [CrossRef] [PubMed]
- Takahashi, M.E.S.; Mosci, C.; Duarte, G.O.; Pericole, F.V.; Metze, K.; Lorand-Metze, I.G.H.; Ramos, C.D. Intensity of bone involvement: A quantitative 18F-FDG PET/CT evaluation for monitoring outcome of multiple myeloma. Nucl. Med. Commun. 2021, 42, 1375–1381. [Google Scholar] [CrossRef]
- Sachpekidis, C.; Türk, M.; Dimitrakopoulou-Strauss, A. Quantitative, Dynamic 18F-FDG PET/CT in Monitoring of Smoldering Myeloma: A Case Report. Diagnostics 2021, 11, 649. [Google Scholar] [CrossRef]
- Pressoir, M.; Desné, S.; Berchery, D.; Rossignol, G.; Poiree, B.; Meslier, M.; Traversier, S.; Vittot, M.; Simon, M.; Gekiere, J.P. Prevalence, risk factors and clinical implications of malnutrition in French Comprehensive Cancer Centres. Br. J. Cancer 2010, 102, 966–971. [Google Scholar] [CrossRef] [Green Version]
- Baracos, V.E.; Martin, L.; Korc, M.; Guttridge, D.C.; Fearon, K.C.H. Cancer-associated cachexia. Nat. Rev. Dis. Primers 2018, 4, 17105. [Google Scholar] [CrossRef]
- Frankenfield, D.C. Bias and accuracy of resting metabolic rate equations in non-obese and obese adults. Clin. Nutr. 2013, 32, 976–982. [Google Scholar] [CrossRef]
- Martin, L.; Birdsell, L.; MacDonald, N.; Reiman, T.; Clandinin, M.T.; McCargar, L.J.; Murphy, R.; Ghosh, S.; Sawyer, M.B.; Baracos, V.E. Cancer cachexia in the age of obesity: Skeletal muscle depletion is a powerful prognostic factor, independent of body mass index. J. Clin. Oncol. 2013, 31, 1539–1547. [Google Scholar] [CrossRef]
- GroΔ, J.P.; Nattenmüller, J.; Hemmer, S.; Tichy, D.; Krzykalla, J.; Goldschmidt, H.; Bertsch, U.; Delorme, S.; Kauczor, H.-U.; Hillengass, J. Body fat composition as predictive factor for treatment response in patients with newly diagnosed multiple myeloma–subgroup analysis of the prospective GMMG MM5 trial. Oncotarget 2017, 8, 68460–68471. [Google Scholar] [PubMed]
- Takeoka, Y.; Sakatoku, K.; Miura, A.; Yamamura, R.; Araki, T.; Seura, H.; Okamura, T.; Koh, H.; Nakamae, H.; Hino, M. Prognostic effect of low subcutaneous adipose tissue on survival outcome in patients with multiple myeloma. Clin. Lymphoma Myeloma Leuk. 2016, 16, 434–441. [Google Scholar] [CrossRef] [PubMed]
- da Cunha Júnior, A.D.; Silveira, M.N.; Takahashi, M.E.S.; de Souza, E.M.; Mosci, C.; Ramos, C.D.; Brambilla, S.R.; Pericole, F.V.; Prado, C.M.; Mendes, M.C.S. Adipose tissue radiodensity: A new prognostic biomarker in people with multiple myeloma. Nutrition 2021, 86, 111141. [Google Scholar] [CrossRef] [PubMed]
- da Cunha Júnior, A.D.; Silveira, M.N.; Takahashi, M.E.S.; de Souza, E.M.; Mosci, C.; Ramos, C.D.; Brambilla, S.R.; Pericole, F.V.; Prado, C.M.; Mendes, M.C.S. Visceral adipose tissue glucose uptake is linked to prognosis in multiple myeloma patients: An exploratory study. Clin. Nutr. 2021, 40, 4075–4084. [Google Scholar] [CrossRef]
- Kir, S.; White, J.P.; Kleiner, S.; Kazak, L.; Cohen, P.; Baracos, V.E.; Spiegelman, B.M. Tumour-derived PTH-related protein triggers adipose tissue browning and cancer cachexia. Nature 2014, 513, 100–104. [Google Scholar] [CrossRef]
- Petruzzelli, M.; Schweiger, M.; Schreiber, R.; Campos-Olivas, R.; Tsoli, M.; Allen, J.; Swarbrick, M.; Rose-John, S.; Rincon, M.; Robertson, G. A switch from white to brown fat increases energy expenditure in cancer-associated cachexia. Cell Metab. 2014, 20, 433–447. [Google Scholar] [CrossRef] [Green Version]
- Ahmadi, N.; Hajsadeghi, F.; Conneely, M.; Mingos, M.; Arora, R.; Budoff, M.; Ebrahimi, R. Accurate detection of metabolically active “brown” and “white” adipose tissues with computed tomography. Acad. Radiol. 2013, 20, 1443–1447. [Google Scholar] [CrossRef]
- Ebadi, M.; Moctezuma-Velazquez, C.; Meza-Junco, J.; Baracos, V.E.; DunichandHoedl, A.R.; Ghosh, S.; Sarlieve, P.; Owen, R.J.; Kneteman, N.; Montano-Loza, A.J. Visceral Adipose Tissue Radiodensity Is Linked to Prognosis in Hepatocellular Carcinoma Patients Treated with Selective Internal Radiation Therapy. Cancers 2020, 12, 356. [Google Scholar] [CrossRef] [Green Version]
- Mössenböck, K.; Vegiopoulos, A.; Rose, A.J.; Sijmonsma, T.P.; Herzig, S.; Schafmeier, T. Browning of white adipose tissue uncouples glucose uptake from insulin signaling. PLoS ONE 2014, 9, e110428. [Google Scholar] [CrossRef] [Green Version]
- Pahk, K.; Rhee, S.; Kim, S.; Choe, J. Predictive Role of Functional Visceral Fat Activity Assessed by Preoperative F-18 FDG PET/CT for Regional Lymph Node or Distant Metastasis in Patients with Colorectal Cancer. PLoS ONE 2016, 11, e148776. [Google Scholar] [CrossRef]
- Currie, G.M. Intelligent imaging: Artificial intelligence augmented nuclear medicine. J. Nucl. Med. Technol. 2019, 47, 217–222. [Google Scholar] [CrossRef]
- Seifert, R.; Weber, M.; Kocakavuk, E.; Rischpler, C.; Kersting, D. Artificial intelligence and machine learning in nuclear medicine: Future perspectives. Semin. Nucl. Med. 2021, 51, 170–177. [Google Scholar] [CrossRef]
- de Souza-Filho, E.M.; de Amorim Fernandes, F. Deep Learning and Artificial Intelligence in Nuclear Cardiology. In Nuclear Cardiology: Basic and Advanced Concepts in Clinical Practice; Mesquita, C.T., Rezende, M.F., Eds.; Springer International Publishing: Berlin/Heidelberg, Germany, 2021; pp. 741–762. [Google Scholar]
- Yan, W.; Shi, H.; He, T.; Chen, J.; Wang, C.; Liao, A.; Yang, W.; Wang, H. Employment of Artificial Intelligence Based on Routine Laboratory Results for the Early Diagnosis of Multiple Myeloma. Front. Oncol. 2021, 11, 608191. [Google Scholar] [CrossRef]
- Deulofeu, M.; Kolarova, L.; Salvado, V.; Pena-Mendez, E.; Almasi, M.; Stork, M.; Pour, L.; Boadas-Vaello, P.; Sevcikova, S.; Havel, J.; et al. Rapid discrimination of multiple myeloma patients by artificial neural networks coupled with mass spectrometry of peripheral blood plasma. Sci. Rep. 2019, 9, 7975. [Google Scholar] [CrossRef] [Green Version]
- Capobianco, N.; Meignan, M.; Cottereau, A.; Vercellino, L.; Sibille, L.; Spottiswoode, B.; Zuehlsdorff, S.; Casasnovas, O.; Thieblemont, C.; Buvat, I. Deep-Learning F-18-FDG Uptake Classification Enables Total Metabolic Tumor Volume Estimation in Diffuse Large B-Cell Lymphoma. J. Nucl. Med. 2021, 62, 30–36. [Google Scholar] [CrossRef] [PubMed]
- Jamet, B.; Morvan, L.; Nanni, C.; Michaud, A.; Bailly, C.; Chauvie, S.; Moreau, P.; Touzeau, C.; Zamagni, E.; Bodet-Milin, C.; et al. Random survival forest to predict transplant-eligible newly diagnosed multiple myeloma outcome including FDG-PET radiomics: A combined analysis of two independent prospective European trials. Eur. J. Nucl. Med. Mol. Imaging 2021, 48, 1005–1015. [Google Scholar] [CrossRef]
- Froelich, J.; Salavati, A. Artificial Intelligence in PET/CT Is about to Make Whole-Body Tumor Burden Measurements a Clinical Reality. Radiology 2020, 294, 453–454. [Google Scholar] [CrossRef] [PubMed]
- Mosci, C.; Pericole, F.; Oliveira, G.; Delamain, M.; Takahashi, M.; Carvalheira, J.; Etchebehere, E.; Santos, A.; Miranda, E.; Lima, M.; et al. Tc-99m-sestamibi SPECT/CT and(18)F-FDG-PET/CT have similar performance but different imaging patterns in newly diagnosed multiple myeloma. Nucl. Med. Commun. 2020, 41, 1081–1088. [Google Scholar] [CrossRef]
- Biggi Mattiolli, A.; Lima, M.C.L.; Camacho, M.; Ramos, C.D.; Santos, A.O.; Etchebehere, E. 68Ga-PSMA PET/CT whole-body tumor burden in patients with biochemical recurrence of prostate cancer. Eur. J. Nucl. Med. Mol. Imaging 2019, 46, S307. [Google Scholar]
- Takahashi, M.E.S.; De Souza, S.; Frasson, F.C.; Pericole, F.; Ramos, C.D. Skeletal MTV Comparison of 68Ga-PSMA PET-CT with 18F-FDG PET-CT for Multiple Myeloma Patients. In Proceedings of the International Conference on Clinical PET-CT and Molecular Imaging in the Era of Theranostics (IPET-2020), Virtual, 24–26 November 2020; pp. 72–73. [Google Scholar]
- Kuyumcu, S.; Isik, E.G.; Tiryaki, T.O.; Has-Simsek, D.; Sanli, Y.; Buyukkaya, F.; Özkan, Z.G.; Kalayoglu-Besisik, S.; Unal, S.N. Prognostic significance of 68Ga-Pentixafor PET/CT in multiple myeloma recurrence: A comparison to 18F-FDG PET/CT and laboratory results. Ann. Nucl. Med. 2021, 35, 1147–1156. [Google Scholar] [CrossRef]
- Matteucci, F.; Paganelli, G.; Martinelli, G.; Cerchione, C. PET/CT in Multiple Myeloma: Beyond FDG. Front. Oncol. 2021, 10. [Google Scholar] [CrossRef]
- Sonmezoglu, K.; Vatankulu, B.; Elverdi, T.; Akyel, R.; Erkan, M.E.; Halac, M.; Ocak, M.; Demirci, E.; Aydin, Y. The role of 68Ga-DOTA-TATE PET/CT scanning in the evaluation of patients with multiple myeloma: Preliminary results. Nucl. Med. Commun. 2017, 38, 76–83. [Google Scholar] [CrossRef] [PubMed]
- Nooka, A.K.; Kaufman, J.L.; Hofmeister, C.C.; Joseph, N.S.; Heffner, T.L.; Gupta, V.A.; Sullivan, H.C.; Neish, A.S.; Dhodapkar, M.V.; Lonial, S. Daratumumab in multiple myeloma. Cancer 2019, 125, 2364–2382. [Google Scholar] [CrossRef] [PubMed]
- Ulaner, G.A.; Sobol, N.B.; O’Donoghue, J.A.; Kirov, A.S.; Riedl, C.C.; Min, R.; Smith, E.; Carter, L.M.; Lyashchenko, S.K.; Lewis, J.S. CD38-targeted immuno-PET of multiple myeloma: From xenograft models to first-in-human imaging. Radiology 2020, 295, 606–615. [Google Scholar] [CrossRef]
- Krishnan, A.; Adhikarla, V.; Poku, E.K.; Palmer, J.; Chaudhry, A.; Biglang-awa, V.E.; Bowles, N.; Nathwani, N.; Rosenzweig, M.; Sahebi, F. Identifying CD38+ cells in patients with multiple myeloma: First-in-human imaging using copper-64–labeled daratumumab. Blood Adv. 2020, 4, 5194–5202. [Google Scholar] [CrossRef] [PubMed]
- Wang, C.; Chen, Y.; Hou, Y.N.; Liu, Q.; Zhang, D.; Zhao, H.; Zhang, Y.; An, S.; Li, L.; Hou, J. ImmunoPET imaging of multiple myeloma with [68 Ga] Ga-NOTA-Nb1053. Eur. J. Nucl. Med. Mol. Imaging 2021, 48, 2749–2760. [Google Scholar] [CrossRef]
- Sawyer, J.R. The prognostic significance of cytogenetics and molecular profiling in multiple myeloma. Cancer Genet. 2011, 204, 3–12. [Google Scholar] [CrossRef]
- Rasche, L.; Kortüm, K.M.; Raab, M.S.; Weinhold, N. The impact of tumor heterogeneity on diagnostics and novel therapeutic strategies in multiple myeloma. Int. J. Mol. Sci. 2019, 20, 1248. [Google Scholar] [CrossRef] [Green Version]
- Hill, E.; Mena, E.; Morrison, C.; Dew, A.; Choyke, P.; Lindenberg, L.; Kazandjian, D. Diagnostic performance of 18F-FDG-PET/CT compared to standard skeletal survey for detecting bone destruction in smouldering multiple myeloma: Time to move forward. Br. J. Haematol. 2021, 193, 125–128. [Google Scholar] [CrossRef]
- Lütje, S.; de Rooy, J.W.J.; Croockewit, S.; Koedam, E.; Oyen, W.J.G.; Raymakers, R.A. Role of radiography, MRI and FDG-PET/CT in diagnosing, staging and therapeutical evaluation of patients with multiple myeloma. Ann. Hematol. 2009, 88, 1161–1168. [Google Scholar] [CrossRef] [Green Version]
- Princewill, K.; Kyere, S.; Awan, O.; Mulligan, M. Multiple myeloma lesion detection with whole body CT versus radiographic skeletal survey. Cancer Investig. 2013, 31, 206–211. [Google Scholar] [CrossRef]
- León, N.G.; Bueno, B.A.; Pérez, M.H.; Ramírez, L.F.L.; Alegre, A.; Colletti, P.M.; Rubello, D.; Carreras, J.L.; Bolton, R.C.D. Agreement Between 18F-FDG PET/CT and Whole-Body Magnetic Resonance Compared with Skeletal Survey for Initial Staging and Response at End-of-Treatment Evaluation of Patients with Multiple Myeloma. Clin. Nucl. Med. 2021, 46, 310–322. [Google Scholar] [CrossRef]
- Lecouvet, F.E.; Vekemans, M.-C.; Van Den Berghe, T.; Verstraete, K.; Kirchgesner, T.; Acid, S.; Malghem, J.; Wuts, J.; Hillengass, J.; Vandecaveye, V. Imaging of treatment response and minimal residual disease in multiple myeloma: State of the art WB-MRI and PET/CT. Skelet. Radiol. 2021, 51, 59–80. [Google Scholar] [CrossRef] [PubMed]
- Nanni, C. PET/CT in multiple myeloma. Méd. Nucl. 2017, 41, 216–220. [Google Scholar] [CrossRef]
- Sager, S.; Ergül, N.; Ciftci, H.; Cetin, G.; Güner, S.İ.; Cermik, T.F. The value of FDG PET/CT in the initial staging and bone marrow involvement of patients with multiple myeloma. Skelet. Radiol. 2011, 40, 843–847. [Google Scholar] [CrossRef]
- Zamagni, E.; Nanni, C.; Patriarca, F.; Englaro, E.; Castellucci, P.; Geatti, O.; Tosi, P.; Tacchetti, P.; Cangini, D.; Perrone, G.; et al. A prospective comparison of 18F-fluorodeoxyglucose positron emission tomography-computed tomography, magnetic resonance imaging and whole-body planar radiographs in the assessment of bone disease in newly diagnosed multiple myeloma. Haematologica 2007, 92, 50–55. [Google Scholar] [CrossRef]
- Nanni, C.; Zamagni, E.; Farsad, M.; Castellucci, P.; Tosi, P.; Cangini, D.; Salizzoni, E.; Canini, R.; Cavo, M.; Fanti, S. Role of 18F-FDG PET/CT in the assessment of bone involvement in newly diagnosed multiple myeloma: Preliminary results. Eur J. Nucl Med. Mol. Imaging 2006, 33, 525–531. [Google Scholar] [CrossRef]
- Seval, G.C.; Ozkan, E.; Beksac, M. PET with fluorodeoxyglucose F 18/computed tomography as a staging tool in multiple myeloma. PET Clin. 2019, 14, 369–381. [Google Scholar] [CrossRef]
- Gariani, J.; Westerland, O.; Natas, S.; Verma, H.; Cook, G.; Goh, V. Comparison of whole body magnetic resonance imaging (WBMRI) to whole body computed tomography (WBCT) or 18F-fluorodeoxyglucose positron emission tomography/CT (18F-FDG PET/CT) in patients with myeloma: Systematic review of diagnostic performance. Crit. Rev. Oncol. Hematol. 2018, 124, 66–72. [Google Scholar] [CrossRef] [PubMed] [Green Version]
- Breyer, R.J.; Mulligan, M.E.; Smith, S.E.; Line, B.R.; Badros, A.Z. Comparison of imaging with FDG PET/CT with other imaging modalities in myeloma. Skelet. Radiol. 2006, 35, 632–640. [Google Scholar] [CrossRef]
- Terao, T.; Machida, Y.; Narita, K.; Kuzume, A.; Tabata, R.; Tsushima, T.; Miura, D.; Takeuchi, M.; Tateishi, U.; Matsue, K. Total diffusion volume in MRI vs. total lesion glycolysis in PET/CT for tumor volume evaluation of multiple myeloma. Eur. Radiol. 2021, 31, 6136–6144. [Google Scholar] [CrossRef]
- Rasche, L.; Alapat, D.; Kumar, M.; Gershner, G.; McDonald, J.; Wardell, C.P.; Samant, R.; Van Hemert, R.; Epstein, J.; Williams, A.F. Combination of flow cytometry and functional imaging for monitoring of residual disease in myeloma. Leukemia 2019, 33, 1713–1722. [Google Scholar] [CrossRef] [PubMed]
- Chen, J.; Li, C.; Tian, Y.; Xiao, Q.; Deng, M.; Hu, H.; Wen, B.; He, Y. Comparison of whole-body DWI and 18F-FDG PET/CT for detecting intramedullary and extramedullary lesions in multiple myeloma. Am. J. Roentgenol. 2019, 213, 514–523. [Google Scholar] [CrossRef] [PubMed]
- Rasche, L.; Angtuaco, E.; McDonald, J.E.; Buros, A.; Stein, C.; Pawlyn, C.; Thanendrarajan, S.; Schinke, C.; Samant, R.; Yaccoby, S. Low expression of hexokinase-2 is associated with false-negative FDG–positron emission tomography in multiple myeloma. Blood J. Am. Soc. Hematol. 2017, 130, 30–34. [Google Scholar] [CrossRef] [PubMed] [Green Version]
- Kircher, S.; Stolzenburg, A.; Kortüm, K.M.; Kircher, M.; Da Via, M.; Samnick, S.; Buck, A.K.; Einsele, H.; Rosenwald, A.; Lapa, C. Hexokinase-2 expression in 11C-Methionine–positive, 18F-FDG–negative multiple myeloma. J. Nucl. Med. 2019, 60, 348–352. [Google Scholar] [CrossRef]


Publisher’s Note: MDPI stays neutral with regard to jurisdictional claims in published maps and institutional affiliations. |
© 2021 by the authors. Licensee MDPI, Basel, Switzerland. This article is an open access article distributed under the terms and conditions of the Creative Commons Attribution (CC BY) license (https://creativecommons.org/licenses/by/4.0/).
Share and Cite
Takahashi, M.E.S.; Lorand-Metze, I.; de Souza, C.A.; Mesquita, C.T.; Fernandes, F.A.; Carvalheira, J.B.C.; Ramos, C.D. Metabolic Volume Measurements in Multiple Myeloma. Metabolites 2021, 11, 875. https://0-doi-org.brum.beds.ac.uk/10.3390/metabo11120875
Takahashi MES, Lorand-Metze I, de Souza CA, Mesquita CT, Fernandes FA, Carvalheira JBC, Ramos CD. Metabolic Volume Measurements in Multiple Myeloma. Metabolites. 2021; 11(12):875. https://0-doi-org.brum.beds.ac.uk/10.3390/metabo11120875
Chicago/Turabian StyleTakahashi, Maria Emilia Seren, Irene Lorand-Metze, Carmino Antonio de Souza, Claudio Tinoco Mesquita, Fernando Amorim Fernandes, José Barreto Campello Carvalheira, and Celso Dario Ramos. 2021. "Metabolic Volume Measurements in Multiple Myeloma" Metabolites 11, no. 12: 875. https://0-doi-org.brum.beds.ac.uk/10.3390/metabo11120875