
Iron-Bound Lipocalin-2 Protects Renal Cell Carcinoma from Ferroptosis

 ,
,  ,
,  , and
, and 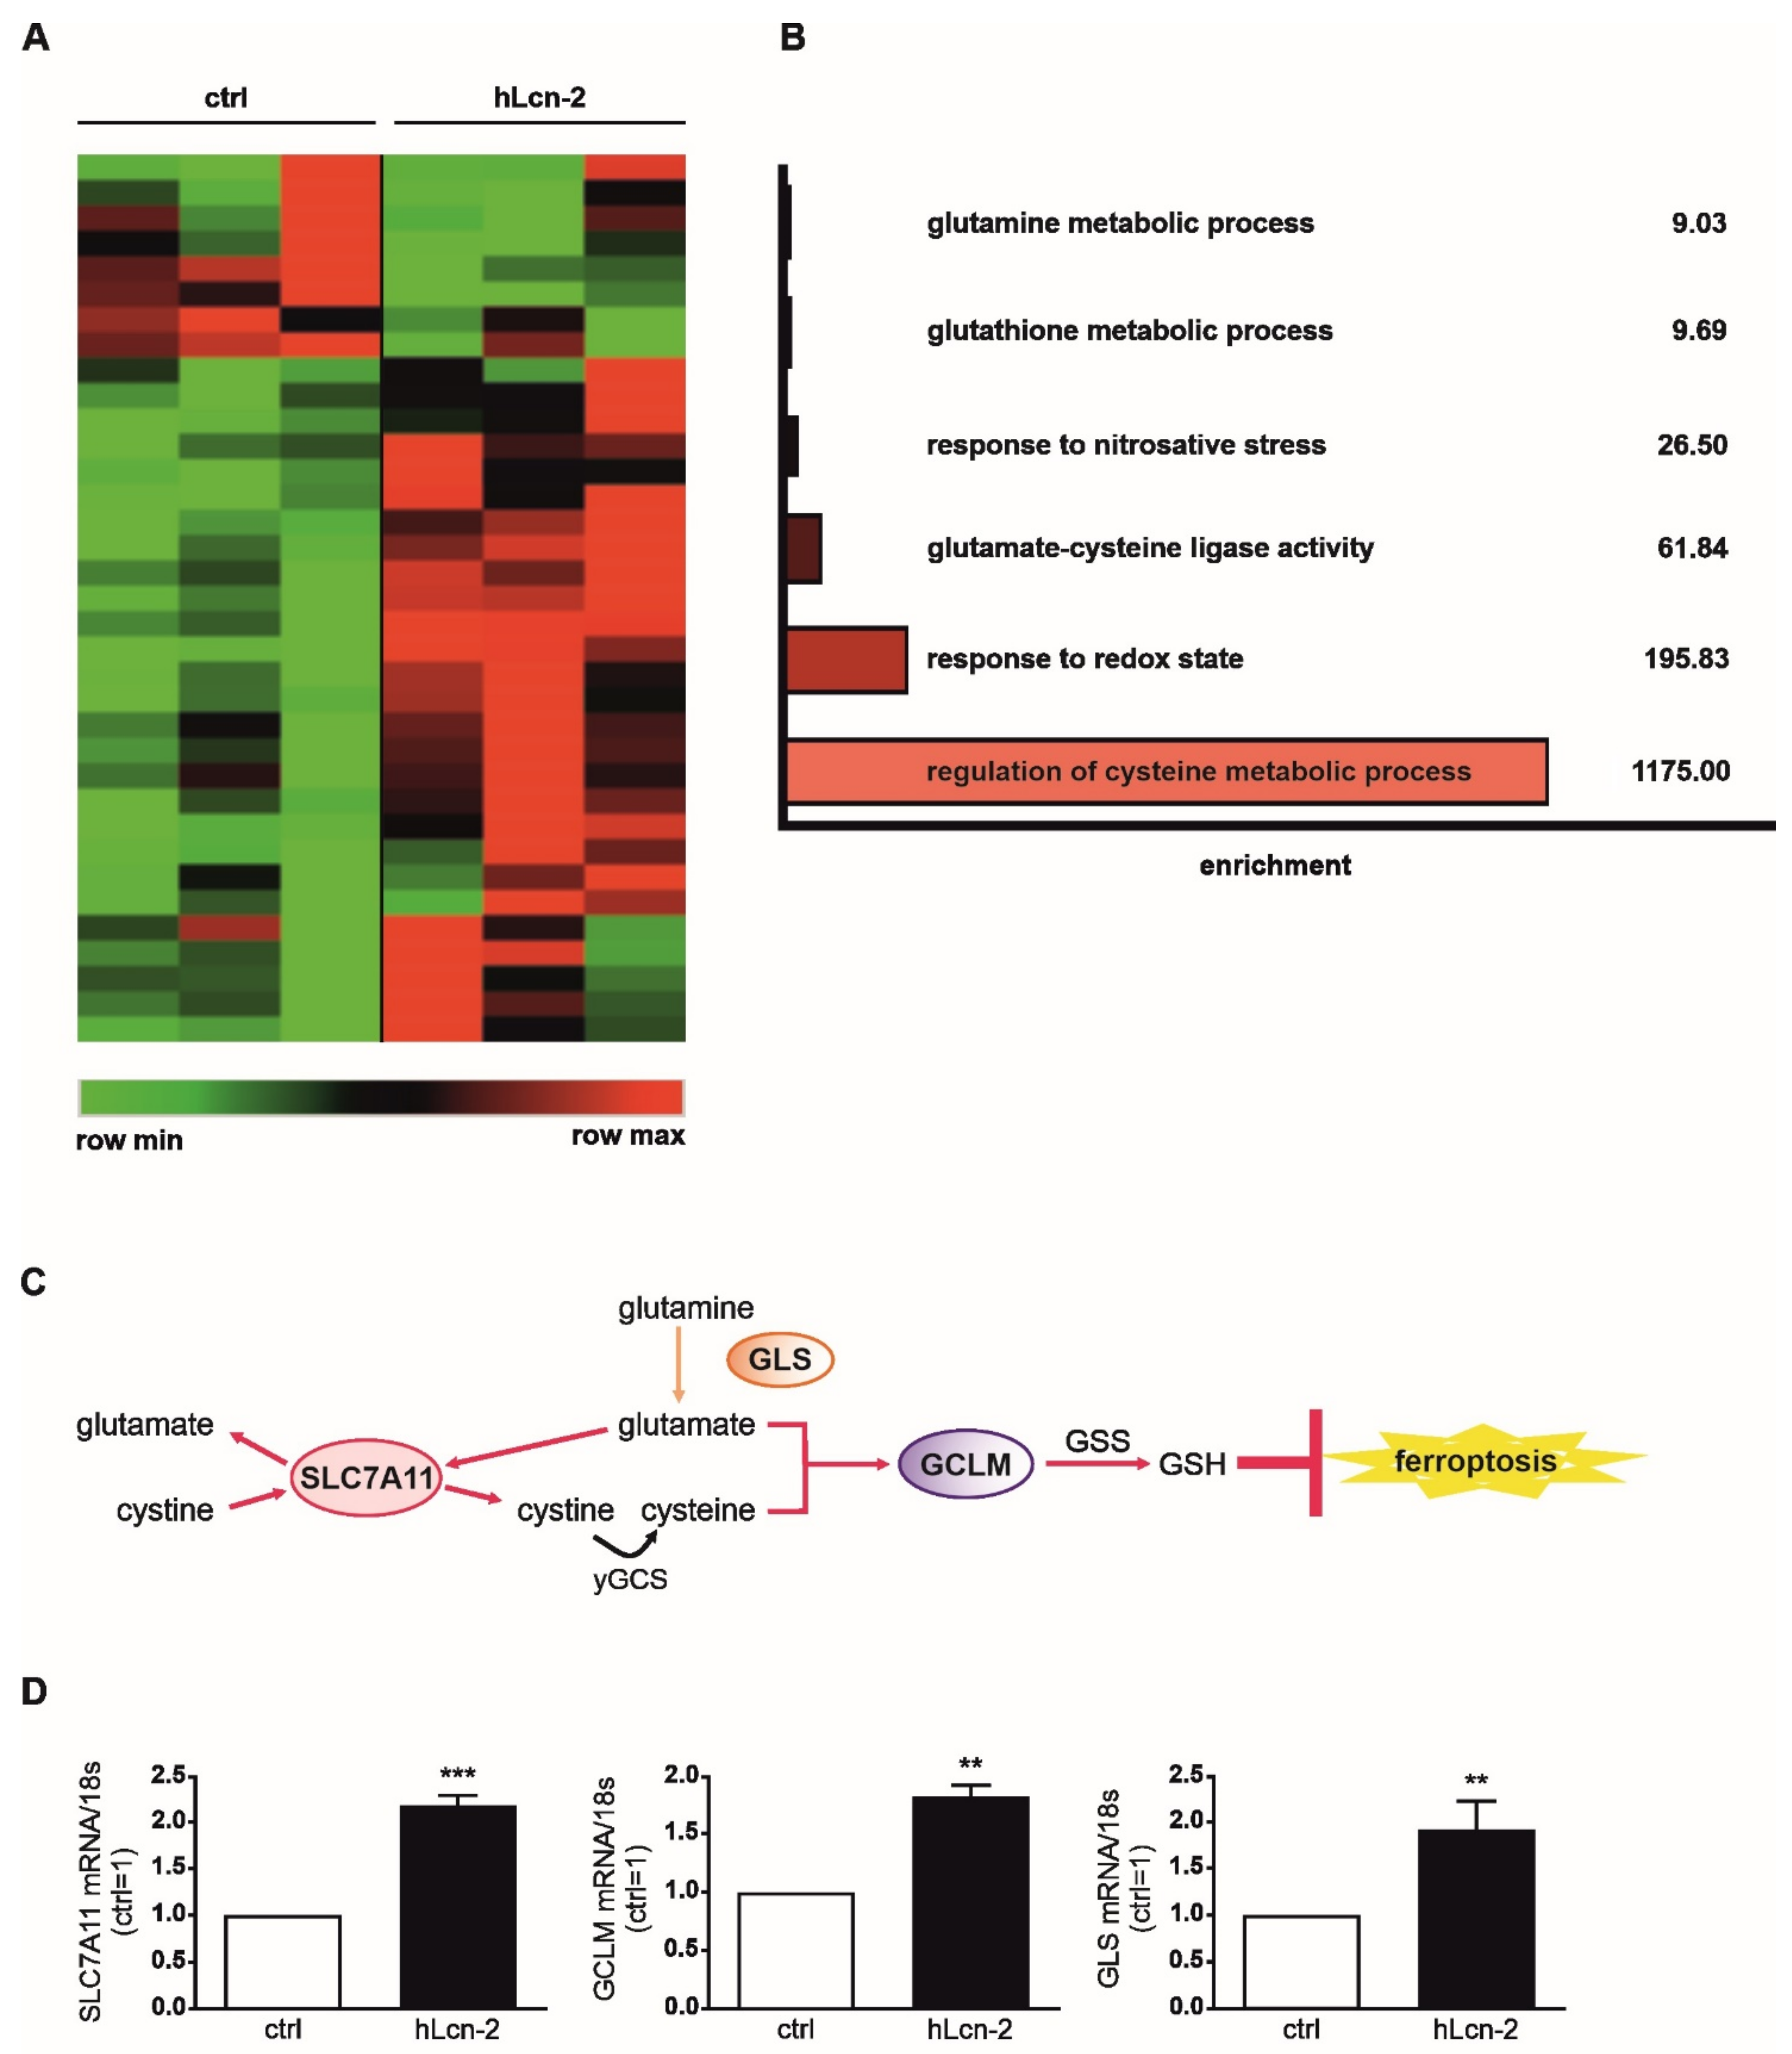
Abstract
:1. Introduction
2. Results
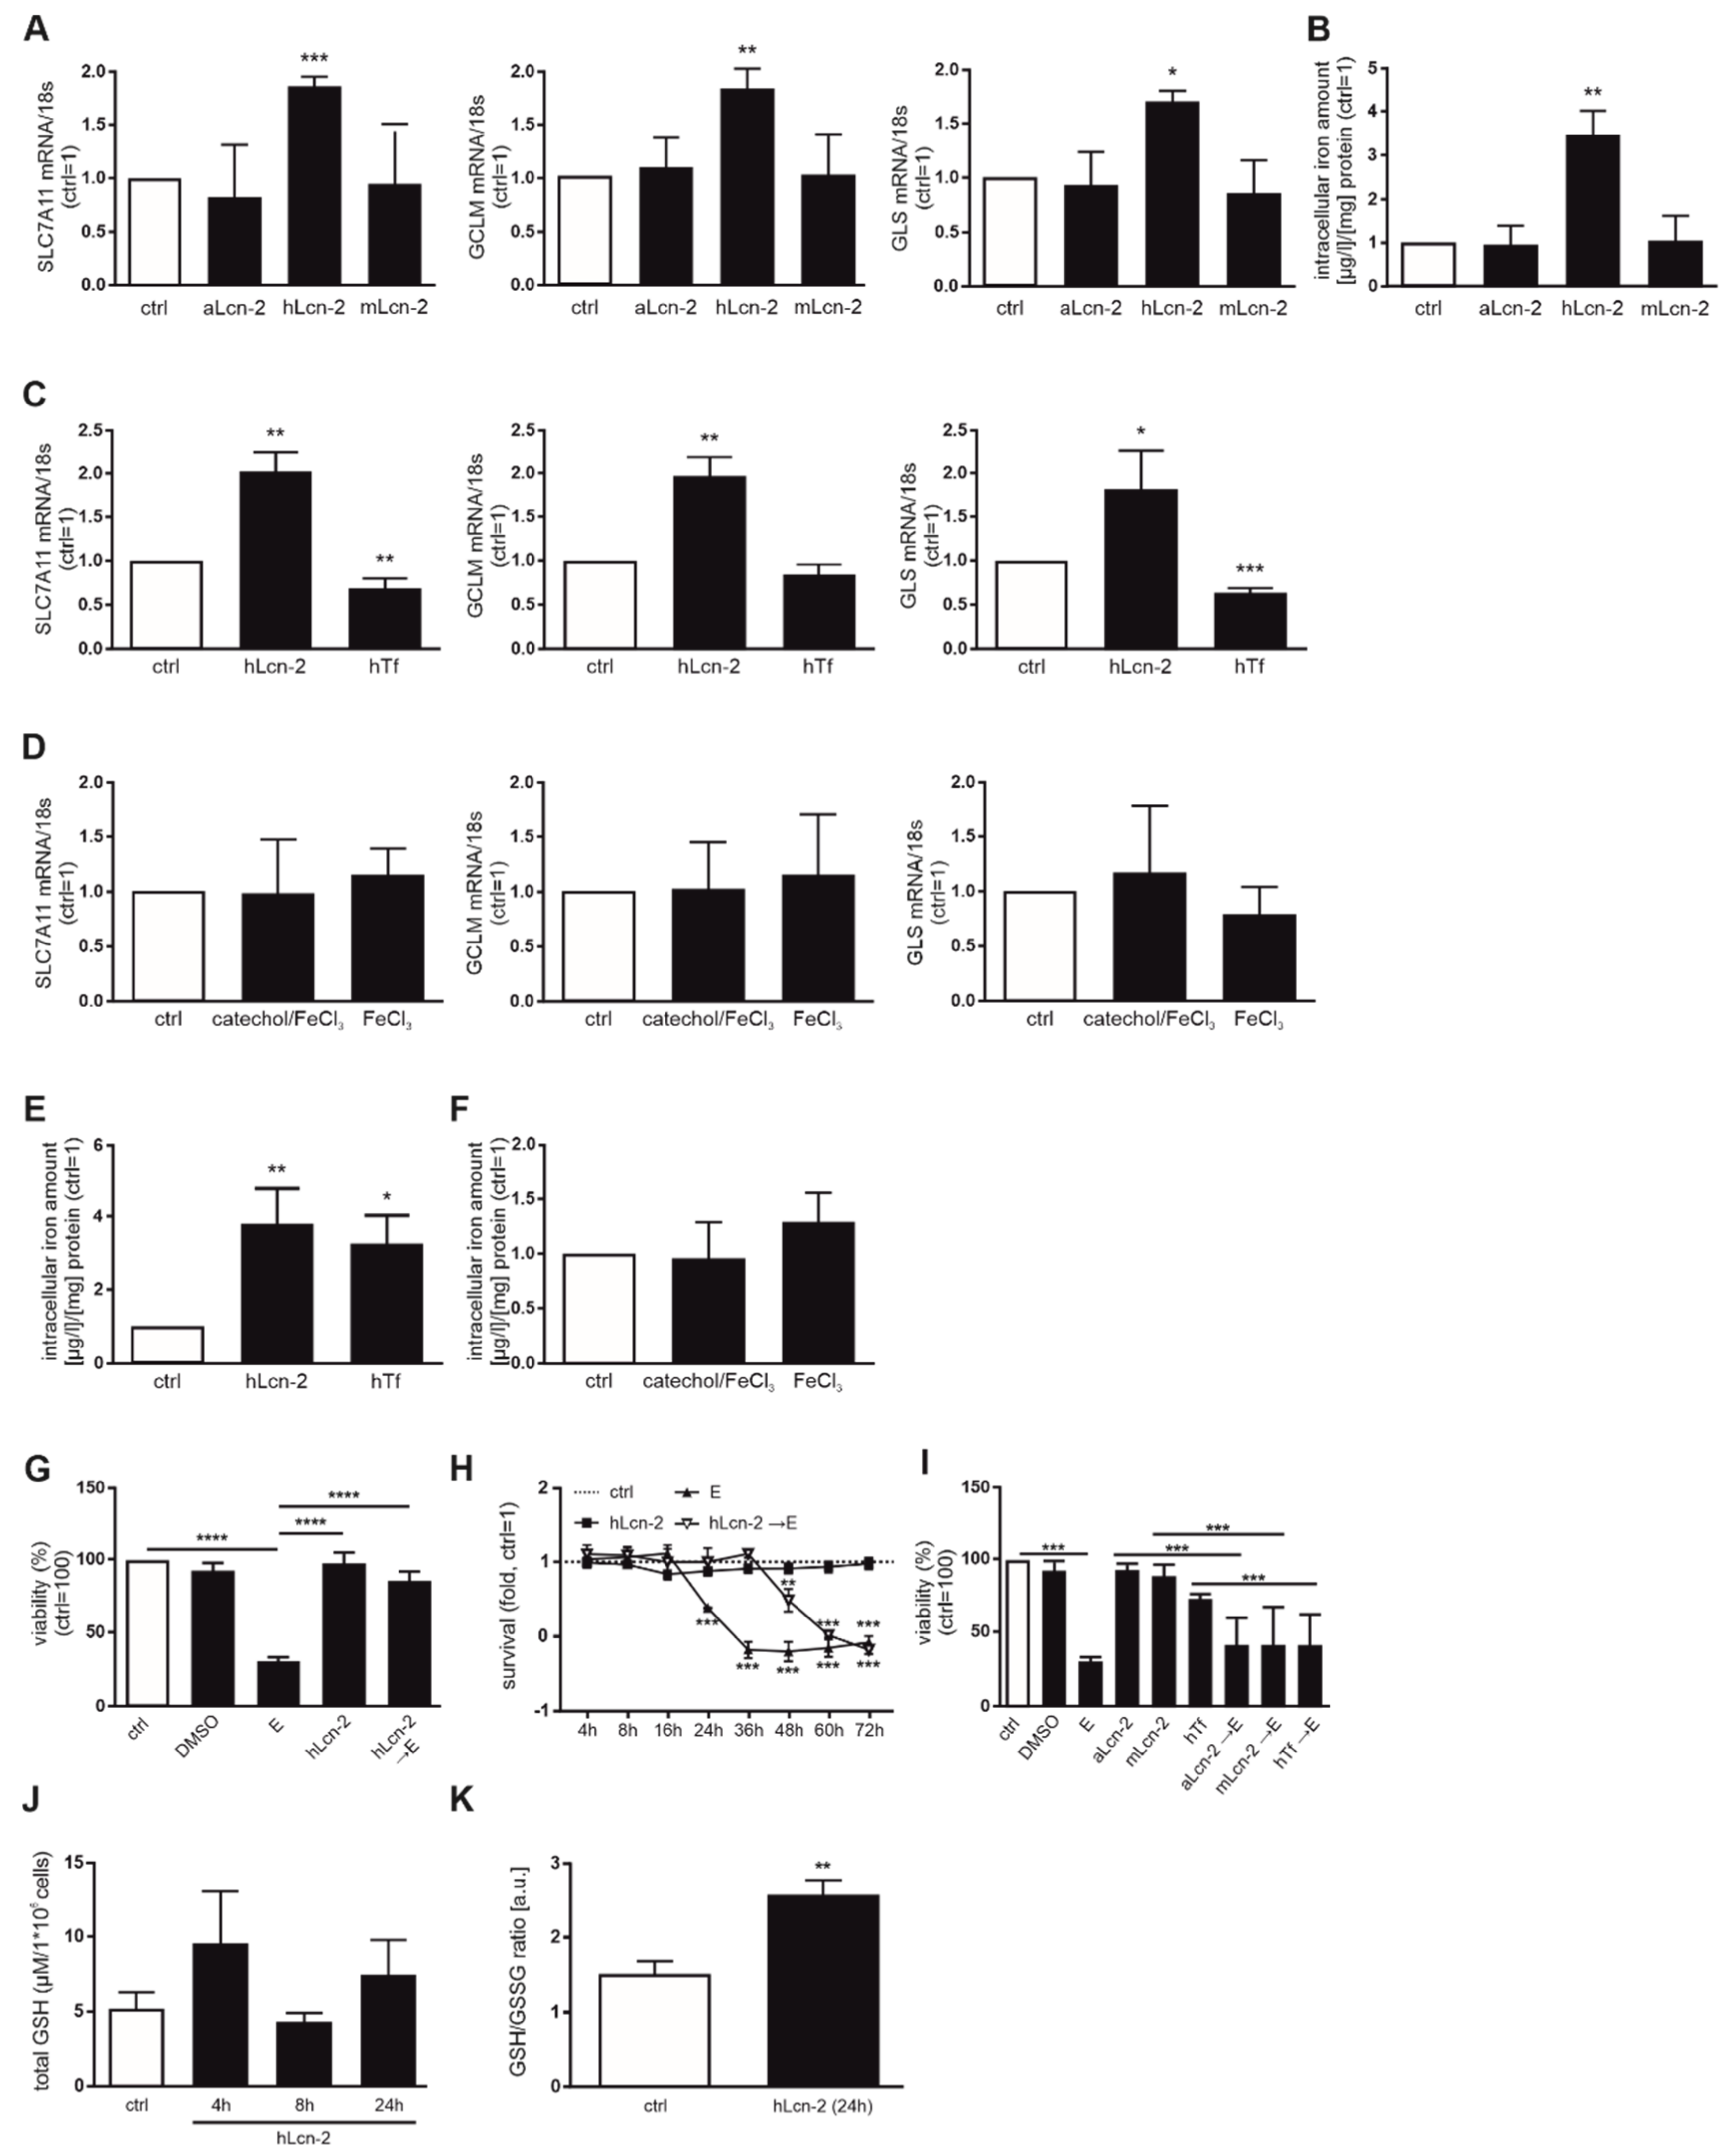
2.1. Iron-Loaded Lcn-2 Induces Genes Referring to Glutathione Biosynthesis
2.2. hLcn-2 Protects Renal Tumor Cells against Erastin-Induced Ferroptotic Cell Death
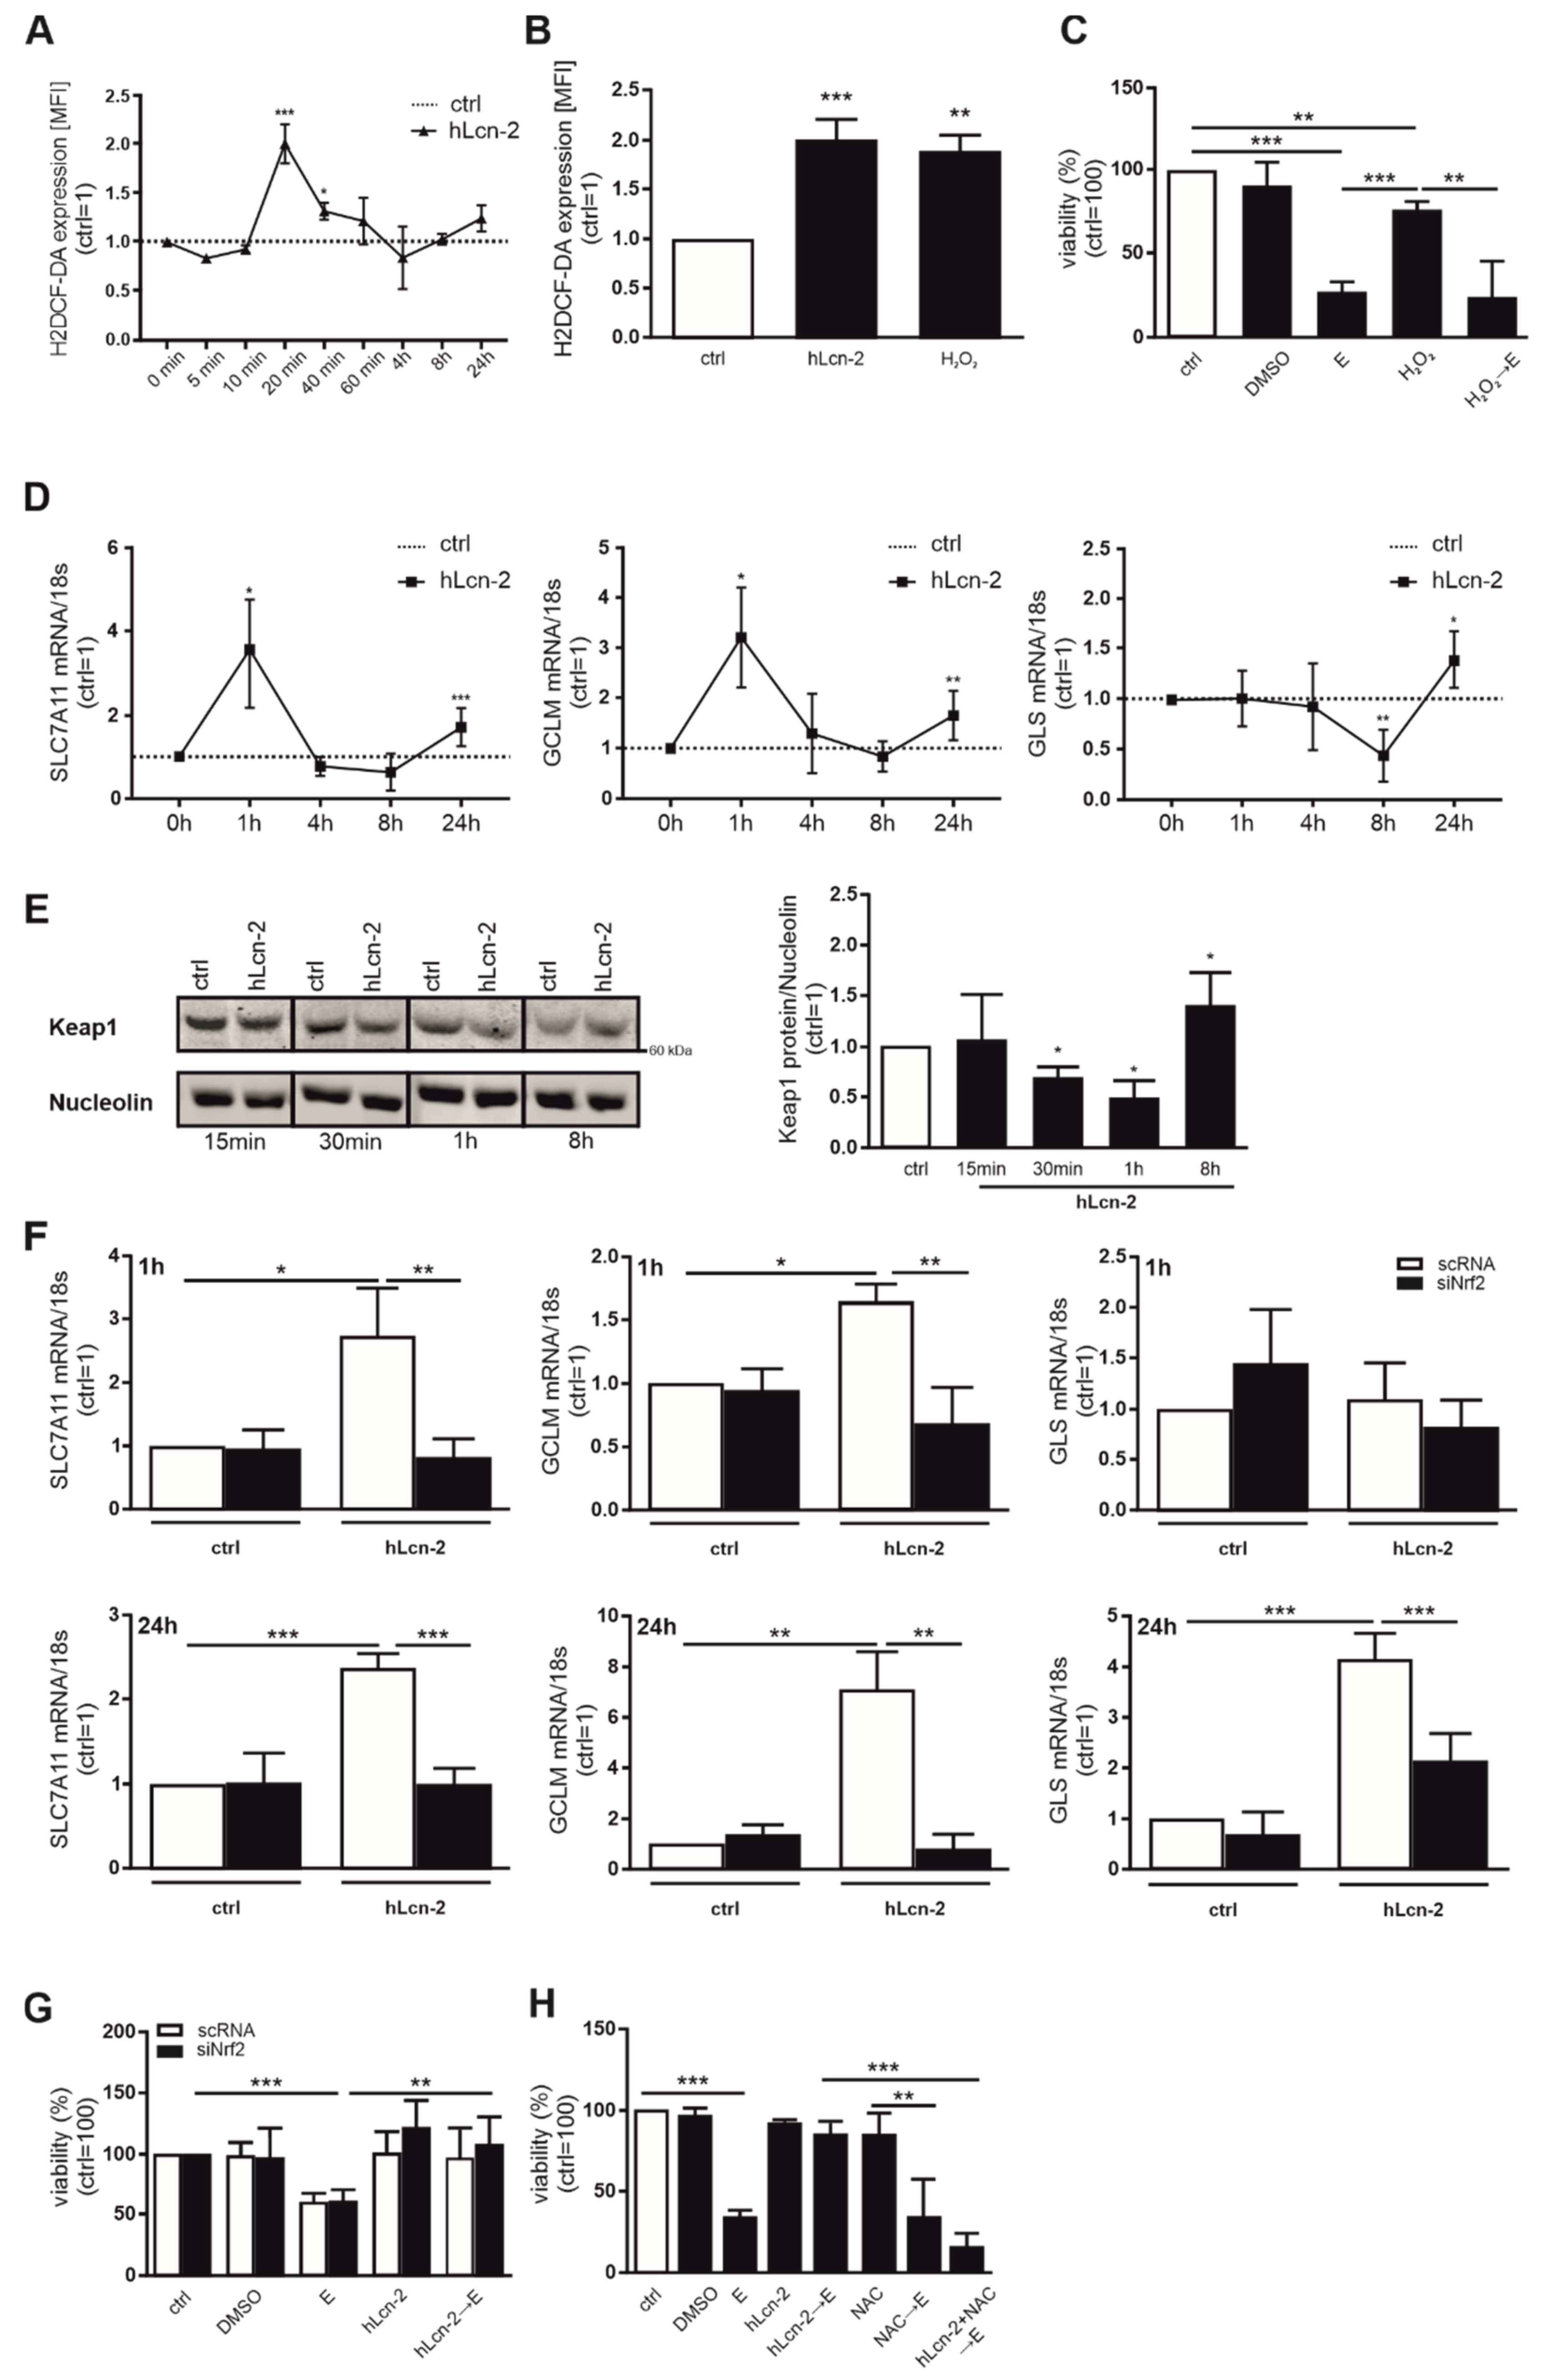
2.3. hLcn-2 Induces a Rapid ROS-Response and Activates the Keap-1/Nrf2 Pathway
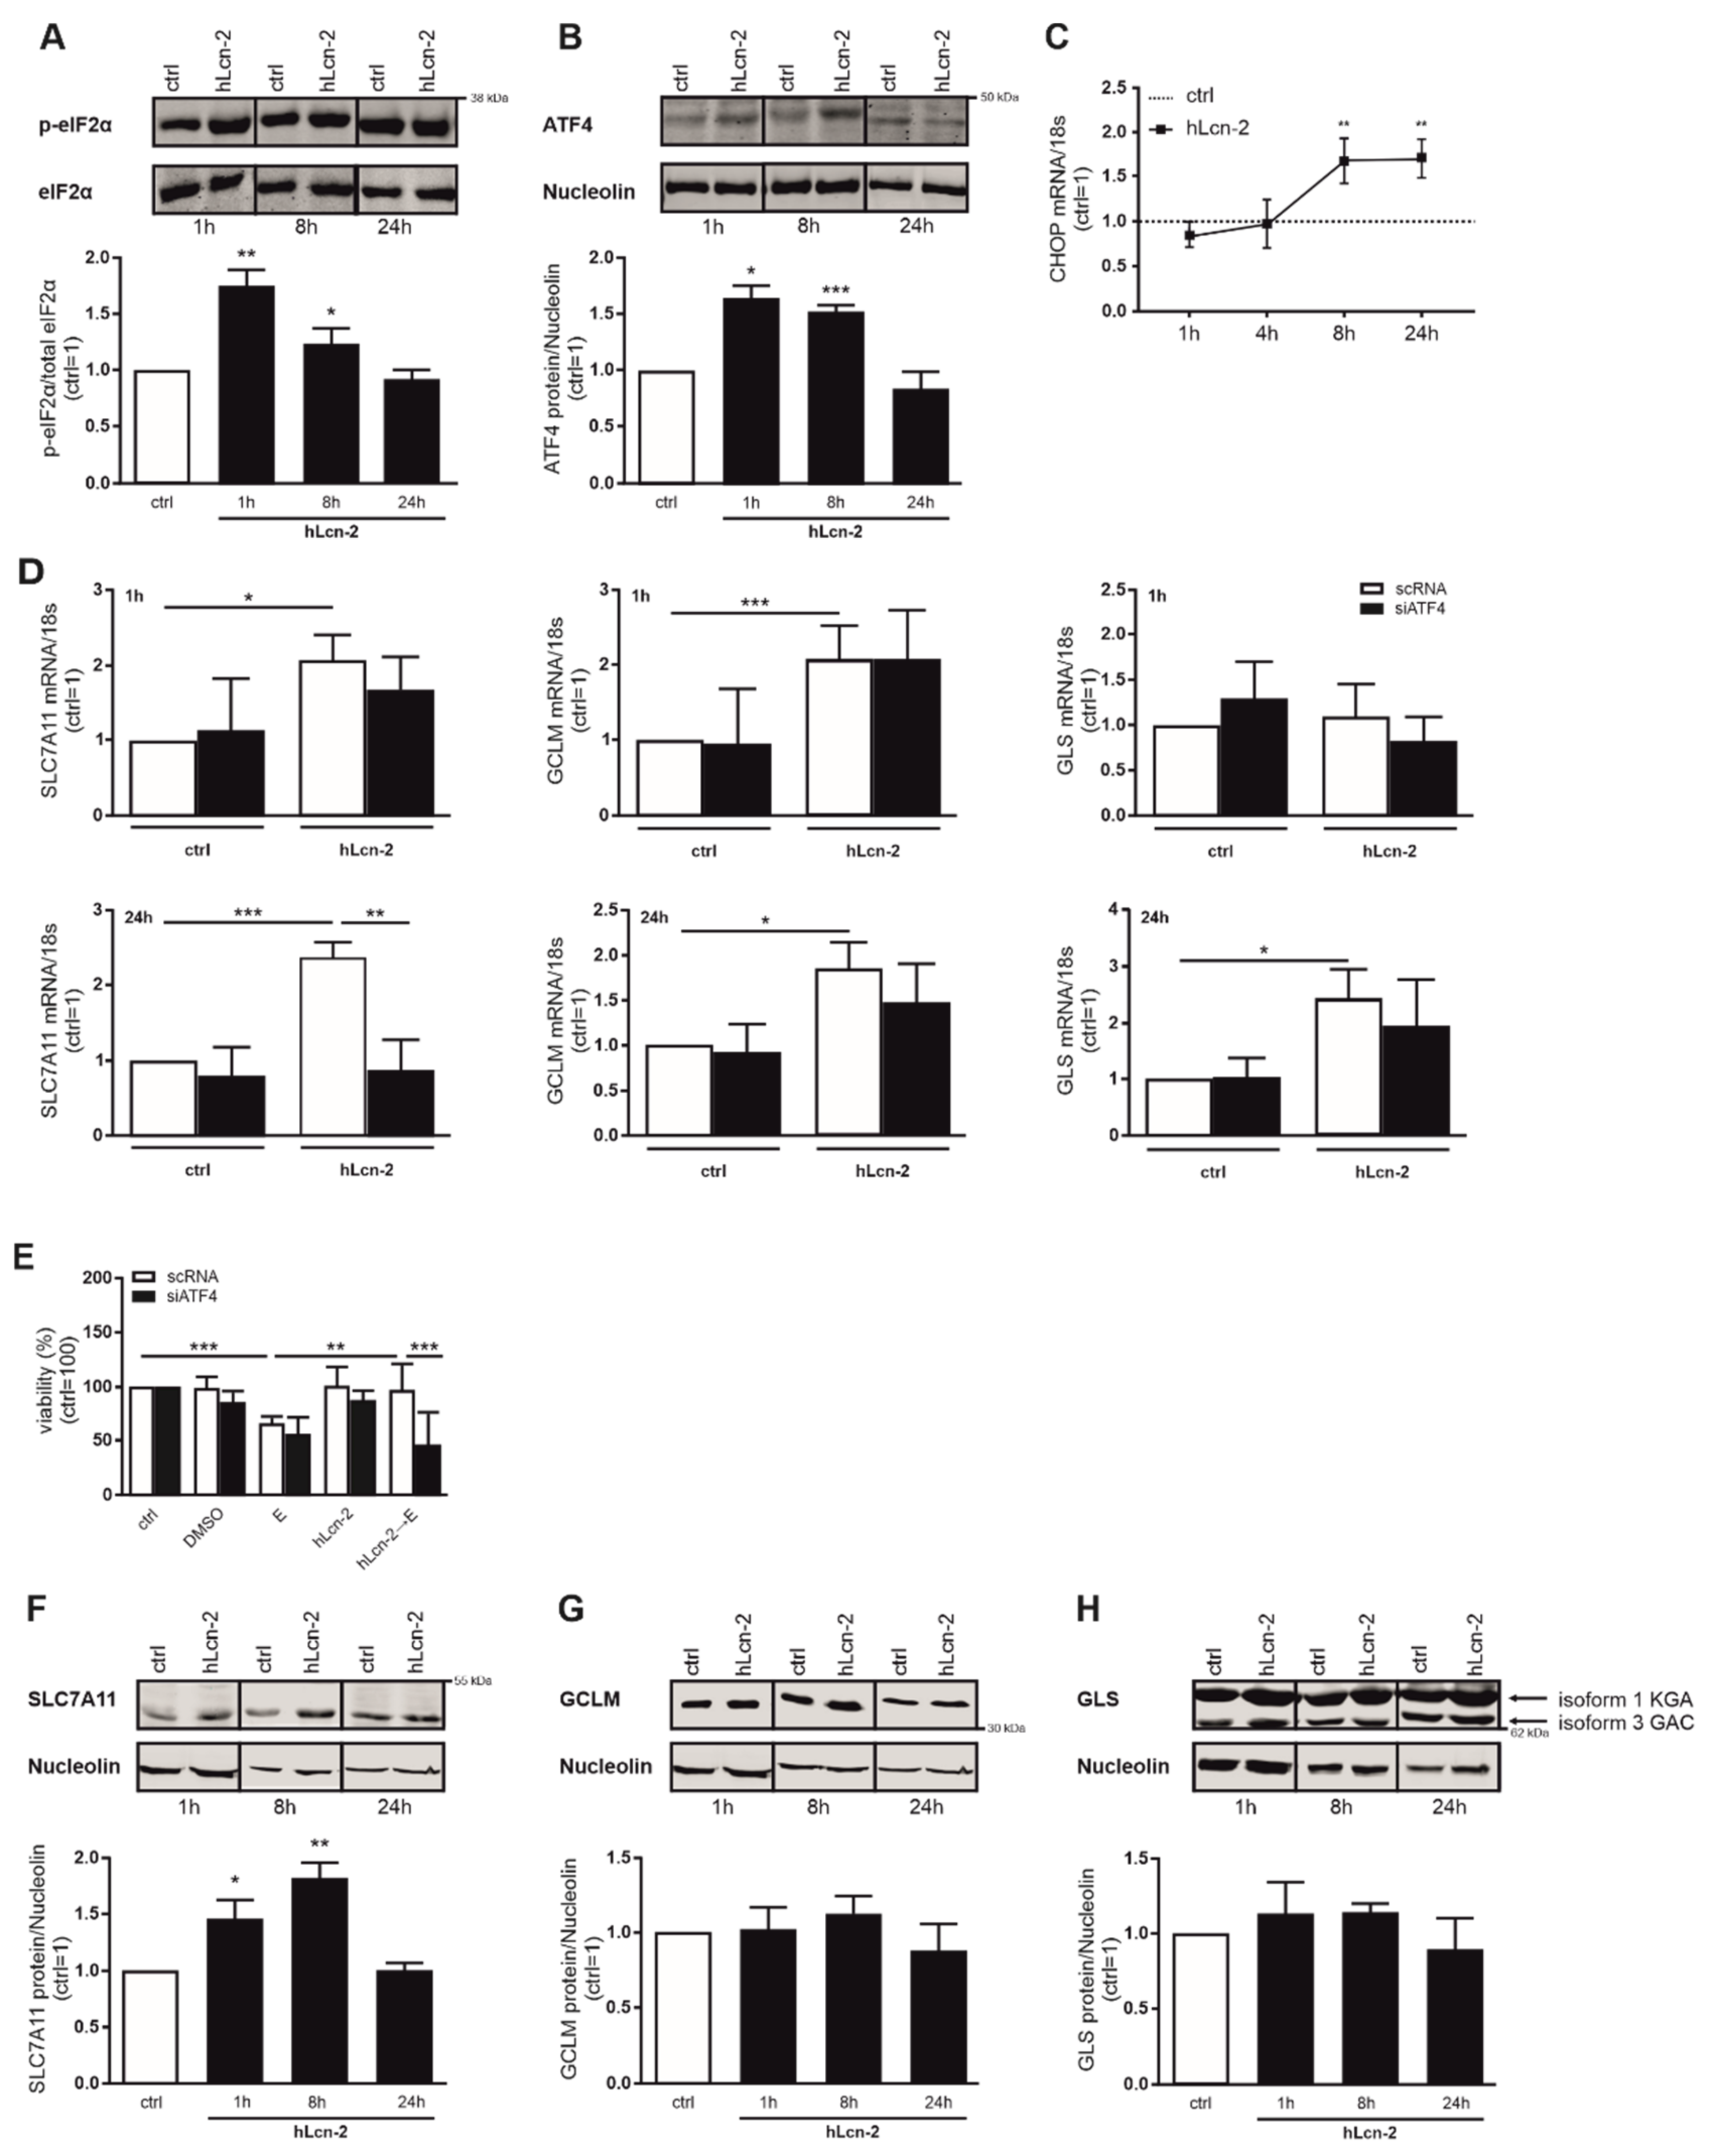
2.4. hLcn-2 Stimulation Induces an Integrated Stress Response
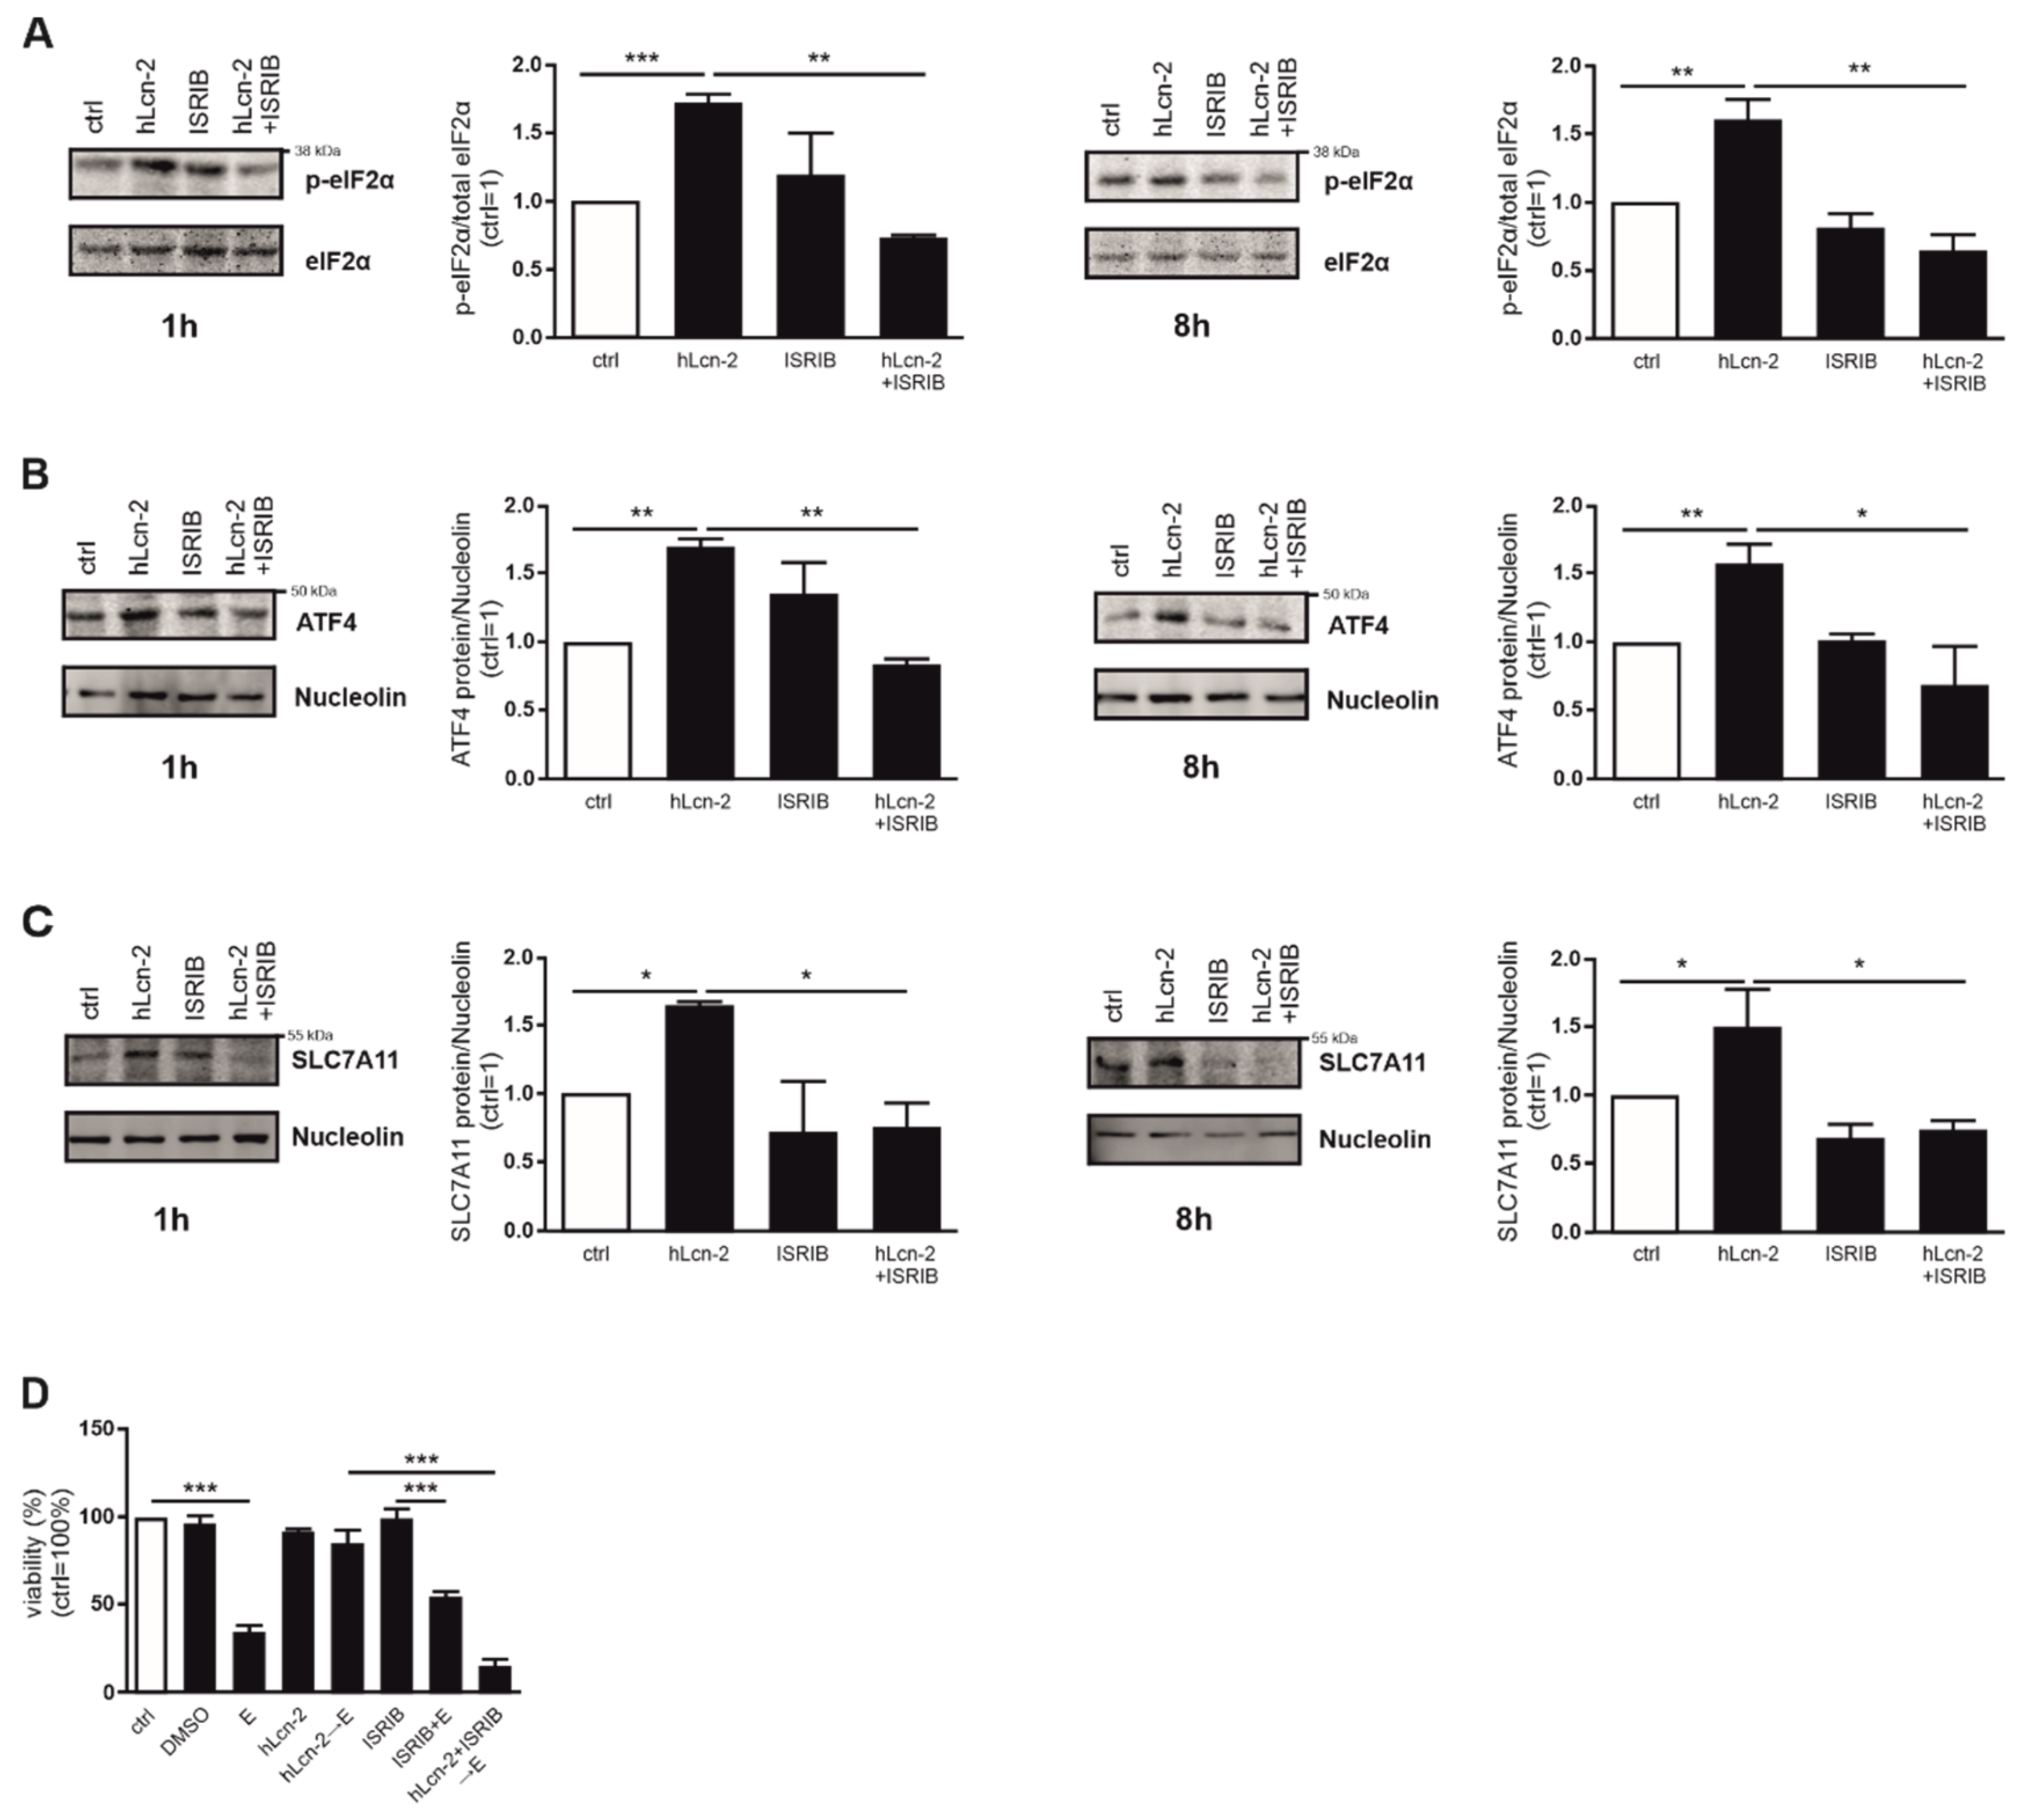
2.5. The ISR Pathway Is Crucial for hLcn-2 to Protect from Ferroptosis
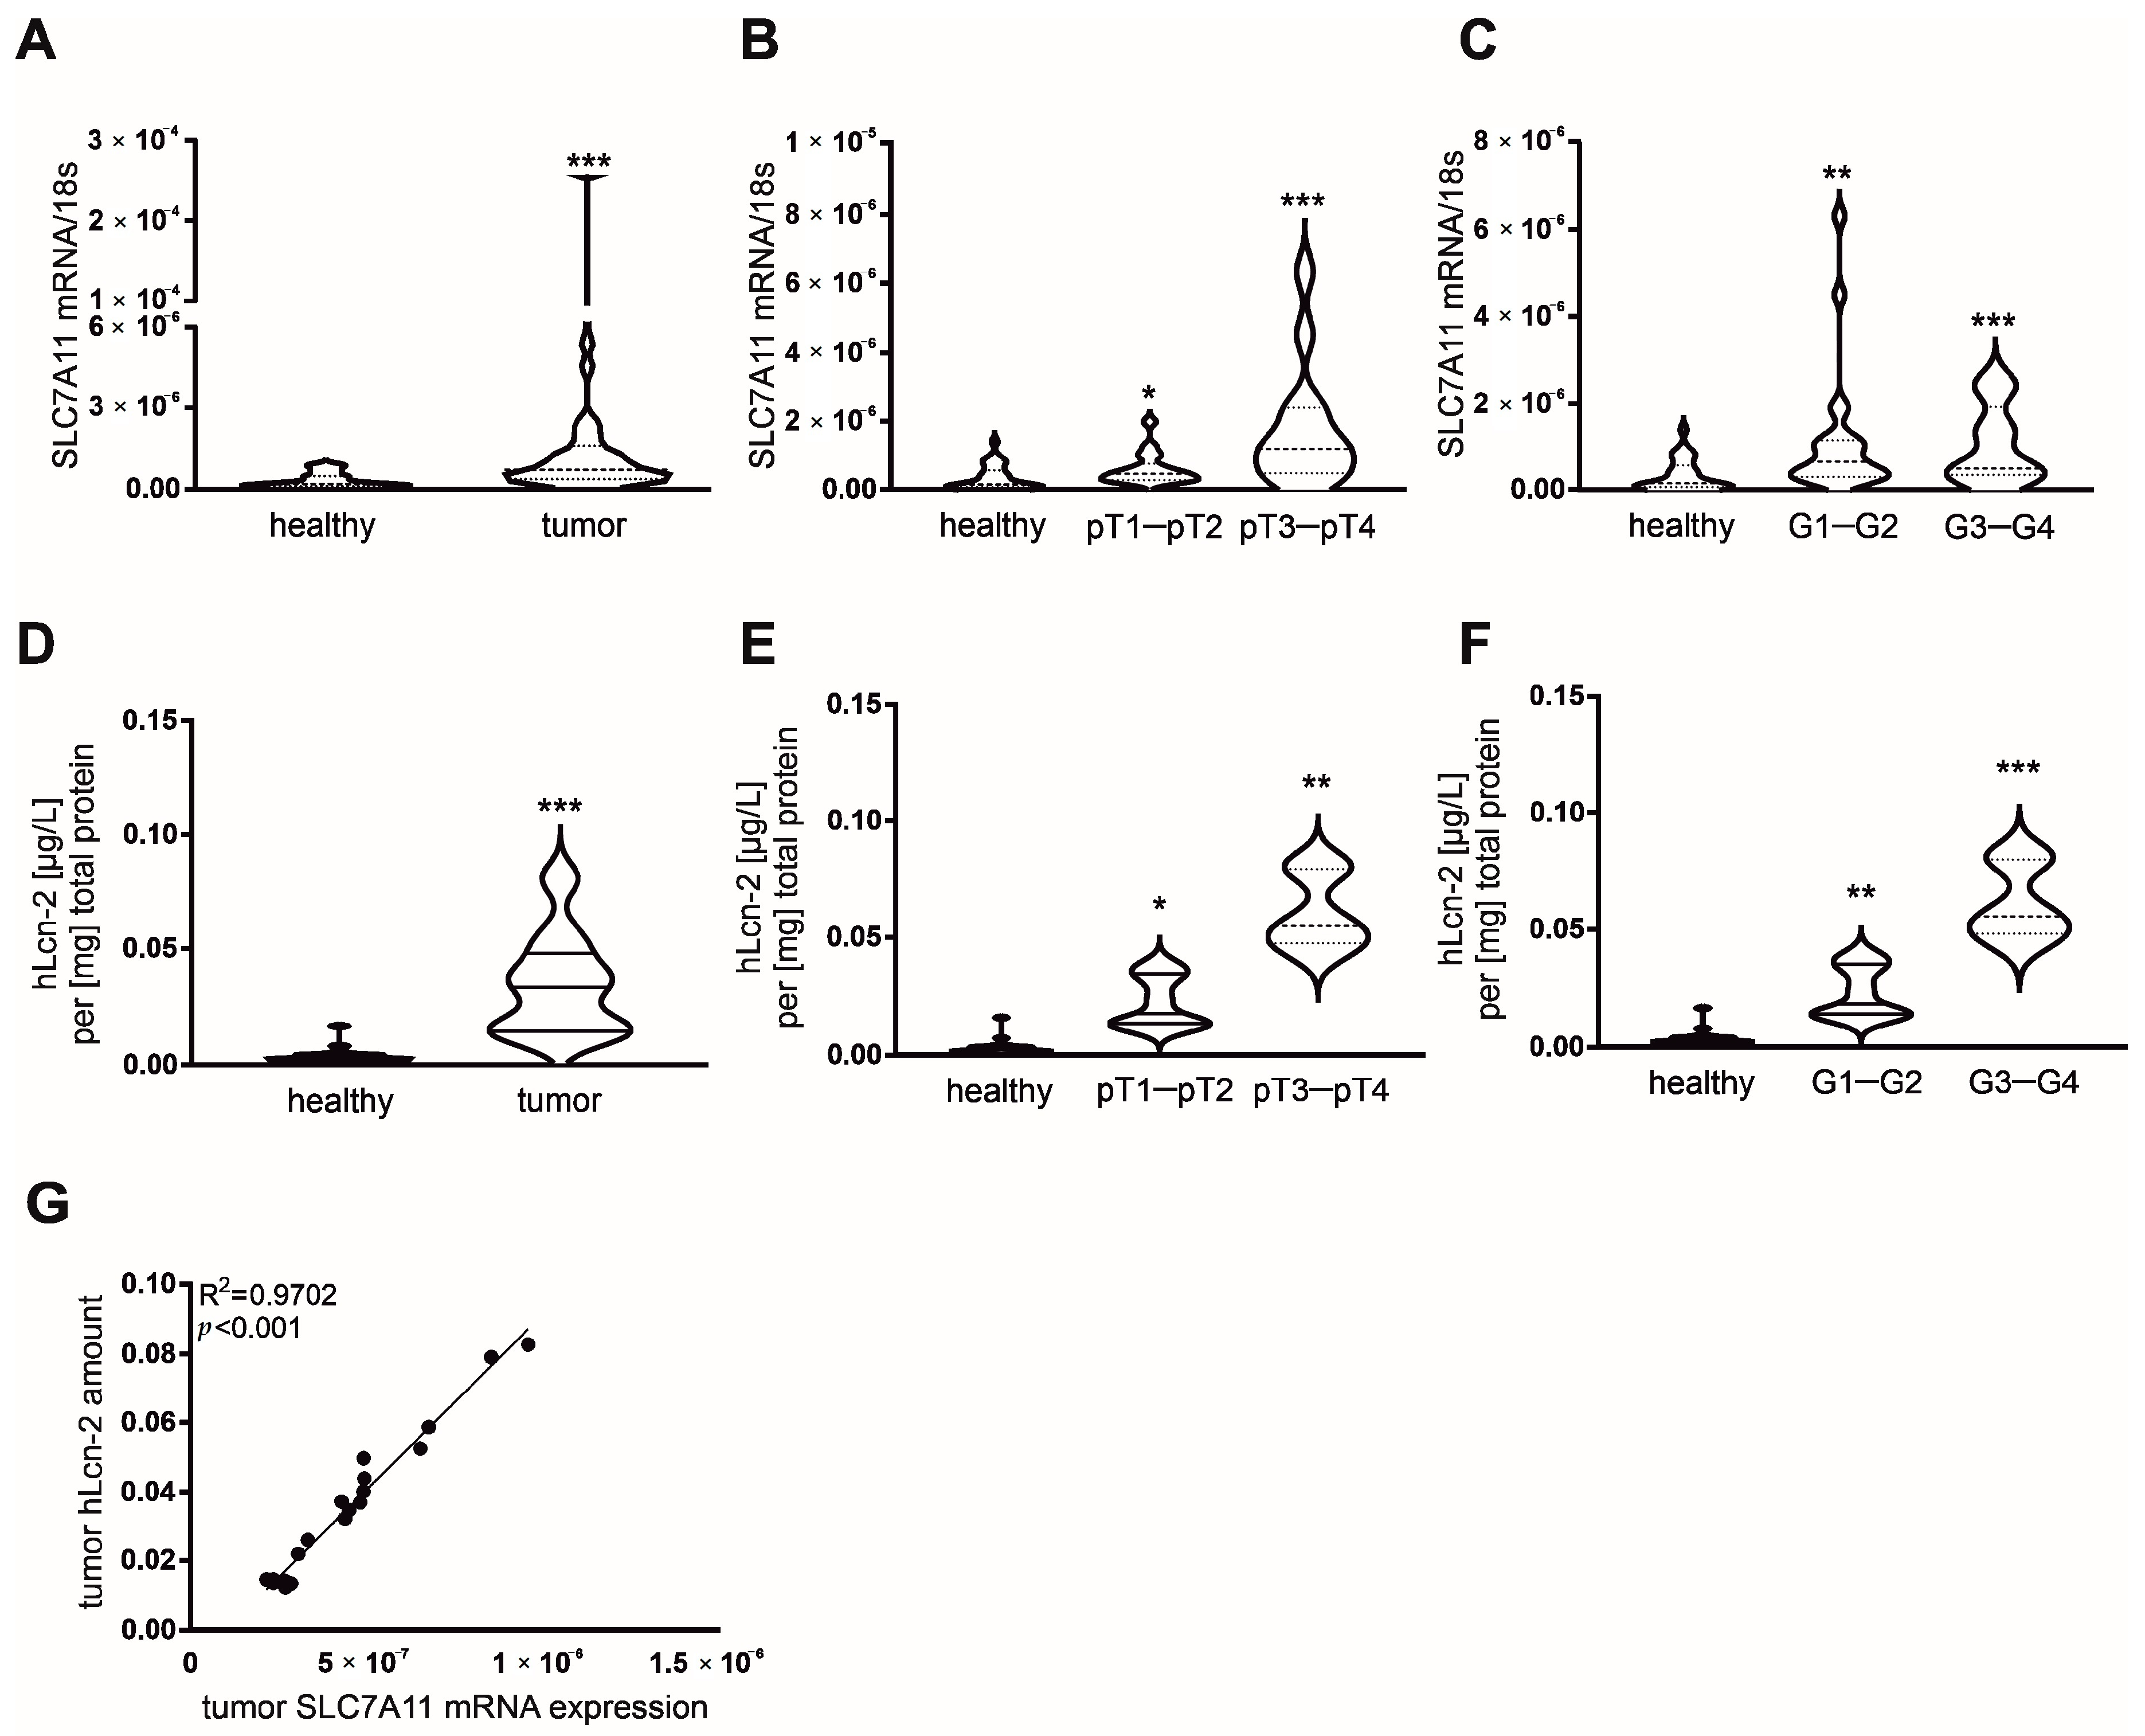
2.6. Correlative Expression of hLcn-2 and SLC7A11 in Clear Cell RCC Patients
3. Discussion
4. Materials and Methods
4.1. Cell Culture
4.2. Treatments
4.3. RNA Extraction and Quantitative Real-Time PCR (qRT-PCR)
4.4. RNA Sequencing
4.5. Western Blot Analysis
4.6. Viability Assay
4.7. Glutathione Measurement
4.8. Small Interfering RNA (siRNA) Transfection
4.9. Atomic Absorption Spectrometry (AAS)
4.10. ROS Measurements
4.11. Generation of Recombinant Lcn-2 and Complex Formation
4.12. Lcn-2 Immunoprecipitation (IP)
4.13. Survival Assays
4.14. Ethics
4.15. Participants
4.16. Statistical Analysis
Supplementary Materials
Author Contributions
Funding
Institutional Review Board Statement
Informed Consent Statement
Data Availability Statement
Conflicts of Interest
References
- Linehan, W.M. Genetic basis of kidney cancer: Role of genomics for the development of disease-based therapeutics. Genome Res. 2012, 22, 2089–2100. [Google Scholar] [CrossRef] [PubMed] [Green Version]
- Linehan, J.A.; Nguyen, M.M. Kidney cancer: The new landscape. Curr. Opin. Urol. 2009, 19, 133–137. [Google Scholar] [CrossRef] [PubMed]
- Cairns, R.A.; Harris, I.S.; Mak, T.W. Regulation of cancer cell metabolism. Nat. Rev. Cancer 2011, 11, 85–95. [Google Scholar] [CrossRef] [Green Version]
- Yang, W.S. Stockwell BR. Ferroptosis: Death by Lipid Peroxidation. Trends Cell Biol. 2016, 26, 165–176. [Google Scholar] [CrossRef] [Green Version]
- Yang, W.S.; SriRamaratnam, R.; Welsch, M.E.; Shimada, K.; Skouta, R.; Viswanathan, V.S.; Cheah, J.H.; Clemons, P.A.; Shamji, A.F.; Clish, C.B.; et al. Regulation of ferroptotic cancer cell death by GPX4. Cell 2014, 156, 317–331. [Google Scholar] [CrossRef] [Green Version]
- Maiorino, M.; Conrad, M.; Ursini, F. GPx4, Lipid Peroxidation, and Cell Death: Discoveries, Rediscoveries, and Open Issues. Antioxid. Redox Signal. 2018, 29, 61–74. [Google Scholar] [CrossRef]
- Ursini, F.; Maiorino, M. Lipid peroxidation and ferroptosis: The role of GSH and GPx4. Free Radic. Biol. Med. 2020, 152, 175–185. [Google Scholar] [CrossRef]
- Yang, W.S.; Stockwell, B.R. Synthetic lethal screening identifies compounds activating iron-dependent, nonapoptotic cell death in oncogenic-RAS-harboring cancer cells. Chem. Biol. 2008, 15, 234–245. [Google Scholar] [CrossRef] [Green Version]
- Friedmann Angeli, J.P.; Schneider, M.; Proneth, B.; Tyurina, Y.Y.; Tyurin, V.A.; Hammond, V.J.; Herbach, N.; Aichler, M.; Walch, A.; Eggenhofer, E.; et al. Inactivation of the ferroptosis regulator Gpx4 triggers acute renal failure in mice. Nat. Cell Biol. 2014, 16, 1180–1191. [Google Scholar] [CrossRef] [PubMed] [Green Version]
- Miess, H.; Dankworth, B.; Gouw, A.M.; Rosenfeldt, M.; Schmitz, W.; Jiang, M.; Saunders, B.; Howell, M.; Downward, J.; Felsher, D.W.; et al. The glutathione redox system is essential to prevent ferroptosis caused by impaired lipid metabolism in clear cell renal cell carcinoma. Oncogene 2018, 37, 5435–5450. [Google Scholar] [CrossRef]
- Dixon, S.J.; Lemberg, K.M.; Lamprecht, M.R.; Skouta, R.; Zaitsev, E.M.; Gleason, C.E.; Patel, D.N.; Bauer, A.J.; Cantley, A.M.; Yang, W.S.; et al. Ferroptosis: An iron-dependent form of nonapoptotic cell death. Cell 2012, 149, 1060–1072. [Google Scholar] [CrossRef] [Green Version]
- Xie, Y.; Hou, W.; Song, X.; Yu, Y.; Huang, J.; Sun, X.; Kang, R.; Tang, D. Ferroptosis: Process and function. Cell Death Differ. 2016, 23, 369–379. [Google Scholar] [CrossRef] [Green Version]
- Mancias, J.D.; Wang, X.; Gygi, S.P.; Harper, J.W.; Kimmelman, A.C. Quantitative proteomics identifies NCOA4 as the cargo receptor mediating ferritinophagy. Nature 2014, 509, 105–109. [Google Scholar] [CrossRef] [PubMed]
- Hou, W.; Xie, Y.; Song, X.; Sun, X.; Lotze, M.T.; Zeh, H.J., 3rd; Kang, R.; Tang, D. Autophagy promotes ferroptosis by degradation of ferritin. Autophagy 2016, 12, 1425–1428. [Google Scholar] [CrossRef] [PubMed]
- Gao, M.; Monian, P.; Pan, Q.; Zhang, W.; Xiang, J.; Jiang, X. Ferroptosis is an autophagic cell death process. Cell Res. 2016, 26, 1021–1032. [Google Scholar] [CrossRef] [Green Version]
- Muller, S.; Sindikubwabo, F.; Caneque, T.; Lafon, A.; Versini, A.; Lombard, B.; Loew, D.; Wu, T.D.; Ginestier, C.; Charafe-Jauffret, E.; et al. CD44 regulates epigenetic plasticity by mediating iron endocytosis. Nat. Chem. 2020, 12, 929–938. [Google Scholar] [CrossRef] [PubMed]
- Torti, S.V.; Torti, F.M. Iron and cancer: More ore to be mined. Nat. Rev. Cancer 2013, 13, 342–355. [Google Scholar] [CrossRef] [Green Version]
- Miller, L.D.; Coffman, L.G.; Chou, J.W.; Black, M.A.; Bergh, J.; D’Agostino, R., Jr.; Torti, S.V.; Torti, F.M. An iron regulatory gene signature predicts outcome in breast cancer. Cancer Res. 2011, 71, 6728–6737. [Google Scholar] [CrossRef] [Green Version]
- Schonberg, D.L.; Miller, T.E.; Wu, Q.; Flavahan, W.A.; Das, N.K.; Hale, J.S.; Hubert, C.G.; Mack, S.C.; Jarrar, A.M.; Karl, R.T.; et al. Preferential Iron Trafficking Characterizes Glioblastoma Stem-like Cells. Cancer Cell 2015, 28, 441–455. [Google Scholar] [CrossRef] [Green Version]
- Mai, T.T.; Hamai, A.; Hienzsch, A.; Caneque, T.; Muller, S.; Wicinski, J.; Cabaud, O.; Leroy, C.; David, A.; Acevedo, V.; et al. Salinomycin kills cancer stem cells by sequestering iron in lysosomes. Nat. Chem. 2017, 9, 1025–1033. [Google Scholar] [CrossRef] [Green Version]
- Mertens, C.; Mora, J.; Oren, B.; Grein, S.; Winslow, S.; Scholich, K.; Weigert, A.; Malmstrom, P.; Forsare, C.; Ferno, M.; et al. Macrophage-derived lipocalin-2 transports iron in the tumor microenvironment. Oncoimmunology 2018, 7, e1408751. [Google Scholar] [CrossRef] [Green Version]
- Marques, O.; Porto, G.; Rema, A.; Faria, F.; Cruz Paula, A.; Gomez-Lazaro, M.; Silva, P.; Martins da Silva, B.; Lopes, C. Local iron homeostasis in the breast ductal carcinoma microenvironment. BMC Cancer 2016, 16, 187. [Google Scholar] [CrossRef] [Green Version]
- Schnetz, M.; Meier, J.K.; Rehwald, C.; Mertens, C.; Urbschat, A.; Tomat, E.; Akam, E.A.; Baer, P.; Roos, F.C.; Brune, B.; et al. The Disturbed Iron Phenotype of Tumor Cells and Macrophages in Renal Cell Carcinoma Influences Tumor Growth. Cancers 2020, 12, 530. [Google Scholar] [CrossRef] [Green Version]
- Bauer, M.; Eickhoff, J.C.; Gould, M.N.; Mundhenke, C.; Maass, N.; Friedl, A. Neutrophil gelatinase-associated lipocalin (NGAL) is a predictor of poor prognosis in human primary breast cancer. Breast Cancer Res. Treat. 2008, 108, 389–397. [Google Scholar] [CrossRef]
- Fearnhead, H.O.; Vandenabeele, P.; Vanden Berghe, T. How do we fit ferroptosis in the family of regulated cell death? Cell Death Differ. 2017, 24, 1991–1998. [Google Scholar] [CrossRef] [Green Version]
- Oren, B.; Urosevic, J.; Mertens, C.; Mora, J.; Guiu, M.; Gomis, R.R.; Weigert, A.; Schmid, T.; Grein, S.; Brune, B.; et al. Tumour stroma-derived lipocalin-2 promotes breast cancer metastasis. J. Pathol. 2016, 239, 274–285. [Google Scholar] [CrossRef] [Green Version]
- Jung, M.; Oren, B.; Mora, J.; Mertens, C.; Dziumbla, S.; Popp, R.; Weigert, A.; Grossmann, N.; Fleming, I.; Brune, B. Lipocalin 2 from macrophages stimulated by tumor cell-derived sphingosine 1-phosphate promotes lymphangiogenesis and tumor metastasis. Sci. Signal. 2016, 9, ra64. [Google Scholar] [CrossRef]
- Morrissey, J.J.; London, A.N.; Lambert, M.C.; Kharasch, E.D. Sensitivity and specificity of urinary neutrophil gelatinase-associated lipocalin and kidney injury molecule-1 for the diagnosis of renal cell carcinoma. Am. J. Nephrol. 2011, 34, 391–398. [Google Scholar] [CrossRef]
- A DIC: Evaluation of neutrophil gelatinase-associated lipocalin (NGAL), matrix metalloproteinase-9 (MMP-9) and their complex MMP-9/NGAL in sera and urine of patients with kidney tumors. Oncol. Lett. 2013, 5, 1677–1681. [CrossRef] [Green Version]
- Barresi, V.; Ieni, A.; Bolignano, D.; Magno, C.; Buemi, M.; Barresi, G. Neutrophil gelatinase-associated lipocalin immunoexpression in renal tumors: Correlation with histotype and histological grade. Oncol. Rep. 2010, 24, 305–310. [Google Scholar] [CrossRef] [PubMed]
- Rehwald, C.; Schnetz, M.; Urbschat, A.; Mertens, C.; Meier, J.K.; Bauer, R.; Baer, P.; Winslow, S.; Roos, F.C.; Zwicker, K.; et al. The iron load of lipocalin-2 (LCN-2) defines its pro-tumour function in clear-cell renal cell carcinoma. Br. J. Cancer 2020, 122, 421–433. [Google Scholar] [CrossRef] [PubMed]
- Devireddy, L.R.; Gazin, C.; Zhu, X.; Green, M.R. A cell-surface receptor for lipocalin 24p3 selectively mediates apoptosis and iron uptake. Cell 2005, 123, 1293–1305. [Google Scholar] [CrossRef] [PubMed] [Green Version]
- Ueda, S.; Nakamura, H.; Masutani, H.; Sasada, T.; Yonehara, S.; Takabayashi, A.; Yamaoka, Y.; Yodoi, J. Redox regulation of caspase-3(-like) protease activity: Regulatory roles of thioredoxin and cytochrome c. J. Immunol. 1998, 161, 6689–6695. [Google Scholar]
- Dixon, S.J. Ferroptosis: Bug or feature? Immunol. Rev. 2017, 277, 150–157. [Google Scholar] [CrossRef]
- Gai, C.; Yu, M.; Li, Z.; Wang, Y.; Ding, D.; Zheng, J.; Lv, S.; Zhang, W.; Li, W. Acetaminophen sensitizing erastin-induced ferroptosis via modulation of Nrf2/heme oxygenase-1 signaling pathway in non-small-cell lung cancer. J. Cell. Physiol. 2020, 235, 3329–3339. [Google Scholar] [CrossRef]
- Stockwell, B.R.; Friedmann Angeli, J.P.; Bayir, H.; Bush, A.I.; Conrad, M.; Dixon, S.J.; Fulda, S.; Gascon, S.; Hatzios, S.K.; Kagan, V.E.; et al. Ferroptosis: A Regulated Cell Death Nexus Linking Metabolism, Redox Biology, and Disease. Cell 2017, 171, 273–285. [Google Scholar] [CrossRef] [Green Version]
- Dreger, H.; Westphal, K.; Weller, A.; Baumann, G.; Stangl, V.; Meiners, S.; Stangl, K. Nrf2-dependent upregulation of antioxidative enzymes: A novel pathway for proteasome inhibitor-mediated cardioprotection. Cardiovasc. Res. 2009, 83, 354–361. [Google Scholar] [CrossRef] [Green Version]
- Chen, Y.J.; Qian, Z.M.; Sheng, Y.; Zheng, J.; Liu, Y. Angiotensin II down-regulates transferrin receptor 1 and ferroportin 1 expression in Neuro-2a cells via activation of type-1 receptor. Neurosci. Lett. 2020, 716, 134684. [Google Scholar] [CrossRef]
- Tonelli, C.; Chio, I.I.C.; Tuveson, D.A. Transcriptional Regulation by Nrf2. Antioxid. Redox Signal. 2018, 29, 1727–1745. [Google Scholar] [CrossRef] [PubMed] [Green Version]
- Marro, S.; Chiabrando, D.; Messana, E.; Stolte, J.; Turco, E.; Tolosano, E.; Muckenthaler, M.U. Heme controls ferroportin1 (FPN1) transcription involving Bach1, Nrf2 and a MARE/ARE sequence motif at position -7007 of the FPN1 promoter. Haematologica 2010, 95, 1261–1268. [Google Scholar] [CrossRef] [Green Version]
- Fan, Z.; Wirth, A.K.; Chen, D.; Wruck, C.J.; Rauh, M.; Buchfelder, M.; Savaskan, N. Nrf2-Keap1 pathway promotes cell proliferation and diminishes ferroptosis. Oncogenesis 2017, 6, e371. [Google Scholar] [CrossRef] [Green Version]
- Roh, J.L.; Kim, E.H.; Jang, H.; Shin, D. Nrf2 inhibition reverses the resistance of cisplatin-resistant head and neck cancer cells to artesunate-induced ferroptosis. Redox Biol. 2017, 11, 254–262. [Google Scholar] [CrossRef] [PubMed]
- Huang, X.; Slavkovic, S.; Song, E.; Botta, A.; Mehrazma, B.; Lento, C.; Johnson, P.E.; Sweeney, G.; Wilson, D.J. A Unique Conformational Distortion Mechanism Drives Lipocalin 2 Binding to Bacterial Siderophores. ACS Chem. Biol. 2020, 15, 234–242. [Google Scholar] [CrossRef]
- Filomeni, G.; Rotilio, G.; Ciriolo, M.R. Cell signalling and the glutathione redox system. Biochem. Pharmacol. 2002, 64, 1057–1064. [Google Scholar] [CrossRef]
- Jiang, L.; Kon, N.; Li, T.; Wang, S.J.; Su, T.; Hibshoosh, H.; Baer, R.; Gu, W. Ferroptosis as a p53-mediated activity during tumour suppression. Nature 2015, 520, 57–62. [Google Scholar] [CrossRef] [Green Version]
- Sikalidis, A.K.; Lee, J.I.; Stipanuk, M.H. Gene expression and integrated stress response in HepG2/C3A cells cultured in amino acid deficient medium. Amino Acids 2011, 41, 159–171. [Google Scholar] [CrossRef] [PubMed] [Green Version]
- Kilberg, M.S.; Shan, J.; Su, N. ATF4-dependent transcription mediates signaling of amino acid limitation. Trends Endocrinol. Metab. TEM 2009, 20, 436–443. [Google Scholar] [CrossRef] [Green Version]
- Chen, D.; Fan, Z.; Rauh, M.; Buchfelder, M.; Eyupoglu, I.Y.; Savaskan, N. ATF4 promotes angiogenesis and neuronal cell death and confers ferroptosis in a xCT-dependent manner. Oncogene 2017, 36, 5593–5608. [Google Scholar] [CrossRef] [Green Version]
- Bai, T.; Liang, R.; Zhu, R.; Wang, W.; Zhou, L.; Sun, Y. MicroRNA-214-3p enhances erastin-induced ferroptosis by targeting ATF4 in hepatoma cells. J. Cell. Physiol. 2020, 235, 5637–5648. [Google Scholar] [CrossRef] [PubMed]
- Wang, S.F.; Wung, C.H.; Chen, M.S.; Chen, C.F.; Yin, P.H.; Yeh, T.S.; Chang, Y.L.; Chou, Y.C.; Hung, H.H.; Lee, H.C. Activated Integrated Stress Response Induced by Salubrinal Promotes Cisplatin Resistance in Human Gastric Cancer Cells via Enhanced xCT Expression and Glutathione Biosynthesis. Int. J. Mol. Sci. 2018, 19, 3389. [Google Scholar] [CrossRef] [Green Version]
- Chen, D.; Rauh, M.; Buchfelder, M.; Eyupoglu, I.Y.; Savaskan, N. The oxido-metabolic driver ATF4 enhances temozolamide chemo-resistance in human gliomas. Oncotarget 2017, 8, 51164–51176. [Google Scholar] [CrossRef] [Green Version]
- Chen, L.; He, J.; Zhou, J.; Xiao, Z.; Ding, N.; Duan, Y.; Li, W.; Sun, L.Q. EIF2A promotes cell survival during paclitaxel treatment in vitro and in vivo. J. Cell. Mol. Med. 2019, 23, 6060–6071. [Google Scholar] [CrossRef]
- Li, X.; Yu, Q. PON1 hypermethylation is associated with progression of renal cell carcinoma. J. Cell. Mol. Med. 2019, 23, 6646–6657. [Google Scholar] [CrossRef] [Green Version]
- Uyar, O.A.; Kara, M.; Erol, D.; Ardicoglu, A.; Yuce, H. Investigating paraoxonase-1 gene Q192R and L55M polymorphism in patients with renal cell cancer. Genet. Mol. Res. GMR 2011, 10, 133–139. [Google Scholar] [CrossRef] [PubMed]
- Trudel, K.; Sinnett, D.; James, R.W.; Delvin, E.; Amre, D.; Seidman, E.; Levy, E. Iron-ascorbic acid-induced oxidant stress and its quenching by paraoxonase 1 in HDL and the liver: Comparison between humans and rats. J. Cell. Biochem. 2005, 96, 404–411. [Google Scholar] [CrossRef]
- Liu, J.; Song, X.; Kuang, F.; Zhang, Q.; Xie, Y.; Kang, R.; Kroemer, G.; Tang, D. NUPR1 is a critical repressor of ferroptosis. Nat. Commun. 2021, 12, 647. [Google Scholar] [CrossRef]
- Mertens, C.; Kuchler, L.; Sola, A.; Guiteras, R.; Grein, S.; Brune, B.; von Knethen, A.; Jung, M. Macrophage-Derived Iron-Bound Lipocalin-2 Correlates with Renal Recovery Markers Following Sepsis-Induced Kidney Damage. Int. J. Mol. Sci. 2020, 21, 7527. [Google Scholar] [CrossRef]
- Baer, P.C.; Nockher, W.A.; Haase, W.; Scherberich, J.E. Isolation of proximal and distal tubule cells from human kidney by immunomagnetic separation. Technical note. Kidney Int. 1997, 52, 1321–1331. [Google Scholar] [CrossRef] [Green Version]
- Trifillis, A.L.; Regec, A.L.; Trump, B.F. Isolation, culture and characterization of human renal tubular cells. J. Urol. 1985, 133, 324–329. [Google Scholar] [CrossRef]
- Zerbino, D.R.; Achuthan, P.; Akanni, W.; Amode, M.R.; Barrell, D.; Bhai, J.; Billis, K.; Cummins, C.; Gall, A.; Giron, C.G.; et al. Ensembl 2018. Nucleic Acids Res. 2018, 46, D754–D761. [Google Scholar] [CrossRef]
- Dobin, A.; Davis, C.A.; Schlesinger, F.; Drenkow, J.; Zaleski, C.; Jha, S.; Batut, P.; Chaisson, M.; Gingeras, T.R. STAR: Ultrafast universal RNA-seq aligner. Bioinformatics 2013, 29, 15–21. [Google Scholar] [CrossRef] [PubMed]
- Anders, S.; Pyl, P.T.; Huber, W. HTSeq—A Python framework to work with high-throughput sequencing data. Bioinformatics 2015, 31, 166–169. [Google Scholar] [CrossRef] [PubMed]
- Robinson, M.D.; McCarthy, D.J.; Smyth, G.K. edgeR: A Bioconductor package for differential expression analysis of digital gene expression data. Bioinformatics 2010, 26, 139–140. [Google Scholar] [CrossRef] [PubMed] [Green Version]
- Urbschat, A.; Thiemens, A.K.; Mertens, C.; Rehwald, C.; Meier, J.K.; Baer, P.C.; Jung, M. Macrophage-secreted Lipocalin-2 Promotes Regeneration of Injured Primary Murine Renal Tubular Epithelial Cells. Int. J. Mol. Sci. 2020, 21, 2038. [Google Scholar] [CrossRef] [PubMed] [Green Version]
- Oelze, M.; Kroller-Schon, S.; Steven, S.; Lubos, E.; Doppler, C.; Hausding, M.; Tobias, S.; Brochhausen, C.; Li, H.; Torzewski, M.; et al. Glutathione peroxidase-1 deficiency potentiates dysregulatory modifications of endothelial nitric oxide synthase and vascular dysfunction in aging. Hypertension 2014, 63, 390–396. [Google Scholar] [CrossRef] [Green Version]
- Sha, L.K.; Sha, W.; Kuchler, L.; Daiber, A.; Giegerich, A.K.; Weigert, A.; Knape, T.; Snodgrass, R.; Schroder, K.; Brandes, R.P.; et al. Loss of Nrf2 in bone marrow-derived macrophages impairs antigen-driven CD8(+) T cell function by limiting GSH and Cys availability. Free Radic. Biol. Med. 2015, 83, 77–88. [Google Scholar] [CrossRef]


Publisher’s Note: MDPI stays neutral with regard to jurisdictional claims in published maps and institutional affiliations. |
© 2021 by the authors. Licensee MDPI, Basel, Switzerland. This article is an open access article distributed under the terms and conditions of the Creative Commons Attribution (CC BY) license (https://creativecommons.org/licenses/by/4.0/).
Share and Cite
Meier, J.K.; Schnetz, M.; Beck, S.; Schmid, T.; Dominguez, M.; Kalinovic, S.; Daiber, A.; Brüne, B.; Jung, M. Iron-Bound Lipocalin-2 Protects Renal Cell Carcinoma from Ferroptosis. Metabolites 2021, 11, 329. https://0-doi-org.brum.beds.ac.uk/10.3390/metabo11050329
Meier JK, Schnetz M, Beck S, Schmid T, Dominguez M, Kalinovic S, Daiber A, Brüne B, Jung M. Iron-Bound Lipocalin-2 Protects Renal Cell Carcinoma from Ferroptosis. Metabolites. 2021; 11(5):329. https://0-doi-org.brum.beds.ac.uk/10.3390/metabo11050329
Chicago/Turabian StyleMeier, Julia K., Matthias Schnetz, Susanne Beck, Tobias Schmid, Monica Dominguez, Sanela Kalinovic, Andreas Daiber, Bernhard Brüne, and Michaela Jung. 2021. "Iron-Bound Lipocalin-2 Protects Renal Cell Carcinoma from Ferroptosis" Metabolites 11, no. 5: 329. https://0-doi-org.brum.beds.ac.uk/10.3390/metabo11050329