
Targeted Metabolomics: The LC-MS/MS Based Quantification of the Metabolites Involved in the Methylation Biochemical Pathways


Abstract
:1. Introduction
2. Results
2.1. Validation Results
2.1.1. Calibration Model
2.1.2. Recovery
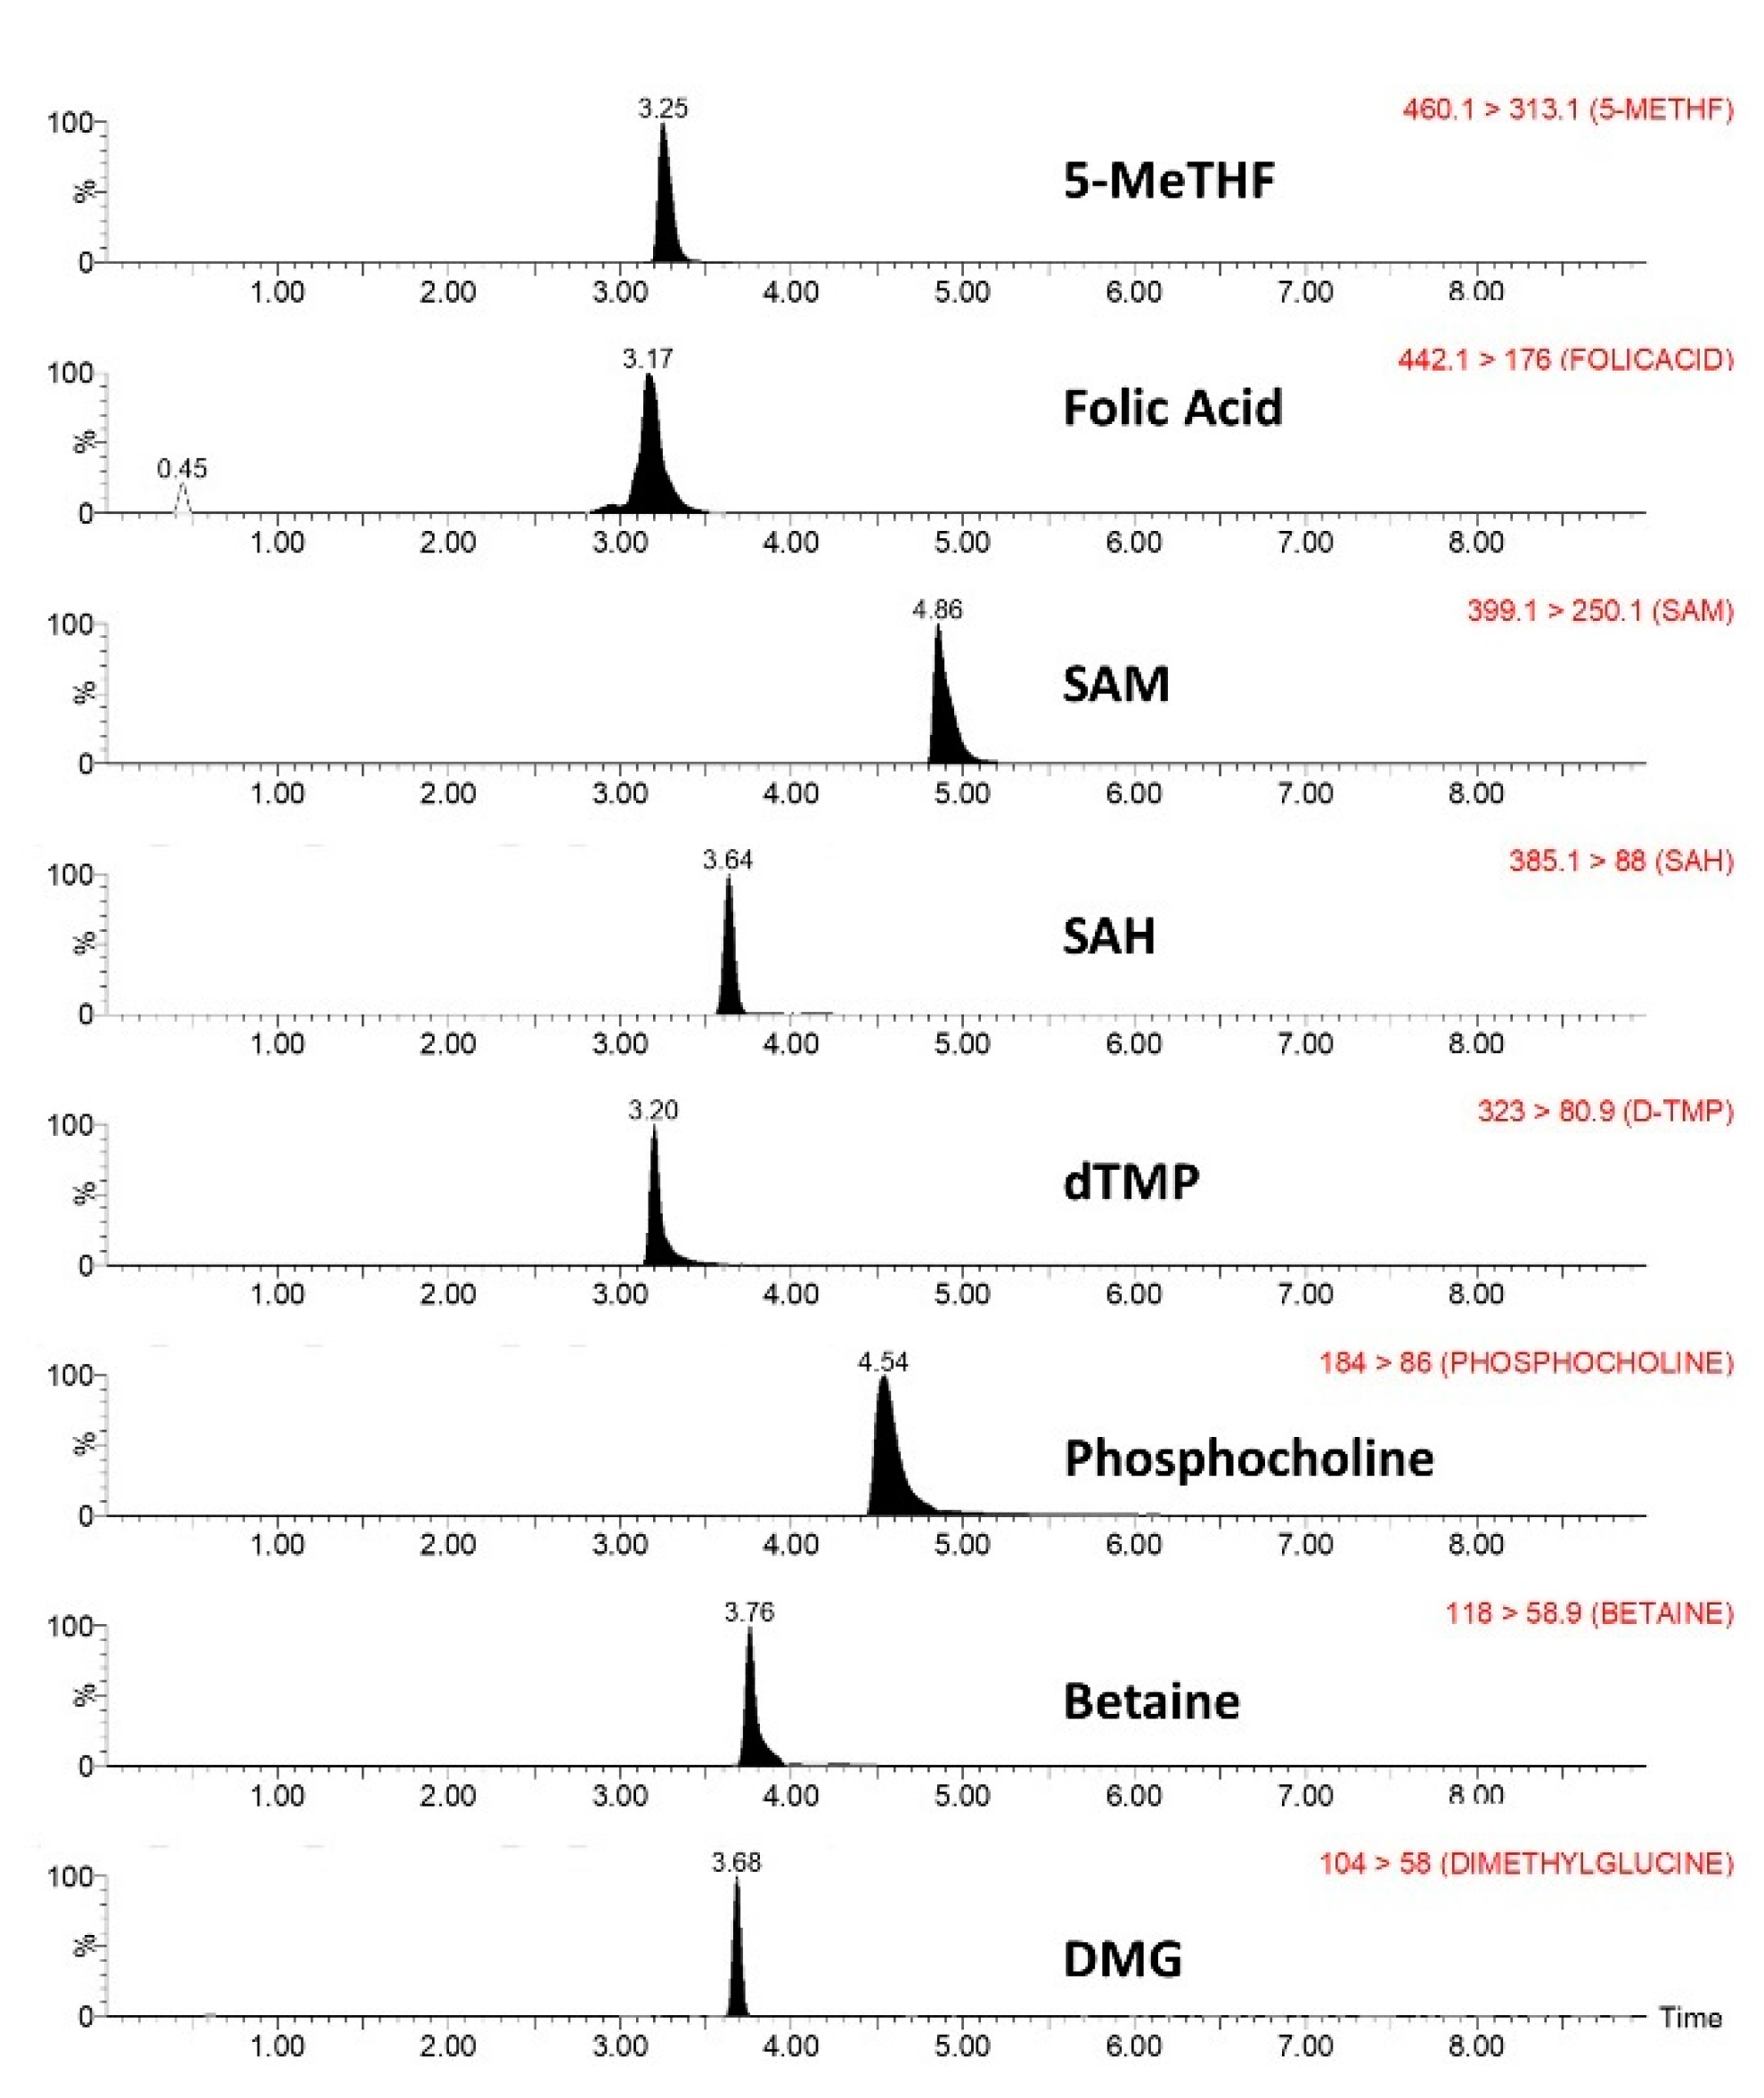
2.1.3. Specificity
2.1.4. Accuracy
2.1.5. Precision
2.1.6. Sensitivity
2.1.7. Matrix Effect
2.1.8. Stability
2.1.9. Dilution Integrity
2.1.10. Incurred Samples Reanalysis
2.1.11. Robustness
2.2. Application to Human Plasma Samples
3. Discussion
4. Materials and Methods
4.1. Chemicals and Reagents
4.2. Plasma Sample Collection and Pretreatment
4.3. Chromatography
4.4. Mass Spectrometry
4.5. Validation
4.5.1. Specificity
4.5.2. Calibration Model
4.5.3. Recovery
4.5.4. Accuracy
4.5.5. Precision
4.5.6. Sensitivity
4.5.7. Matrix Effect
4.5.8. Stability
4.5.9. Dilution Integrity
4.5.10. Incurred Sample Reanalysis
4.5.11. Robustness
4.5.12. Analysis Timescale
Supplementary Materials
Author Contributions
Funding
Institutional Review Board Statement
Informed Consent Statement
Data Availability Statement
Acknowledgments
Conflicts of Interest
References
- Smart, R.C.; Hodgson, E. Molecular and Biochemical Toxicology; John Wiley & Sons, Inc.: Hoboken, NJ, USA, 2013; ISBN 1118679725. [Google Scholar]
- Florian, L. Encyclopedia of Molecular Mechanisms of Disease; Springer Science & Business Media: Berlin/Heidelberg, Germany, 2013; Volume 2. [Google Scholar] [CrossRef]
- Werner, E.R.; Blau, N.; Thöny, B. Tetrahydrobiopterin: Biochemistry and pathophysiology. Biochem. J. 2011, 438, 397–414. [Google Scholar] [CrossRef] [Green Version]
- Fowler, B. The folate cycle and disease in humans. Kidney Int. 2001, 59, S221–S229. [Google Scholar] [CrossRef] [Green Version]
- Shea, T.B.; Rogers, E. Lifetime requirement of the methionine cycle for neuronal development and maintenance. Curr. Opin. Psychiatry 2014, 27, 138–142. [Google Scholar] [CrossRef]
- Belalcázar, A.D.; Ball, J.G.; Frost, L.M.; Valentovic, M.A.; Wilkinson, J. Transsulfuration Is a Significant Source of Sulfur for Glutathione Production in Human Mammary Epithelial Cells. ISRN Biochem. 2014, 2013, 637897. [Google Scholar] [CrossRef] [Green Version]
- Thony, B.; Auerbach, G.; Blau, N. Tetrahydrobiopterin biosynthesis, regeneration and functions. Biochem. J. 2000, 347, 1. [Google Scholar] [CrossRef] [PubMed]
- Crider, K.S.; Yang, T.P.; Berry, R.J.; Bailey, L.B. Folate and DNA methylation: A review of molecular mechanisms and the evidence for folate’s role. Adv. Nutr. 2012, 3, 21–38. [Google Scholar] [CrossRef] [PubMed] [Green Version]
- Fenech, M. Folate (vitamin B9) and vitamin B12 and their function in the maintenance of nuclear and mitochondrial genome integrity. Mutat. Res. Fundam. Mol. Mech. Mutagenesis 2012, 733, 21–33. [Google Scholar] [CrossRef] [PubMed]
- Patanwala, I.; King, M.J.; Barrett, D.A.; Rose, J.; Jackson, R.; Hudson, M.; Philo, M.; Dainty, J.R.; Wright, A.J.A.; Finglas, P.M.; et al. Folic acid handling by the human gut: Implications for food fortification and supplementation. Am. J. Clin. Nutr. 2014, 100, 593–599. [Google Scholar] [CrossRef] [PubMed] [Green Version]
- Brunaud, L.; Alberto, J.-M.; Ayav, A.; Gérard, P.; Namour, F.; Antunes, L.; Braun, M.; Bronowicki, J.-P.; Bresler, L.; Guéant, J.-L. Effects of vitamin B12 and folate deficiencies on DNA methylation and carcinogenesis in rat liver. Clin. Chem. Lab. Med. 2003, 41, 1012–1019. [Google Scholar] [CrossRef]
- Kok, D.E.G.; Dhonukshe-Rutten, R.A.M.; Lute, C.; Heil, S.G.; Uitterlinden, A.G.; van der Velde, N.; van Meurs, J.B.J.; van Schoor, N.M.; Hooiveld, G.J.E.J.; de Groot, L.C.P.G.M.; et al. The effects of long-term daily folic acid and vitamin B12 supplementation on genome-wide DNA methylation in elderly subjects. Clin. Epigenetics 2015, 7, 121. [Google Scholar] [CrossRef] [Green Version]
- Miller, A.L. The Methylation, Neurotransmitter, and Antioxidant Connections Between Folate and Depression. Altern. Med. Rev. Med. Rev. 2008, 13, 216–226. [Google Scholar]
- Papakostas, G.I.; Shelton, R.C.; Zajecka, J.M.; Etemad, B.; Rickels, K.; Clain, A.; Baer, L.; Dalton, E.D.; Sacco, G.R.; Schoenfeld, D.; et al. L-methylfolate as adjunctive therapy for SSRI-resistant major depression: Results of two randomized, double-blind,,parallel-sequential trials. Am. J. Psychiatry 2012, 169, 1267–1274. [Google Scholar] [CrossRef]
- Papakostas, G.I.; Shelton, R.C.; Zajecka, J.M.; Bottiglieri, T.; Roffman, J.; Cassiello, C.; Stahl, S.M.; Fava, M. Effect of adjunctive L-methylfolate 15 mg among inadequate responders to SSRIs in depressed patients who were stratified by Biomarker levels and genotype: Results from a randomized clinical trial. Proc. J. Clin. Psychiatry 2014, 75, 855–863. [Google Scholar] [CrossRef]
- Nelson, J.C. The Evolving Story of Folate in Depression and the Therapeutic Potential of l-Methylfolate. Am. J. Psychiatry 2012, 169, 1223–1225. [Google Scholar] [CrossRef]
- Shelton, R.C.; Pencina, M.J.; Barrentine, L.W.; Ruiz, J.A.; Fava, M.; Zajecka, J.M.; Papakostas, G.I. Association of obesity and inflammatory marker levels on treatment outcome: Results from a double-blind, randomized study of adjunctive l-methylfolate calcium in patients with MDD who are inadequate responders to SSRIs. J. Clin. Psychiatry 2015, 76, 1635–1641. [Google Scholar] [CrossRef] [PubMed]
- Lever, M.; George, P.M.; Dellow, W.J.; Scott, R.S.; Chambers, S.T. Homocysteine, glycine betaine, and N,N-dimethylglycine in patients attending a lipid clinic. Metabolism 2005, 54, 1–14. [Google Scholar] [CrossRef]
- Freed, W.J. N,N-Dimethylglycine, Betaine, and Seizures. Arch. Neurol. 1984, 41, 1129–1130. [Google Scholar] [CrossRef] [PubMed]
- Eliyahu, G.; Kreizman, T.; Degani, H. Phosphocholine as a biomarker of breast cancer: Molecular and biochemical studies. Int. J. Cancer 2007, 120, 1721–1730. [Google Scholar] [CrossRef] [PubMed]
- Kankaanpää, J.; Sämpi, M.; Bloigu, R.; Wang, C.; Akhi, R.; Kesäniemi, Y.A.; Remes, A.M.; Ukkola, O.; Hörkkö, S. IgA antibodies to phosphocholine associate with long-term cardiovascular disease risk. Atherosclerosis 2018, 269, 294–300. [Google Scholar] [CrossRef] [Green Version]
- Anstee, Q.M.; Day, C.P. S-adenosylmethionine (SAMe) therapy in liver disease: A review of current evidence and clinical utility. J. Hepatol. 2012, 57, 1097–1109. [Google Scholar] [CrossRef] [Green Version]
- Galizia, I.; Oldani, L.; Macritchie, K.; Amari, E.; Dougall, D.; Jones, T.N.; Lam, R.W.; Massei, G.J.; Yatham, L.N.; Young, A.H. S-adenosyl methionine (SAMe) for depression in adults. Cochrane Database Syst. Rev. 2016, 2016. [Google Scholar] [CrossRef] [PubMed] [Green Version]
- Xiao, Y.; Su, X.; Huang, W.; Zhang, J.; Peng, C.; Huang, H.; Wu, X.; Huang, H.; Xia, M.; Ling, W. Role of S-adenosylhomocysteine in cardiovascular disease and its potential epigenetic mechanism. Int. J. Biochem. Cell Biol. 2015, 67, 158–166. [Google Scholar] [CrossRef]
- Selley, M.L. A metabolic link between S-adenosylhomocysteine and polyunsaturated fatty acid metabolism in Alzheimer’s disease. Neurobiol. Aging 2007, 28, 1834–1839. [Google Scholar] [CrossRef]
- Allis, C.D.; Jenuwein, T. The molecular hallmarks of epigenetic control. Nat. Rev. Genet. 2016, 17, 487–500. [Google Scholar] [CrossRef] [PubMed]
- Lim, D.H.K.; Maher, E.R. DNA methylation: A form of epigenetic control of gene expression. Obstet. Gynaecol. 2010, 12, 37–42. [Google Scholar] [CrossRef]
- Hannisdal, R.; Ueland, P.M.; Svardal, A. Liquid chromatography-tandem mass spectrometry analysis of folate and folate catabolites in human serum. Clin. Chem. 2009, 55, 1147–1154. [Google Scholar] [CrossRef] [PubMed] [Green Version]
- Kirsch, S.H.; Knapp, J.P.; Herrmann, W.; Obeid, R. Quantification of key folate forms in serum using stable-isotope dilution ultra performance liquid chromatography-tandem mass spectrometry. J. Chromatogr. B Anal. Technol. Biomed. Life Sci. 2009, 878, 68–75. [Google Scholar] [CrossRef] [PubMed]
- Nandania, J.; Kokkonen, M.; Euro, L.; Velagapudi, V. Simultaneous measurement of folate cycle intermediates in different biological matrices using liquid chromatography–tandem mass spectrometry. J. Chromatogr. B Anal. Technol. Biomed. Life Sci. 2018, 1092, 168–178. [Google Scholar] [CrossRef] [Green Version]
- Zheng, X.H.; Jiang, L.Y.; Zhao, L.T.; Zhang, Q.Y.; Ding, L. Simultaneous quantitation of folic acid and 5-methyltetrahydrofolic acid in human plasma by HPLC-MS/MS and its application to a pharmacokinetic study. J. Pharm. Anal. 2015, 5, 269–275. [Google Scholar] [CrossRef] [Green Version]
- Kok, R.M.; Smith, D.E.C.; Dainty, J.R.; Van Den Akker, J.T.; Finglas, P.M.; Smulders, Y.M.; Jakobs, C.; De Meer, K. 5-Methyltetrahydrofolic acid and folic acid measured in plasma with liquid chromatography tandem mass spectrometry: Applications to folate absorption and metabolism. Anal. Biochem. 2004, 326, 129–138. [Google Scholar] [CrossRef]
- Klepacki, J.; Brunner, N.; Schmitz, V.; Klawitter, J.; Christians, U.; Klawitter, J. Development and validation of an LC-MS/MS assay for the quantification of the trans-methylation pathway intermediates S-adenosylmethionine and S-adenosylhomocysteine in human plasma. Clin. Chim. Acta 2013, 421, 91–97. [Google Scholar] [CrossRef] [Green Version]
- Wang, X.; Zhang, T.; Zhao, X.; Guan, Z.; Wang, Z.; Zhu, Z.; Xie, Q.; Wang, J.; Niu, B. Quantification of folate metabolites in serum using ultraperformance liquid chromatography tandem mass spectrometry. J. Chromatogr. B Anal. Technol. Biomed. Life Sci. 2014, 962, 9–13. [Google Scholar] [CrossRef]
- Kirsch, S.H.; Knapp, J.P.; Geisel, J.; Herrmann, W.; Obeid, R. Simultaneous quantification of S-adenosyl methionine and S-adenosyl homocysteine in human plasma by stable-isotope dilution ultra performance liquid chromatography tandem mass spectrometry. J. Chromatogr. B Anal. Technol. Biomed. Life Sci. 2009, 877, 3865–3870. [Google Scholar] [CrossRef] [PubMed]
- Holm, P.I.; Ueland, P.M.; Kvalheim, G.; Lien, E.A. Determination of choline, betaine, and dimethylglycine in plasma by a high-throughput method based on normal-phase chromatography-tandem mass spectrometry. Clin. Chem. 2003, 49, 286–294. [Google Scholar] [CrossRef]
- Kirsch, S.H.; Herrmann, W.; Rabagny, Y.; Obeid, R. Quantification of acetylcholine, choline, betaine, and dimethylglycine in human plasma and urine using stable-isotope dilution ultra performance liquid chromatography-tandem mass spectrometry. J. Chromatogr. B Anal. Technol. Biomed. Life Sci. 2010, 878, 3338–3344. [Google Scholar] [CrossRef] [PubMed]
- Guiraud, S.P.; Montoliu, I.; Da Silva, L.; Dayon, L.; Galindo, A.N.; Corthésy, J.; Kussmann, M.; Martin, F.P. High-throughput and simultaneous quantitative analysis of homocysteine–methionine cycle metabolites and co-factors in blood plasma and cerebrospinal fluid by isotope dilution LC–MS/MS. Anal. Bioanal. Chem. 2017, 409, 295–305. [Google Scholar] [CrossRef] [PubMed] [Green Version]
- Johansson, M.; Van Guelpen, B.; Vollset, S.E.; Hultdin, J.; Bergh, A.; Key, T.; Midttun, Ø.; Hallmans, G.; Ueland, P.M.; Stattin, P. One-carbon metabolism and prostate cancer risk: Prospective investigation of seven circulating B vitamins and metabolites. Cancer Epidemiol. Biomark. Prev. 2009, 18, 1538–1543. [Google Scholar] [CrossRef] [Green Version]
- Ueland, P.M.; Midttun, Ø.; Windelberg, A.; Svardal, A.; Skålevik, R.; Hustad, S. Quantitative profiling of folate and one-carbon metabolism in large-scale epidemiological studies by mass spectrometry. Clin. Chem. Lab. Med. 2007, 45, 1737–1745. [Google Scholar] [CrossRef]
- Komaromy-Hiller, G.; Nuttall, K.L.; Ashwood, E.R. Effect of storage on serum vitamin B12 and folate stability. Ann. Clin. Lab. Sci. 1997, 27, 249–253. [Google Scholar]
- De Brouwer, V.; Zhang, G.F.; Storozhenko, S.; Van Der Straeten, D.; Lambert, W.E. PH stability of individual folates during critical sample preparation steps in prevision of the analysis of plant folates. Phytochem. Anal. 2007, 18, 496–508. [Google Scholar] [CrossRef]
- Nguyen, M.T.; Indrawati; Van Loey, A.; Hendrickx, M. Effect of pH on temperature stability of folates. Commun. Agric. Appl. Biol. Sci. 2004, 69, 203–206. [Google Scholar] [PubMed]
- Danov, K.D.; Kralchevska, S.D.; Kralchevsky, P.A.; Ananthapadmanabhan, K.P.; Lips, A. Mixed solutions of anionic and zwitterionic surfactant (Betaine): Surface-tension isotherms, adsorption, and relaxation kinetics. Langmuir 2004, 20, 5445–5453. [Google Scholar] [CrossRef] [PubMed] [Green Version]
- Hadjmohammadi, M.R.; Sharifi, V. Use of solid phase extraction for sample clean-up and preconcentration of vitamin B12 in multivitamin tablet before HPLC-UV, UV and atomic absorption spectrophotometry. J. Food Drug Anal. 2007, 15, 285–289. [Google Scholar] [CrossRef]


| Analyte | Type * | Weight | R2 | Sy/x | B0 ± SE ** | B1 ± SE ** | B2 ± SE ** | Range (ng/mL) | BCVs *** |
|---|---|---|---|---|---|---|---|---|---|
| 5-MeTHF | l | - | 0.998 | 206.6 | −27 ± 11 | 1.62 ± 0.03 | - | 50–7500 | 100% |
| Folic Acid | q | 1/x | 0.998 | 3.1 | 48 ± 82 | 1.02 ± 0.11 | −80.5 ± 71.0 | 10–2000 | 80% |
| SAM | q | - | 0.998 | 224.2 | 316 ± 9 | 0.26 ± 0.77 | 3.4 ± 0.3 | 10–50,000 | 75% |
| SAH | l | 1/y | 0.992 | 502.0 | 3103 ± 697 | 428 ± 160 | - | 10–50,000 | 85% |
| dTMP | q | 1/y | 0.992 | 374.1 | 2762 ± 1366 | 35.78 ± 2.25 | −1.6 ± 1.5 | 2.5–50,000 | 80% |
| Phosphο | l | - | 0.998 | 123.5 | 62 ± 43 | 0.17 ± 0.02 | - | 250–50,000 | 90% |
| DΜG | l | - | 0.998 | 264.3 | 748 ± 88 | 0.00 ± 0.33 | - | 100–50,000 | 85% |
| Betaine | q | - | 0.998 | 263.4 | 2311 ± 20 | −0.01 ± 0.22 | 0.08 ± 0.42 | 2000–50,000 | 90% |
| B12 | l | - | 0.997 | 490.3 | 5 ± 3 | 0.00 ± 0.01 | - | 5000–50,000 | 0% |
| Analyte | 5-MeTHF | Folic Acid | SAM | SAH | PHOSPHO | BETAINE | DMG | dTMP |
|---|---|---|---|---|---|---|---|---|
| (ng/mL) | (ng/mL) | (ng/mL) | (ng/mL) | (ng/mL) | (ng/mL) | (ng/mL) | (ng/mL) | |
| Sample 1 | 164 | 18.3 | 75.8 | 38.0 | 335 | 1901 | 194 | 14.4 |
| Sample 2 | 399 | 62.4 | 25.9 | 102 | 506 | 2666 | 105 | 7.6 |
| Sample 3 | 255 | 21.8 | 75.8 | 56.2 | 438 | 4504 | 198 | 12.4 |
| Sample 4 | 204 | 15.6 | 55.3 | 43.3 | 294 | 9067 | 169 | 8.2 |
| Sample 5 | 199 | 81.5 | 87.0 | 32.0 | 421 | 3425 | 278 | 29.0 |
| Sample 6 | 167 | 13.6 | 34.4 | 25.4 | 493 | 1921 | 576 | 34.5 |
| STDEV | 88.6 | 28.9 | 24.7 | 27.7 | 85.0 | 2709 | 167 | 11.3 |
| AVG | 231 | 35.5 | 59.0 | 49.4 | 415 | 3914 | 253 | 17.6 |
| %RSD | 38.2 | 81.6 | 41.9 | 56.1 | 20.5 | 69.2 | 65.9 | 64.0 |
| Analyte | Precursor Ion (m/z) | Product Ion (m/z) | Dwell Time (s) | Cone Voltage (V) | Fragmentation Energy (V) |
|---|---|---|---|---|---|
| N,N-dimethylglycine | 104.0 | 58.0 | 0.022 | 46 | 12 |
| betaine | 118.0 | 58.9 | 0.022 | 28 | 16 |
| phosphocholine | 184.0 | 86.0 | 0.022 | 34 | 16 |
| dTMP | 323.0 | 80.9 | 0.022 | 24 | 16 |
| S-adenosylmethionine | 385.1 | 88.0 | 0.070 | 34 | 44 |
| S-adenosylhomocysteine | 399.1 | 250.1 | 0.070 | 36 | 14 |
| folic acid | 442.1 | 295.1 | 0.022 | 28 | 12 |
| 5-methyltetrahydrofolic acid | 460.1 | 313.1 | 0.022 | 34 | 20 |
| B12 (cyanocobalamin) | 678.6 | 147.1 | 0.022 | 46 | 42 |
| daptomycin | 460.1 | 313.1 | 0.022 | 28 | 16 |
Publisher’s Note: MDPI stays neutral with regard to jurisdictional claims in published maps and institutional affiliations. |
© 2021 by the authors. Licensee MDPI, Basel, Switzerland. This article is an open access article distributed under the terms and conditions of the Creative Commons Attribution (CC BY) license (https://creativecommons.org/licenses/by/4.0/).
Share and Cite
Ntasi, G.; Tsarbopoulos, A.; Mikros, E.; Gikas, E. Targeted Metabolomics: The LC-MS/MS Based Quantification of the Metabolites Involved in the Methylation Biochemical Pathways. Metabolites 2021, 11, 416. https://0-doi-org.brum.beds.ac.uk/10.3390/metabo11070416
Ntasi G, Tsarbopoulos A, Mikros E, Gikas E. Targeted Metabolomics: The LC-MS/MS Based Quantification of the Metabolites Involved in the Methylation Biochemical Pathways. Metabolites. 2021; 11(7):416. https://0-doi-org.brum.beds.ac.uk/10.3390/metabo11070416
Chicago/Turabian StyleNtasi, Georgia, Anthony Tsarbopoulos, Emmanuel Mikros, and Evagelos Gikas. 2021. "Targeted Metabolomics: The LC-MS/MS Based Quantification of the Metabolites Involved in the Methylation Biochemical Pathways" Metabolites 11, no. 7: 416. https://0-doi-org.brum.beds.ac.uk/10.3390/metabo11070416