
NMR-Based Metabolomics Approach to Investigate the Effects of Fruits of Acanthopanax sessiliflorus in a High-Fat Diet Induced Mouse Model

 , , , and
Abstract
:1. Introduction
2. Results
3. Discussion
4. Materials and Methods
4.1. Extraction of Acanthopanax sessiliflorus Fruits
4.2. Animal Administration
4.3. Sample Preparation
4.4. NMR Data Acquisition and Data Processing
4.5. Data Analysis
5. Conclusions
Author Contributions
Funding
Institutional Review Board Statement
Informed Consent Statement
Data Availability Statement
Acknowledgments
Conflicts of Interest
References
- Hassan, Y.; Head, V.; Jacob, D.; Bachmann, M.O.; Diu, S.; Ford, J. Lifestyle interventions for weight loss in adults with severe obesity: A systematic review. Clin. Obes. 2016, 6, 395–403. [Google Scholar] [CrossRef] [PubMed] [Green Version]
- Marti, A.; Moreno-Aliaga, M.J.; Hebebrand, J.; Martinez, J.A. Genes, lifestyles and obesity. Int. J. Obes. 2004, 28, S29–S36. [Google Scholar] [CrossRef] [Green Version]
- Conway, B.; Rene, A. Obesity as a disease: No lightweight matter. Obes. Rev. 2004, 5, 145–151. [Google Scholar] [CrossRef]
- Pi-Sunyer, X. The medical risks of obesity. Postgrad. Med. 2009, 121, 21–33. [Google Scholar] [CrossRef]
- Patel, D. Pharmacotherapy for the management of obesity. Metabolism 2015, 64, 1376–1385. [Google Scholar] [CrossRef]
- Picot, J.; Jones, J.; Colquitt, J.L.; Gospodarevskaya, E.; Loveman, E.; Baxter, L.; Clegg, A.J. The clinical effectiveness and cost-effectiveness of bariatric (weight loss) surgery for obesity: A systematic review and economic evaluation. Health Technol. Assess. 2009, 13, 1–190. [Google Scholar] [CrossRef] [Green Version]
- Maggard, M.A.; Shugarman, L.R.; Suttorp, M.; Maglione, M.; Sugerman, H.J.; Livingston, E.H.; Nguyen, N.T.; Li, Z.; Mojica, W.A.; Hilton, L.; et al. Meta-analysis: Surgical treatment of obesity. Ann. Intern. Med. 2005, 142, 547–559. [Google Scholar] [CrossRef] [PubMed] [Green Version]
- Apovian, C.M.; Aronne, L.J.; Bessesen, D.H.; McDonnell, M.E.; Murad, M.H.; Pagotto, U.; Ryan, D.H.; Still, C.D. Pharmacological management of obesity: An Endocrine Society clinical practice guideline. J. Clin. Endocrinol. Metab. 2015, 100, 342–362. [Google Scholar] [CrossRef] [PubMed]
- Leung, W.Y.; Thomas, G.N.; Chan, J.C.; Tomlinson, B. Weight management and current options in pharmacotherapy: Orlistat and sibutramine. Clin. Ther. 2003, 25, 58–80. [Google Scholar] [CrossRef]
- Florentin, M.; Liberopoulos, E.N.; Elisaf, M.S. Sibutramine-associated adverse effects: A practical guide for its safe use. Obes. Rev. 2008, 9, 378–387. [Google Scholar] [CrossRef] [PubMed]
- Lee, J.W.; Baek, N.I.; Lee, D.Y. Inhibitory effects of seco-triterpenoids from Acanthopanax sessiliflorus fruits on HUVEC invasion and ACE activity. Nat. Prod. Commun. 2015, 10, 1517–1520. [Google Scholar] [CrossRef] [PubMed] [Green Version]
- Zhao, L.; An, Q.; Qin, F.; Xiong, Z. Simultaneous determination of six constituents in the fruit of Acanthopanax sessiliflorus (Rupr. et Maxim.) Seem. by HPLC–UV. Nat. Prod. Res. 2014, 28, 500–502. [Google Scholar] [CrossRef]
- Lee, D.Y.; Seo, K.H.; Jeong, R.H.; Lee, S.M.; Kim, G.S.; Noh, H.J.; Kim, S.Y.; Kim, G.W.; Kim, J.Y.; Baek, N.I. Anti-inflammatory lignans from the fruits of Acanthopanax sessiliflorus. Molecules 2013, 18, 41–49. [Google Scholar] [CrossRef] [Green Version]
- Jung, I.H.; Kim, S.E.; Lee, Y.G.; Kim, D.H.; Kim, H.; Kim, G.S.; Baek, N.I.; Lee, D.Y. Antihypertensive effect of ethanolic extract from Acanthopanax sessiliflorus fruits and quality control of active compounds. Oxid. Med. Cell. Longev. 2018, 2018. [Google Scholar] [CrossRef] [Green Version]
- Lee, S.H.; Lee, Y.S.; Jung, S.H.; Ji, J.; Shin, K.H.; Kim, B.K.; Kang, S.S. Antitumor and immunostimulating activities of Acanthopanax sessiliflorus fruits. Nat. Prod. Sci. 2003, 9, 112–116. [Google Scholar]
- Ministry of Food and Drug Safety (KR). Food Public Code; Ministry of Food and Drug Safety: Cheongju, Korea, 2018. [Google Scholar]
- Wree, A.; Kahraman, A.; Gerken, G.; Canbay, A. Obesity affects the liver–the link between adipocytes and hepatocytes. Digestion 2011, 83, 41–49. [Google Scholar] [CrossRef] [PubMed]
- Marseglia, L.; Manti, S.; D’Angelo, G.; Nicotera, A.; Parisi, E.; Di Rosa, G.; Gitto, E.; Arrigo, T. Oxidative stress in obesity: A critical component in human diseases. Int. J. Mol. Sci. 2015, 16, 378–400. [Google Scholar] [CrossRef] [PubMed] [Green Version]
- Zhang, A.; Sun, H.; Wang, Z.; Sun, W.; Wang, P.; Wang, X. Metabolomics: Towards understanding traditional Chinese medicine. Planta Med. 2010, 76, 2026–2035. [Google Scholar] [CrossRef] [PubMed] [Green Version]
- Zhang, A.; Sun, H.; Wang, P.; Han, Y.; Wang, X. Modern analytical techniques in metabolomics analysis. Analyst 2012, 137, 293–300. [Google Scholar] [CrossRef] [PubMed]
- Schripsema, J. Application of NMR in plant metabolomics: Techniques, problems and prospects. Phytochem. Anal. 2010, 21, 14–21. [Google Scholar] [CrossRef]
- Eriksson, L.; Johansson, E.; Kettaneh-Wold, N.; Trygg, J.; Wikström, C.; Wold, S. Multi-and Megavariate Data Analysis. In Basic Principles and Applications I, 2nd ed.; Umetrics Academy: Umeå, Sweden, 2001; pp. 39–103. [Google Scholar]
- Mahadevan, S.; Shah, S.L.; Marrie, T.J.; Slupsky, C.M. Analysis of metabolomic data using support vector machines. Anal. Chem. 2008, 80, 7562–7570. [Google Scholar] [CrossRef]
- Xia, J.; Broadhurst, D.I.; Wilson, M.; Wishart, D.S. Translational biomarker discovery in clinical metabolomics: An introductory tutorial. Metabolomics 2013, 9, 280–299. [Google Scholar] [CrossRef] [Green Version]
- Jeong, S.; Yoon, M. Fenofibrate inhibits adipocyte hypertrophy and insulin resistance by activating adipose PPARα in high fat diet-induced obese mice. Exp. Mol. Med. 2009, 41, 397–405. [Google Scholar] [CrossRef] [Green Version]
- Mancini, F.P.; Lanni, A.; Sabatino, L.; Moreno, M.; Giannino, A.; Contaldo, F.; Colantuoni, V.; Goglia, F. Fenofibrate prevents and reduces body weight gain and adiposity in diet-induced obese rats. FEBS Lett. 2001, 491, 154–158. [Google Scholar] [CrossRef] [Green Version]
- Shin, Y.; Lee, M.; Lee, D.; Jang, J.; Shin, S.S.; Yoon, M. Fenofibrate Regulates Visceral Obesity and Nonalcoholic Steatohepatitis in Obese Female Ovariectomized C57BL/6J Mice. Int. J. Mol. Sci. 2021, 22, 3675. [Google Scholar] [CrossRef]
- Xu, H.; Barnes, G.T.; Yang, Q.; Tan, G.; Yang, D.; Chou, C.J.; Sole, J.; Nichols, A.; Ross, J.S.; Tartaglia, L.A.; et al. Chronic inflammation in fat plays a crucial role in the development of obesityrelated insulin resistance. J. Clin. Investig. 2003, 112, 1821–1830. [Google Scholar] [CrossRef]
- Maeda, N.; Shimomura, I.; Kishida, K.; Nishizawa, H.; Matsuda, M.; Nagaretani, H.; Furuyama, N.; Kondo, H.; Takahashi, M.; Arita, Y.; et al. Diet-induced insulin resistance in mice lacking adiponectin/ACRP30. Nat. Med. 2002, 8, 731–737. [Google Scholar] [CrossRef] [PubMed]
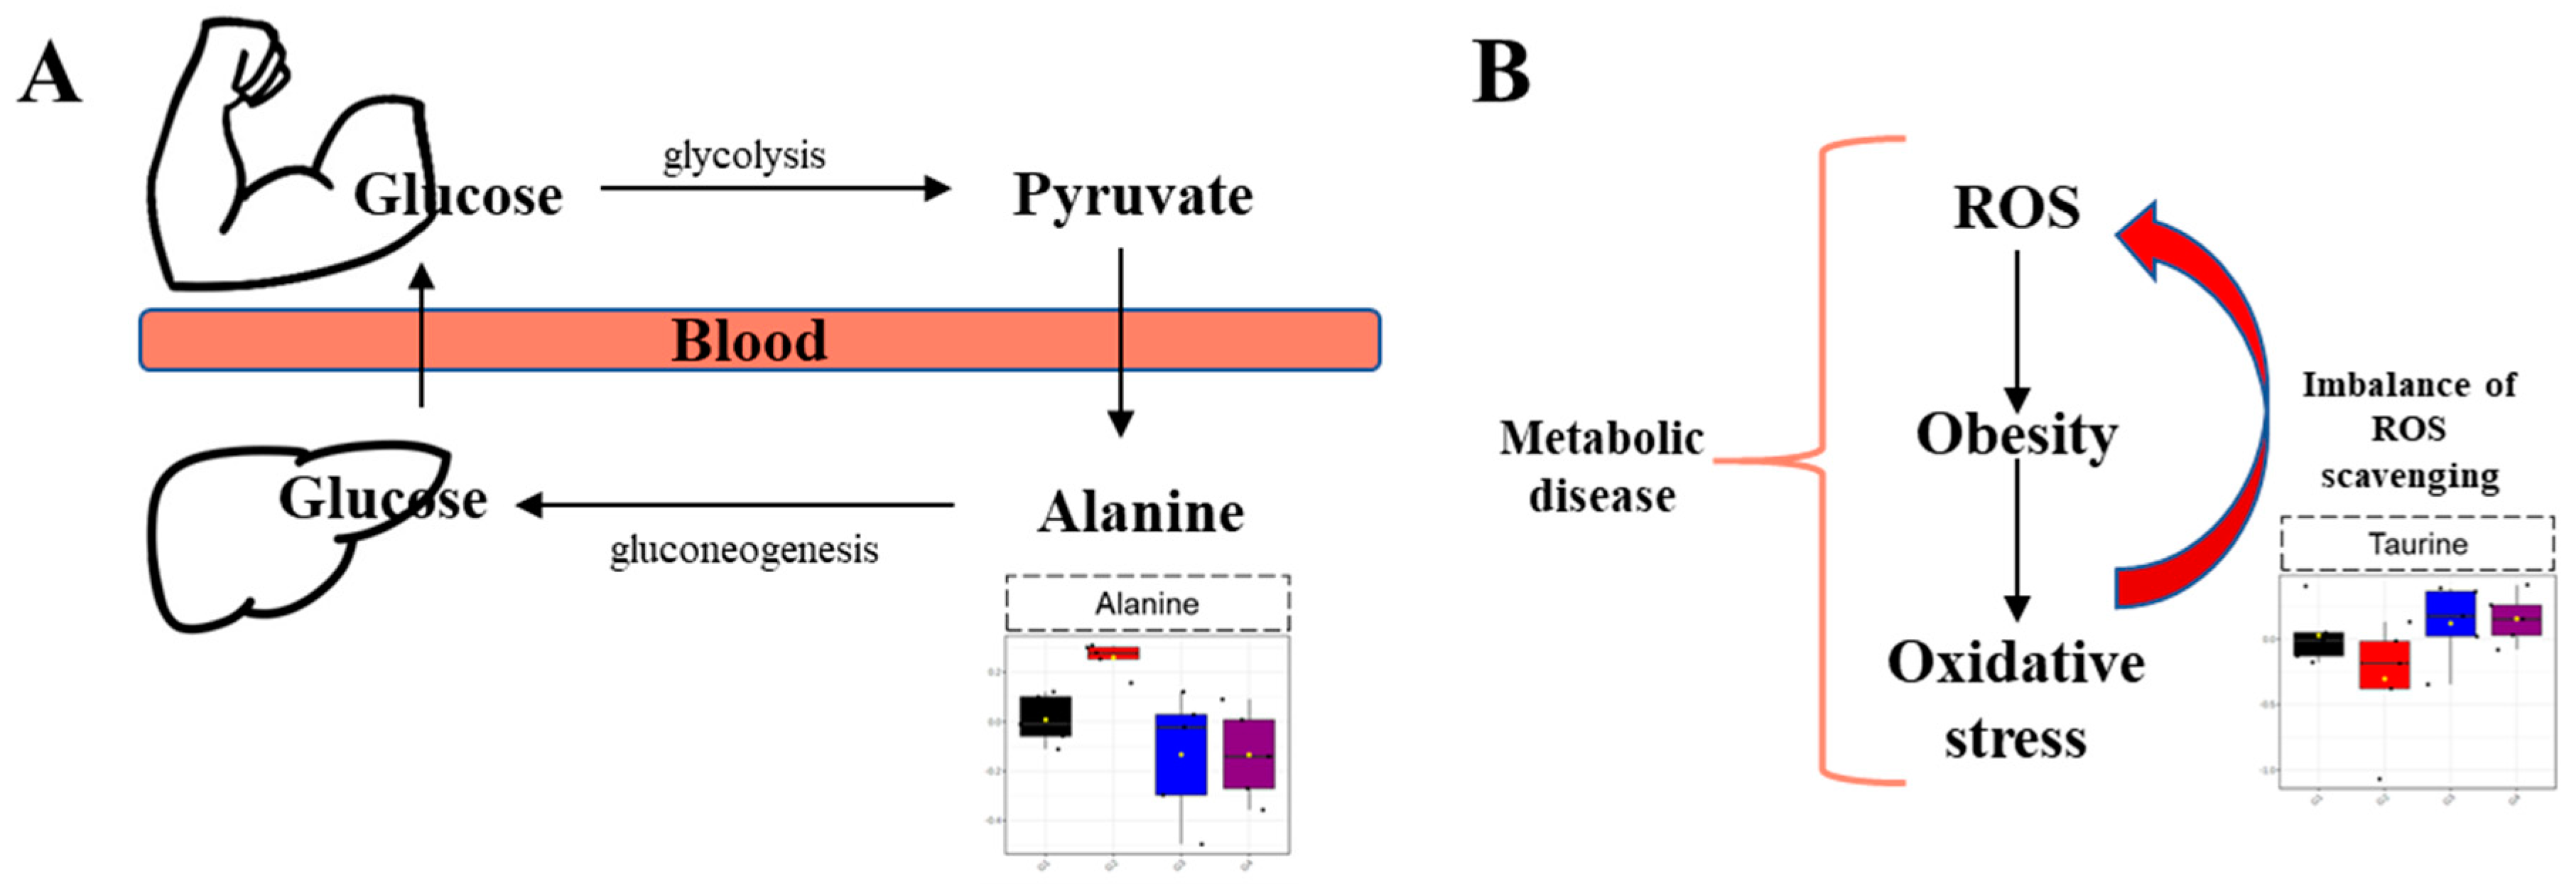
- Sarabhai, T.; Roden, M. Hungry for your alanine: When liver depends on muscle proteolysis. J. Clin. Investig. 2019, 129, 4563–4566. [Google Scholar] [CrossRef] [PubMed]
- Song, S.; Andrikopoulos, S.; Filippis, C.; Thorburn, A.W.; Khan, D.; Proietto, J. Mechanism of fat-induced hepatic gluconeogenesis: Effect of metformin. Am. Physiol. Endoc. Metab. 2001, 281, E275–E282. [Google Scholar] [CrossRef] [Green Version]
- Pietzke, M.; Arroyo, S.F.; Sumpton, D.; Mackay, G.M.; Martin-Castillo, B.; Camps, J.; Joven, J.; Javier, J.A.; Vazquez, A. Stratification of cancer and diabetes based on circulating levels of formate and glucose. Cancer Metab. 2019, 7, 1–11. [Google Scholar] [CrossRef] [Green Version]
- Módis, K.; Gerő, D.; Stangl, R.; Rosero, O.; Szijártó, A.; Lotz, G.; Mohácsik, P.; Szoleczky, P.; Coletta, C.; Szabó, C. Adenosine and inosine exert cytoprotective effects in an in vitro model of liver ischemia-reperfusion injury. Int. J. Mol. Med. 2013, 31, 437–446. [Google Scholar] [CrossRef] [PubMed] [Green Version]
- Gelein, D.P.; De Souze, L.F.; Ribeiro, G.R.; Zim, M.; Jardim, F.R.; Fonseca Moreir, J.C.; Bernard, E.A. Extracellular inosine is modulated by H2O2 and protects Sertoli cells against lipoperoxidation and cellular injury. Free Radic. Res. 2004, 38, 37–47. [Google Scholar] [CrossRef]
- Gudkov, S.V.; Shtarkman, I.N.; Smirnova, V.S.; Chernikov, A.V.; Bruskov, V.I. Guanosine and inosine display antioxidant activity, protect DNA in vitro from oxidative damage induced by reactive oxygen species, and serve as radioprotectors in mice. Radiat. Res. 2006, 165, 538–545. [Google Scholar] [CrossRef]
- Haskó, G.; Sitkovsky, M.V.; Szabo, C. Immunomodulatory and neuroprotective effects of inosine. Trends Pharmacol. Sci. 2004, 25, 152–157. [Google Scholar] [CrossRef] [PubMed]
- Gmoshinski, I.V.; Shipelin, V.A.; Trusov, N.V.; Apryatin, S.A.; Mzhelskaya, K.V.; Shumakova, A.A.; Timonin, A.N.; Riger, N.A.; Nikityuk, D.B. Effects of Tyrosine and Tryptophan Supplements on the Vital Indicators in Mice Differently Prone to Diet-Induced Obesity. Int. J. Mol. Sci. 2021, 22, 5956. [Google Scholar] [CrossRef] [PubMed]
- Shipelin, V.A.; Trusov, N.V.; Apryatin, S.A.; Shumakova, A.A.; Balakina, A.S.; Riger, N.A.; Gmoshinski, I.V.; Nikityuk, D.B. Effects of Tyrosine and Tryptophan in Rats with Diet-Induced Obesity. Int. J. Mol. Sci. 2021, 22, 2429. [Google Scholar] [CrossRef]
- Bondia-Pons, I.; Ryan, L.; Martinez, J.A. Oxidative stress and inflammation interactions in human obesity. J. Physiol. Biochem. 2012, 68, 701–711. [Google Scholar] [CrossRef] [PubMed]
- Rupérez, A.I.; Gil, A.; Aguilera, C.M. Genetics of oxidative stress in obesity. Int. J. Mol. Sci. 2014, 15, 3118–3144. [Google Scholar] [CrossRef] [Green Version]
- Esposito, K.; Ciotola, M.; Schisano, B.; Misso, L.; Giannetti, G.; Ceriello, A.; Giugliano, D. Oxidative stress in the metabolic syndrome. J. Endocrinol. Investig. 2006, 29, 791–795. [Google Scholar] [CrossRef]
- Amirkhizi, F.; Siassi, F.; Minaie, S.; Djalali, M.; Rahimi, A.; Chamari, M. Is obesity associated with increased plasma lipid peroxidation and oxidative stress in women? ARYA Atheroscler. 2010, 2, 189–192. [Google Scholar]
- Higdon, J.V.; Frei, B. Obesity and oxidative stress: A direct link to CVD? Arterioscler. Thromb. Vasc. Biol. 2003, 23, 365–367. [Google Scholar] [CrossRef] [PubMed] [Green Version]
- Zhang, Z.; Liu, D.; Yi, B.; Liao, Z.; Tang, L.; Yin, D.; He, M. Taurine supplementation reduces oxidative stress and protects the liver in an iron-overload murine model. Mol. Med. Rep. 2014, 10, 2255–2262. [Google Scholar] [CrossRef] [PubMed] [Green Version]
- Bligh, E.G.; Dyer, W.J. A rapid method of total lipid extraction and purification. Can. J. Biochem. Physiol. 1959, 37, 9118–9917. [Google Scholar] [CrossRef] [PubMed] [Green Version]


| Compound | Chemical Shifts (Multiplicities) (ppm) | G1 (%) | G2 (%) | G3 (%) | G4 (%) |
|---|---|---|---|---|---|
| Acetate | 1.91 (s) | 2.371 ± 0.212 | 2.740 ± 0.466 | 2.266 ± 0.529 | 2.950 ± 0.665 * |
| Alanine | 1.47 (d), 3.77 (q) | 5.013 ± 0.463 | 5.718 ± 0.576 ** | 4.421 ± 0.692 # | 4.287 ± 0.352 ## |
| Asparagine | 2.86 (dd), 2.94 (dd) | 1.150 ± 0.305 | 1.338 ± 0.254 | 1.395 ± 0.386 | 1.100 ± 0.236 |
| Aspartate | 2.68 (dd), 2.80 (dd) | 1.860 ± 0.369 | 1.736 ± 0.118 | 1.575 ± 0.107 | 1.204 ± 0.158 **,## |
| Betaine | 3.26 (s), 3.89 (s) | 2.466 ± 0.809 | 1.418 ± 0.327 * | 3.591 ± 1.965 # | 1.413 ± 0.293 * |
| β-HB | 1.19 (d), 2.29 (dd), 2.40 (dd), 4.14 (m) | 0.967 ± 0.316 | 0.872 ± 0.281 | 1.794 ± 0.278 **,## | 1.301 ± 0.470 |
| Choline | 3.19 (s), 3.51 (dd), 4.05 (ddd) | 1.976 ± 0.489 | 1.883 ± 0.605 | 1.837 ± 0.305 | 2.780 ± 0.239 *,# |
| Creatine | 3.02 (s), 3.92 (s) | 0.260 ± 0.026 | 0.252 ± 0.034 | 0.178 ± 0.042 | 0.218 ± 0.049 |
| Ethanolamine | 3.13 (m), 3.82 (m) | 0.633 ± 0.158 | 0.699 ± 0.070 | 0.805 ± 0.097 *,# | 0.847 ± 0.180 *,# |
| Formate | 8.44 (s) | 1.499 ± 0.507 | 1.009 ± 0.326 | 1.069 ± 0.326 | 1.609 ± 0.651 |
| Fumarate | 6.51 (s) | 0.045 ± 0.012 | 0.059 ± 0.013 | 0.017 ± 0.007 **,### | 0.053 ± 0.012 |
| Glucose | 3.24 (m), 3.40−3.48 (m), 3.53 (dd), 3.70−3.89 (m), 4.64 (d), 5.23 (d) | 6.133 ± 1.564 | 9.853 ± 2.912 | 10.228 ± 4.246 | 10.837 ± 4.365 * |
| Glutamate | 2.05(m), 2.12 (m), 2.32−2.35 (m) | 3.835 ± 0.579 | 3.744 ± 0.367 | 3.542 ± 0.446 | 3.424 ± 0.159 |
| Glutamine | 2.12−2.13 (m), 2.42−2.46 (m) | 2.854 ± 0.253 | 2.749 ± 0.228 | 3.721 ± 0.653 *,# | 2.543 ± 0.163 |
| Glutathione | 2.14−2.16 (m), 2.50−2.56 (m) | 1.528 ± 0.207 | 2.078 ± 0.553 | 1.509 ± 0.238 | 1.836 ± 0.277 * |
| Glycerol | 3.55 (dd), 3.64 (dd), 3.77 (m) | 8.292 ± 0.613 | 8.232 ± 0.895 | 5.625 ± 0.956 *,# | 7.515 ± 1.411 |
| Glycine | 3.55 (s) | 5.878 ± 0.512 | 6.260 ± 0.332 | 5.107 ± 0.109 *,# | 5.682 ± 0.187 * |
| Histidine | 7.08 (s), 7.86 (s) | 0.605 ± 0.055 | 0.569 ± 0.077 | 0.681 ± 0.094 **,## | 0.458 ± 0.038 ** |
| Hypoxanthine | 8.19 (s), 8.20 (s) | 1.362 ± 0.202 | 1.172 ± 0.440 | 1.064 ± 0.337 | 1.215 ± 0.425 |
| Inosine | 4.27 (m), 4.43 (dd), 6.09 (d), 8.23 (s), 8.34 (s) | 0.830 ± 0.252 | 0.473 ± 0.194 * | 1.220 ± 0.280 ## | 0.828 ± 0.156 # |
| Isoleucine | 0.93 (t), 1.00 (d), 1.25 (m), 1.46 (m), 1.97 (m), 3.66 (d) | 1.048 ± 0.162 | 1.081 ± 0.130 | 1.214 ± 0.135 *,## | 0.888 ± 0.067 |
| Lactate | 1.32 (d), 4.10 (q) | 5.074 ± 1.099 | 6.627 ± 0.609 | 5.000 ± 0.935 | 6.862 ± 0.994 * |
| Leucine | 0.94 (d), 0.96 (d), 1.67−1.74 (m) | 2.445 ± 0.605 | 2.294 ± 0.424 | 2.723 ± 0.633 # | 1.798 ± 0.192 |
| Lysine | 1.44−1.50 (m), 1.72 (m), 1.88−1.92 (m), 3.02 (t) | 1.869 ± 0.297 | 1.848 ± 0.396 | 1.896 ± 0.373 | 1.573 ± 0.213 |
| Mannose | 3.93−3.94 (m), 5.18 (d) | 0.624 ± 0.142 | 0.615 ± 0.094 | 0.536 ± 0.127 | 0.332 ± 0.053 **,### |
| Methionine | 2.11−2.19 (m), 2.63 (t) | 0.930 ± 0.179 | 0.966 ± 0.186 | 0.939 ± 0.175 | 0.706 ± 0.088 # |
| Niacinamide | 7.59 (dd), 8.24 (dd), 8.70 (dd), 8.93 (s) | 0.935 ± 0.110 | 0.847 ± 0.126 | 0.836 ± 0.088 | 0.851 ± 0.054 |
| PC | 3.21 (s), 3.58 (m), 4.15 (m) | 0.836 ± 0.179 | 0.818 ± 0.137 | 0.515 ± 0.101 *,# | 0.837 ± 0.157 |
| Ornithine | 1.74 (m), 1.82 (m), 1.93 (m), 3.04 (t) | 0.976 ± 0.276 | 0.959 ± 0.184 | 0.890 ± 0.111 | 0.602 ± 0.094 *,## |
| Phenylalanine | 3.12 (dd), 7.32 (m), 7.36 (m), 7.42 (m) | 0.835 ± 0.225 | 0.879 ± 0.229 | 0.796 ± 0.127 | 0.605 ± 0.080 # |
| Pyroglutamate | 2.02 (m), 2.38−2.41 (m), 2.50 (m), 4.17 (dd) | 0.774 ± 0.088 | 0.678 ± 0.049 | 0.754 ± 0.111 | 0.816 ± 0.162 |
| Serine | 3.83 (dd), 3.94 (dd), 3.98 (dd) | 3.064 ± 0.679 | 3.170 ± 0.360 | 2.780 ± 0.483 | 1.859 ± 0.297 **,## |
| Succinate | 2.39 (s) | 0.111 ± 0.065 | 0.106 ± 0.040 | 0.172 ± 0.054 # | 0.131 ± 0.024 |
| Taurine | 3.26 (t), 3.41 (t) | 20.324 ± 2.413 | 16.197 ± 4.497 | 20.811 ± 3.911 | 20.823 ± 3.400 |
| Threonine | 1.32 (d), 3.58 (d), 4.24 (m) | 1.760 ± 0.291 | 1.746 ± 0.240 | 1.523 ± 0.234 | 1.321 ± 0.100 *,# |
| TMAO | 3.26 (s) | 0.369 ± 0.059 | 0.063 ± 0.018 *** | 0.051 ± 0.014 *** | 0.059 ± 0.015 *** |
| Tryptophan | 7.27 (t), 7.32 (s), 7.53 (d), 7.72 (d) | 0.107 ± 0.042 | 0.117 ± 0.020 | 0.117 ± 0.022 | 0.121 ± 0.015 |
| Tyrosine | 3.05 (dd), 3.94 (dd), 6.89 (m), 7.18 (m) | 1.048 ± 0.214 | 1.175 ± 0.194 | 0.979 ± 0.169 | 0.798 ± 0.081 ## |
| Uracil | 5.79 (d), 7.54 (d) | 0.173 ± 0.083 | 0.121 ± 0.024 | 0.108 ± 0.030 | 0.098 ± 0.028 |
| Uridine | 5.89 (d), 5.91 (d), 7.87 (d) | 0.068 ± 0.026 | 0.053 ± 0.018 | 0.078 ± 0.019 # | 0.068 ± 0.011 |
| Valine | 0.98 (d), 1.03 (d), 2.26 (m), 3.60 (d) | 1.929 ± 0.368 | 1.807 ± 0.238 | 1.848 ± 0.278 | 1.519 ± 0.161 |
| Xanthine | 7.87 (s) | 2.583 ± 0.470 | 2.472 ± 0.236 | 1.706 ± 0.315 *,# | 2.431 ± 0.561 |
| myo-Inositol | 3.27 (t), 3.53 (dd), 3.61 (t), 4.06 (t) | 0.900 ± 0.122 | 0.941 ± 0.150 | 0.648 ± 0.252 | 1.016 ± 0.159 |
| β-Alanine | 2.55 (t), 3.17 (t) | 1.661 ± 0.336 | 1.567 ± 0.136 | 1.435 ± 0.289 | 1.785 ± 0.180 ## |
| Compounds | ND/HFD | HFD/HFD + A. sessiliflorus Fruit | ||||
|---|---|---|---|---|---|---|
| AUC | t-tests | Log2FC | AUC | t-tests | Log2FC | |
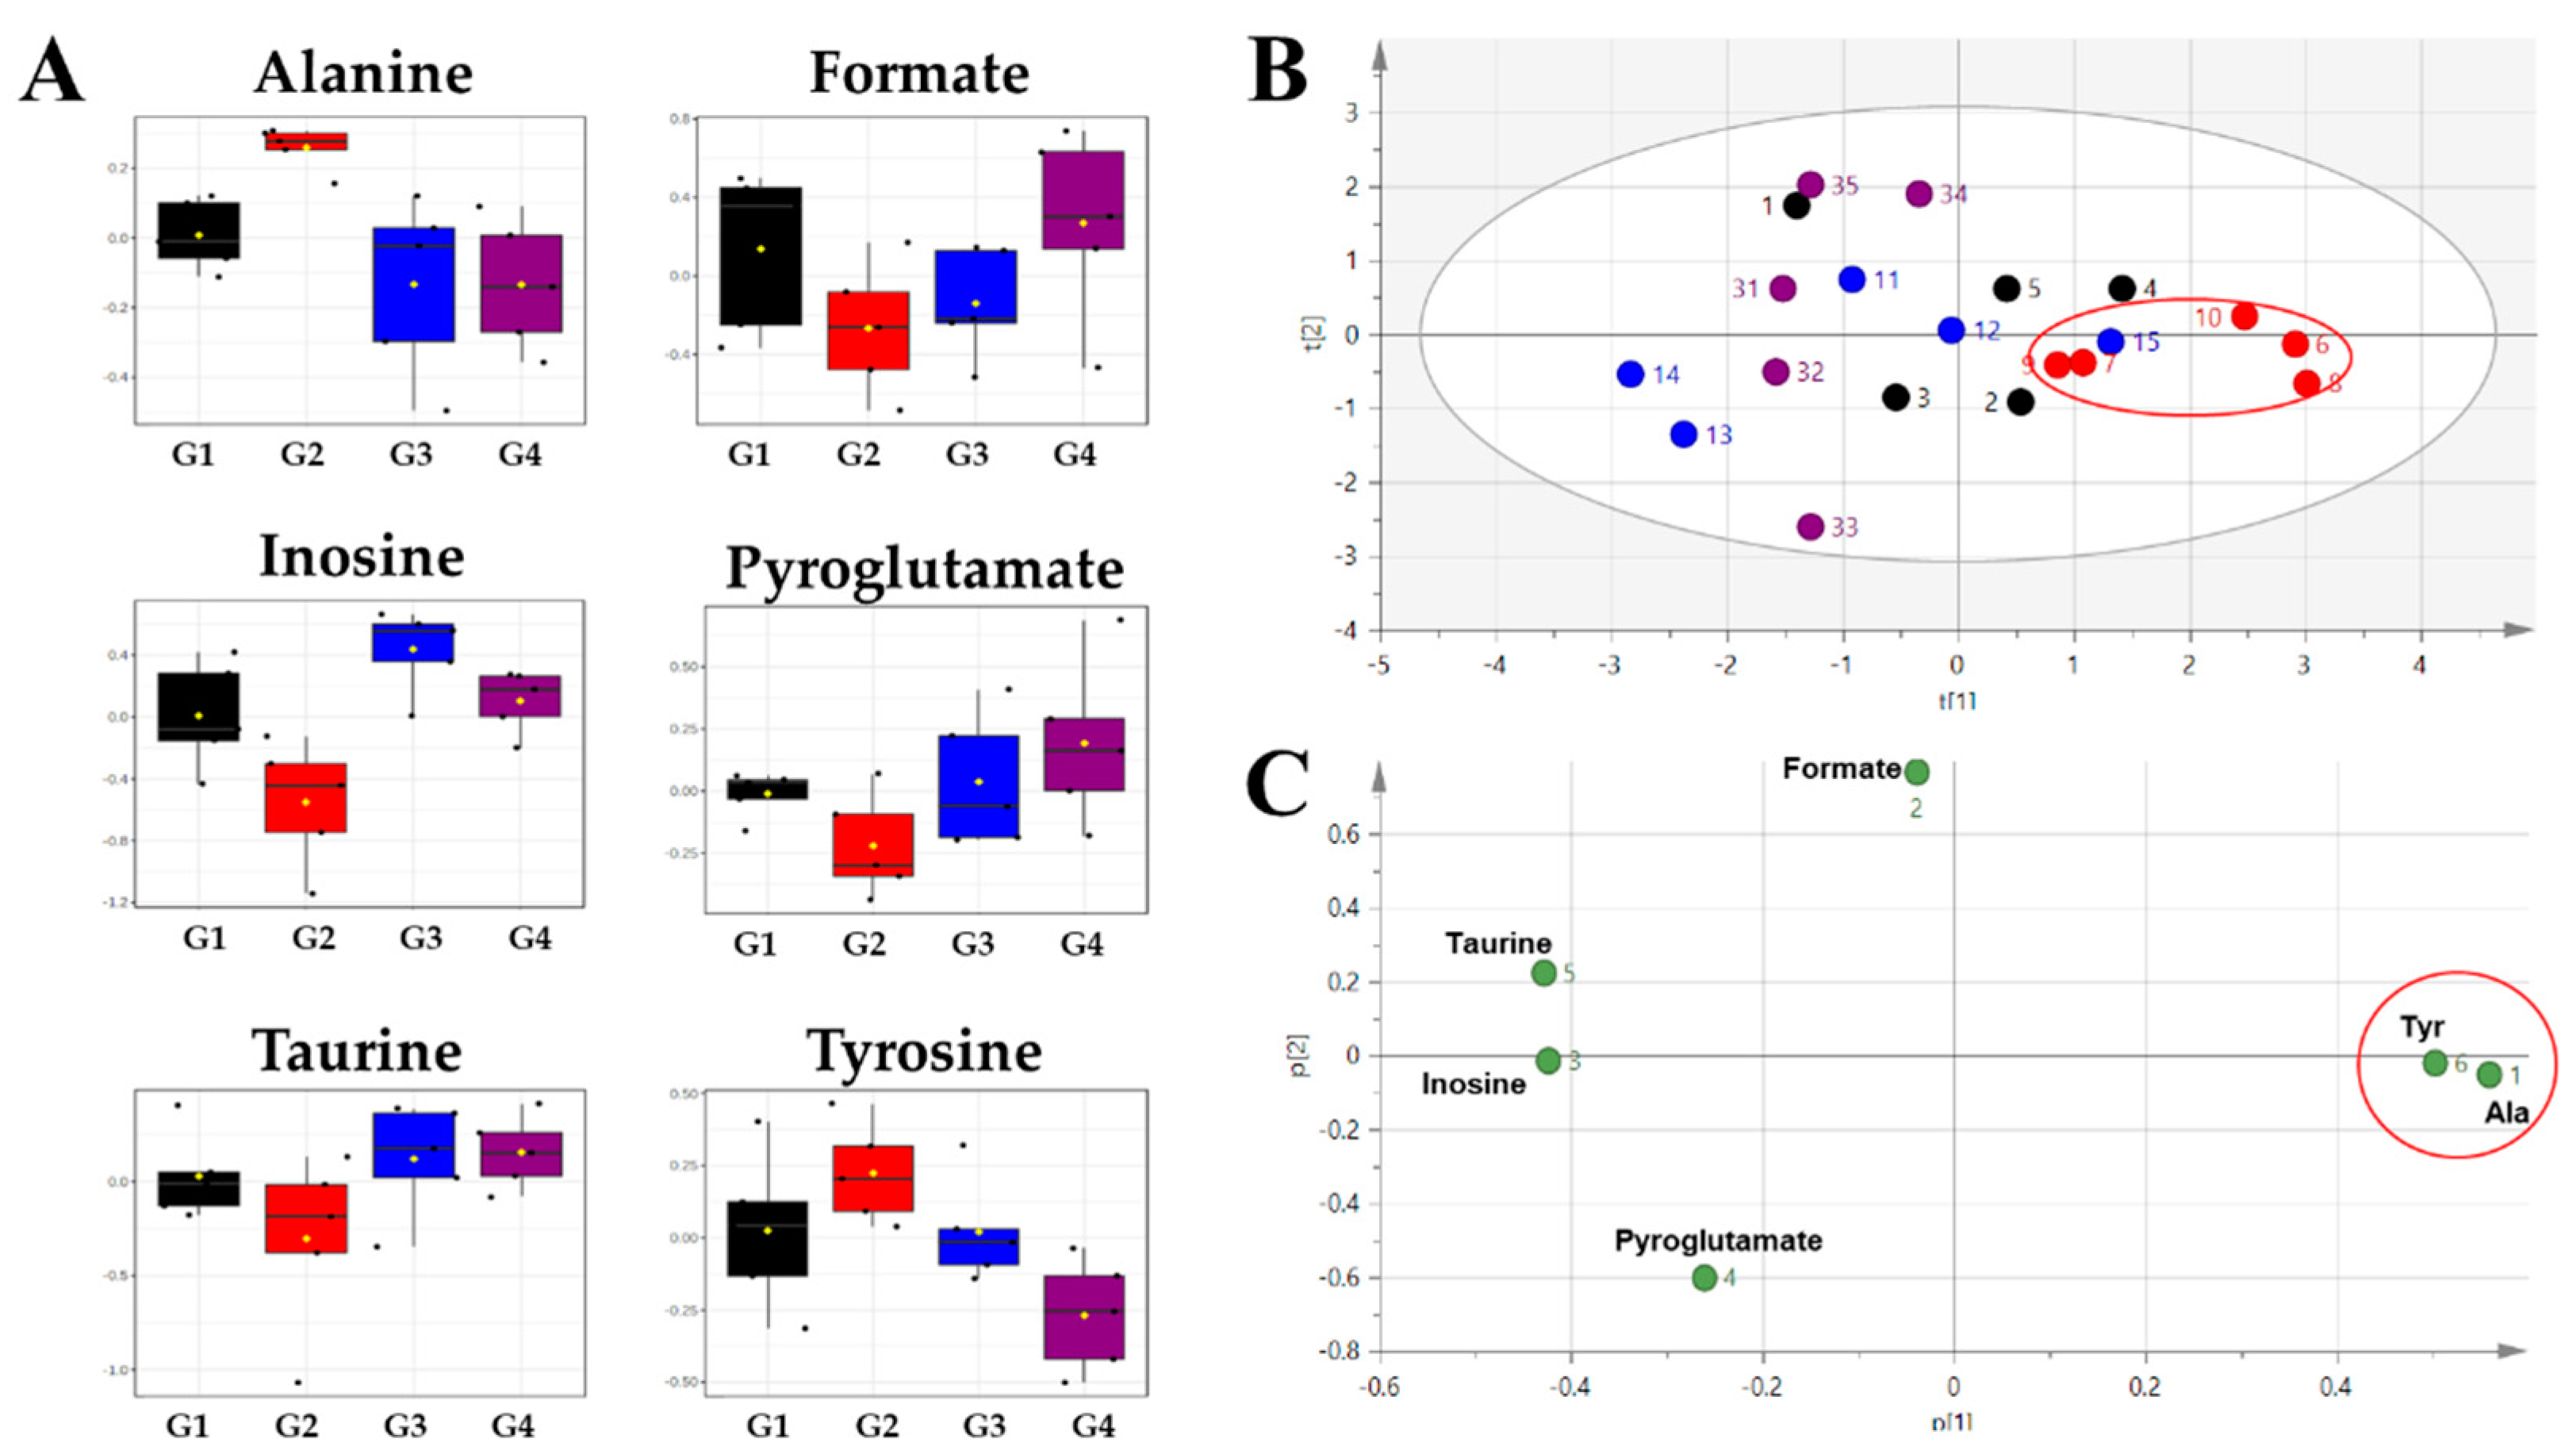
| Alanine | 1.00 | 0.0014 | −0.18989 | 1.00 | 0.0044 | 0.41554 |
| Inosine | 0.88 | 0.0457 | 0.81044 | 0.96 | 0.0137 | −0.80721 |
| Formate | 0.80 | 0.1264 | 0.57076 | 0.84 | 0.0722 | −0.67269 |
| Pyroglutamate | 0.76 | 0.0711 | 0.19067 | 0.88 | 0.0642 | −0.26675 |
| Taurine | 0.76 | 0.1923 | 0.32743 | 0.92 | 0.0689 | −0.36244 |
| Tyrosine | 0.72 | 0.2019 | −0.16551 | 1.00 | 0.0050 | 0.55755 |
Publisher’s Note: MDPI stays neutral with regard to jurisdictional claims in published maps and institutional affiliations. |
© 2021 by the authors. Licensee MDPI, Basel, Switzerland. This article is an open access article distributed under the terms and conditions of the Creative Commons Attribution (CC BY) license (https://creativecommons.org/licenses/by/4.0/).
Share and Cite
Choi, B.-R.; Yoon, D.; Kim, H.-G.; Oh, S.M.; Yoo, Y.C.; Lee, Y.-S.; Kim, K.-W.; Yi, T.-H.; Lee, D.Y. NMR-Based Metabolomics Approach to Investigate the Effects of Fruits of Acanthopanax sessiliflorus in a High-Fat Diet Induced Mouse Model. Metabolites 2021, 11, 505. https://0-doi-org.brum.beds.ac.uk/10.3390/metabo11080505
Choi B-R, Yoon D, Kim H-G, Oh SM, Yoo YC, Lee Y-S, Kim K-W, Yi T-H, Lee DY. NMR-Based Metabolomics Approach to Investigate the Effects of Fruits of Acanthopanax sessiliflorus in a High-Fat Diet Induced Mouse Model. Metabolites. 2021; 11(8):505. https://0-doi-org.brum.beds.ac.uk/10.3390/metabo11080505
Chicago/Turabian StyleChoi, Bo-Ram, Dahye Yoon, Hyoung-Geun Kim, Seon Min Oh, Yung Choon Yoo, Young-Seob Lee, Kwan-Woo Kim, Tae-Hoo Yi, and Dae Young Lee. 2021. "NMR-Based Metabolomics Approach to Investigate the Effects of Fruits of Acanthopanax sessiliflorus in a High-Fat Diet Induced Mouse Model" Metabolites 11, no. 8: 505. https://0-doi-org.brum.beds.ac.uk/10.3390/metabo11080505