Article

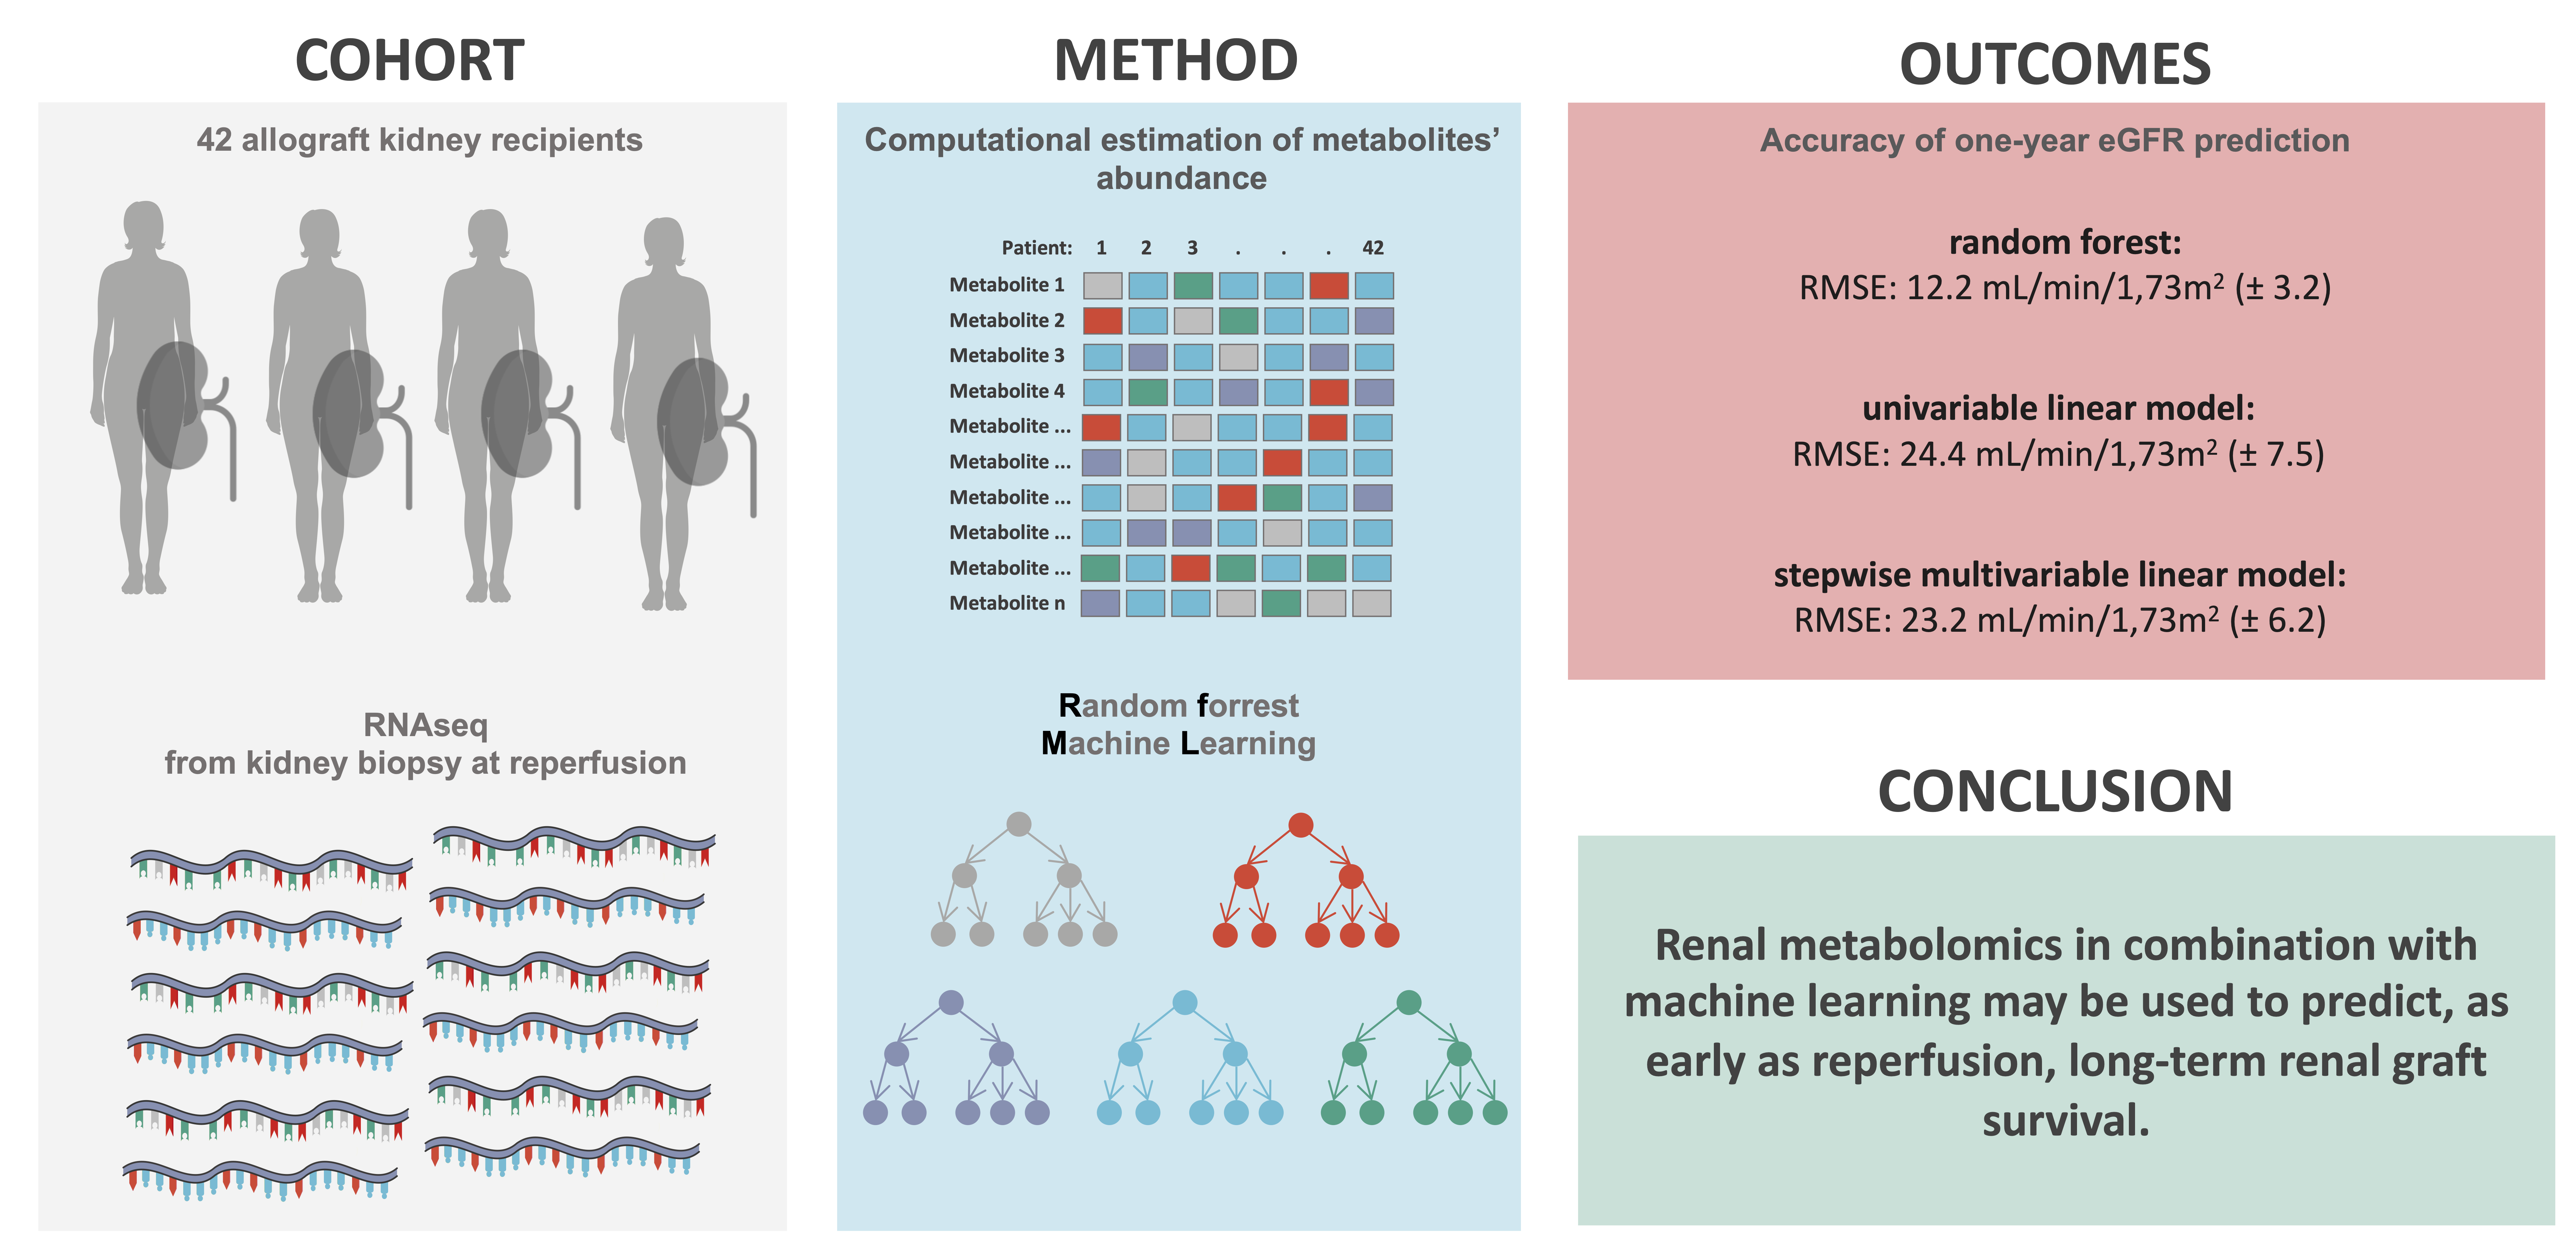
Estimated Renal Metabolomics at Reperfusion Predicts One-Year Kidney Graft Function

1
Laboratory of Nephrology, Department of Medicine, University Hospitals of Geneva, 1205 Geneva, Switzerland
2
Department of Surgery, University Hospital of Geneva, 1205 Geneva, Switzerland
3
Service of Nephrology, University Hospitals of Leuven, 3000 Leuven, Belgium
4
Service of Nephrology, Department of Internal Medicine Specialties, University Hospital of Geneva, 1205 Geneva, Switzerland
5
Geneva School of Economics and Management, University of Geneva, 1205 Geneva, Switzerland
6
Division of Intensive Care, Department of Acute Medicine, University hospital of Geneva, 1205 Geneva, Switzerland
*
Author to whom correspondence should be addressed.
Submission received: 8 December 2021 / Revised: 26 December 2021 / Accepted: 4 January 2022 / Published: 10 January 2022

Abstract

:
Renal transplantation is the gold-standard procedure for end-stage renal disease patients, improving quality of life and life expectancy. Despite continuous advancement in the management of post-transplant complications, progress is still needed to increase the graft lifespan. Early identification of patients at risk of rapid graft failure is critical to optimize their management and slow the progression of the disease. In 42 kidney grafts undergoing protocol biopsies at reperfusion, we estimated the renal metabolome from RNAseq data. The estimated metabolites’ abundance was further used to predict the renal function within the first year of transplantation through a random forest machine learning algorithm. Using repeated K-fold cross-validation we first built and then tuned our model on a training dataset. The optimal model accurately predicted the one-year eGFR, with an out-of-bag root mean square root error (RMSE) that was 11.8 ± 7.2 mL/min/1.73 m2. The performance was similar in the test dataset, with a RMSE of 12.2 ± 3.2 mL/min/1.73 m2. This model outperformed classic statistical models. Reperfusion renal metabolome may be used to predict renal function one year after allograft kidney recipients.

Graphical Abstract

1. Introduction

Chronic kidney disease (CKD) is defined as an alteration in renal structure or function during a period of at least 3 months [1]. CKD is a major global health burden [2], affecting about 10% of the world’s population. Many CKD patients progress to end-stage renal disease (ESRD) and 2.4 million people are currently receiving renal replacement therapy (RRT) [3,4], a number that is expected to rise dramatically by 2030 [4]. Renal transplantation remains the gold standard treatment for renal replacement therapy in ESRD patients [5,6], improving both quality of life and life expectancy [5,6,7]. However, while long-term renal graft survival has gradually improved during the last decade [7], progress is still needed in order to meet the demand created by increasing numbers of waitlisted patients [8]. Therefore, early identification of patients at risk of poor renal graft survival is critical in optimizing their management [9]. Renal function within the first year of transplantation has been proven to be strongly associated with long-term graft survival [10,11] and thus may be an ideal predictor of graft survival.
Kidneys are the organs with the second-highest metabolic rate [12], and several studies have recently highlighted the critical role played by renal metabolism in both acute kidney injury (AKI) and CKD [13,14,15,16,17,18]. Metabolomics, the comprehensive study of metabolites, is increasingly becoming a powerful tool in understanding renal pathophysiology and in the identification of new biomarkers [19]. In the field of renal transplantation, metabolomics studies have reported interesting results; however, they are mostly limited to short time points from transplantation [20,21,22,23,24,25], mostly focusing on delayed graft function, while later outcomes remain to be explored.
Furthermore, collecting and analyzing metabolomics data in large cohorts is challenging. Machine Learning (ML) algorithms adopt a data-driven approach and are able to learn optimal solutions for the analysis of new data. Among the available algorithms, random forest (RF) has been widely used in the field of renal metabolomics [26,27,28,29]. This technique generates a multitude of decision trees that have different experiences of the problem. Once all the decision trees have been trained, RF makes its predictions by voting on all of its decision trees.
In this study, we took advantage of a recently developed method which is able to estimate metabolome abundance from RNAseq data [30]. This technique was applied on transcriptomes of kidney biopsies sampled at reperfusion. The estimated metabolites’ abundance was further used to predict the one-year allograft renal function via an RF machine learning algorithm.

2. Results

2.1. Description of the Cohort

Forty-two kidney allograft recipients, in which a renal biopsy was performed at reperfusion, were included. Bulk RNA-sequencing technology was then applied on those samples and the patients were followed-up on for one year [31]. Patients’ characteristics, split by the median of the one-year eGFR (51 mL/min/1.73 m2), are shown in Table 1. Patients with the highest one-year eGFR received a renal graft from a younger donor (39 versus 56 years) with a lower body mass index (24 versus 27 kg/m2). Other recorded characteristics did not significantly differ among groups.
Using the renal transcriptomics data as an input, we used single-cell Flux Estimation Analysis (scFEA) to estimate the metabolites’ abundance within the renal graft at reperfusion [30]. An outline of the study design is displayed in Figure 1a. The resulting matrix was analyzed through multidimensional scaling and did not cluster patients according to their one-year eGFR (Figure 1b). For each estimated compound, we fitted a robust linear regression using the one-year eGFR as the dependent variable. The signed logarithm of the ß coefficient extracted from every model is plotted against its associated p-value in Figure 1c. A total of 26 estimated metabolites were significantly associated with one-year eGFR in a linear fashion, 16 positively and 10 negatively.
Altogether, we were able to build a comprehensive map displaying whether or not each metabolite or reaction flux, which was estimated at reperfusion, was associated with one-year eGFR (Figure 2, Supplementary Figure S1a,b).

2.2. Machine Learning on Estimated Metabolomic Predicts One-Year eGFR

Using the estimation of the metabolite’s abundance, we predicted the one-year eGFR. However, the input data presented many challenges. Firstly, analyses of the estimated metabolites’ distribution revealed the presence of outliers (Supplementary Figure S2a). Secondly, some of the estimated compounds displayed a nonlinear association with the one-year eGFR (Supplementary Figure S2b). Thirdly, some estimated metabolites were highly correlated with the 1-year eGFR, 14 of them having a Pearson coefficient above 0.8 (Supplementary Figure S2c). Lastly, the number of predictors (70) exceeded the number of patients (42), and the outcome measure displayed a skewed distribution (Supplementary Figure S2a).
To handle this data, we chose to perform an RF machine learning algorithm and followed a classic pipeline of analyses [32,33].
We first randomly split the whole dataset in a training and a test partition, using a 0.8:0.2 ratio. The distribution of one-year eGFR among the two sets of data is shown in Supplementary Figure S2d and Table 2.
We then trained an RF on the training dataset using a repeated K-fold cross-validation resampling method. A hyperparameter grid was used to tune the model, whose performance was iteratively assessed by the Root Mean Square Error (RMSE). The optimal model that minimizes the RMSE presented the following hyperparameters: 56 for mtry (the number of predictors randomly samples as candidate at each node split), 25 for ntree (the number of trees to grow) and 8 for the nodesize (the minimum size of terminal node) (Supplementary Figure S3a).
By applying this model on the whole dataset, we were able to build a proximity matrix. Using Multidimensional Scaling (MDS), we could two-dimensionally represent the distances between samples. The dots were found to be ordered according to the one-year eGFR (Figure 3a).
In the training dataset, the out-of-bag RMSE was 11.8 ± 7.2 mL/min/1.73 m2, similar to that obtained in the test dataset, which was 12.2 ± 3.2 mL/min/1.73 m2 (Table 3). Figure 3b,c shows the observed one-year eGFR and the residuals, respectively, plotted against the predicted one-year eGFR for both the training and test cohorts.
Lastly, we extracted the importance of every estimated metabolite for the one-year eGFR prediction from the optimal RF model. The output is shown in Figure 3d. We further colored the bars according to its positive or negative marginal effect on outcome, depending on the partial dependance plot (Supplementary Figure S3b).
RF was able to capture nonlinear association between metabolites and one-year eGFR (Figure 3e and Supplementary Figure S3b).

2.3. ML Approach Outperforms Classic Statisical Method

We thus aimed at comparing the performance of the ML model trained on the estimated metabolome to a more classic approach, both in terms of the modeling technique and the set of predictors. To do this, we performed linear regression using the available biological and clinical variables as predictors, instead of estimated metabolites’ abundance.
As 1-week serum creatinine (SCr) is associated with long-term renal function [10,34], we started with a simple model using only 1-week SCr to predict one-year eGFR. This model displayed an RMSE of 13.3 ± 8.1 mL/min/1.73 m2 in the training dataset that dramatically increased in the training dataset (RMSE equal to 24.4 ± 7.5 mL/min/1.73 m2, Table 3), suggesting overfitting (Figure 4a,b).
As a second model, we adopted a more sophisticated technique. As missing data were present for three variables (donor serum creatinine, donor age and warm ischemia time), we first put in data using bagged tree imputation [35]. The distribution of those variables, before and after the imputation, is reported in Supplementary Figure S4. We thus filtered potential predictors by the significance levels of the univariable association with one-year eGFR (cutoff threshold set to 0.3) and took advantage of repeated K-fold cross-validation to find the optimal predictors’ combination, using stepwise selection. We trained the model by fixing the number of final predictors from 1 to the total number of available variables. The optimal model included 5 predictors, with their ß coefficients reported in Figure 4e. The RMSE was 12.7 ± 7.0 mL/min/1.73 m2 and 23.2 ± 6.2 mL/min/1.73 m2 in the training and test datasets, respectively (Figure 4d,e and Table 3).

3. Discussion

In this study, we applied scFEA software to estimate reaction fluxes and abundance of metabolites in renal grafts, sampled at the time of transplant reperfusion. Those data were further used to (1) draw a comprehensive map of the association between estimated renal metabolism at reperfusion and one-year eGFR, and (2) to predict the renal graft function at one year. This outcome was selected as the renal graft function one year after transplantation has been largely identified as a major factor associated with graft survival [34,35,36,37,38,39,40,41]. Using multivariable analyses, two studies have also shown that estimated one-year GFR was the best predictor of long-term renal graft survival [10,11]. The one-year eGFR was part of a tool designed to predict the risk of graft loss within the first five years of transplant [42]. Finally, the eGFR at one year post kidney transplantation has been widely used in clinical trials as a surrogate endpoint for long-term renal graft outcomes [43].
We observed a positive association between the one-year eGFR and the estimated flux from glucose to glucose-6-phosphate (G6P), the first step of glycolysis. Glucose metabolism is modified during AKI [13,17], and glycolysis enhancement has been described as protective in AKI [44,45,46,47]. In this situation, glycolysis may ensure energy production, even at low levels, to provide the amounts of ATP necessary to maintain cell viability at the acute phase of the injury and to initiate the repair [12,47,48]. On the contrary, the estimated synthesis of glycogen from glucose-1-phosphate (G1P) was decreased in patients exhibiting a worse outcome. This is in line with recent studies reporting a deleterious effect of renal glycogen accumulation during glycogen storage disease type 1 [49,50]. Among metabolites associated with one-year eGFR, three (i.e., succinyl-CoA, succinate and fumarate) are part of the Tricarboxylic Acid (TCA) cycle. Numerous studies have shown that the mitochondria and TCA cycles are dysregulated at the renal level during AKI and CKD [16,17,50,51,52]. We noticed that the estimated succinate levels were linked to a worse outcome, while the opposite was observed for fumarate. In CKD patients, similar findings have been reported, where succinate and fumarate levels were negatively and positively associated with the eGFR, respectively [53]. In addition, we found the abundance of several amino acids (i.e., phenylalanine, leucine, glycine, proline, arginine) to be significantly linked to one-year eGFR, in accordance with reports from other groups in CKD patients and in animal models of CKD [54,55,56,57,58]. Lastly, spermine abundance was associated with a better outcome. This is in line with the improvement in renal outcome after AKI by spermidine supplementation [59] or the inhibition of catabolism by spermidine/spermine N1 acetyltransferase [60]. However, when considering CKD, both spermine and spermidine serum levels were increased in animals [61].
The analysis of metabolic data presents significant challenges, in particular due to the large amount of generated material, which includes many collinear variables and non-linear associations with phenotypic traits as well as the typically low number of samples [62]. In this context, a data-driven approach via a machine learning algorithm has gained prominence in recent years [63]. Among the available methods, RF is reported as an excellent regressor, with several advantages, including fast-speed, noise insensitivity and overfitting robustness [64]. RF combines two ML methods: bagging and random feature selection. Briefly, RF builds an ensemble of independent decision trees from multiple samplings of the original dataset. At each node of the tree, only one random selection of the available predictors is considered for the partition of the node, thus reducing the trees’ similarity grown from different samples. Once a sufficiently large forest of trees has been grown, the results are bagged in the usual way [65,66,67]. An RF algorithm also has the ability to measure the importance of each predictor, i.e., how it contributes to the prediction performance [29]. In our work, the optimal RF model was chosen to minimize the RMSE, in order to penalize large errors. However, it is interesting to note that the optimal model did not differ when using the R-squared or the mean absolute error metrics. We found the ML approach to largely outperform classic statistical approaches, which were characterized by a high degree of overfitting. Thus, our RF model displayed an R-squared of 0.6 and 0.5 in the training and test cohorts, respectively, meaning that 60 and 50% of the one-year eGFR variability is explained by the model. Interestingly, some metabolites that did not show any significant association with one-year eGFR displayed a high importance in the RF model that well captured their non-linear association with the outcome.
Our study has three main limitations. Firstly, the metabolites’ abundance has been estimated and not measured. Therefore, we cannot claim to obtain similar results using measured metabolomics profiles. However, in their original manuscript, the authors of the scFEA algorithm validated its prediction with several matched metabolomics data [30]. They also successfully applied their software in another study [68]. Secondly, we did not validate our prediction model on an external cohort. However, we trained our model using cross-validation and further assessed its performance in a test dataset not used during the model building. Thirdly, our sample size was limited, although the similar low RMSE calculated in both training and test datasets suggests good calibration without under or overfitting.
This work paves the way for further studies to develop clinical applications using, for example, urinary metabolites, which have been found to reflect the renal metabolite composition [69]. Ultimately this technique could be part of clinical trials, allowing for more research into the early and individualized management of renal graft recipients to extend transplant survival.
Our study is a proof of concept. Renal metabolomics may be used to predict, at a very early point in time, long-term renal graft survival. This approach, in combination with ML algorithms, seems much more accurate than the classic mixed clinical and biological approach.

4. Materials and Methods

4.1. Inclusion of Patients

Using a biobank of kidney transplant biopsies, we included allograft kidney recipients from the University Hospitals of Leuven according to the following criteria: (1) signed informed consent for Biobank Kidney Transplantation, (2) single kidney transplantation, (3) at least one year of follow-up, (4) availability of all material and (5) kidney transplantation performed between March 2012 and May 2015. Forty-two patients were included as previously described [31]. For each patient, the eGFR within the first year of transplantation was calculated with the CKD-EPI formula [70]. The study was conducted according to the guidelines of the Declaration of Helsinki, and approved by the Ethical Review Board of the University Hospitals of Leuven (S53364 and S59572).

4.2. Estimation of Metabolomics

For each included patient, bulk-RNA sequencing technology was applied to kidney reperfusion biopsies as previously described [31]. Raw data are available at GEOi accession GSE126805. We performed normalization by the trimmed mean of M-value method (TMM) using the EdgeR package (RRID: SCR_012802) between samples. The output matrix of normalized counts was log-normalized and used as an input in the single scFEA software [30]. scFEA is a computational method, inferring fluxome from transcriptomics data. The output was composed of two matrices reporting the metabolites’ abundance and the reaction fluxes estimation, respectively, which were further merged into the clinical database.

4.3. Relation between One-Year eGFR and Each Metabolite Abundance Estimation

The relation between one-year eGFR and each metabolite abundance estimation as well as inferred reaction fluxes were fitted using a robust linear model. The ß parameter was estimated with the M-Estimator with Huber’s psi-function. The p-value was calculated through a robust F-Test, and a threshold of 0.05 was needed for significance.
For nonlinear fitting, we used a locally estimated scatterplot smoothing (LOESS) regression.

4.4. Random Forrest Model

We first assessed the pairwise correlation of every estimated metabolite. Fourteen pairs of metabolites exhibited a Pearson coefficient above 0.8. For each pair, we adopted three strategies:
  • We only kept the final product (i.e., AMP, Dolichyl-phosphate-D-mannose, d-UTMP and Succinate).
  • When two metabolites were correlated with a third one, we removed the third to maximize the number of predictors (Arginosuccinate, 3PD and Propanoyl-CoA).
  • In the case of glutathione, glutamate and cysteine, we only kept glutathione, which has been associated with AKI or CKD in the literature [71,72,73].
The data were then randomly split in two sets, to train and test the model, respectively, in a 0.8:0.2 ratio. We used the matrix of metabolites’ estimated abundance, at the exclusion of the previously discarded variables, as a matrix of predictors for the RF model. Model optimization was performed using repeated K-fold cross-validation (5 repetitions of 10 K-fold cross-validations), which has recently been shown to outperform other resampling methods [74]. During this process, the model was tuned to find the optimal hyperparameters:
  • The number of predictors randomly sampled as candidates for each split (mtry), were the square root and the log2 of the number of predictors, and a sequential vector of integer from 1 to the total number of predictors.
  • The minimum sizes of terminal node (nodesize) tried were 2, 4 and 8.
  • The numbers of trees to grow tried were 25, 50, 100, 150, 300, 500, 1000 and 2000.
  • The optimal model was selected to maximize the RMSE.
The optimal model was finally applied to the test dataset, and the RMSE was calculated as a metric of accuracy. To estimate the standard deviation of the RMSE in the test dataset, we bootstrapped the test cohort 1000 times, applying the RF model on every resampling cohort and calculated the standard deviation.

4.5. Statistical Models

For the first model, we fitted the relation between the one-year eGFR (dependent variable) and the one-week serum creatinine (independent variable) with a linear regression, on the training dataset. We also used repeated K-fold cross-validation to assess the out-of-bag accuracy of the model in the training dataset. We further applied this model on the test dataset and calculated the RMSE with its standard deviation, as described in the previous paragraph.
For the second model, we first fitted the relation between the one-year eGFR (dependent variable) and each of the clinical and biological variables available. As three of these presented missing values (donor serum creatinine and age, hot ischemia time), they were imputed using bagged tree imputation, which has been shown to achieve the best imputation quality and improvements on the downstream predictions in a recent benchmark [36]. Variables with an invariable association with a one-year eGFR p-value below 0.3 were preselected. We thus used repeated K-fold cross-validation to find the optimal multivariable model, using a stepwise approach and a maximum number of predictors varying from 1 to the total number of available variables. The best model was selected to maximize the RMSE. This model was further tested on the test data, using the RMSE as the performance measure. The standard deviation of the RMSE metric in the test cohort was calculated as described in the previous paragraph.

4.6. TRIPOD Guidelines

To develop more reproducible approaches in the development of predictive models, a recent scientific initiative has suggested following standard guidelines [75]. For this purpose, the TRIPOD (Transparent reporting of a multivariable prediction model for individual prognosis or diagnosis) statement has been proposed. It consists of a 22-item checklist, which details vital information that must be incorporated into a prediction model study. In this study, we fulfilled these recommendations and have reported supporting information in the Supplementary Table S1.

Supplementary Materials

The following are available online at https://0-www-mdpi-com.brum.beds.ac.uk/article/10.3390/metabo12010057/s1, Figure S1: Relation of the one-year eGFR with the estimation of metabolites abundance and reactions flux, Figure S2: data exploration, Figure S3: Random Forest model selection and Figure S4: Missing value imputation, Supplementary Table S1: TRIPOD guidelines report.

Author Contributions

Conceptualization, D.L.; methodology, D.L. and G.C.; validation, D.L., G.C. and S.d.S.; formal analysis, D.L., G.C., T.V.; data curation, D.L., T.V., A.F., M.N.; writing—original draft preparation, D.L., T.V., A.F., G.C., S.S.; writing—review and editing, D.L., G.C., M.N. and S.d.S.; supervision, D.L. All authors have read and agreed to the published version of the manuscript.

Funding

D.L. is supported by two young researcher grants from the Geneva University Hospitals (PRD 5-2020-I and PRD 4-2021-II) and by a grant from the Ernst and Lucie Schmidheiny Foundation.

Institutional Review Board Statement

The study was conducted according to the guidelines of the Declaration of Helsinki, and approved by the Ethical Review Board of the University Hospitals of Leuven (S53364 and S59572).

Informed Consent Statement

Informed consent was obtained from all subjects involved in the study.

Data Availability Statement

RNAseq data for human kidney biopsies are respectively available at GEO GSE126805.

Conflicts of Interest

The authors declare no conflict of interest.

References

  1. Levey, A.S.; Coresh, J.; Greene, T.; Marsh, J.; Stevens, L.A.; Kusek, J.W.; Van Lente, F. Chronic Kidney Disease Epidemiology Collaboration Expressing the Modification of Diet in Renal Disease Study Equation for Estimating Glomerular Filtration Rate with Standardized Serum Creatinine Values. Clin. Chem. 2007, 53, 766–772. [Google Scholar] [CrossRef] [Green Version]
  2. Bikbov, B.; Purcell, C.A.; Levey, A.S.; Smith, M.; Abdoli, A.; Abebe, M.; Adebayo, O.M.; Afarideh, M.; Agarwal, S.K.; Agudelo-Botero, M.; et al. GBD Chronic Kidney Disease Collaboration Global, Regional, and National Burden of Chronic Kidney Disease, 1990–2017: A Systematic Analysis for the Global Burden of Disease Study 2017. Lancet 2020, 395, 709–733. [Google Scholar] [CrossRef] [Green Version]
  3. Tonelli, M.; Wiebe, N.; Culleton, B.; House, A.; Rabbat, C.; Fok, M.; McAlister, F.; Garg, A.X. Chronic Kidney Disease and Mortality Risk: A Systematic Review. J. Am. Soc. Nephrol. 2006, 17, 2034–2047. [Google Scholar] [CrossRef] [Green Version]
  4. Liyanage, T.; Ninomiya, T.; Jha, V.; Neal, B.; Patrice, H.M.; Okpechi, I.; Zhao, M.; Lv, J.; Garg, A.X.; Knight, J.; et al. Worldwide Access to Treatment for End-Stage Kidney Disease: A Systematic Review. Lancet 2015, 385, 1975–1982. [Google Scholar] [CrossRef]
  5. Abecassis, M.; Bartlett, S.T.; Collins, A.J.; Davis, C.L.; Delmonico, F.L.; Friedewald, J.J.; Hays, R.; Howard, A.; Jones, E.; Leichtman, A.B.; et al. Kidney Transplantation as Primary Therapy for End-Stage Renal Disease: A National Kidney Foundation/Kidney Disease Outcomes Quality Initiative (NKF/KDOQITM) Conference. Clin. J. Am. Soc. Nephrol. 2008, 3, 471–480. [Google Scholar] [CrossRef] [Green Version]
  6. Wolfe, R.A.; Ashby, V.B.; Milford, E.L.; Ojo, A.O.; Ettenger, R.E.; Agodoa, L.Y.; Held, P.J.; Port, F.K. Comparison of Mortality in All Patients on Dialysis, Patients on Dialysis Awaiting Transplantation, and Recipients of a First Cadaveric Transplant. N. Engl. J. Med. 1999, 341, 1725–1730. [Google Scholar] [CrossRef] [Green Version]
  7. Hariharan, S.; Johnson, C.P.; Bresnahan, B.A.; Taranto, S.E.; McIntosh, M.J.; Stablein, D. Improved Graft Survival after Renal Transplantation in the United States, 1988 to 1996. N. Engl. J. Med. 2000, 342, 605–612. [Google Scholar] [CrossRef] [PubMed]
  8. Wang, J.H.; Hart, A. Global Perspective on Kidney Transplantation: United States. Kidney360 2021, 2, 1836–1839. [Google Scholar] [CrossRef]
  9. Kasiske, B.L.; Zeier, M.G.; Chapman, J.R.; Craig, J.C.; Ekberg, H.; Garvey, C.A.; Green, M.D.; Jha, V.; Josephson, M.A.; Kiberd, B.A.; et al. KDIGO Clinical Practice Guideline for the Care of Kidney Transplant Recipients: A Summary. Kidney Int. 2010, 77, 299–311. [Google Scholar] [CrossRef] [Green Version]
  10. Hariharan, S.; Mcbride, M.A.; Cherikh, W.S.; Tolleris, C.B.; Bresnahan, B.A.; Johnson, C.P. Post-Transplant Renal Function in the First Year Predicts Long-Term Kidney Transplant Survival. Kidney Int. 2002, 62, 311–318. [Google Scholar] [CrossRef] [PubMed] [Green Version]
  11. Salvadori, M.; Rosati, A.; Bock, A.; Chapman, J.; Dussol, B.; Fritsche, L.; Kliem, V.; Lebranchu, Y.; Oppenheimer, F.; Pohanka, E.; et al. Estimated One-Year Glomerular Filtration Rate Is the Best Predictor of Long-Term Graft Function Following Renal Transplant. Transplantation 2006, 81, 202–206. [Google Scholar] [CrossRef]
  12. Faivre, A.; Verissimo, T.; Auwerx, H.; Legouis, D.; de Seigneux, S. Tubular Cell Glucose Metabolism Shift during Acute and Chronic Injuries. Front. Med. 2021, 8, 742072. [Google Scholar] [CrossRef]
  13. Legouis, D.; Ricksten, S.-E.; Faivre, A.; Verissimo, T.; Gariani, K.; Verney, C.; Galichon, P.; Berchtold, L.; Feraille, E.; Fernandez, M.; et al. Altered Proximal Tubular Cell Glucose Metabolism during Acute Kidney Injury Is Associated with Mortality. Nat. Metab. 2020, 2, 732–743. [Google Scholar] [CrossRef]
  14. Tran, M.T.; Zsengeller, Z.K.; Berg, A.H.; Khankin, E.V.; Bhasin, M.K.; Kim, W.; Clish, C.B.; Stillman, I.E.; Karumanchi, S.A.; Rhee, E.P.; et al. PGC1α Drives NAD Biosynthesis Linking Oxidative Metabolism to Renal Protection. Nature 2016, 531, 528–532. [Google Scholar] [CrossRef] [Green Version]
  15. Tran, M.; Tam, D.; Bardia, A.; Bhasin, M.; Rowe, G.C.; Kher, A.; Zsengeller, Z.K.; Akhavan-Sharif, M.R.; Khankin, E.V.; Saintgeniez, M.; et al. PGC-1α Promotes Recovery after Acute Kidney Injury during Systemic Inflammation in Mice. J. Clin. Investig. 2011, 121, 4003–4014. [Google Scholar] [CrossRef] [PubMed] [Green Version]
  16. Katsyuba, E.; Mottis, A.; Zietak, M.; De Franco, F.; van der Velpen, V.; Gariani, K.; Ryu, D.; Cialabrini, L.; Matilainen, O.; Liscio, P.; et al. De Novo NAD+ Synthesis Enhances Mitochondrial Function and Improves Health. Nature 2018, 563, 354–359. [Google Scholar] [CrossRef] [PubMed]
  17. Faivre, A.; Katsyuba, E.; Verissimo, T.; Lindenmeyer, M.; Rajaram, R.D.; Naesens, M.; Heckenmeyer, C.; Mottis, A.; Feraille, E.; Cippà, P.; et al. Differential Role of Nicotinamide Adenine Dinucleotide Deficiency in Acute and Chronic Kidney Disease. Nephrol. Dial. Transplant. 2021, 36, 60–68. [Google Scholar] [CrossRef]
  18. Kang, H.M.; Ahn, S.H.; Choi, P.; Ko, Y.-A.; Han, S.H.; Chinga, F.; Park, A.S.D.; Tao, J.; Sharma, K.; Pullman, J.; et al. Defective Fatty Acid Oxidation in Renal Tubular Epithelial Cells Plays a Key Role in Kidney Fibrosis Development. Nat. Med. 2015, 21, 37–46. [Google Scholar] [CrossRef] [PubMed]
  19. Grams, M.E.; Shafi, T.; Rhee, E.P. Metabolomics Research in Chronic Kidney Disease. JASN 2018, 29, 1588–1590. [Google Scholar] [CrossRef] [Green Version]
  20. Wijermars, L.G.M.; Schaapherder, A.F.; de Vries, D.K.; Verschuren, L.; Wüst, R.C.I.; Kostidis, S.; Mayboroda, O.A.; Prins, F.; Ringers, J.; Bierau, J.; et al. Defective Postreperfusion Metabolic Recovery Directly Associates with Incident Delayed Graft Function. Kidney Int. 2016, 90, 181–191. [Google Scholar] [CrossRef]
  21. Stenlund, H.; Madsen, R.; Vivi, A.; Calderisi, M.; Lundstedt, T.; Tassini, M.; Carmellini, M.; Trygg, J. Monitoring Kidney-Transplant Patients Using Metabolomics and Dynamic Modeling. Chemom. Intell. Lab. Syst. 2009, 98, 45–50. [Google Scholar] [CrossRef]
  22. Suhre, K.; Schwartz, J.E.; Sharma, V.K.; Chen, Q.; Lee, J.R.; Muthukumar, T.; Dadhania, D.M.; Ding, R.; Ikle, D.N.; Bridges, N.D.; et al. Urine Metabolite Profiles Predictive of Human Kidney Allograft Status. J. Am. Soc. Nephrol. 2016, 27, 626–636. [Google Scholar] [CrossRef] [PubMed] [Green Version]
  23. Goek, O.-N.; Döring, A.; Gieger, C.; Heier, M.; Koenig, W.; Prehn, C.; Römisch-Margl, W.; Wang-Sattler, R.; Illig, T.; Suhre, K.; et al. Serum Metabolite Concentrations and Decreased GFR in the General Population. Am. J. Kidney Dis. 2012, 60, 197–206. [Google Scholar] [CrossRef]
  24. Yu, B.; Zheng, Y.; Nettleton, J.A.; Alexander, D.; Coresh, J.; Boerwinkle, E. Serum Metabolomic Profiling and Incident CKD among African Americans. Clin. J. Am. Soc. Nephrol. 2014, 9, 1410–1417. [Google Scholar] [CrossRef] [PubMed] [Green Version]
  25. Calderisi, M.; Vivi, A.; Mlynarz, P.; Tassin, M.; Banasik, M.; Dawiskiba, T.; Carmellini, M. Using Metabolomics to Monitor Kidney Transplantation Patients by Means of Clustering to Spot Anomalous Patient Behavior. Transplant. Proc. 2013, 45, 1511–1515. [Google Scholar] [CrossRef]
  26. Bajaj, J.S.; Garcia-Tsao, G.; Reddy, K.R.; O’Leary, J.G.; Vargas, H.E.; Lai, J.C.; Kamath, P.S.; Tandon, P.; Subramanian, R.M.; Thuluvath, P.; et al. Admission Urinary and Serum Metabolites Predict Renal Outcomes in Hospitalized Patients with Cirrhosis. Hepatology 2021, 74, 2699–2713. [Google Scholar] [CrossRef]
  27. Huang, J.; Huth, C.; Covic, M.; Troll, M.; Adam, J.; Zukunft, S.; Prehn, C.; Wang, L.; Nano, J.; Scheerer, M.F.; et al. Machine Learning Approaches Reveal Metabolic Signatures of Incident Chronic Kidney Disease in Individuals with Prediabetes and Type 2 Diabetes. Diabetes 2020, 69, 2756–2765. [Google Scholar] [CrossRef]
  28. Chen, D.-Q.; Cao, G.; Chen, H.; Argyopoulos, C.P.; Yu, H.; Su, W.; Chen, L.; Samuels, D.C.; Zhuang, S.; Bayliss, G.P.; et al. Identification of Serum Metabolites Associating with Chronic Kidney Disease Progression and Anti-Fibrotic Effect of 5-Methoxytryptophan. Nat. Commun. 2019, 10, 1476. [Google Scholar] [CrossRef] [PubMed]
  29. Zhao, L.-L.; Qiu, X.-J.; Wang, W.-B.; Li, R.-M.; Wang, D.-S. NMR Metabolomics and Random Forests Models to Identify Potential Plasma Biomarkers of Blood Stasis Syndrome with Coronary Heart Disease Patients. Front. Physiol. 2019, 10, 1109. [Google Scholar] [CrossRef] [PubMed]
  30. Alghamdi, N.; Chang, W.; Dang, P.; Lu, X.; Wan, C.; Gampala, S.; Huang, Z.; Wang, J.; Ma, Q.; Zang, Y.; et al. A Graph Neural Network Model to Estimate Cell-Wise Metabolic Flux Using Single-Cell RNA-Seq Data. Genome Res. 2021, 31, 1867–1884. [Google Scholar] [CrossRef]
  31. Cippà, P.E.; Sun, B.; Liu, J.; Chen, L.; Naesens, M.; McMahon, A.P. Transcriptional Trajectories of Human Kidney Injury Progression. JCI Insight 2018, 3, e123151. [Google Scholar] [CrossRef] [PubMed] [Green Version]
  32. Kuhn, M. Building Predictive Models in R Using the Caret Package. J. Stat. Softw. 2008, 28, 1–26. [Google Scholar] [CrossRef] [Green Version]
  33. Kuhn, M. The Caret Package. Available online: https://citeseerx.ist.psu.edu/viewdoc/download?doi=10.1.1.150.2466&rep=rep1&type=pdf (accessed on 8 December 2021).
  34. Dash, J.; Verissimo, T.; Faivre, A.; Berchtold, L.; Berney, T.; Pugin, J.; de Seigneux, S.; Legouis, D. Kinetic GFR Outperforms CKD-EPI for Slow Graft Function Prediction in the Immediate Postoperative Period Following Kidney Transplantation. J. Clin. Med. 2020, 9, 4003. [Google Scholar] [CrossRef]
  35. Jäger, S.; Allhorn, A.; Bießmann, F. A Benchmark for Data Imputation Methods. Front. Big Data 2021, 4, 48. [Google Scholar] [CrossRef]
  36. Nicol, D.; MacDonald, A.S.; Lawen, J.; Belitsky, P. Early Prediction of Renal Allograft Loss beyond One Year. Transpl. Int. 1993, 6, 153–157. [Google Scholar] [CrossRef]
  37. Kasiske, B.L.; Israni, A.K.; Snyder, J.J.; Skeans, M.A. Patient Outcomes in Renal Transplantation (PORT) Investigators The Relationship between Kidney Function and Long-Term Graft Survival after Kidney Transplant. Am. J. Kidney Dis. 2011, 57, 466–475. [Google Scholar] [CrossRef]
  38. Giral, M.; Taddei, C.; Nguyen, J.M.; Dantal, J.; Hourmant, M.; Cantarovich, D.; Blancho, G.; Ancelet, D.; Soulillou, J.P. Single-Center Analysis of 468 First Cadaveric Kidney Allografts with a Uniform ATG-CsA Sequential Therapy. Clin. Transpl. 1996, 257–264. Available online: https://pubmed.ncbi.nlm.nih.gov/9286575/ (accessed on 8 December 2021).
  39. Salvadori, M.; Rosati, A.; Bock, A.; Chapman, J.; Dussol, B.; Fritsche, L.; Jeffery, J.; Kliem, V.; Lebranchu, Y.; Oppenheimer, F.; et al. One-Year Posttransplant Renal Function Is a Strong Predictor of Long-Term Kidney Function: Results from the Neoral-MOST Observational Study. Transplant. Proc. 2003, 35, 2863–2867. [Google Scholar] [CrossRef]
  40. Humar, A.; Kerr, S.; Gillingham, K.J.; Matas, A.J. Features of Acute Rejection That Increase Risk for Chronic Rejection. Transplantation 1999, 68, 1200–1203. [Google Scholar] [CrossRef]
  41. Lenihan, C.R.; OLKelly, P.; Mohan, P. Correction to: Lenihan, et al., MDRD-Estimated GFR at One Year Post-Renal Transplant Is a Predictor of Long-Term Graft Function. Ren. Fail. 2018, 40, 119. [Google Scholar] [CrossRef]
  42. Resende, L.; Guerra, J.; Santana, A.; Mil-Homens, C.; Abreu, F.; da Costa, A.G. First Year Renal Function as a Predictor of Kidney Allograft Outcome. Transplant. Proc. 2009, 41, 846–848. [Google Scholar] [CrossRef]
  43. Kasiske, B.L.; Israni, A.K.; Snyder, J.J.; Skeans, M.A.; Peng, Y.; Weinhandl, E.D. A Simple Tool to Predict Outcomes after Kidney Transplant. Am. J. Kidney Dis. 2010, 56, 947–960. [Google Scholar] [CrossRef]
  44. Ibrahim, A.; Garg, A.X.; Knoll, G.A.; Akbari, A.; White, C.A. Kidney Function Endpoints in Kidney Transplant Trials: A Struggle for Power. Am. J. Transplant. 2013, 13, 707–713. [Google Scholar] [CrossRef] [PubMed]
  45. Schley, G.; Klanke, B.; Schödel, J.; Forstreuter, F.; Shukla, D.; Kurtz, A.; Amann, K.; Wiesener, M.S.; Rosen, S.; Eckardt, K.-U.; et al. Hypoxia-Inducible Transcription Factors Stabilization in the Thick Ascending Limb Protects against Ischemic Acute Kidney Injury. J. Am. Soc. Nephrol. 2011, 22, 2004–2015. [Google Scholar] [CrossRef] [PubMed] [Green Version]
  46. Wang, J.; Biju, M.P.; Wang, M.-H.; Haase, V.H.; Dong, Z. Cytoprotective Effects of Hypoxia against Cisplatin-Induced Tubular Cell Apoptosis: Involvement of Mitochondrial Inhibition and P53 Suppression. JASN 2006, 17, 1875–1885. [Google Scholar] [CrossRef] [Green Version]
  47. Shu, S.; Wang, Y.; Zheng, M.; Liu, Z.; Cai, J.; Tang, C.; Dong, Z. Hypoxia and Hypoxia-Inducible Factors in Kidney Injury and Repair. Cells 2019, 8, 207. [Google Scholar] [CrossRef] [Green Version]
  48. Kim, J.; Devalaraja-Narashimha, K.; Padanilam, B.J. TIGAR Regulates Glycolysis in Ischemic Kidney Proximal Tubules. Am. J. Physiol. Ren. Physiol. 2015, 308, F298–F308. [Google Scholar] [CrossRef] [Green Version]
  49. Chen, Y.-T.; Coleman, R.A.; Scheinman, J.I.; Kolbeck, P.C.; Sidbury, J.B. Renal Disease in Type I Glycogen Storage Disease. N. Engl. J. Med. 1988, 318, 7–11. [Google Scholar] [CrossRef]
  50. Gjorgjieva, M.; Raffin, M.; Duchampt, A.; Perry, A.; Stefanutti, A.; Brevet, M.; Tortereau, A.; Dubourg, L.; Hubert-Buron, A.; Mabille, M.; et al. Progressive Development of Renal Cysts in Glycogen Storage Disease Type I. Hum. Mol. Genet. 2016, 25, 3784–3797. [Google Scholar] [CrossRef] [PubMed] [Green Version]
  51. Hallan, S.; Afkarian, M.; Zelnick, L.R.; Kestenbaum, B.; Sharma, S.; Saito, R.; Darshi, M.; Barding, G.; Raftery, D.; Ju, W.; et al. Metabolomics and Gene Expression Analysis Reveal Down-Regulation of the Citric Acid (TCA) Cycle in Non-Diabetic CKD Patients. EBioMedicine 2017, 26, 68–77. [Google Scholar] [CrossRef] [Green Version]
  52. Jiménez-Uribe, A.P.; Hernández-Cruz, E.Y.; Ramírez-Magaña, K.J.; Pedraza-Chaverri, J. Involvement of Tricarboxylic Acid Cycle Metabolites in Kidney Diseases. Biomolecules 2021, 11, 1259. [Google Scholar] [CrossRef]
  53. Toyohara, T.; Akiyama, Y.; Suzuki, T.; Takeuchi, Y.; Mishima, E.; Tanemoto, M.; Momose, A.; Toki, N.; Sato, H.; Nakayama, M.; et al. Metabolomic Profiling of Uremic Solutes in CKD Patients. Hypertens. Res. 2010, 33, 944–952. [Google Scholar] [CrossRef]
  54. Chen, D.-Q.; Cao, G.; Chen, H.; Liu, D.; Su, W.; Yu, X.-Y.; Vaziri, N.D.; Liu, X.-H.; Bai, X.; Zhang, L.; et al. Gene and Protein Expressions and Metabolomics Exhibit Activated Redox Signaling and Wnt/β-Catenin Pathway Are Associated with Metabolite Dysfunction in Patients with Chronic Kidney Disease. Redox Biol. 2017, 12, 505–521. [Google Scholar] [CrossRef] [PubMed]
  55. Wang, Y.-N.; Ma, S.-X.; Chen, Y.-Y.; Chen, L.; Liu, B.-L.; Liu, Q.-Q.; Zhao, Y.-Y. Chronic Kidney Disease: Biomarker Diagnosis to Therapeutic Targets. Clin. Chim. Acta 2019, 499, 54–63. [Google Scholar] [CrossRef] [PubMed]
  56. Zhao, Y.-Y. Metabolomics in Chronic Kidney Disease. Clin. Chim. Acta 2013, 422, 59–69. [Google Scholar] [CrossRef] [PubMed]
  57. Miao, H.; Wu, X.-Q.; Wang, Y.-N.; Chen, D.-Q.; Chen, L.; Vaziri, N.D.; Zhuang, S.; Guo, Y.; Su, W.; Ma, S.-X.; et al. 1-Hydroxypyrene Mediates Renal Fibrosis through Aryl Hydrocarbon Receptor Signalling Pathway. Br. J. Pharmacol. 2022, 179, 103–124. [Google Scholar] [CrossRef] [PubMed]
  58. Miao, H.; Cao, G.; Wu, X.-Q.; Chen, Y.-Y.; Chen, D.-Q.; Chen, L.; Vaziri, N.D.; Feng, Y.-L.; Su, W.; Gao, Y.; et al. Identification of Endogenous 1-Aminopyrene as a Novel Mediator of Progressive Chronic Kidney Disease via Aryl Hydrocarbon Receptor Activation. Br. J. Pharmacol. 2020, 177, 3415–3435. [Google Scholar] [CrossRef]
  59. Kim, J. Spermidine Rescues Proximal Tubular Cells from Oxidative Stress and Necrosis after Ischemic Acute Kidney Injury. Arch. Pharm. Res. 2017, 40, 1197–1208. [Google Scholar] [CrossRef]
  60. Zahedi, K.; Barone, S.; Wang, Y.; Murray-Stewart, T.; Roy-Chaudhury, P.; Smith, R.D.; Casero, R.A.; Soleimani, M. Proximal Tubule Epithelial Cell Specific Ablation of the Spermidine/Spermine N1-Acetyltransferase Gene Reduces the Severity of Renal Ischemia/Reperfusion Injury. PLoS ONE 2014, 9, e110161. [Google Scholar] [CrossRef]
  61. Feng, Y.-L.; Cao, G.; Chen, D.-Q.; Vaziri, N.D.; Chen, L.; Zhang, J.; Wang, M.; Guo, Y.; Zhao, Y.-Y. Microbiome-Metabolomics Reveals Gut Microbiota Associated with Glycine-Conjugated Metabolites and Polyamine Metabolism in Chronic Kidney Disease. Cell. Mol. Life Sci. CMLS 2019, 76, 4961–4978. [Google Scholar] [CrossRef] [Green Version]
  62. Cuperlovic-Culf, M. Machine Learning Methods for Analysis of Metabolic Data and Metabolic Pathway Modeling. Metabolites 2018, 8, 4. [Google Scholar] [CrossRef] [Green Version]
  63. Bravo-Merodio, L.; Williams, J.A.; Gkoutos, G.V.; Acharjee, A. -Omics Biomarker Identification Pipeline for Translational Medicine. J. Transl. Med. 2019, 17, 155. [Google Scholar] [CrossRef] [Green Version]
  64. Amaratunga, D.; Cabrera, J.; Lee, Y.-S. Enriched Random Forests. Bioinformatics 2008, 24, 2010–2014. [Google Scholar] [CrossRef] [Green Version]
  65. Svetnik, V.; Liaw, A.; Tong, C.; Culberson, J.C.; Sheridan, R.P.; Feuston, B.P. Random Forest:  A Classification and Regression Tool for Compound Classification and QSAR Modeling. J. Chem. Inf. Comput. Sci. 2003, 43, 1947–1958. [Google Scholar] [CrossRef]
  66. Breiman, L. Random Forests. Mach. Learn. 2001, 45, 5–32. [Google Scholar] [CrossRef] [Green Version]
  67. Altman, N.; Krzywinski, M. Ensemble Methods: Bagging and Random Forests. Nat. Methods 2017, 14, 933–934. [Google Scholar] [CrossRef]
  68. Gampala, S.; Shah, F.; Lu, X.; Moon, H.-R.; Babb, O.; Umesh Ganesh, N.; Sandusky, G.; Hulsey, E.; Armstrong, L.; Mosely, A.L.; et al. Ref-1 Redox Activity Alters Cancer Cell Metabolism in Pancreatic Cancer: Exploiting This Novel Finding as a Potential Target. J. Exp. Clin. Cancer Res. 2021, 40, 251. [Google Scholar] [CrossRef]
  69. Abbiss, H.; Maker, G.L.; Trengove, R.D. Metabolomics Approaches for the Diagnosis and Understanding of Kidney Diseases. Metabolites 2019, 9, 34. [Google Scholar] [CrossRef] [PubMed] [Green Version]
  70. Levey, A.S.; Stevens, L.A.; Schmid, C.H.; Zhang, Y.L.; Castro, A.F.; Feldman, H.I.; Kusek, J.W.; Eggers, P.; Van Lente, F.; Greene, T.; et al. A New Equation to Estimate Glomerular Filtration Rate. Ann. Intern. Med. 2009, 150, 604–612. [Google Scholar] [CrossRef] [PubMed]
  71. Weinberg, J.M. Glutathione and Glycine in Acute Renal Failure. Ren. Fail. 1992, 14, 311–319. [Google Scholar] [CrossRef]
  72. Santangelo, F.; Witko-Sarsat, V.; Drüeke, T.; Descamps-Latscha, B. Restoring Glutathione as a Therapeutic Strategy in Chronic Kidney Disease. Nephrol. Dial. Transplant. 2004, 19, 1951–1955. [Google Scholar] [CrossRef] [PubMed]
  73. Zuo, M.; Tang, J.; Xiang, M.; Long, Q.; Dai, J.; Yu, G.; Zhang, H.; Hu, H. Clinical Observation of the Reduced Glutathione in the Treatment of Diabetic Chronic Kidney Disease. J. Cell. Biochem. 2019, 120, 8483–8491. [Google Scholar] [CrossRef] [PubMed]
  74. Nakatsu, R.T. An Evaluation of Four Resampling Methods Used in Machine Learning Classification. IEEE Intell. Syst. 2021, 36, 51–57. [Google Scholar] [CrossRef]
  75. Collins, G.S.; Reitsma, J.B.; Altman, D.G.; Moons, K.G.M. Transparent Reporting of a Multivariable Prediction Model for Individual Prognosis or Diagnosis (TRIPOD): The TRIPOD Statement. BMC Med. 2015, 13, 214. [Google Scholar] [CrossRef] [Green Version]
Figure 1. Global description of the study: (a) schematic representation of the study design, (b) volcano-plot showing the signed logarithm of the absolute ß coefficient extracting from a robust linear model using one-year eGFR as the dependent variable, and its associated p-value, for each estimated metabolite abundance, and (c) scatter plot showing the multidimensional scaling of the estimated metabolomics, colored by the one-year eGFR.
Metabolites 12 00057 g001
Figure 2. Comprehensive map linking estimation of fluxome and metabolites’ abundance with one-year eGFR. In blue are any positive associations between the metabolites’ estimated abundance or estimated reaction flux with one-year eGFR while in red are negative associations. Non-significant associations are shown in grey.
Metabolites 12 00057 g002
Figure 3. ML-based prediction of the one-year eGFR: (a) Multidimensional reduction plot showing the similarity of samples and colored by one-year eGFR, (b) scatter plot showing the observed (y-axis) predicted (x-axis) one-year eGFR, in the test (red) and training (blue) datasets. The grey line highlights the perfect relation, (c) Scatter plot showing the residuals for each predicted value, in the test (red) and training (blue) datasets. (d) Variable importance in the RF model for one-year eGFR prediction. Values are normalized to the most important variable, which was set to 100, and colored in blue if the variable is associated with a higher one-year eGFR and in red if associated with a lower one-year eGFR and (e) Venn diagram reporting the logical relation between the top 11 variable used in the RF model (blue) and the variables significantly associated with the one-year eGFR identified via robust linear regression (red), after exclusion of correlated variables (i.e., glutamate, cysteine, IMP and GABA).
Metabolites 12 00057 g003
Figure 4. Classic statistical approach for prediction of the one-year eGFR: (a,b) Simple model: scatter plot showing the observed (y-axis) predicted (x-axis) one-year eGFR, in the test (red) and training (blue) datasets (a), scatter plot showing the residuals for each predicted value, in the test (red) and training (blue) datasets (b). (ce) stepwise regression: forest plot showing the ß coefficient ±95% confidence interval of each variable selected in the optimal model (d), scatter plot showing the observed (y-axis) predicted (x-axis) one-year eGFR, in the test (red) and training (blue) datasets and (e) scatter plot showing the residuals for each predicted one-year eGFR, in the test (red) and training (blue) datasets.
Metabolites 12 00057 g004
Table 1. Baseline characteristics, according to the median one-year eGFR.
1-yr eGFR < 51
n = 21
1-yr eGFR > 51
n = 21
Total
n = 42
p-Value
Donor serum creatinine (mg/dL)0.8 (0.3)0.7 (0.2)0.7 (0.2)0.180
Donor sex male9 (42.9%)10 (47.6%)19 (45.2%)1.000
Donor age (years)39.3 (16.6)55.9 (6.7)47.8 (14.9)0.002
Donor type 1.000
Donation after brain death12 (57.1%)13 (61.9%)25 (59.5%)
Deceased cadaveric donor7 (33.3%)6 (28.6%)13 (31.0%)
Living donor2 (9.5%)2 (9.5%)4 (9.5%)
Donor weight (kg)71.5 (13.5)77.0 (13.6)74.2 (13.7)0.175
Donor height (cm)172.9 (8.6)169.8 (8.6)171.3 (8.6)0.367
Donor body mass index (kg/m2)23.9 (4.3)26.7 (4.6)25.3 (4.6)0.002
Donor hypertension1 (4.8%)6 (28.6%)7 (16.7%)0.093
Recipient age (years)50.0 (14.2)54.6 (11.6)52.3 (13.0)0.385
Recipient sex male14 (66.7%)13 (61.9%)27 (64.3%)1.000
Cold ischemia time (hours)11.4 (5.6)12.9 (5.2)12.2 (5.4)0.187
Warm ischemia time (min)49.5 (18.5)47.9 (13.6)48.7 (16.1)0.995
Delayed graft function2 (9.5%)4 (19.0%)6 (14.3%)0.663
Immunosuppression 0.520
TAC-MMF-CS9 (42.9%)6 (28.6%)15 (35.7%)
Induction with Basiliximab12 (57.1%)15 (71.4%)27 (64.3%)
1-week Serum Creatinine (mg/dL)2.8 (3.0)4.0 (3.4)3.4 (3.3)0.110
Table 2. Training and test dataset characteristics, according to the median one-year eGFR.
Cohort Test
n = 8
Cohort Train
n = 34
Total
n = 42
p-Value
Donor serum creatinine (mg/dL)0.8 (0.2)0.7 (0.3)0.7 (0.2)0.352
Donor sex male3 (37.5%)16 (47.1%)19 (45.2%)0.760
Donor age (years)40.7 (18.0)49.4 (14.0)47.8 (14.9)0.227
Donor type 0.491
Donation after brain death6 (75.0%)19 (55.9%)25 (59.5%)
Deceased cadaveric donor1 (12.5%)12 (35.3%)13 (31.0%)
Living donor1 (12.5%)3 (8.8%)4 (9.5%)
Donor weight (kg)71.0 (7.9)75.0 (14.7)74.2 (13.7)0.508
Donor height (cm)169.5 (10.0)171.8 (8.4)171.3 (8.6)0.759
Donor Body Mass Index (kg/m2)24.8 (2.6)25.4 (5.0)25.3 (4.6)0.987
Donor hypertension1 (12.5%)6 (17.6%)7 (16.7%)0.093
Recipient age (years)56.5 (10.7)51.3 (13.5)52.3 (13.0)0.370
Recipient sex male5 (62.5%)22 (64.7%)27 (64.3%)1.000
Cold ischemia time (hours)12.8 (5.6)12.0 (5.4)12.2 (5.4)0.564
Warm ischemia time (min)37.6 (8.5)51.2 (16.4)48.7 (16.1)0.034
Delayed graft function1 (12.5%)5 (14.7%)6 (14.3%)1.000
Immunosuppression 0.425
TAC-MMF-CS4 (50.0%)23 (67.6%)27 (64.3%)
Induction with Basiliximab4 (50.0%)11 (32.4%)15 (35.7%)
1-week Serum Creatinine (mg/dL)3.8 (3.8)3.3 (3.2)3.4 (3.3)0.974
1-year Glomerular filtration rate (estimated, mL/min/1.73 m2)57.4 (19.3)52.2 (16.3)53.2 (16.8)0.586
Table 3. Accuracy metric of the three predictive models on the test dataset.
RMSEMAER2
random forest12.2 ± 3.29.2 ± 2.90.5 ± 0.6
univariable linear model24.4 ± 7.516.4 ± 6.68−0.8 ± 1.0
stepwise linear model23.2 ± 6.218.0 ± 5.4−0.6 ± 1.0
Publisher’s Note: MDPI stays neutral with regard to jurisdictional claims in published maps and institutional affiliations.

