
Computational Metabolomics Tools Reveal Metabolic Reconfigurations Underlying the Effects of Biostimulant Seaweed Extracts on Maize Plants under Drought Stress Conditions

 , , and
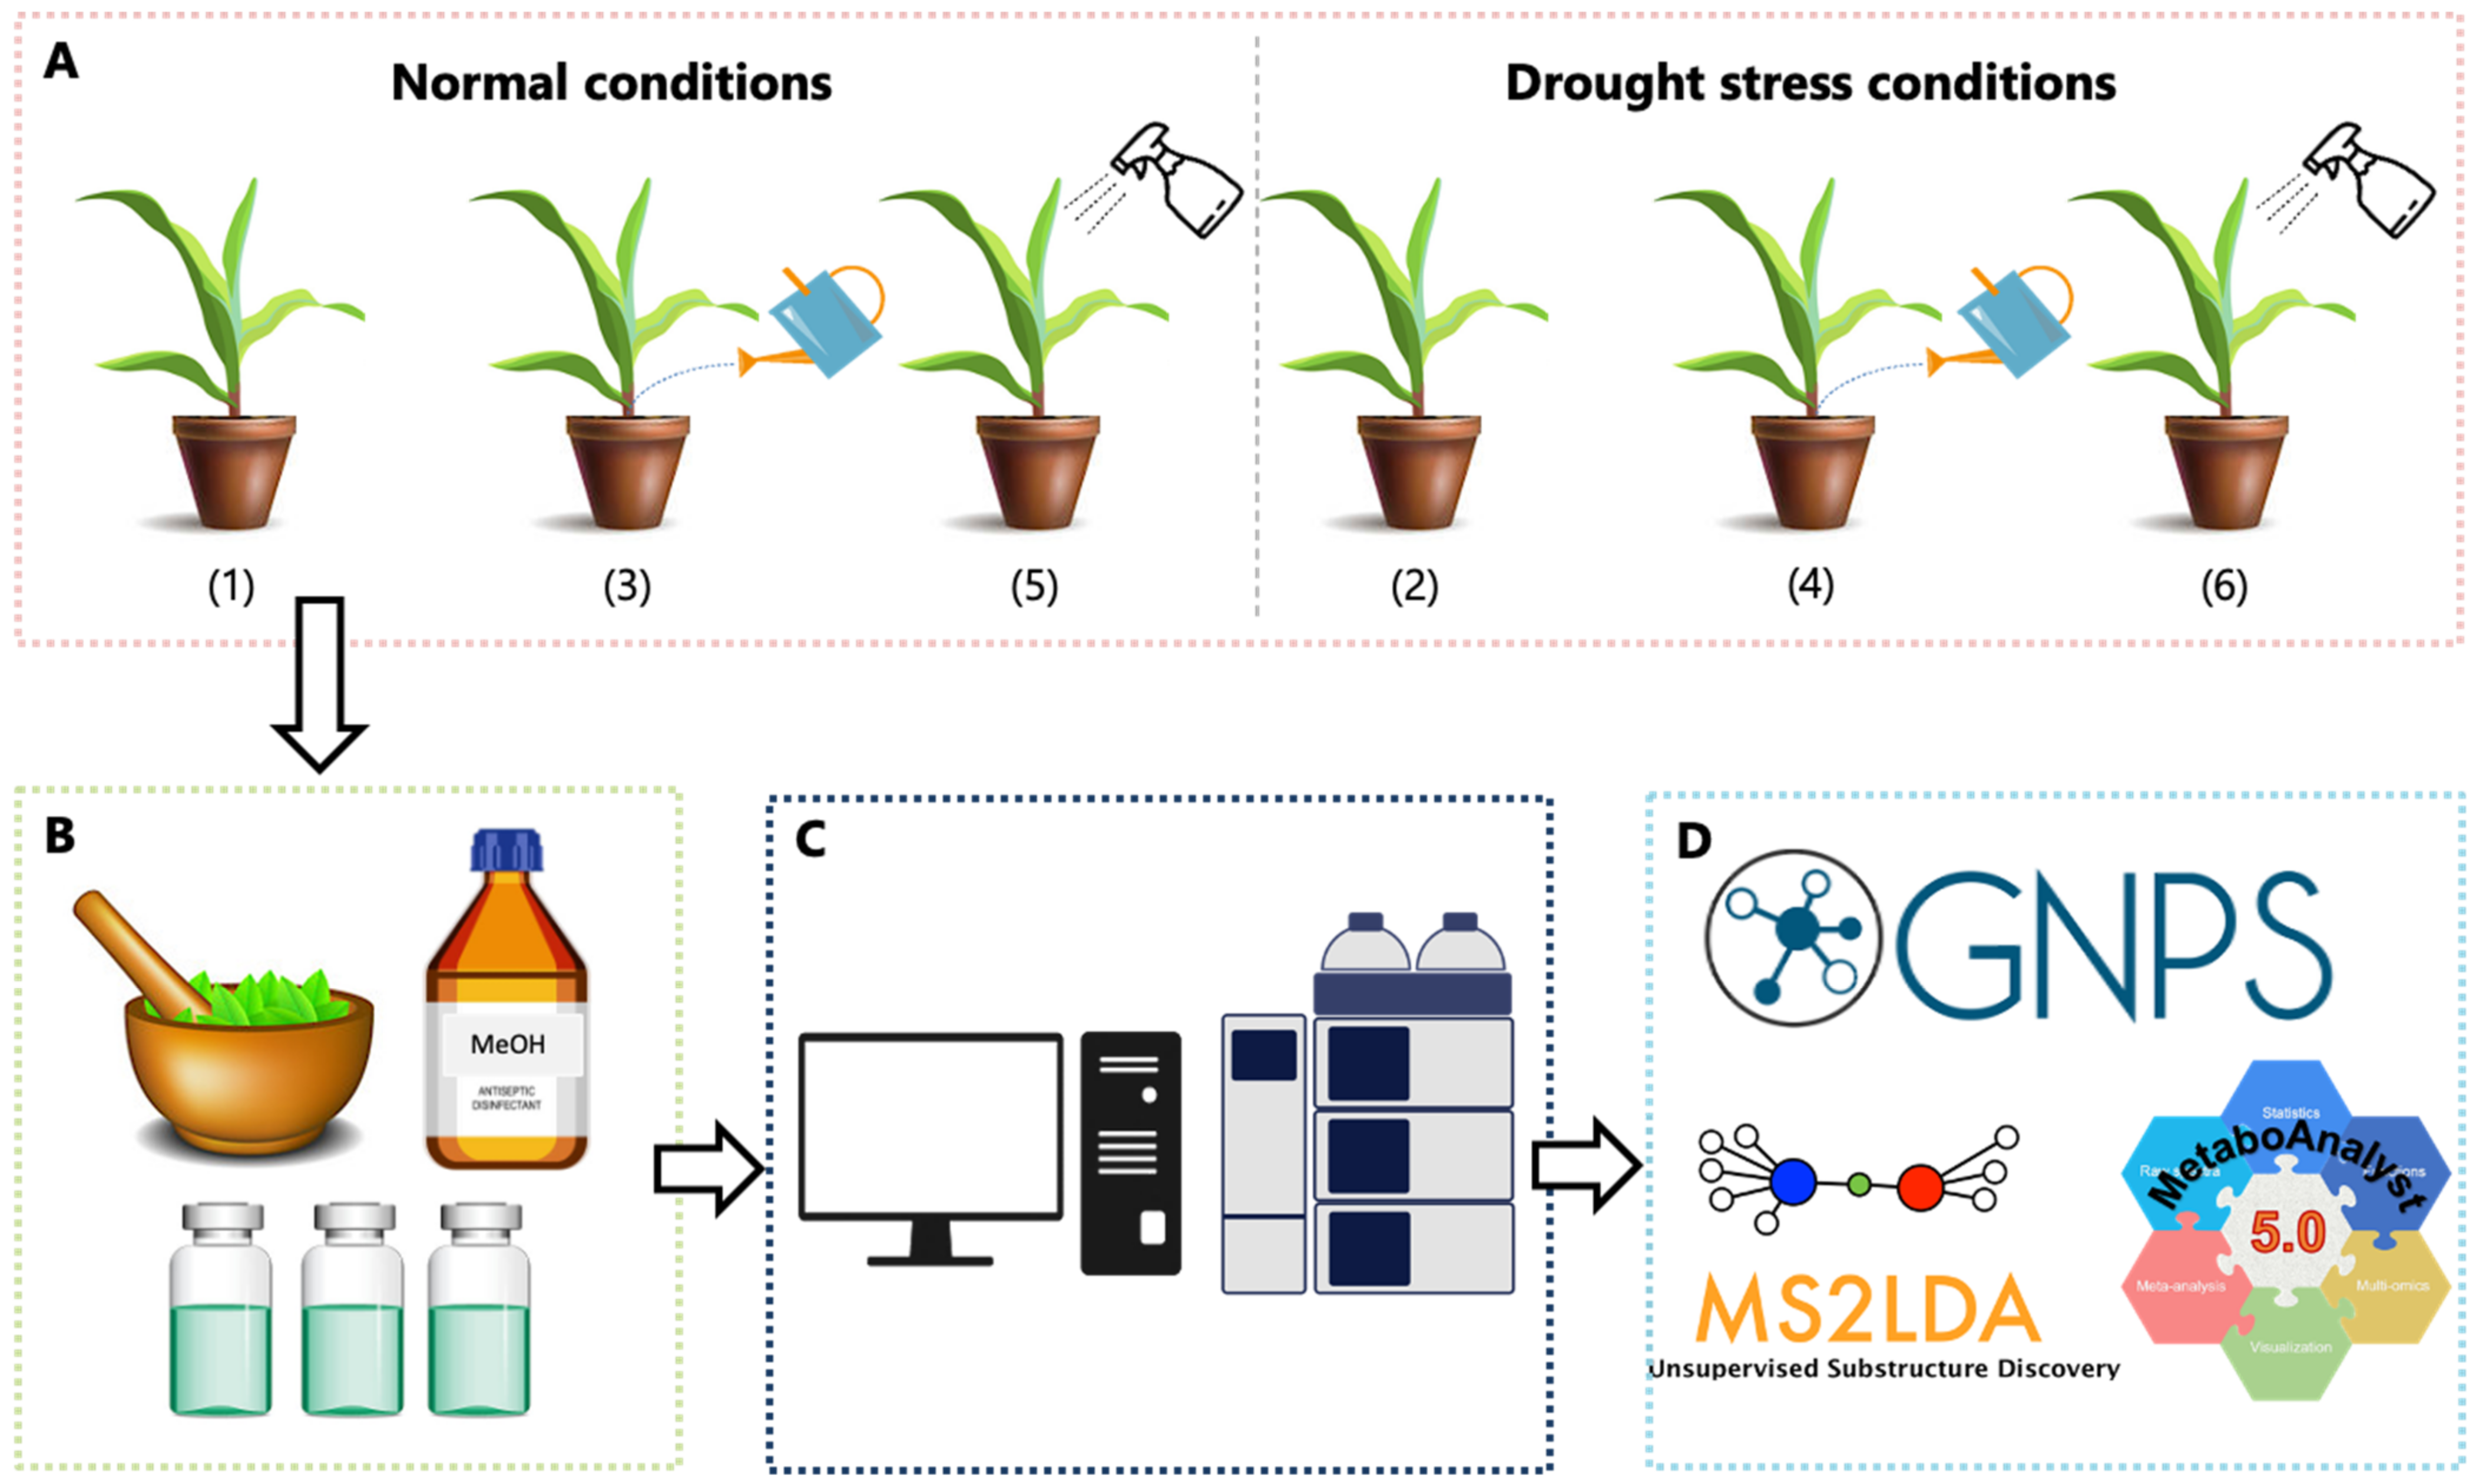
Abstract
:1. Introduction
2. Results and Discussion
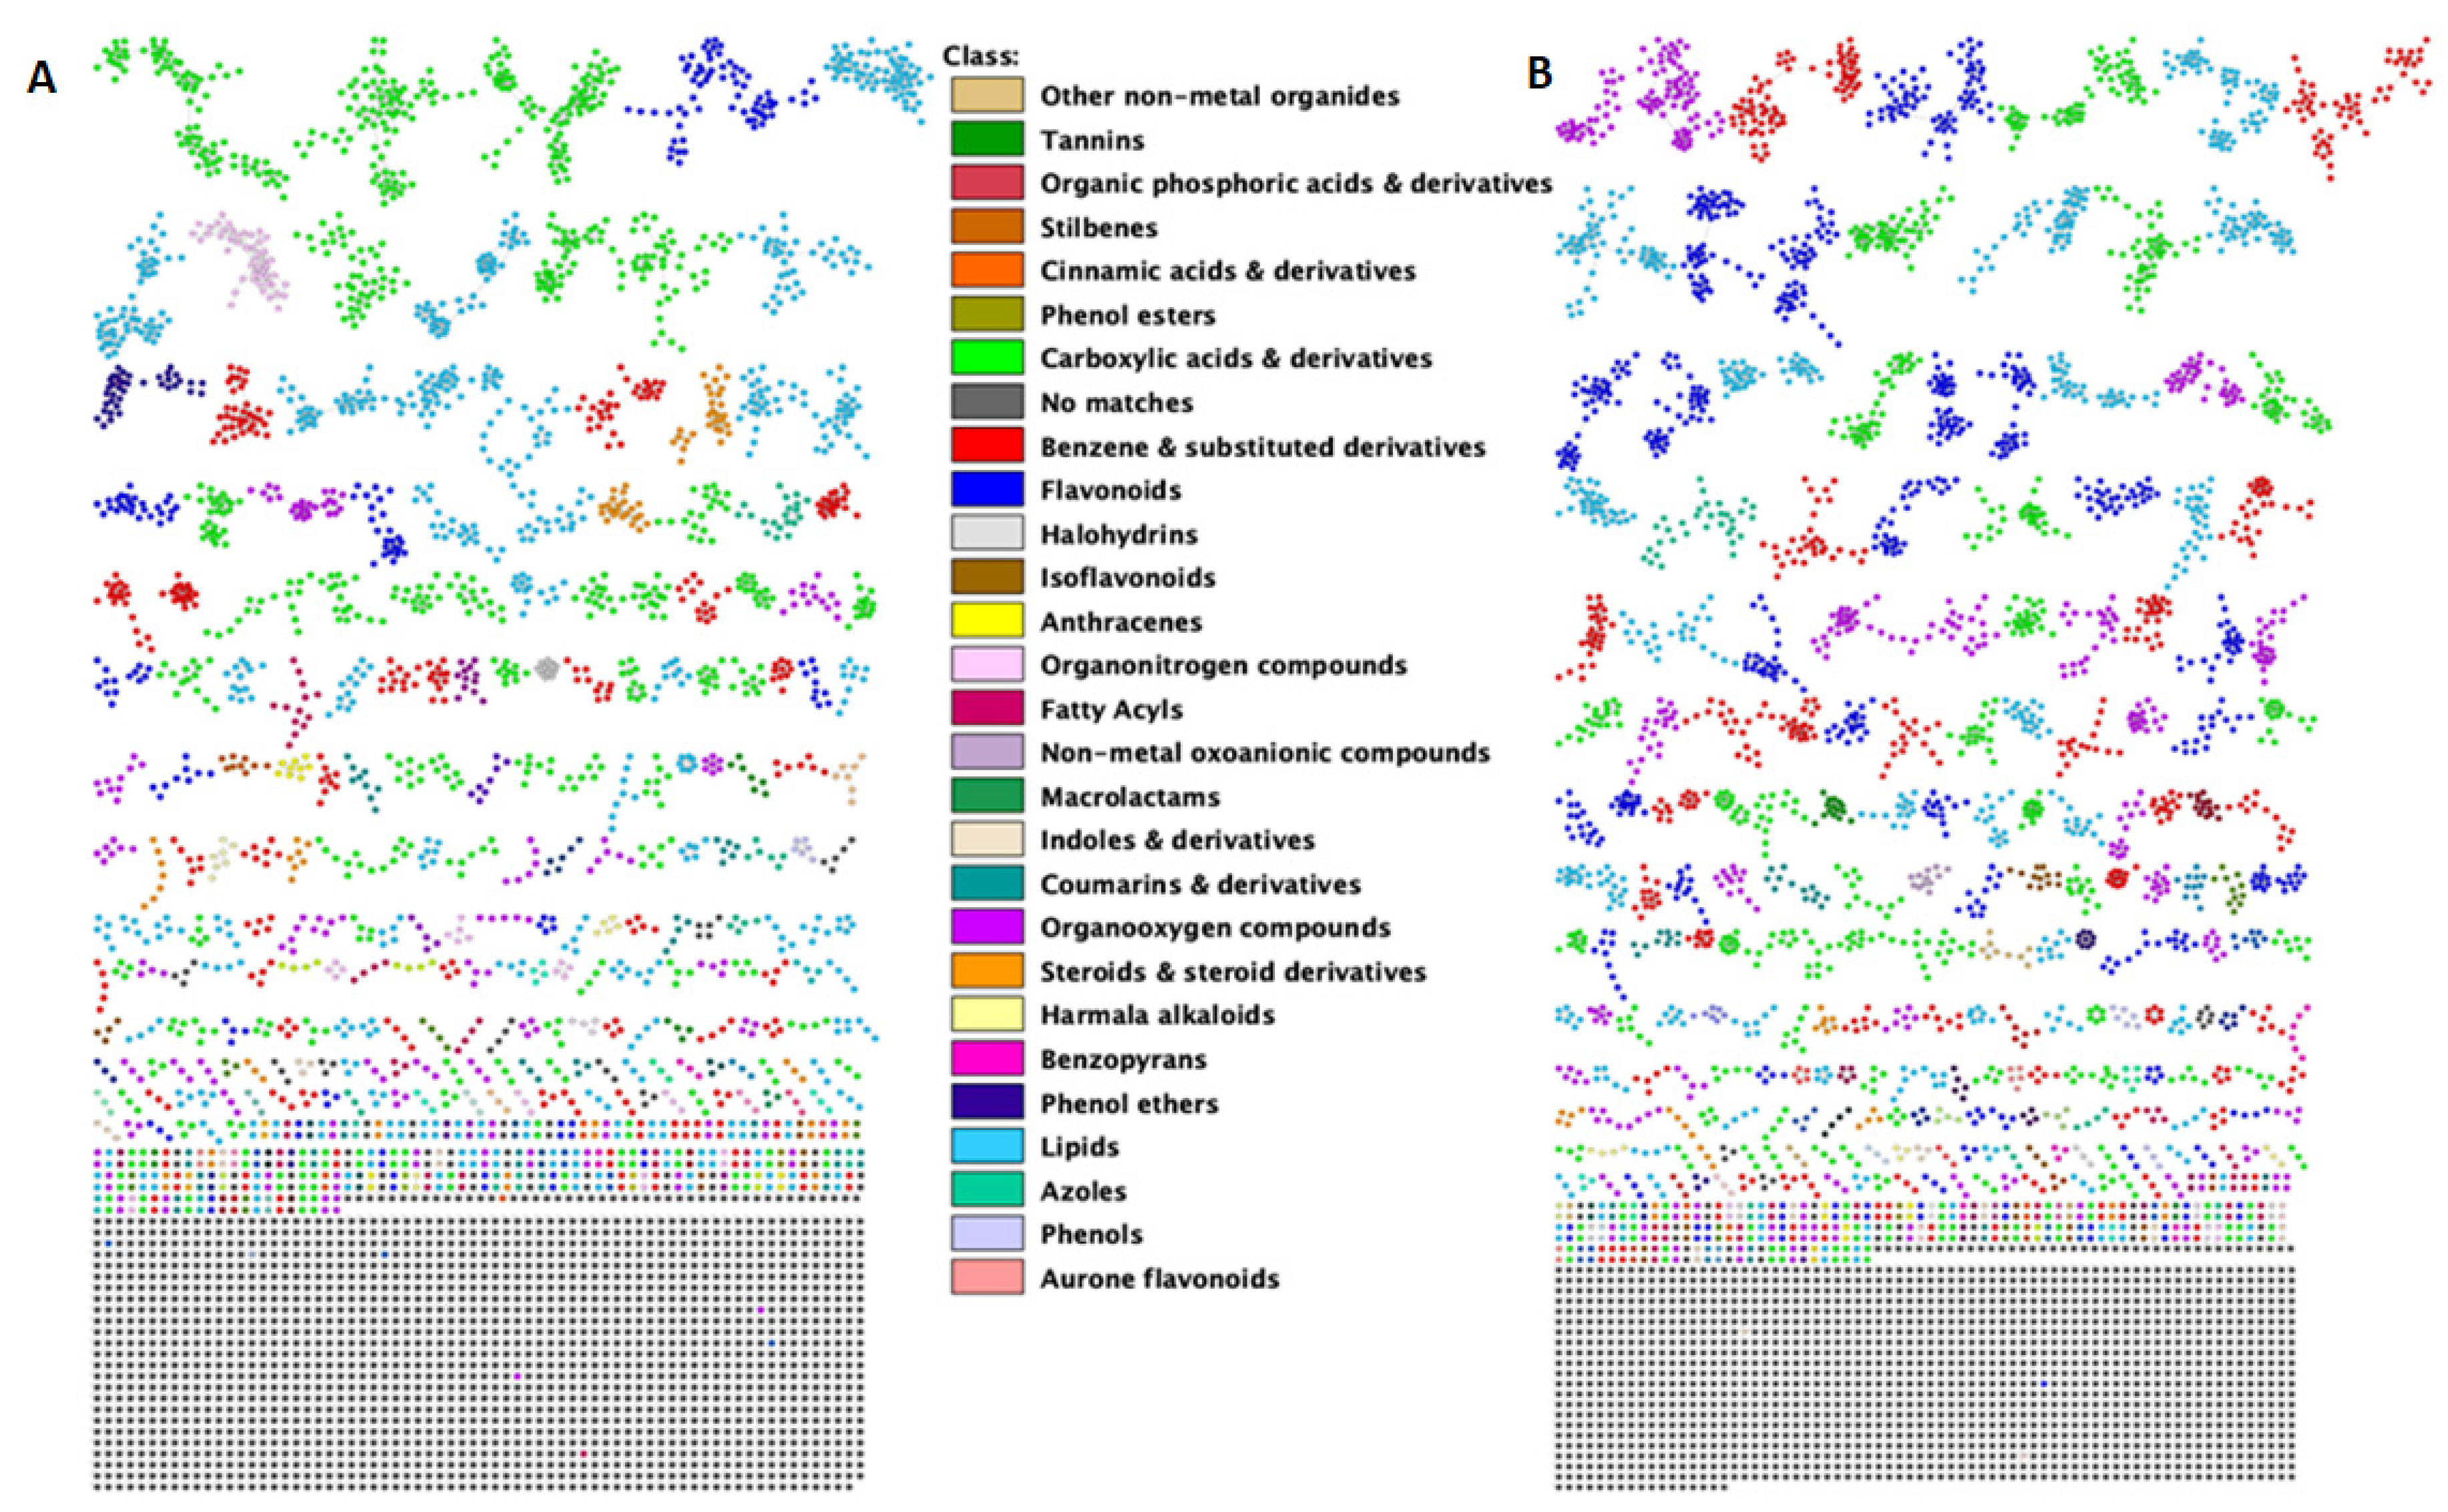
2.1. A Molecular Networking Approach for the Annotation and Visualization of the Extracted Maize Metabolome
2.2. Impacted Biological Pathways and Changes in Plant Height and Diameter of Maize Plants Treated with a Seaweed-Based Biostimulant
3. Materials and Methods
3.1. Maize Plant Preparation, Cultivation and Phenotypic Measurements
3.2. Metabolite Extraction and Sample Preparation
3.3. Sample Analyses on an UHPLC-HDMS Analytical Platform
3.4. Data Analysis: Data Set Matrix Creation and Chemometric Analyses
3.5. Molecular Networking in GNPS
3.6. Metabolite Identification and Metabolic Pathway Analyses
3.6.1. Metabolite Identification
3.6.2. Pathway Analyses
4. Conclusions
Supplementary Materials
Author Contributions
Funding
Institutional Review Board Statement
Informed Consent Statement
Data Availability Statement
Acknowledgments
Conflicts of Interest
References
- Jalota, S.K.; Vashisht, B.B.; Sharma, S.; Kaur, S. Climate Change Impact on Crop Productivity and Field Water Balance. In Understanding Climate Change Impacts on Crop Productivity and Water Balance; Academic Press: London, UK, 2018; pp. 87–148. ISBN 9780128095201. [Google Scholar]
- Malhi, G.S.; Kaur, M.; Kaushik, P. Impact of Climate Change on Agriculture and Its Mitigation Strategies: A Review. Sustainability 2021, 13, 1318. [Google Scholar] [CrossRef]
- Iqbal, M.S.; Singh, A.K.; Ansari, M.I. Effect of Drought Stress on Crop Production. In New Frontiers in Stress Management for Durable Agriculture; Springer Nature: Singapore, 2020; pp. 35–47. ISBN 9789811513220. [Google Scholar]
- Lamari, N.; Zhendre, V.; Urrutia, M.; Bernillon, S.; Maucourt, M.; Deborde, C.; Prodhomme, D.; Jacob, D.; Ballias, P.; Rolin, D.; et al. Metabotyping of 30 Maize Hybrids under Early-Sowing Conditions Reveals Potential Marker-Metabolites for Breeding. Metabolomics 2018, 14, 132. [Google Scholar] [CrossRef] [PubMed] [Green Version]
- Kumar, R.; Trivedi, K.; Anand, K.G.V.; Ghosh, A. Science behind Biostimulant Action of Seaweed Extract on Growth and Crop Yield: Insights into Transcriptional Changes in Roots of Maize Treated with Kappaphycus Alvarezii Seaweed Extract under Soil Moisture Stressed Conditions. J. Appl. Phycol. 2020, 32, 599–613. [Google Scholar] [CrossRef]
- Rouphael, Y.; Lucini, L.; Miras-Moreno, B.; Colla, G.; Bonini, P.; Cardarelli, M. Metabolomic Responses of Maize Shoots and Roots Elicited by Combinatorial Seed Treatments With Microbial and Non-Microbial Biostimulants. Front. Microbiol. 2020, 11, 664. [Google Scholar] [CrossRef]
- Shukla, P.S.; Mantin, E.G.; Adil, M.; Bajpai, S.; Critchley, A.T.; Prithiviraj, B. Ascophyllum Nodosum-Based Biostimulants: Sustainable Applications in Agriculture for the Stimulation of Plant Growth, Stress Tolerance, and Disease Management. Front. Plant Sci. 2019, 10, 655. [Google Scholar] [CrossRef] [Green Version]
- Kocira, S.; Szparaga, A.; Hara, P.; Treder, K.; Findura, P.; Bartoš, P.; Filip, M. Biochemical and Economical Effect of Application Biostimulants Containing Seaweed Extracts and Amino Acids as an Element of Agroecological Management of Bean Cultivation. Sci. Rep. 2020, 10, 17759. [Google Scholar] [CrossRef]
- Rouphael, Y.; Colla, G. Editorial: Biostimulants in Agriculture. Front. Plant Sci. 2020, 11, 40. [Google Scholar] [CrossRef] [Green Version]
- Nephali, L.; Moodley, V.; Piater, L.; Steenkamp, P.; Buthelezi, N.; Dubery, I.; Burgess, K.; Huyser, J.; Tugizimana, F. A Metabolomic Landscape of Maize Plants Treated With a Microbial Biostimulant Under Well-Watered and Drought Conditions. Front. Plant Sci. 2021, 12, 977. [Google Scholar] [CrossRef]
- Nephali, L.; Piater, L.A.; Dubery, I.A.; Patterson, V.; Huyser, J.; Burgess, K.; Tugizimana, F. Biostimulants for Plant Growth and Mitigation of Abiotic Stresses: A Metabolomics Perspective. Metabolites 2020, 10, 505. [Google Scholar] [CrossRef]
- Al-Juthery, H.W.A.; Abbas Drebee, H.; Al-Khafaji, B.M.K.; Hadi, R.F. Plant Biostimulants, Seaweeds Extract as a Model (Article Review). In IOP Conference Series: Earth and Environmental Science; IOP Publishing: Bristol, UK, 2020; Volume 553. [Google Scholar] [CrossRef]
- Yakhin, O.I.; Lubyanov, A.A.; Yakhin, I.A.; Brown, P.H. Biostimulants in Plant Science: A Global Perspective. Front. Plant Sci. 2017, 7, 2049. [Google Scholar] [CrossRef] [Green Version]
- Wang, M.; Carver, J.J.; Phelan, V.V.; Sanchez, L.M.; Garg, N.; Peng, Y.; Nguyen, D.D.; Watrous, J.; Kapono, C.A.; Luzzatto-Knaan, T.; et al. Sharing and Community Curation of Mass Spectrometry Data with Global Natural Products Social Molecular Networking. Nat. Biotechnol. 2016, 34, 828–837. [Google Scholar] [CrossRef] [PubMed] [Green Version]
- Nothias, L.F.; Petras, D.; Schmid, R.; Dührkop, K.; Rainer, J.; Sarvepalli, A.; Protsyuk, I.; Ernst, M.; Tsugawa, H.; Fleischauer, M.; et al. Feature-Based Molecular Networking in the GNPS Analysis Environment. Nat. Methods 2020, 17, 905–908. [Google Scholar] [CrossRef] [PubMed]
- van der Hooft, J.J.J.; Wandy, J.; Barrett, M.P.; Burgess, K.E.V.; Rogers, S. Topic Modeling for Untargeted Substructure Exploration in Metabolomics. Proc. Natl. Acad. Sci. USA 2016, 113, 13738–13743. [Google Scholar] [CrossRef] [PubMed] [Green Version]
- Ernst, M.; Kang, K.B.; Caraballo-Rodríguez, A.M.; Nothias, L.F.; Wandy, J.; Wang, M.; Rogers, S.; Medema, M.H.; Dorrestein, P.C.; van der Hooft, J.J.J. MolNetEnhancer: Enhanced Molecular Networks by Integrating Metabolome Mining and Annotation Tools. Metabolites 2019, 9, 144. [Google Scholar] [CrossRef] [PubMed] [Green Version]
- van der Hooft, J.J.J.; Mohimani, H.; Bauermeister, A.; Dorrestein, P.C.; Duncan, K.R.; Medema, M.H. Linking Genomics and Metabolomics to Chart Specialized Metabolic Diversity. Chem. Soc. Rev. 2020, 49, 3297–3314. [Google Scholar] [CrossRef]
- Tinte, M.M.; Chele, K.H.; van der Hooft, J.J.J.; Tugizimana, F. Metabolomics-Guided Elucidation of Plant Abiotic Stress Responses in the 4IR Era: An Overview. Metabolites 2021, 11, 445. [Google Scholar] [CrossRef]
- Xia, J.; Wishart, D.S.; Valencia, A. MetPA: A Web-Based Metabolomics Tool for Pathway Analysis and Visualization. Bioinformatics 2010, 27, 2342–2344. [Google Scholar] [CrossRef] [Green Version]
- Pang, Z.; Chong, J.; Zhou, G.; De Lima Morais, D.A.; Chang, L.; Barrette, M.; Gauthier, C.; Jacques, P.É.; Li, S.; Xia, J. MetaboAnalyst 5.0: Narrowing the Gap between Raw Spectra and Functional Insights. Nucleic Acids Res. 2021, 49, W388–W396. [Google Scholar] [CrossRef]
- El Boukhari, M.E.M.; Barakate, M.; Bouhia, Y.; Lyamlouli, K. Trends in Seaweed Extract Based Biostimulants: Manufacturing Process and Beneficial Effect on Soil-Plant Systems. Plants 2020, 9, 359. [Google Scholar] [CrossRef] [Green Version]
- Ali, O.; Ramsubhag, A.; Jayaraman, J. Biostimulant Properties of Seaweed Extracts in Plants: Implications towards Sustainable Crop Production. Plants 2021, 10, 531. [Google Scholar] [CrossRef]
- Aron, A.T.; Gentry, E.C.; McPhail, K.L.; Nothias, L.F.; Nothias-Esposito, M.; Bouslimani, A.; Petras, D.; Gauglitz, J.M.; Sikora, N.; Vargas, F.; et al. Reproducible Molecular Networking of Untargeted Mass Spectrometry Data Using GNPS. Nat. Protoc. 2020, 15, 1954–1991. [Google Scholar] [CrossRef] [PubMed]
- Beniddir, M.A.; Kang, K.B.; Genta-Jouve, G.; Huber, F.; Rogers, S.; van der Hooft, J.J.J. Advances in Decomposing Complex Metabolite Mixtures Using Substructure- and Network-Based Computational Metabolomics Approaches. Nat. Prod. Rep. 2021, 38, 1967–1993. [Google Scholar] [CrossRef] [PubMed]
- Fàbregas, N.; Fernie, A.R. The Metabolic Response to Drought. J. Exp. Bot. 2019, 70, 1077–1085. [Google Scholar] [CrossRef] [Green Version]
- Urrutia, M.; Blein-Nicolas, M.; Prigent, S.; Bernillon, S.; Deborde, C.; Balliau, T.; Maucourt, M.; Jacob, D.; Ballias, P.; Bénard, C.; et al. Maize Metabolome and Proteome Responses to Controlled Cold Stress Partly Mimic Early-Sowing Effects in the Field and Differ from Those of Arabidopsis. Plant Cell Environ. 2021, 44, 1504–1521. [Google Scholar] [CrossRef] [PubMed]
- Nouraei, S.; Rahimmalek, M.; Saeidi, G. Variation in Polyphenolic Composition, Antioxidants and Physiological Characteristics of Globe Artichoke (Cynara cardunculus Var. scolymus Hayek L.) as Affected by Drought Stress. Sci. Hortic. 2018, 233, 378–385. [Google Scholar] [CrossRef]
- Dong, N.Q.; Lin, H.X. Contribution of Phenylpropanoid Metabolism to Plant Development and Plant–Environment Interactions. J. Integr. Plant Biol. 2021, 63, 180–209. [Google Scholar] [CrossRef]
- da Silva, R.R.; Wang, M.; Nothias, L.F.; van der Hooft, J.J.J.; Caraballo-Rodríguez, A.M.; Fox, E.; Balunas, M.J.; Klassen, J.L.; Lopes, N.P.; Dorrestein, P.C. Propagating Annotations of Molecular Networks Using in Silico Fragmentation. PLoS Comput. Biol. 2018, 14, e1006089. [Google Scholar] [CrossRef]
- Ahammed, G.J.; Li, Y.; Li, X.; Han, W.Y.; Chen, S. Epigallocatechin-3-Gallate Alleviates Salinity-Retarded Seed Germination and Oxidative Stress in Tomato. J. Plant Growth Regul. 2018, 37, 1349–1356. [Google Scholar] [CrossRef]
- Kytidou, K.; Artola, M.; Overkleeft, H.S.; Aerts, J.M.F.G. Plant Glycosides and Glycosidases: A Treasure-Trove for Therapeutics. Front. Plant Sci. 2020, 11, 357. [Google Scholar] [CrossRef]
- Nothias-Esposito, M.; Nothias, L.F.; Da Silva, R.R.; Retailleau, P.; Zhang, Z.; Leyssen, P.; Roussi, F.; Touboul, D.; Paolini, J.; Dorrestein, P.C.; et al. Investigation of Premyrsinane and Myrsinane Esters in Euphorbia Cupanii and Euphobia Pithyusa with MS2LDA and Combinatorial Molecular Network Annotation Propagation. J. Nat. Prod. 2019, 82, 1459–1470. [Google Scholar] [CrossRef]
- Nguyen, D.H.; Nguyen, C.H.; Mamitsuka, H. Recent Advances and Prospects of Computational Methods for Metabolite Identification: A Review with Emphasis on Machine Learning Approaches. Brief. Bioinform. 2019, 20, 2028–2043. [Google Scholar] [CrossRef] [PubMed]
- Liu, Y.; Mrzic, A.; Meysman, P.; de Vijlder, T.; Romijn, E.P.; Valkenborg, D.; Bittremieux, W.; Laukens, K. Messar: Automated Recommendation of Metabolite Substructures from Tandem Mass Spectra. PLoS ONE 2020, 15, e0226770. [Google Scholar] [CrossRef] [PubMed] [Green Version]
- Leão, T.; Wang, M.; Moss, N.; da Silva, R.; Sanders, J.; Nurk, S.; Gurevich, A.; Humphrey, G.; Reher, R.; Zhu, Q.; et al. A Multi-Omics Characterization of the Natural Product Potential of Tropical Filamentous Marine Cyanobacteria. Mar. Drugs 2021, 19, 20. [Google Scholar] [CrossRef] [PubMed]
- Feunang, Y.D.; Eisner, R.; Knox, C.; Chepelev, L.; Hastings, J.; Owen, G.; Fahy, E.; Steinbeck, C.; Subramanian, S.; Bolton, E.; et al. ClassyFire: Automated Chemical Classification with a Comprehensive, Computable Taxonomy. J. Cheminform. 2016, 8, 1–20. [Google Scholar] [CrossRef] [Green Version]
- Singh, P.; Arif, Y.; Bajguz, A.; Hayat, S. The Role of Quercetin in Plants. Plant Physiol. Biochem. 2021, 166, 10–19. [Google Scholar] [CrossRef] [PubMed]
- Zhou, S.; Kremling, K.A.; Bandillo, N.; Richter, A.; Zhang, Y.K.; Ahern, K.R.; Artyukhin, A.B.; Hui, J.X.; Younkin, G.C.; Schroeder, F.C.; et al. Metabolome-Scale Genome-Wideassociation Studies Reveal Chemical Diversity and Genetic Control of Maize Specialized Metabolites. Plant Cell 2019, 31, 937–955. [Google Scholar] [CrossRef] [PubMed]
- Salika, R.; Riffat, J. Abiotic Stress Responses in Maize: A Review. Acta Physiol. Plant. 2021, 43, 130. [Google Scholar] [CrossRef]
- Yadav, B.; Jogawat, A.; Rahman, M.S.; Narayan, O.P. Secondary Metabolites in the Drought Stress Tolerance of Crop Plants: A Review. Gene Rep. 2021, 23, 101040. [Google Scholar] [CrossRef]
- Igamberdiev, A.U.; Eprintsev, A.T. Organic Acids: The Pools of Fixed Carbon Involved in Redox Regulation and Energy Balance in Higher Plants. Front. Plant Sci. 2016, 7, 1042. [Google Scholar] [CrossRef] [Green Version]
- Panchal, P.; Miller, A.J.; Giri, J. Organic Acids: Versatile Stress-Response Roles in Plants. J. Exp. Bot. 2021, 72, 4038–4052. [Google Scholar] [CrossRef]
- Misztal, P.K.; Hewitt, C.N.; Wildt, J.; Blande, J.D.; Eller, A.S.D.; Fares, S.; Gentner, D.R.; Gilman, J.B.; Graus, M.; Greenberg, J.; et al. Atmospheric Benzenoid Emissions from Plants Rival Those from Fossil Fuels. Sci. Rep. 2015, 5, 12064. [Google Scholar] [CrossRef] [PubMed] [Green Version]
- Widhalm, J.R.; Dudareva, N. A Familiar Ring to It: Biosynthesis of Plant Benzoic Acids. Mol. Plant 2015, 8, 83–97. [Google Scholar] [CrossRef] [PubMed] [Green Version]
- Lackus, N.D.; Schmidt, A.; Gershenzon, J.; Köllner, T.G. A Peroxisomal B-Oxidative Pathway Contributes to the Formation of C6–C1 Aromatic Volatiles in Poplar. Plant Physiol. 2021, 186, 891–909. [Google Scholar] [CrossRef]
- Kim, H.U. Lipid Metabolism in Plants. Plants 2020, 9, 871. [Google Scholar] [CrossRef]
- Reszczyńska, E.; Hanaka, A. Lipids Composition in Plant Membranes. Cell Biochem. Biophys. 2020, 78, 401–414. [Google Scholar] [CrossRef] [PubMed]
- Milewska-Hendel, A.; Baczewska, A.H.; Sala, K.; Dmuchowski, W.; Bragoszewska, P.; Gozdowski, D.; Jozwiak, A.; Chojnacki, T.; Swiezewska, E.; Kurczynska, E. Quantitative and Qualitative Characteristics of Cell Wall Components and Prenyl Lipids in the Leaves of Tilia x Euchlora Trees Growing under Salt Stress. PLoS ONE 2017, 12, e0172682. [Google Scholar] [CrossRef]
- Zheng, Y.; Xia, Z.; Wu, J.; Ma, H. Effects of Repeated Drought Stress on the Physiological Characteristics and Lipid Metabolism of Bombax Ceiba L. during Subsequent Drought and Heat Stresses. BMC Plant Biol. 2021, 21, 467. [Google Scholar] [CrossRef] [PubMed]
- Ackah, M.; Shi, Y.; Wu, M.; Wang, L.; Guo, P.; Guo, L.; Jin, X.; Li, S.; Zhang, Q.; Qiu, C.; et al. Metabolomics Response to Drought Stress in Morus Alba L. Variety Yu-711. Plants 2021, 10, 1636. [Google Scholar] [CrossRef]
- Drobek, M.; Frąc, M.; Cybulska, J. Plant Biostimulants: Importance of the Quality and Yield of Horticultural Crops and the Improvement of Plant Tolerance to Abiotic Stress-a Review. Agronomy 2019, 9, 335. [Google Scholar] [CrossRef] [Green Version]
- Al-Saman, M.A.; Farfour, S.A.; Hamouda, R.A. Effects of Some Red Algae on Antioxidant and Phytochemical Contents of Maize (Zea mays L.) Plants. Int. J. Agric. Sci. 2015, 5, 393–398. [Google Scholar]
- Szczepanek, M. Technology of Maize with Growth Stimulants Application. Eng. Rural Dev. 2018, 17, 483–490. [Google Scholar] [CrossRef]
- Chen, D.; Zhou, W.; Yang, J.; Ao, J.; Huang, Y.; Shen, D.; Martino, C. Di Effects of Seaweed Extracts on the Growth, Physiological Activity, Cane Yield and Sucrose Content of Sugarcane in China. Front. Plant Sci. 2021, 12, 865. [Google Scholar] [CrossRef]
- Trivedi, K.; Vijay Anand, K.G.; Vaghela, P.; Ghosh, A. Differential Growth, Yield and Biochemical Responses of Maize to the Exogenous Application of Kappaphycus Alvarezii Seaweed Extract, at Grain-Filling Stage under Normal and Drought Conditions. Algal Res. 2018, 35, 236–244. [Google Scholar] [CrossRef]
- Guo, L.; Wang, P.; Jaini, R.; Dudareva, N.; Chapple, C.; Morgan, J.A. Dynamic Modeling of Subcellular Phenylpropanoid Metabolism in Arabidopsis Lignifying Cells. Metab. Eng. 2018, 49, 36–46. [Google Scholar] [CrossRef] [PubMed]
- Kumari, A.; Parida, A.K. Metabolomics and Network Analysis Reveal the Potential Metabolites and Biological Pathways Involved in Salinity Tolerance of the Halophyte Salvadora Persica. Environ. Exp. Bot. 2018, 148, 85–99. [Google Scholar] [CrossRef]
- Xu, G.; Cao, J.; Wang, X.; Chen, Q.; Jin, W.; Li, Z.; Tian, F. Evolutionary Metabolomics Identifies Substantial Metabolic Divergence between Maize and Its Wild Ancestor, Teosinte. Plant Cell 2019, 31, 1990–2009. [Google Scholar] [CrossRef] [Green Version]
- Zavala-López, M.; Flint-García, S.; García-Lara, S. Compositional Variation in Trans-Ferulic, p-Coumaric, and Diferulic Acids Levels Among Kernels of Modern and Traditional Maize (Zea mays L.) Hybrids. Front. Nutr. 2020, 7, 314. [Google Scholar] [CrossRef]
- Wang, Y.K.; Xiao, X.R.; Zhou, Z.M.; Xiao, Y.; Zhu, W.F.; Liu, H.N.; Li, F. A Strategy Combining Solid-Phase Extraction, Multiple Mass Defect Filtering and Molecular Networking for Rapid Structural Classification and Annotation of Natural Products: Characterization of Chemical Diversity in Citrus Aurantium as a Case Study. Anal. Bioanal. Chem. 2021, 413, 2879–2891. [Google Scholar] [CrossRef]
- Bowne, J.B.; Erwin, T.A.; Juttner, J.; Schnurbusch, T.; Langridge, P.; Bacic, A.; Roessner, U. Drought Responses of Leaf Tissues from Wheat Cultivars of Differing Drought Tolerance at the Metabolite Level. Mol. Plant 2012, 5, 418–429. [Google Scholar] [CrossRef] [Green Version]
- Labeeuw, L.; Martone, P.T.; Boucher, Y.; Case, R.J. Ancient Origin of the Biosynthesis of Lignin Precursors. Biol. Direct 2015, 10, 23. [Google Scholar] [CrossRef] [Green Version]
- Łangowski, Ł.; Goñi, O.; Quille, P.; Stephenson, P.; Carmody, N.; Feeney, E.; Barton, D.; Østergaard, L.; O’Connell, S. A Plant Biostimulant from the Seaweed Ascophyllum Nodosum (Sealicit) Reduces Podshatter and Yield Loss in Oilseed Rape through Modulation of IND Expression. Sci. Rep. 2019, 9, 16644. [Google Scholar] [CrossRef] [PubMed] [Green Version]
- Lin, Y.; Watts, D.B.; Kloepper, J.W.; Feng, Y.; Torbert, H.A. Influence of Plant Growth-Promoting Rhizobacteria on Corn Growth under Drought Stress. Commun. Soil Sci. Plant Anal. 2020, 51, 250–264. [Google Scholar] [CrossRef]
- Fayzi, L.; Dayan, M.; Cherifi, O.; Boufous, E.H.; Cherifi, K. Biostimulant Effect of Four Moroccan Seaweed Extracts Applied as Seed Treatment and Foliar Spray on Maize. Asian J. Plant Sci. 2020, 19, 419–428. [Google Scholar] [CrossRef]
- Bechtold, U.; Field, B. Molecular Mechanisms Controlling Plant Growth during Abiotic Stress. J. Exp. Bot. 2018, 69, 2753–2758. [Google Scholar] [CrossRef] [PubMed] [Green Version]
- Wang, S.; Alseekh, S.; Fernie, A.R.; Luo, J. The Structure and Function of Major Plant Metabolite Modifications. Mol. Plant 2019, 12, 899–919. [Google Scholar] [CrossRef] [PubMed]
- Riaz, U.; Kharal, M.A.; Murtaza, G.; uz Zaman, Q.; Javaid, S.; Malik, H.A.; Aziz, H.; Abbas, Z. Prospective Roles and Mechanisms of Caffeic Acid in Counter Plant Stress: A Mini Review. Pakistan J. Agric. Res. 2018, 32, 8. [Google Scholar] [CrossRef]
- Castro-moretti, F.R.; Gentzel, I.N.; Mackey, D.; Alonso, A.P. Metabolomics as an Emerging Tool for the Study of Plant–Pathogen Interactions. Metabolites 2020, 10, 52. [Google Scholar] [CrossRef] [Green Version]
- Yang, F.; Li, W.; Jiang, N.; Yu, H.; Morohashi, K.; Ouma, W.Z.; Morales-Mantilla, D.E.; Gomez-Cano, F.A.; Mukundi, E.; Prada-Salcedo, L.D.; et al. A Maize Gene Regulatory Network for Phenolic Metabolism. Mol. Plant 2017, 10, 498–515. [Google Scholar] [CrossRef] [Green Version]
- Yang, X.; Wei, S.; Liu, B.; Guo, D.; Zheng, B.; Feng, L.; Liu, Y.; Tomás-Barberán, F.A.; Luo, L.; Huang, D. A Novel Integrated Non-Targeted Metabolomic Analysis Reveals Significant Metabolite Variations between Different Lettuce (Lactuca sativa. L) Varieties. Hortic. Res. 2018, 5, 33. [Google Scholar] [CrossRef] [Green Version]
- Cai, Z.; Chen, H.; Chen, J.; Yang, R.; Zou, L.; Wang, C.; Chen, J.; Tan, M.; Mei, Y.; Wei, L.; et al. Metabolomics Characterizes the Metabolic Changes of Lonicerae Japonicae Flos under Different Salt Stresses. PLoS ONE 2020, 15, e0243111. [Google Scholar] [CrossRef]
- Kapur, B.; Sarıdaş, M.A.; Çeliktopuz, E.; Kafkas, E.; Kargı, S.P. Health and Taste Related Compounds in Strawberries under Various Irrigation Regimes and Bio-Stimulant Application. Food Chem. 2018, 263, 67–73. [Google Scholar] [CrossRef] [PubMed]
- Sangster, T.; Major, H.; Plumb, R.; Wilson, A.J.; Wilson, I.D. A Pragmatic and Readily Implemented Quality Control Strategy for HPLC-MS and GC-MS-Based Metabonomic Analysis. Analyst 2006, 131, 1075–1078. [Google Scholar] [CrossRef] [PubMed]
- Sangster, T.P.; Wingate, J.E.; Burton, L.; Teichert, F.; Wilson, I.D. Investigation of Analytical Variation in Metabonomic Analysis Using Liquid Chromatography/Mass Spectrometry. Rapid Commun. Mass Spectrom. 2007, 21, 2965–2970. [Google Scholar] [CrossRef] [PubMed]
- Dunn, W.B.; Broadhurst, D.; Begley, P.; Zelena, E.; Francis-McIntyre, S.; Anderson, N.; Brown, M.; Knowles, J.D.; Halsall, A.; Haselden, J.N.; et al. Procedures for Large-Scale Metabolic Profiling of Serum and Plasma Using Gas Chromatography and Liquid Chromatography Coupled to Mass Spectrometry. Nat. Protoc. 2011, 6, 1060–1083. [Google Scholar] [CrossRef]
- Godzien, J.; Alonso-Herranz, V.; Barbas, C.; Armitage, E.G. Controlling the Quality of Metabolomics Data: New Strategies to Get the Best out of the QC Sample. Metabolomics 2014, 11, 518–528. [Google Scholar] [CrossRef]
- Banerjee, P.; Erehman, J.; Gohlke, B.O.; Wilhelm, T.; Preissner, R.; Dunkel, M. Super Natural II-a Database of Natural Products. Nucleic Acids Res. 2015, 43, D935–D939. [Google Scholar] [CrossRef] [Green Version]
- Shannon, P.; Markiel, A.; Ozier, O.; Baliga, N.S.; Wang, J.T.; Ramage, D.; Amin, N.; Schwikowski, B.; Ideker, T. Cytoscape: A Software Environment for Integrated Models of Biomolecular Interaction Networks Cytoscape: A Software Environment for Integrated Models of Biomolecular Interaction Networks. Genome Res. 2003, 13, 2498–2504. [Google Scholar] [CrossRef]
- Smoot, M.E.; Ono, K.; Ruscheinski, J.; Wang, P.L.; Ideker, T. Cytoscape 2.8: New Features for Data Integration and Network Visualization. Bioinformatics 2011, 27, 431–432. [Google Scholar] [CrossRef] [Green Version]
- Brown, M.; Dunn, W.B.; Dobson, P.; Patel, Y.; Winder, C.L.; Francis-McIntyre, S.; Begley, P.; Carroll, K.; Broadhurst, D.; Tseng, A.; et al. Mass Spectrometry Tools and Metabolite-Specific Databases for Molecular Identification in Metabolomics. Analyst 2009, 134, 1322–1332. [Google Scholar] [CrossRef]
- Brown, M.; Wedge, D.C.; Goodacre, R.; Kell, D.B.; Baker, P.N.; Kenny, L.C.; Mamas, M.A.; Neyses, L.; Dunn, W.B. Automated Workflows for Accurate Mass-Based Putative Metabolite Identification in LC/MS-Derived Metabolomic Datasets. Bioinformatics 2011, 27, 1108–1112. [Google Scholar] [CrossRef]
- Kang, J.; Price, W.E.; Ashton, J.; Tapsell, L.C.; Johnson, S. Identification and Characterization of Phenolic Compounds in Hydromethanolic Extracts of Sorghum Wholegrains by LC-ESI-MSn. Food Chem. 2016, 211, 215–226. [Google Scholar] [CrossRef] [PubMed] [Green Version]


Publisher’s Note: MDPI stays neutral with regard to jurisdictional claims in published maps and institutional affiliations. |
© 2022 by the authors. Licensee MDPI, Basel, Switzerland. This article is an open access article distributed under the terms and conditions of the Creative Commons Attribution (CC BY) license (https://creativecommons.org/licenses/by/4.0/).
Share and Cite
Tinte, M.M.; Masike, K.; Steenkamp, P.A.; Huyser, J.; van der Hooft, J.J.J.; Tugizimana, F. Computational Metabolomics Tools Reveal Metabolic Reconfigurations Underlying the Effects of Biostimulant Seaweed Extracts on Maize Plants under Drought Stress Conditions. Metabolites 2022, 12, 487. https://0-doi-org.brum.beds.ac.uk/10.3390/metabo12060487
Tinte MM, Masike K, Steenkamp PA, Huyser J, van der Hooft JJJ, Tugizimana F. Computational Metabolomics Tools Reveal Metabolic Reconfigurations Underlying the Effects of Biostimulant Seaweed Extracts on Maize Plants under Drought Stress Conditions. Metabolites. 2022; 12(6):487. https://0-doi-org.brum.beds.ac.uk/10.3390/metabo12060487
Chicago/Turabian StyleTinte, Morena M., Keabetswe Masike, Paul A. Steenkamp, Johan Huyser, Justin J. J. van der Hooft, and Fidele Tugizimana. 2022. "Computational Metabolomics Tools Reveal Metabolic Reconfigurations Underlying the Effects of Biostimulant Seaweed Extracts on Maize Plants under Drought Stress Conditions" Metabolites 12, no. 6: 487. https://0-doi-org.brum.beds.ac.uk/10.3390/metabo12060487