Article

Dietary Stimuli, Intestinal Bacteria and Peptide Hormones Regulate Female Drosophila Defecation Rate

by
Katerina Kotronarou
,
Anna Charalambous
,
Amalia Evangelou
,
Olympiada Georgiou
,
Andri Demetriou
and
Yiorgos Apidianakis
*
Department of Biological Sciences, University of Cyprus, P.O. Box 20537, Nicosia 2109, Cyprus
*
Author to whom correspondence should be addressed.
These authors contributed equally to this work.
Submission received: 20 January 2023 / Revised: 9 February 2023 / Accepted: 9 February 2023 / Published: 12 February 2023
(This article belongs to the Special Issue Host-Microbe-Metabolite Interaction in Intestinal Health)

Abstract

:
Peptide hormones control Drosophila gut motility, but the intestinal stimuli and the gene networks coordinating this trait remain poorly defined. Here, we customized an assay to quantify female Drosophila defecation rate as a proxy of intestinal motility. We found that bacterial infection with the human opportunistic bacterial pathogen Pseudomonas aeruginosa (strain PA14) increases defecation rate in wild-type female flies, and we identified specific bacteria of the fly microbiota able to increase defecation rate. In contrast, dietary stress, imposed by either water-only feeding or high ethanol consumption, decreased defecation rate and the expression of enteroendocrine-produced hormones in the fly midgut, such as Diuretic hormone 31 (Dh31). The decrease in defecation due to dietary stress was proportional to the impact of each stressor on fly survival. Furthermore, we exploited the Drosophila Genetic Reference Panel wild type strain collection and identified strains displaying high and low defecation rates. We calculated the narrow-sense heritability of defecation rate to be 91%, indicating that the genetic variance observed using our assay is mostly additive and polygenic in nature. Accordingly, we performed a genome-wide association (GWA) analysis revealing 17 candidate genes linked to defecation rate. Downregulation of four of them (Pmp70, CG11307, meso18E and mub) in either the midgut enteroendocrine cells or in neurons reduced defecation rate and altered the midgut expression of Dh31, that in turn regulates defecation rate via signaling to the visceral muscle. Hence, microbial and dietary stimuli, and Dh31-controlling genes, regulate defecation rate involving signaling within and among neuronal, enteroendocrine, and visceral muscle cells.

1. Introduction

Normal gastrointestinal (GI) motility is a vital process in all living organisms, primarily implicated in food digestion and nutrient absorption, thus necessary for energy homeostasis [1,2]. It is also critical for host-microbiota interaction and host defense to infection [3,4]. Gastrointestinal motility is physiologically regulated by smooth muscle contractility, that is in turn controlled by extrinsic parasympathetic and sympathetic neurons, intrinsic enteric sensory and motor neurons, and GI hormones [5,6,7]. These are influenced by extrinsic factors, such as diet, medications, and infections, as well as intrinsic factors, such as gut–brain communication, inflammatory and degenerative processes, and overstimulation of visceral sensory pathways altering smooth muscle contractility and enteric nervous system function [8]. However, the molecular mechanisms involved, remain incompletely understood.
Drosophila melanogaster is a suitable model organism to study the regulation of intestinal physiology via the gut–brain communication axis by revealing basic concepts potentially applicable to various aspects of human intestinal pathology [9,10]. Despite the physiological divergence between vertebrates and insects, modeling of human intestinal diseases is possible in Drosophila due to its high degree of conservation with mammals in terms of signaling pathways controlling intestinal development, regeneration, and disease [9]. Furthermore, various human intestinal pathogens and alterations in intestinal microbiota can infect flies and cause intestinal pathology [11]. More importantly, the availability of genome-wide RNAi libraries, gene markers, and gene manipulation tools, render Drosophila easily amenable to reverse genetics.
Drosophila assays simultaneously provide the complex cellular composition of a model intestine along with the opportunity to assess organismal physiology faster and cheaper [9,12]. For example, insights have been provided using Drosophila to reveal mechanisms underlying gut motility, feeding behavior and energy mobilization involving the gut-brain communication axis [10]. Larval gut motility (peristalsis) is determined by the action of enteroendocrine cells (EEs) located anterior to the acidic stomach region [13]. Similarly, adult fly midgut muscle contraction is regulated by midgut EEs [14]. Enteroendocrine cells secrete various regulatory peptides, including Diuretic Hormone 31 (DH31) [15], the fly homolog of the vertebrate Calcitonin Gene-Related Peptide (CGRP), that is necessary and sufficient for larval gut peristalsis and adult midgut visceral muscle (VM) contractions [13,16]. The DH31 promotes VM contractions within 2 h of ingestion of pathogenic bacteria facilitating gut clearance of the ingested bacteria [14].
Furthermore, midgut EEs and neurons regulate feeding behavior and energy mobilization through glucagon-like adipokinetic hormone (AKH) and Drosophila insulin-like peptides (dILPs). Neuropeptide F (NPF; orthologous to mammalian neuropeptide Y) and its receptor influence total food intake indirectly by regulating food choice behavior [17,18] and lipid-metabolism [19,20]. Neurons producing Allatostatin A (AstA) participate in a circuitry that negatively regulates feeding behavior via metabolic changes controlling satiety [21,22]. Allatostatin A and its receptor DAR2 (AstA-R2), are regulated differentially by dietary carbohydrates and proteins, and AstA-neuronal activity modulates feeding choices between carbohydrates and proteins by regulating the balance between dILPs and AKH [23]. Moreover, midgut EEs sense nutrient stress through TOR signaling and secrete Allatostatin C (AstC), a Drosophila peptide hormone, homologous to mammalian somatostatin. Allatostatin C induces secretion of AKH to coordinate food intake and energy mobilization [24,25]. Tachykinin (Tk) and Myosuppressin (Ms) have modulatory roles on motility; the former confers both excitatory and inhibitory effects on gut motility [26], whereas the latter relaxes crop muscles, to allow expansion and increased food intake [10]. However, external stimuli and gene networks coordinating gut motility via the neuron-gut axis remain poorly defined.
The objectives of this study were to (a) determine the effect of dietary and microbial stimuli on the defecation rate of female Drosophila using a customized assay that served as a proxy of intestinal motility, (b) determine the heritability of this trait when using our assay and (c) identify novel genes through a genome wide association (GWA) analysis that interact with known peptide hormones, such as Diuretic hormone 31, forming gene networks implicated in the regulation of intestinal motility.

2. Materials and Methods

2.1. Preparation of LB and BHI Agar Plates with or without Rifampicin

Luria–Bertani (LB) agar (Invitrogen—Waltham, MA, USA) plates were prepared according to manufacturer’s instructions. A total of 32 g LB agar powder/1 L ddH2O was autoclaved and used in plain petri dishes. The LB agar rifampicin plates were prepared with the addition of 100 μg/mL rifampicin (Sigma–Aldrich, St. Louis, MO, USA, R3501) after autoclaving.
The BHI (Brain Heart Infusion) agar plates were prepared according to manufacturer’s instructions. A total of 37 g BHI (HIMEDIA, Einhausen, Germany) plus 15 g agar/1 L ddH2O was autoclaved and supplemented with 5 mg hemin (Sigma–Aldrich, St. Louis, MO, USA), 0.1 mg vitamin K1 (Sigma–Aldrich, St. Louis, MO, USA), and preferentially 100 μg/mL rifampicin (Sigma–Aldrich, St. Louis, MO, USA) after autoclaving. All plates were kept at 4 °C until usage.

2.2. Bacteria Strains, Infection and Determination of Bacterial Load

2.2.1. Bacteria Strains

Gram-negative bacteria Pseudomonas aeruginosa (PA14) have been described previously [27]. Gram-positive bacteria Enterococcus haemoperoxidus and Staphylococcus arlettae are Drosophila isolates from OR flies (this study). These were maintained as glycerol stocks and stored at −80 °C.

2.2.2. Bacterial Infection

A sample of 3 mL of the overnight cultures of either P. aeruginosa (PA14), or E. haemoperoxidus or S. arlettae alone, or in various combinations, were diluted 1:100 in LB (Lysogeny Broth) to prepare the overday 3 mL cultures. When the cultures reached OD600 = 3, they were used to prepare the infection mixtures (5 mL per vial: 3.5 mL ddH2O, 1 mL 20% sucrose and 0.5 mL bacteria OD600 = 3) or the control sucrose mix (5 mL per vial control: 4 mL ddH2O and 1 mL 20% sucrose). A total of 5 mL of the infection or control mix was used to soak a cotton ball in a narrow fly vial, which was subsequently plugged with a dry cotton ball. After 4–5 h starvation in empty vials, the flies were put in the infection vials and incubated at 25° with the cotton plug facing down.

2.2.3. Bacterial Load

The number of bacteria colony forming units (CFUs) in five populations of OR flies, reared in parallel for a year, were determined either at 2 days following PA14 ingestion, or without as a control, at 25 °C. Flies were externally sterilized by brief dipping into pure ethanol, dried and placed into 2 mL Eppendorf tubes containing 200 μL lysogeny broth (LB) and a stainless-steel bead of 5 mm diameter (Qiagen, Hilden, Germany). Flies were homogenized using the TissueLyser II (Qiagen, Hilden, Germany) at 50 Hz for 5 min. Then LB or BHI was then added into the tubes containing the tissue lysate to reach the volume of 1000 μL. Serial dilutions of the lysate obtained from three flies were plated onto LB or BHI agar plates with or without 100 μg/mL rifampicin (Sigma-Aldrich, St. Louis, MO, USA) and incubated overnight at 37 °C. In total, bacterial colonies from three replicates per OR population were counted.

2.2.4. Isolation of Bacterial Species from Drosophila

To analyze different bacterial species from the gut microbiota of Drosophila, two populations of Oregon-R female flies (OR3 and OR9) were surface sterilized by washing with 10% bleach, 70% ethanol and PBS before homogenization and plating on LB and BHI agar plates with 100 μg/mL rifampicin or not as a control. The plates were incubated at 28 °C for 4 days and single colonies were picked and isolated on new agar plates for three rounds to obtain pure cultures. These were then stored in glycerol stocks for microbiological experiments and colony PCR.

2.2.5. Single Colony PCR and Analysis of 16S rRNA Genes

Of the different pure cultures, single colonies were picked and transferred into PBS buffer containing 200 μg/mL Proteinase K and 10 mg/mL Lysozyme and incubated for 30 min at 37 °C and 2 min at 95 °C. The samples were centrifuged for 2 min at 13,000 rpm and the supernatant transferred to a new vial. The 16S rRNA Gen was amplified using the GM3F and GM4R primers [28], using the Phusion Polymerase (New England Biolabs, Ipswich, MA, USA) which produced a product of about 1500 bp. These PCR products were then ligated into the TOP TA Vector (TOPO TA Cloning Kit for Sequencing, Invitrogen, Waltham, MA, USA) and transformed into chemocompetent E. coli DH5alpha according to the manufacturer’s instructions. The vector including the insert was extracted from E. coli and the DNA sequence was subjected to BLAST analysis to identify the isolated bacterial species.

2.2.6. DNA Extraction from Bacterial Species for Sequencing

The DNA extraction was performed using the QiaAmp DNA Mini kit (Qiagen, Hilden, Germany) according to the manufacturer’s recommendation, with the following modifications. Briefly, an inoculation loop was used to pick bacterial colonies from the pure cultures grown on LB or BHI +/− rifampicin agar plates and the bacteria were resuspended in gram-positive lysis buffer (20 mg/mL lysozyme; 20 mM Tris·HCl, pH = 8.0; 2 mM EDTA; 1.2% Triton®). The following lysis and purification steps were performed according to the kit’s protocol for DNA extraction from gram-positive bacteria.

2.3. Drosophila Melanogaster Diet, Maintenance, Strains and Experiments

2.3.1. Drosophila Diet and Maintenance

All strains and crosses were reared on a standard agar/cornmeal diet (1% Agar, 3% Yeast, 5% Sugar, 6% Cornmeal, supplemented with 2.56% Tegosept and 0.38% Propionic Acid) and kept in plastic bottles, with approximately 50 mL of fresh fly food in a 12-h light-dark cycle in a temperature-controlled incubator (Fitotron from Weisstechnik, Reiskirchen-Lindenstruth, Germany) at 25° (unless specified otherwise) with 65% humidity. For maintenance flies were transferred to new bottles with fresh fly food every 3 to 4 days. For fly infection experiments flies were transferred to clean vials with fresh fly food every day, containing preservatives (propionic acid and Tegosept), to help eliminate microbiota and avoid pre-treatment with antibiotics that would interfere with subsequent bacterial infection and colonization. For the Drosophila Genetic Reference Panel (DGRP) screening for fecal spot number, prior to infection, female mated flies were aged for 4 days at 25 °C in bottles changed daily containing fly food supplemented with 50 ug/mL of the broad-range antibiotic Rifampicin, which does not kill PA14, but can eliminate most of the microorganisms present in the intestine of the flies.

2.3.2. Germ-Free Flies

Female flies were transferred in empty bottles covered with a fruit juice agar plate (35 × 10 mm). The fruit juice agar plate was prepared following boiling of 2% agar dissolved in fruit juice and supplemented with Tegasept and propionic acid to final concentrations of 0.56% and 0.37%, respectively. Once the mixture was solidified, 0.2 mL of yeast paste (66% dry yeast dissolved in double-distilled H2O) was transferred into the middle of each Petri dish. Flies were conditioned by feeding on fruit juice agar plates for a day before being transferred into clean bottles with freshly prepared fruit juice agar plates on the top. After a 15 h incubation at 25 °C, the eggs were collected into a mesh basket using a brush. Each basket was placed in a beaker containing 20 mL of 50% bleach for a maximum of 2 min or until ~80% of dorsal appendages were dissolved as a result of removal of the chorion layer. Bleached eggs were then washed with sterile double-distilled H2O under the microbiological hood and transferred into bottles containing sterile fly food and maintained at 25 °C. Once the offspring began to emerge, they were transferred into bottles with sterile food. Lysates obtained from the emerged flies were plated onto LB media and incubated at 37 °C overnight to ensure that they were germ-free.

2.3.3. Drosophila Strains

Oregon-R flies were used as a standard wild-type strain in experiments assessing effects of infection, gut microbiota, and metabolic stress (ethanol in the diet and starvation), on the defecation rate. In some experiments, explicitly indicated within this work, OR flies reared in parallel for one year were sampled and assessed. The DGRP collection of wild type inbred sequenced strains [29,30] was used in the screen to assess defecation rate as a measure of fecal spots. The VDRC UAS-RNAi lines used in this study to examine the effects of ubiquitous or site-specific (EE or pan-neuron or visceral muscle) downregulation of GWAS-identified and hormone-encoding genes on the defecation rate and gene expression in the midgut and head were the following: 110698/KK targeting Pmp70, 30050/GD and 108230/KK targeting CG11307, 17444/GD targeting meso18E, 110581/KK targeting mub, 104119/KK targeting CG32365, 7789/GD targeting dom, 18177/KK targeting NK7.1, rad targeting CG42629, 1402/GD and 1403/GD targeting hh, 107945/KK and 27117/GD targeting CG7166, 100915/KK targeting CG8065, 12610/GD targeting jumu, 101090/KK targeting Bin3, 25222/GD targeting ckn, 50295/GD targeting Dh31, 1439816/GD and 103215/KK targeting AstA, 102735/KK and 13773/GD targeting AstC, 108760/KK targeting Ms, 330662/KK and 108772/KK targeting NPF, 103662/KK targeting Tk, 106076/KK and 5294/GD targeting AstB, 108648/KK and 1327/GD targeting DAR2, 9199/GD and 106512/KK targeting ilp3. The Gal4 lines were crossed to w1118, as a control. Other stocks used in this study were the following (source and/or stock center numbers in parentheses): UAS-Dh31RNAi (BDSC#41957), UAS-Dh31-RRNAi (BDSC#25925), w;actin-Gal4, UASGFP/CyO (actin-Gal4), w;prosV1-Gal4/TM6C (Prospero-Gal4), w;elav-Gal4/FM7i UAS-dsRed/Cyo (elav-Gal4) and 24B-Gal4 UAS-GFP/TM3. The Dh31-Gal4 (KII) and w;UAS-mCherryNLS flies were gifts from Armel Gallet.

2.3.4. Defecation Assay

Female flies were starved in empty vials for 5 hr and then placed in vials with cotton balls impregnated with 5 mL 4% sucrose and 0.5% w/v bromophenol blue (BPB; Scharlab, Barcelona, Spain)) adjusted to pH = 7. Fifty flies were split into three vials with BPB and were allowed to feed for 5 h (vials were placed in the incubator with the cotton plug facing down). Ten flies from each vial were moved to a petri dish containing a sterile cotton ball impregnated with 2.5 mL of the BPB solution and were left to defecate for 20 h. Then, the flies were removed from the plates and the total number of fecal spots was measured in the three plates. Fecal spots per fly per day are plotted. All experiments were performed at 25 °C.
For the assessment of defecation rate under infection conditions, female flies were fed concentrated bacteria of OD600 = 50 using an overday culture of OD600 = 2 concentrated 25 times by centrifugation and resuspension of the bacterial pellet in 4% sucrose. Specifically, each feeding vial plugged with a cotton ball contained 5 mL agar gel (3% w/v agar in H2O) on top of which a Whatmann disc with 200 μL of the infection mix was placed. Twenty-five mated starved young female flies per vial were allowed to feed for 20 h on either infection mix or 4% sucrose (as a control) at 25 °C, and their fecal spots were then counted and plotted per fly per day.
For assessment of the defecation rate under starvation conditions, the control group was given 0.5% BPB in 4% sucrose, as above, whereas the test-group (under starvation stress) was given 0.5% BPB in water (final pH of both BPB solutions adjusted to pH = 7). Ten control (no starvation stress) flies were transferred directly from fly food in a vial for 5 h to polystyrene vials, each containing a sterilized cotton ball pressurized at the bottom of the vial and soaked with 5 mL BPB in 4% sucrose, while 10 test (water-only) flies were transferred in a polystyrene vial containing a cotton ball soaked with 5 ml BPB in water. Then each group was transferred to a polystyrene petri dish (10 cm in diameter) containing a half (scissors cut) sterilized cotton ball soaked with 2.5 mL of the corresponding BPB solution. Twenty-four hours later, flies were discarded from the petri dishes and the excreta of n = 10 flies per replicate per 24 h were assessed. Data were collected from 6 biological replicates and fecal spots per fly per 24 h are plotted.

2.3.5. Survival Assay

Young female flies were subjected to metabolic stress conditions—either starvation or ethanol consumption. Sterile glass tubes were used and Whatman filter paper was placed at the bottom of each tube. The ethanol was administered on Whatman paper in solution with 4% sucrose. For starvation, the Whatman paper was only soaked with water. As a control, the flies were kept in vials with a 4% sucrose solution. The percentage of dead flies was calculated daily as the (number of dead flies per vial/total number of flies) × 100 until all flies were dead in each vial. The time when 50% of the flies were dead (LT50%, lethal time 50%), was used as an indicator of survival for comparisons.

2.3.6. Determination of Narrow-Sense Heritability (h2)

Eight crossing schemes of parental and F1 and F2 generations were performed: four between combinations of DGRP strains displaying high defecation rates (25201, 28171 and 25208) and four between combinations of DGRP strains displaying low defecation rates (28182, 28150 and 28153). Both the parents’ and offspring’s defecation rates were determined. The variable h2 was determined for each crossing scheme using the formula h 2 = ( x ¯ F 1 x ¯ p o p ) ÷ ( x ¯ p a r x ¯ p o p ) , defined as the mean defecation rate of the F1 generation of a given crossing scheme ( x ¯ F 1 ) minus the population mean ( x ¯ p o p ), that is the average defecation rate of F2 generations of all 8 crossing schemes, divided by the mean defecation rate of the two parental strains of the given crossing scheme ( x ¯ p a r ) minus the population mean ( x ¯ p o p ).

2.3.7. Fly Midgut and Head Dissections

Fly midgut and head dissections were performed as previously described [27]. Briefly, flies were anesthetized (using CO2) and placed on ice to stay under anesthesia. Midguts and heads of flies were dissected in 1× PBS (130 mM NaCl, 30 mM NaH2PO4, 70 mM Na2HPO4) and immediately placed in dry ice and stored at −80 °C for later use.

2.4. RNA Extraction, cDNA Synthesis and RT-qPCR

The RNA was extracted from 20 midguts and 20 heads per strain per condition per biological replicate using Qiazol (Qiagen). More specifically, 500 μL Qiazol was used per 20 midguts, followed by repeated pipetting and 1 mL Qiazol was used per 20 heads, followed by addition of metal beads and use of the TissueLyser LT machine for 20 min. We used 800 ng of total RNA to synthesize the cDNA using the RQ1 RNase-Free DNase Kit (Promega) according to the manufacturer’s protocol. Reverse transcription was performed using total DNase-treated RNA and the TaKaRa Prime Script RT Master Mix Kit. The qPCR amplification was performed using gene-specific primers with the following amplification program: 95 °C for 2 m (initial denaturation), 40 cycles of 95 °C for 10 s (denaturation), 60 °C for 30 s (annealing, extension) and 65 °C for 1 min (final extension). Primer sequences for each gene are shown in Supplementary Table S1. Expression of the genes of interest was normalized to the expression levels of two reference genes, rpl32 and gapdh1, using the 2−ΔΔCt method. Data were analyzed using the Bio-Rad CFX Manager 3.1 program.

2.5. Immunohistochemistry

Dissected midguts were fixed with 4% formaldehyde (FA) for 30 min and rinsed three times with 1× PBS. Blocking was with 1× PBS, 0.2% Triton-X, 0.5% BSA for 20 min. Primary antibody was mouse anti-Prospero (1:100; MR1A, DSHB, RRID: AB-528440), incubated overnight in the dark at 4 °C. Midguts were washed three times for 10 min in 1× PBS containing 0.2% Triton-X. Secondary antibody against mouse conjugated to Alexa Fluor 488 (DaM488 1:1000, Alexa Fluor #A-21202. RRID AB-141607) were used at 1:1000. Samples were incubated in secondary antibody solution for 2 h at room temperature in the dark, with mild shaking. Midguts were washed three times, mounted on glass microscope slides in 20 μL of Vectashield (Vector), covered with glass coverslips and sealed with nail polish.

2.6. Image Acquisition and Analysis

Stacks of optical sections were acquired using the Leica TCS SP2 DMIRE2 confocal microscope. Prospero positive EE cells were counted under the fluorescent microscope (Zeiss Axioscope A.1) at 20× magnification along the whole midgut. For regional assessment of anterior and posterior midgut, a standard frame of per midgut region per was captured and cropped into 300 × 166 µm.

2.7. Statistical Analysis

The Z-value of each DGRP line (standard deviations above or below the mean) was calculated by subtracting the average number of fecal spots of all 153 strains from the fecal spots of the line and dividing by the standard deviation of the fecal spot number of all 153 strains. For statistical analysis of fly survival, the Kaplan–Meyer method was applied, using the log-rank test (MedCalc statistical software, Ostend, Belgium). For statistical analysis of the defecation rate, the Mann–Whitney U test was applied to groups of six values. When >10 values per sample were available the two-tailed Student’s t-test was used for pairwise comparisons. For statistical analysis of CFUs, we used two-way ANOVA test with Tukey’s post-hoc correction. The RT-qPCR experiments were performed in six biological replicates, two technical replicates each, analyzed via t-test. Error bars throughout represent standard deviation of the mean. Significance is indicated by * p < 0.05, ** p < 0.01, *** p < 0.001; ns, not statistically significant.

3. Results

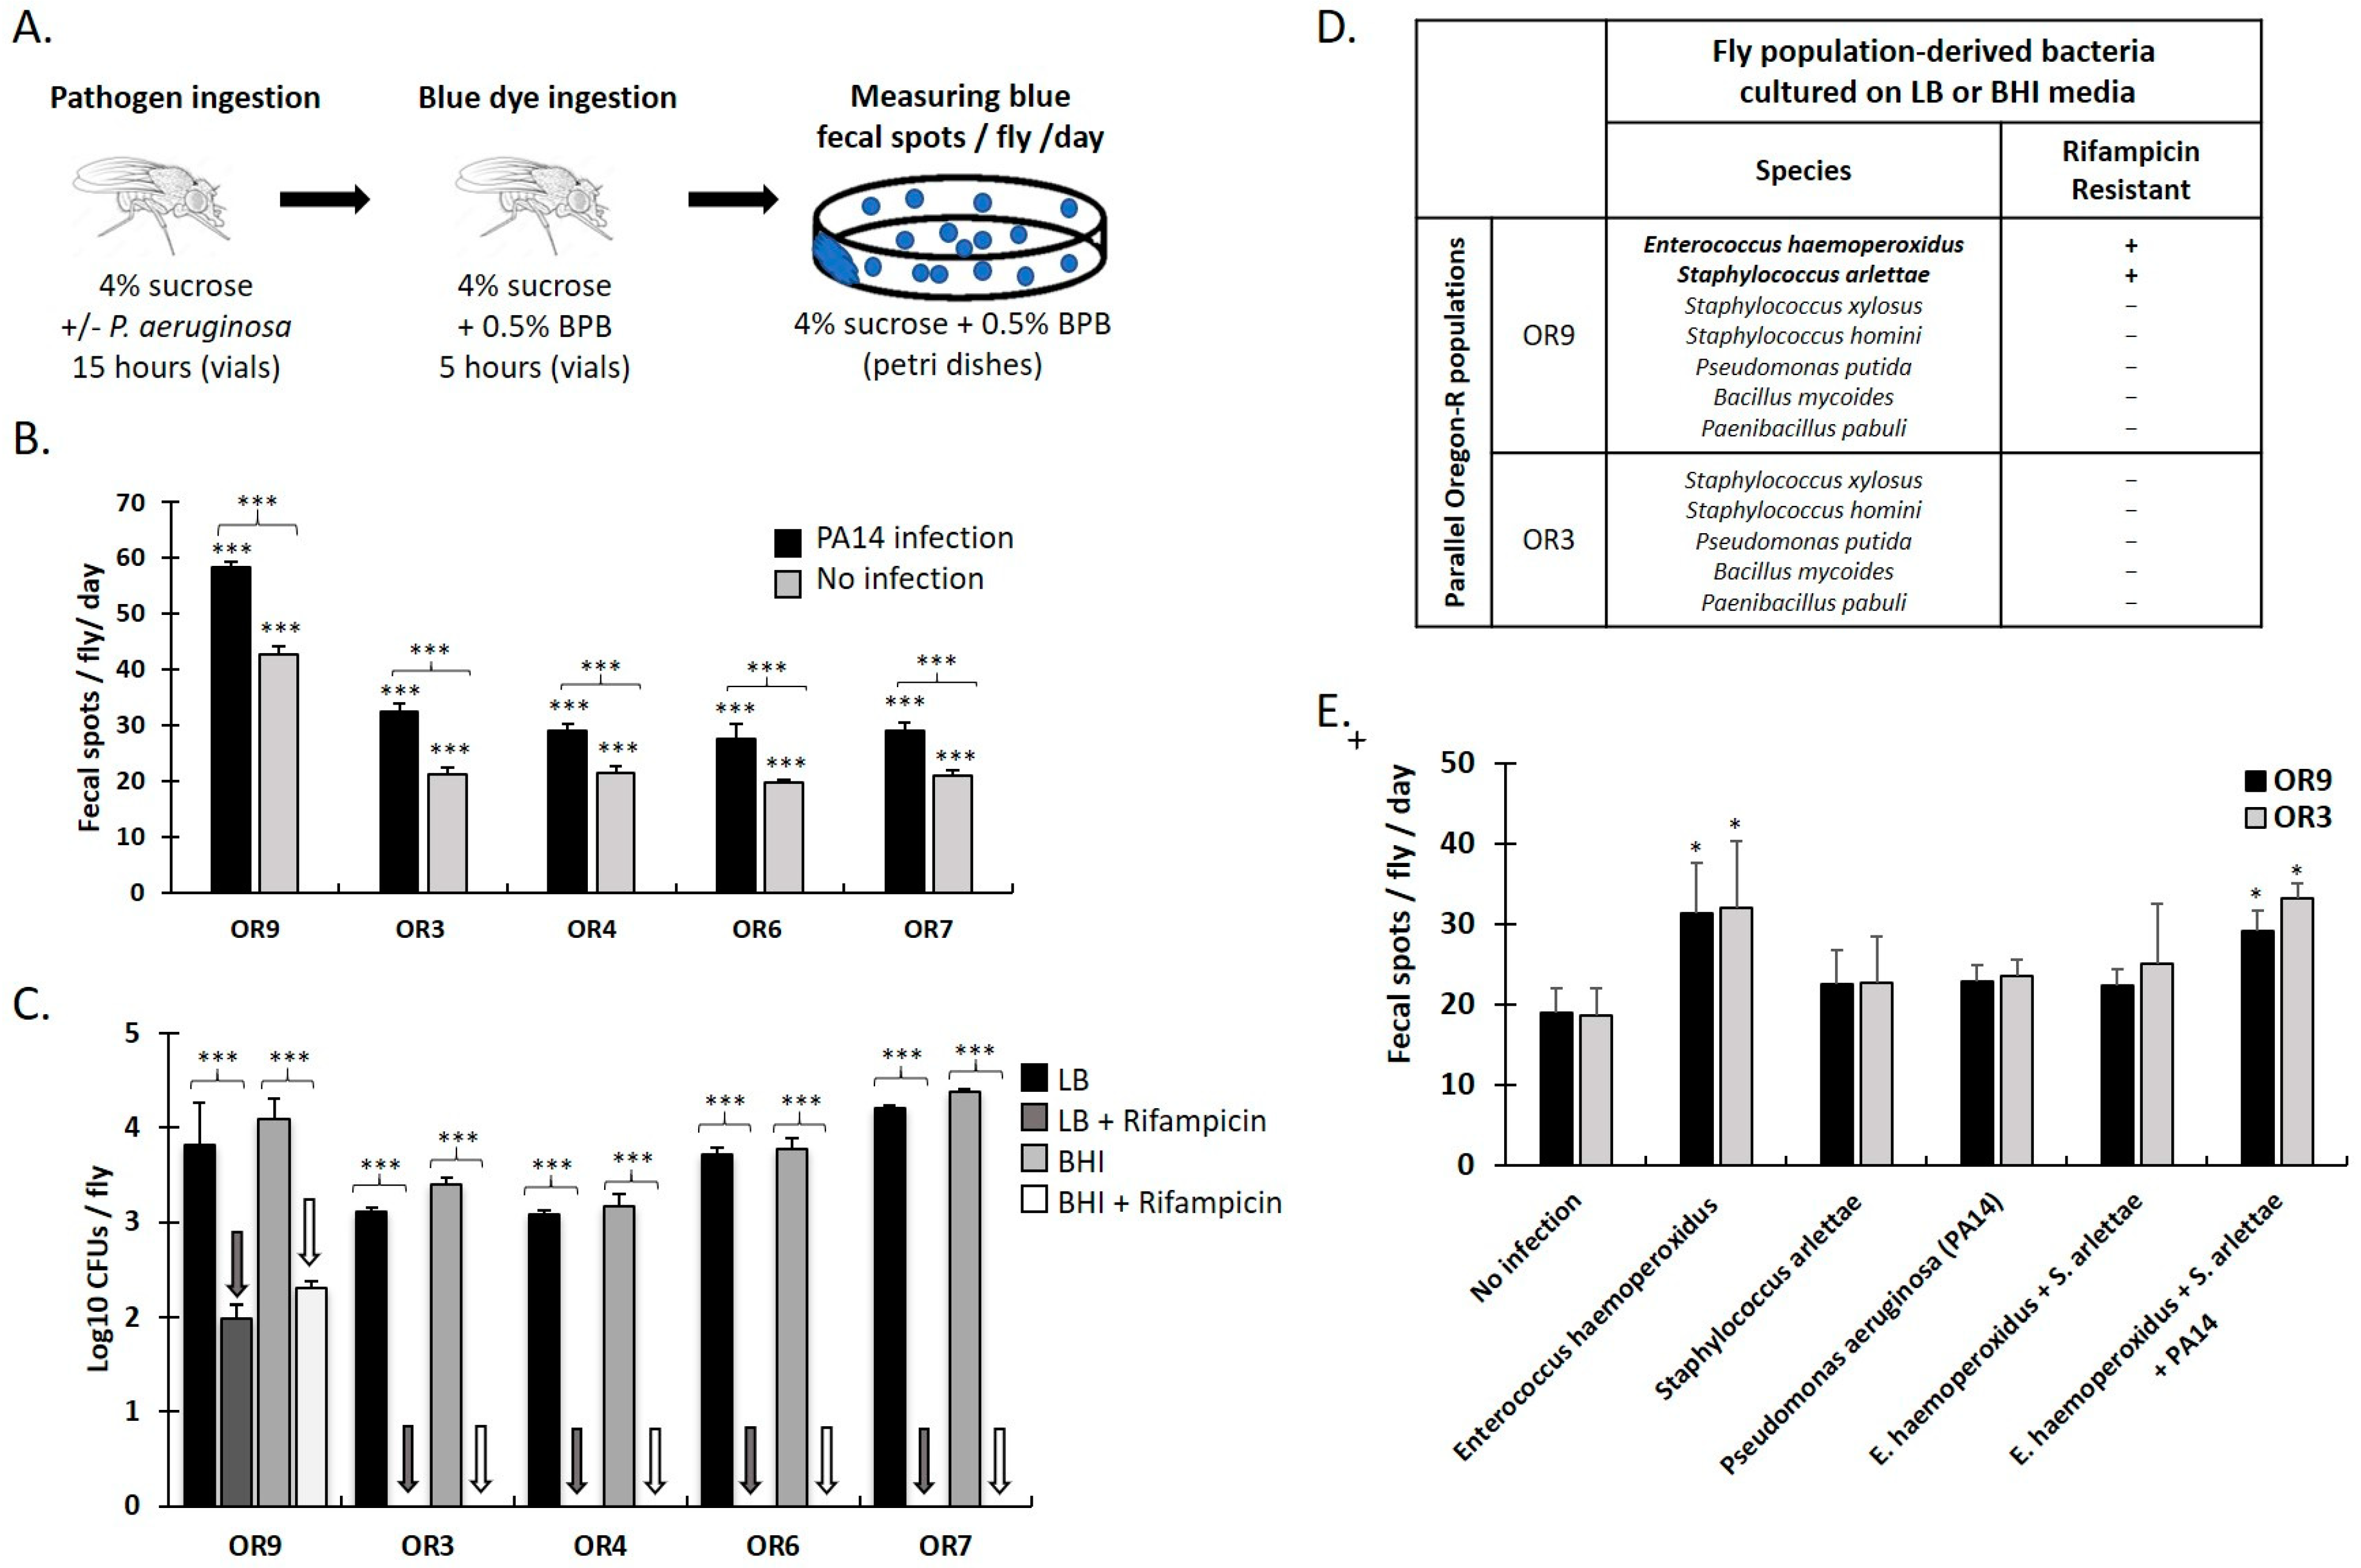
3.1. Specific Gut Microbiota Composition and Virulent Bacteria Ingestion Increase Defecation Rate in Drosophila Females

We customized a Drosophila gut motility proxy assay that enables fast, accurate and reproducible assessment of the deposition rate of female excreta (fecal spots per fly per day), as a function of dietary input, ingested or indigenous microbes, and host genetic background (Figure 1A).
We have previously established that P. aeruginosa and other bacteria found in humans can colonize and damage the fly intestine. Some of them can also kill Drosophila within a few days, while others within three weeks [11]. Populations of Oregon-R (OR) flies, reared in parallel in the lab for one year, were sampled and assessed while untreated or upon ingestion of an infection mix containing P. aeruginosa (strain PA14). The defecation rate of OR flies sampled from one population (hereunto referred to as OR9) was approximately two-fold higher, compared to that of all other sampled OR populations examined (Figure 1B). Moreover, for all sampled OR populations, the defecation rate was increased upon ingestion of PA14 by an average of 29% (Figure 1B). To examine whether the higher defecation rate in OR9 flies was due to differences in the number or the composition of intestinal bacteria, the CFUs developed on LB and BHI media were measured in the absence or presence of rifampicin, a broad-spectrum bactericidal antibiotic [31,32]. Figure 1C shows that flies from all OR populations harbored 3.1–4.2 and 3.2–4.4 log10 CFUs per fly, assessed using LB and BHI plates, respectively, without using an antibiotic. Rifampicin addition in plate media eliminated CFUs from all plates, except those of the OR9 population samples, which harbored 1.9 and 2.3 log10 CFUs per fly, assessed using LB and BHI plates, respectively. Thus, the composition of cultured gut bacteria differed significantly between OR9 and the rest of the OR populations.
To identify bacterial species selectively present in the OR9 versus the control OR3 population, we isolated all morphologically distinct colonies we could find in each population upon plating on LB and BHI media. The OR9 population contained seven morphologically distinct colonies, two of which were resistant to rifampicin, as opposed to the OR3 population that contained five morphologically distinct colonies, none of which could grow on rifampicin plates. We then performed colony PCR by extracting genomic DNA from single colonies of each morphological type, amplifying and sequencing PCR fragments corresponding to the 16S rRNA gene using pan-bacterial primers. The BLAST search of the sequences revealed five rifampicin-sensitive bacterial species, common to both OR9 and OR3, namely, Staphylococcus xylosus, Staphylococcus homini, Pseudomonas putida, Bacillus mycoides and Paenibacillus pabuli and two rifampicin-resistant strains exclusive to OR9, E. haemoperoxidus and S. arlettae (Figure 1D). To assess the impact of rifampicin-resistant strains on gut motility, germ-free OR9 and OR3 adult female flies were fed with E. haemoperoxidus, S. arlettae and P. aeruginosa (PA14) either alone or in various combinations, at equal concentrations of each bacterial strain. As shown in Figure 1E, the defecation rate was not significantly different between germ-free OR9 and OR3 female flies under any treatment, confirming that the two fly populations remained genetically comparable. However, the defecation rate significantly increased upon ingestion of E. haemoperoxidus either alone or in a triple combination with S. arlettae and PA14. Thus, ingestion of PA14 by flies bearing microbiota, as well as ingestion of E. haemoperoxidus by germ free flies can increase fly gut motility.

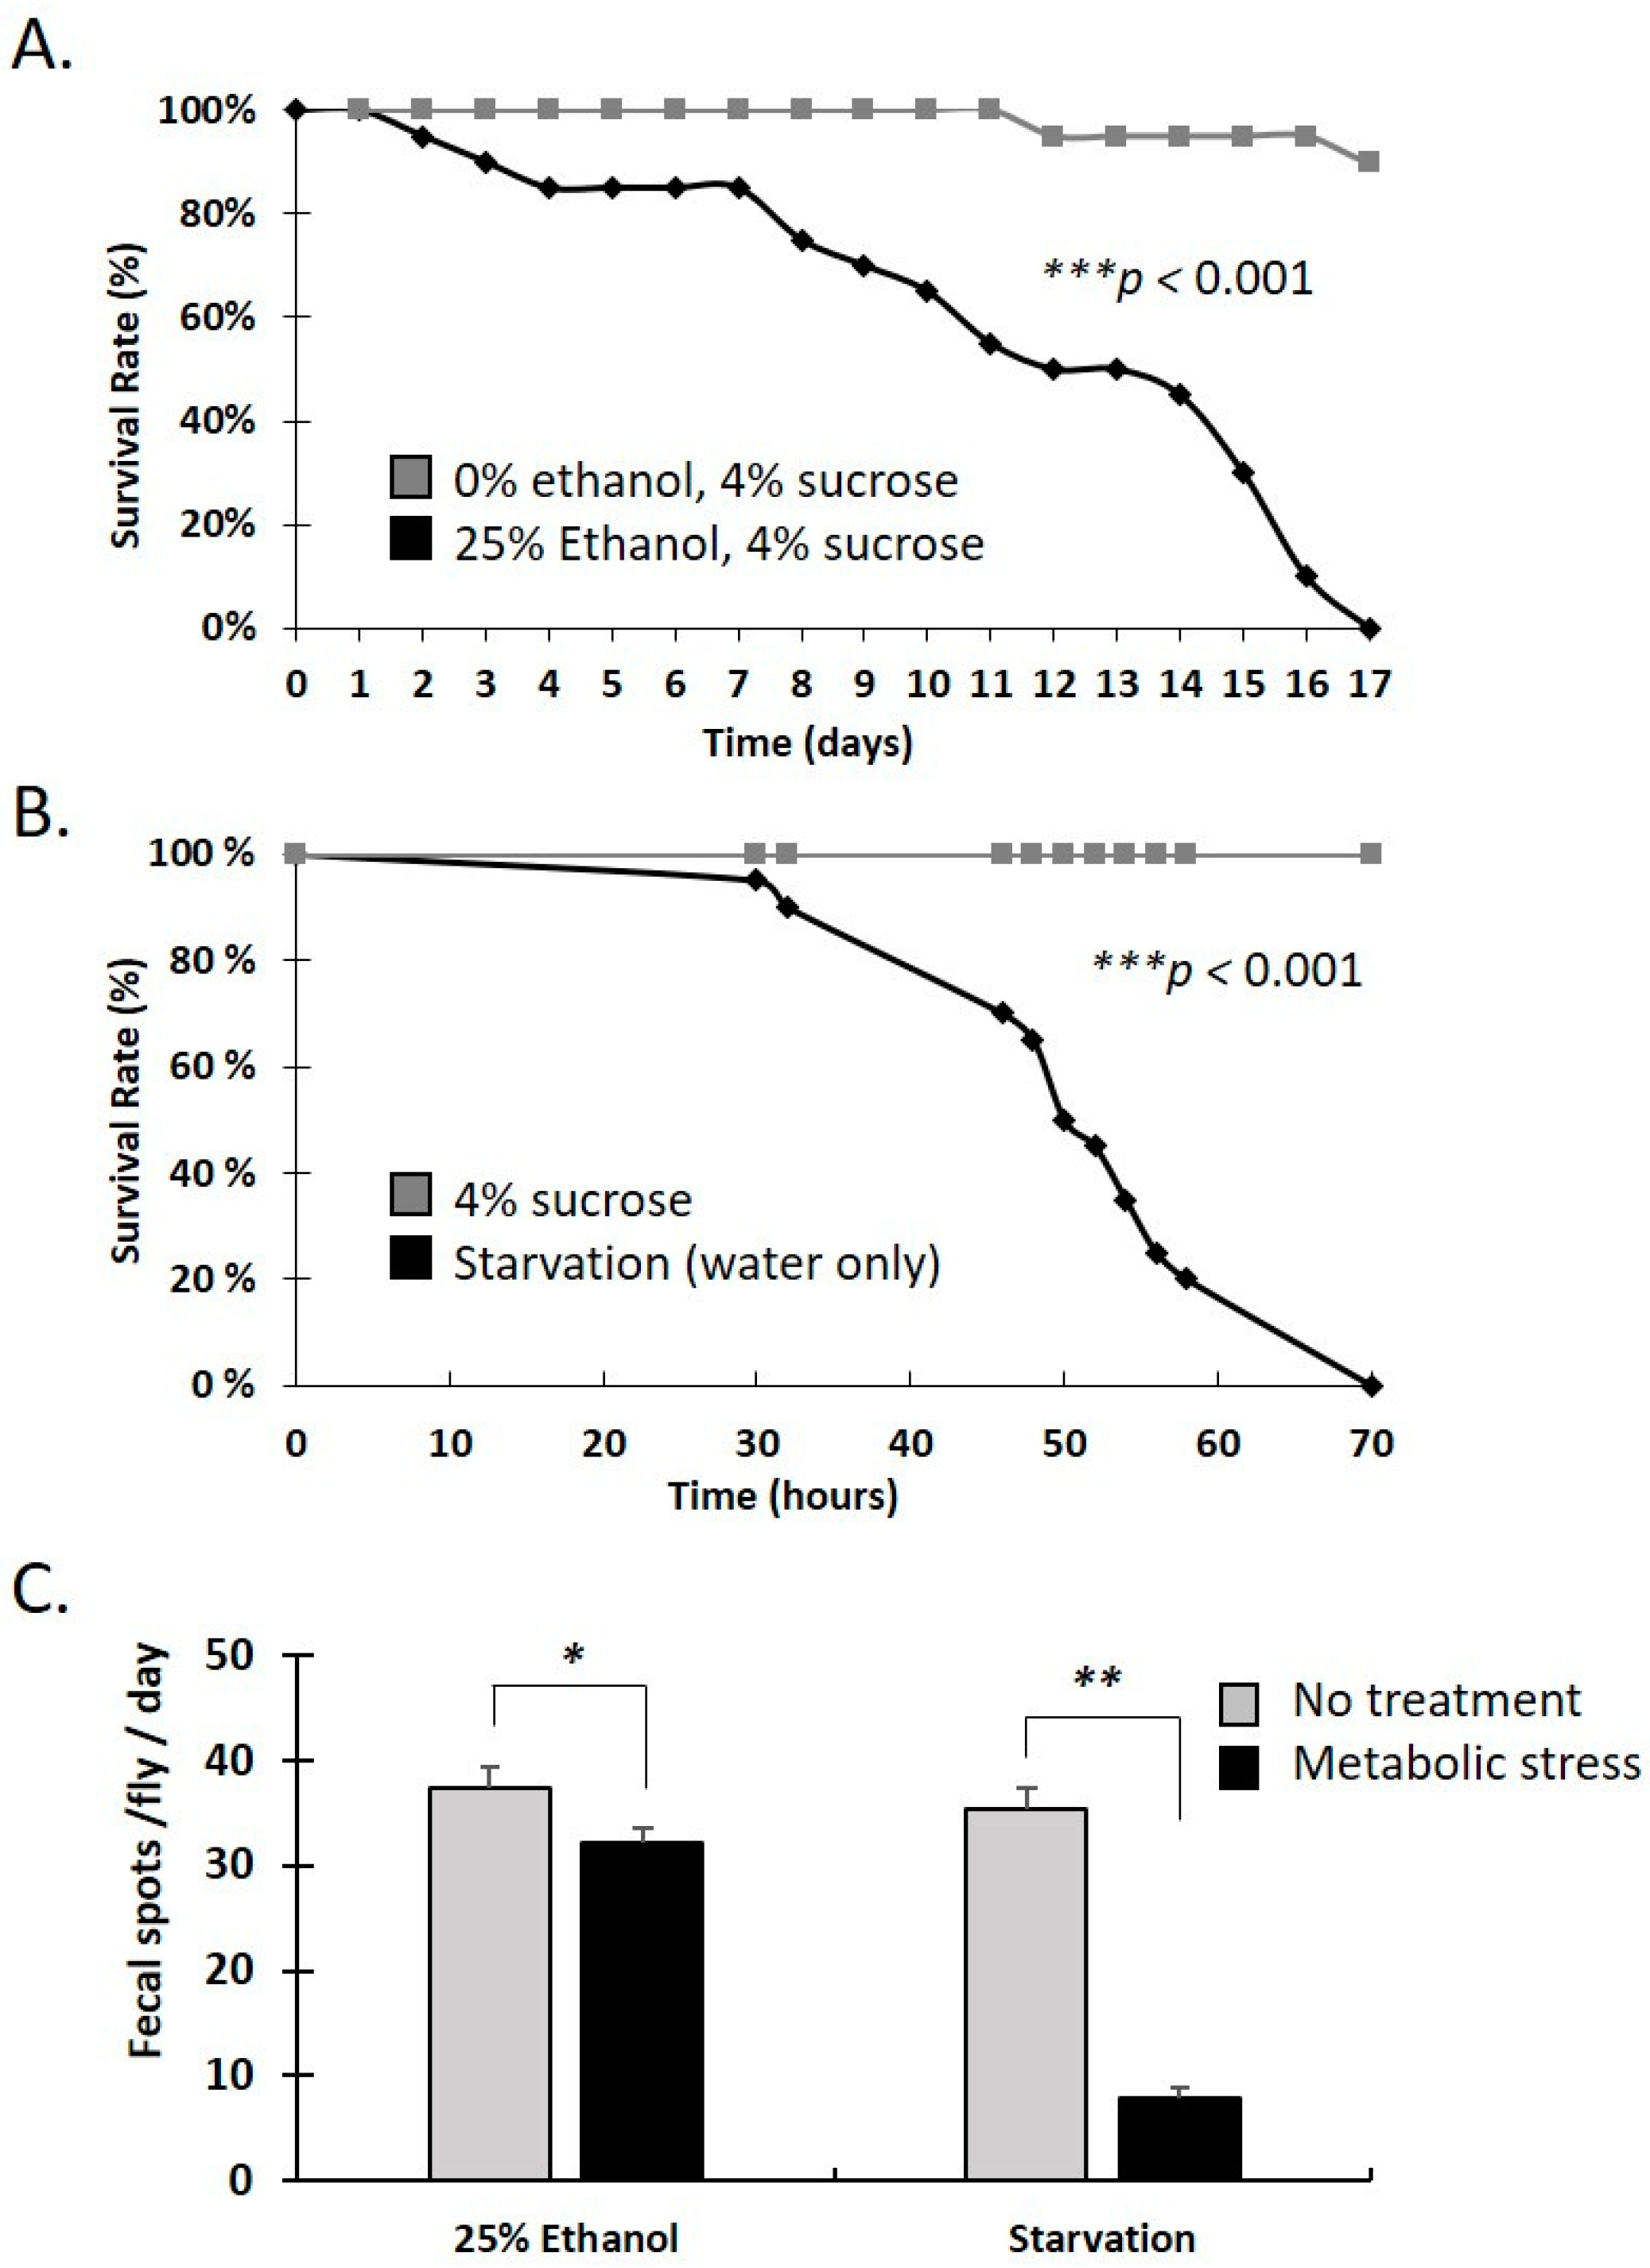
3.2. Water-Only and Ethanol-Containing Food Reduce Lifespan and Defecation Rate in Female Adults

Starvation, ethanol consumption and other dietary stressors can impose long-lasting metabolic changes [33]. To assess the impact of dietary stresses, we measured fly survival rate over time upon ethanol consumption and water-only food. As shown in Figure 2A, flies consuming fly food containing 25% ethanol started dying at 2 days, reaching 50% mortality by 12 days and 100% mortality by 17 days (Figure 2A).
On the other hand, water-only consuming flies started dying at around 30 h, reaching 50% mortality by 50 h and 100% mortality by 70 h (Figure 2B). Thus, water-only consumption exerted a much more severe stress on flies compared to the 25% ethanol containing diet.
To assess the effect of dietary stress on gut motility, fly defecation rate was measured following the 25% ethanol, 4% sucrose diet vs. 4% sucrose only as a control. Similarly, starvation (water-only) was compared to feeding on a 4% sucrose diet. As shown in Figure 2C, the 25% ethanol diet reduced defecation rate by ~14%, whereas water-only starvation by ~78%. Assessment for both treatments was performed at 24 h, a time point preceding the initiation of fly mortality under any of the treatments (Figure 2A,B). Therefore, water-only, and ethanol-containing food, reduce defecation rate within hours, analogous to their later impact on fly survival.

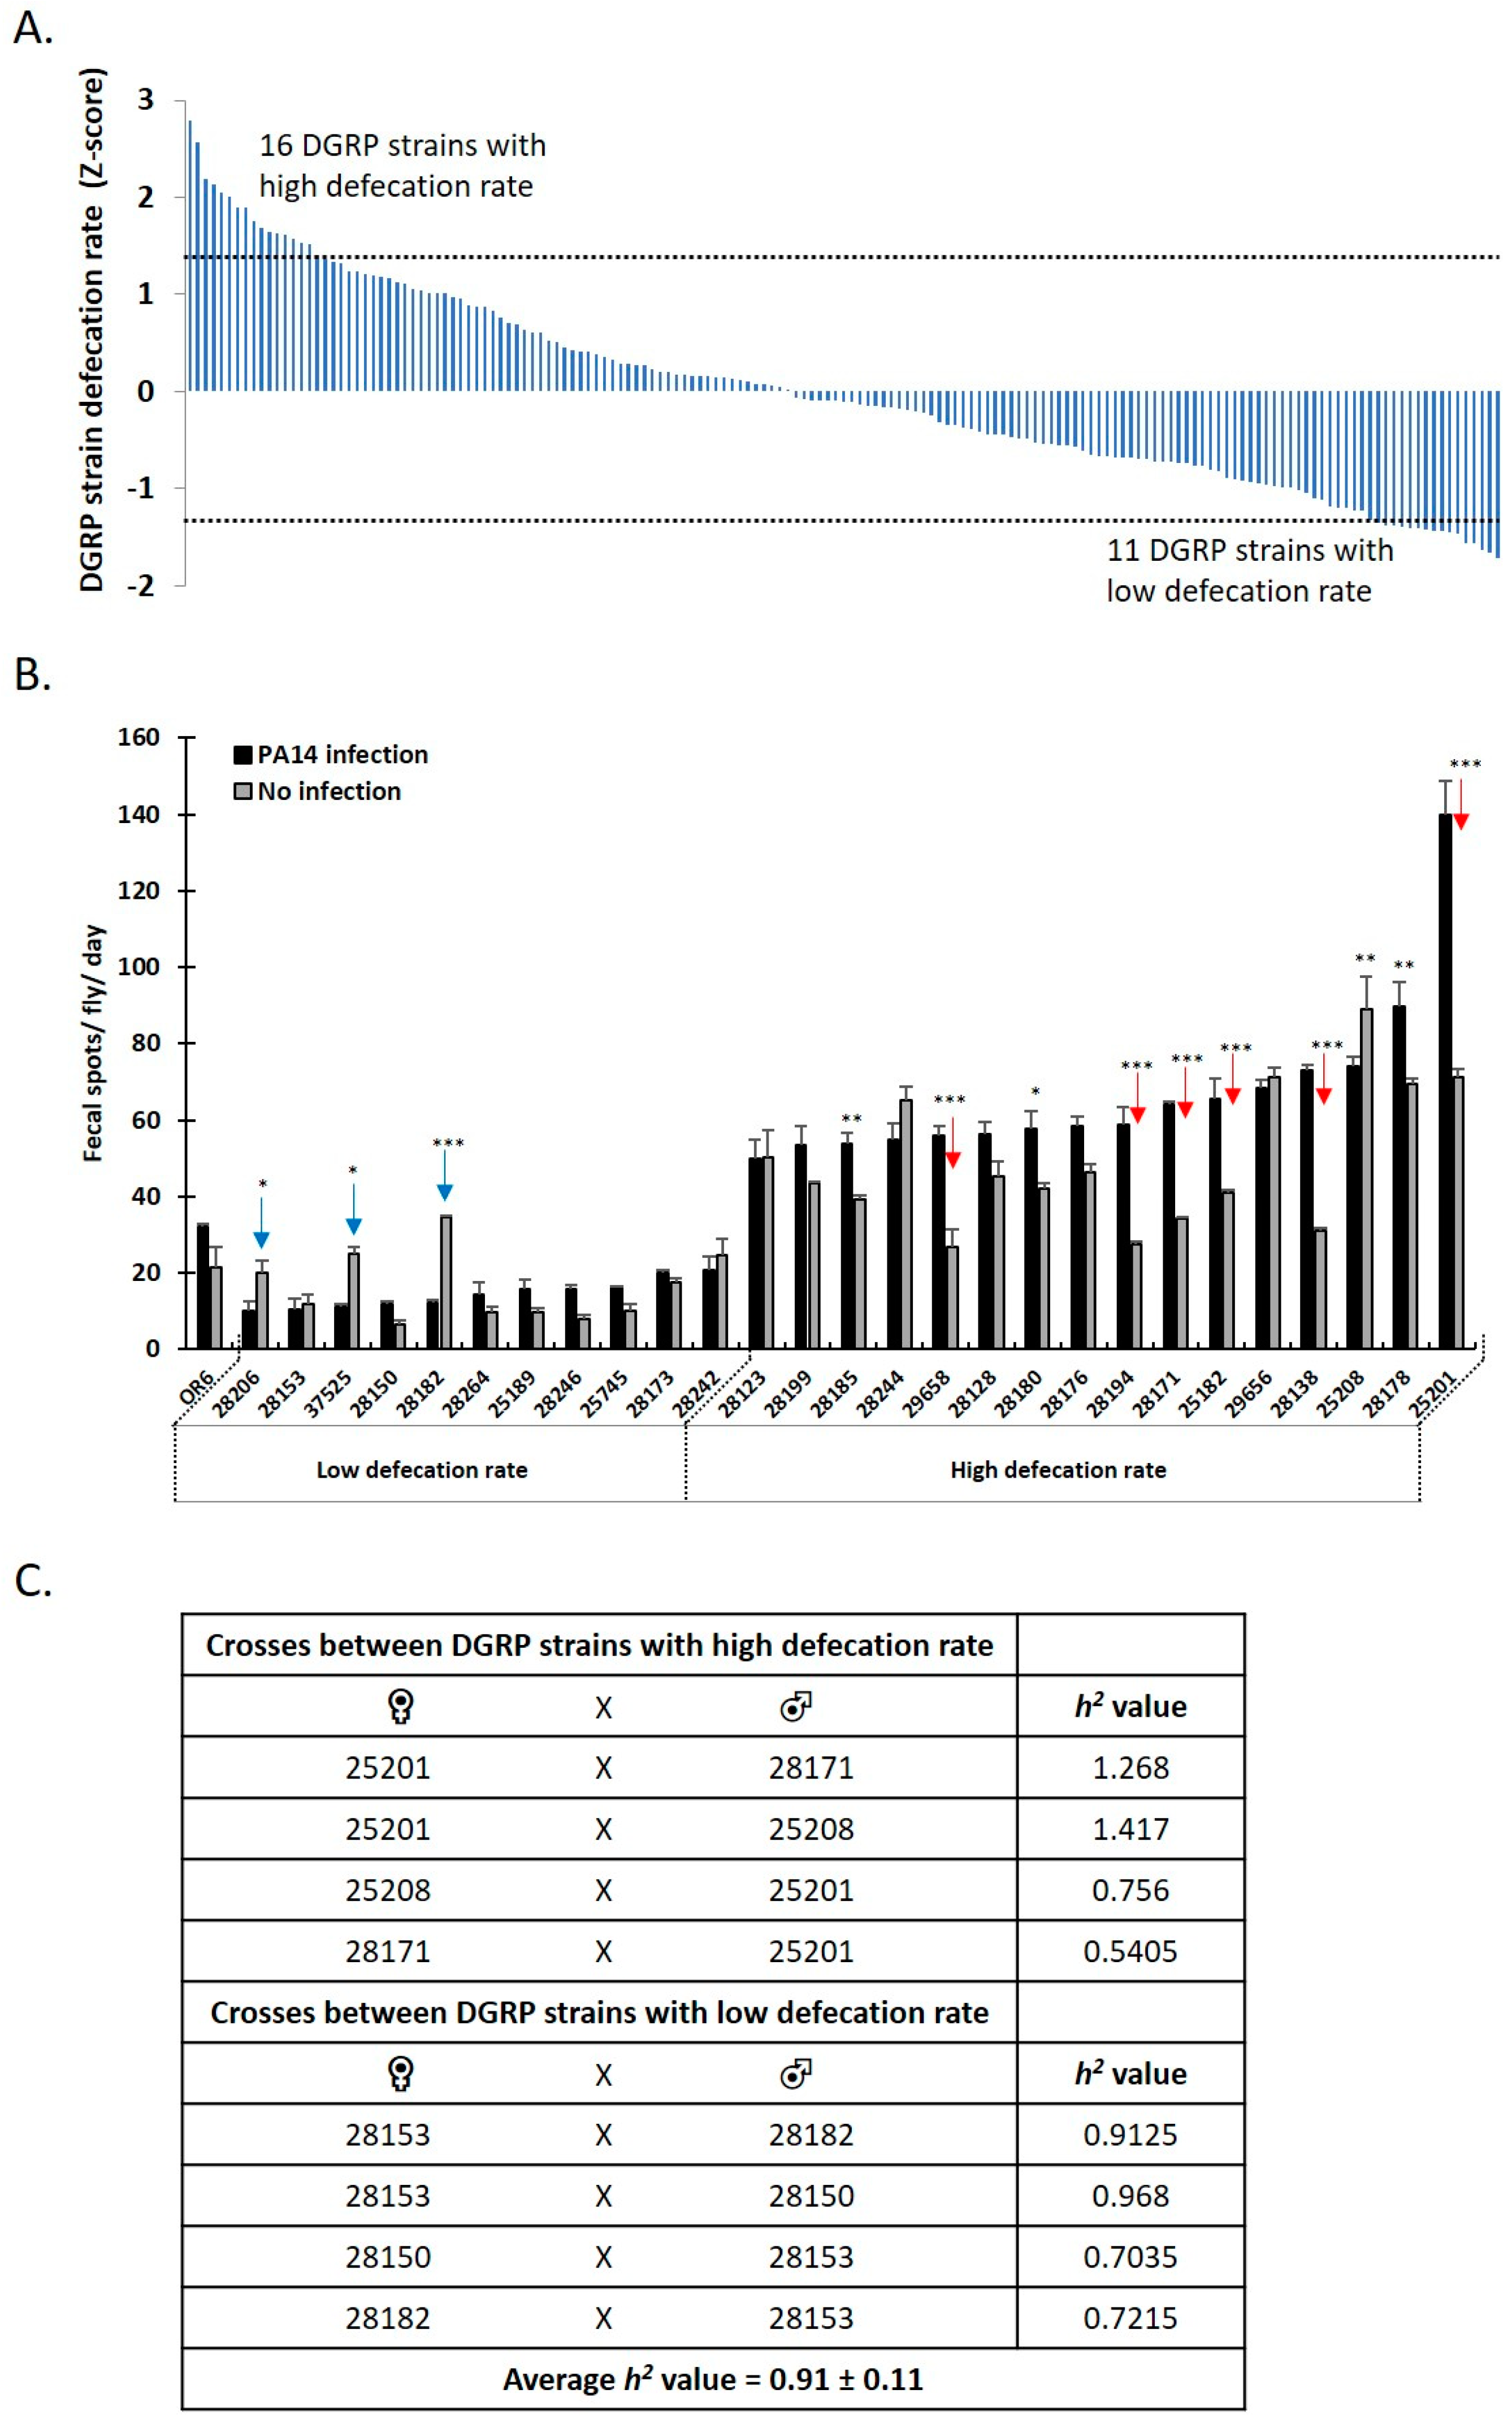
3.3. Genome Wide Analysis Reveals the Genetic Basis of Female Drosophila Defecation

Previous work in Drosophila has shown that genetic variability results in markedly different responses to environmental stresses, with some fly strains exhibiting poor homeostatic ability and metabolism control, while others remain relatively stable across environments [33]. To gain further insight into the impact of genetic background on fly defecation rate, 150 wild-type inbred lines of the Drosophila Genetic Reference Panel (DGRP) [29] were screened upon ingestion of an infection mix containing PA14. The Z-score analysis underscored the phenotypic continuity of the trait, which ranged between 4.28 standard deviations of the mean (SDs) (Figure 3A).
Strains deviating by ≥1.25 SDs above or below the mean were selected, corresponding to 16 strains exhibiting the highest and 11 strains exhibiting the lowest defecation rates (Figure 3A). Six out of the 16 strains displaying high defecation rates (red arrows in Figure 3B) and three out of the 11 strains displaying low defecation rates (blue arrows in Figure 3B) exhibited ≥2-fold change in the defecation rate due to infection. Overall, 13 out of the 27 strains displaying high or low defecation rates exhibited a significant change in the defecation rate due to infection (asterisks in Figure 3B). These results clearly indicate that genetic factors and intestinal infection can have a significant contribution to the determination of the defecation rate.
To quantify the contribution of genetic factors in our defecation rate assay, we determined the narrow sense heritability ( h 2 ), that is, the fraction of phenotypic variation attributed to the additive effects of genes [34]. As shown in Figure 3C, a total of eight crossing schemes were performed: four between DGRP strains displaying high defecation rates (25201, 28171 and 25208) and four between DGRP strains displaying low defecation rates (28182, 28150 and 28153). Both the parents’ and offspring’s defecation rates were then determined and used to calculate the h 2 value for each crossing scheme (see Methods). As shown in Figure 3C, h 2 values ranged between 0.54 and 1.27, while the h 2 average value was 0.91 ± 0.11 (standard error). This indicates that even though single crossing scheme calculations of h 2 vary from one to another, the average phenotypic variation is close to 1, and, thus, attributable to variations in additive gene alleles. This agrees with previous work showing that a significant component of the genetic variance of a trait is additive, when considering populations with many loci at extreme allele frequencies [34].
We then proceeded with a genome wide association study (GWAS) to pinpoint specific genes associated with defecation rate, using the DGRP GWAS Webtool (http://dgrp2.gnets.ncsu.edu/, accessed on 1 January 2023). This analysis led to the identification of 17 genes, many of which were linked to more than one SNP (Table 1).
Fourteen out of the total 17 GWAS-identified genes (excluding the basement membrane forming genes vkg and pxn and the miRNA gene mir-971) were further functionally assessed as genetic determinants of the defecation rate.

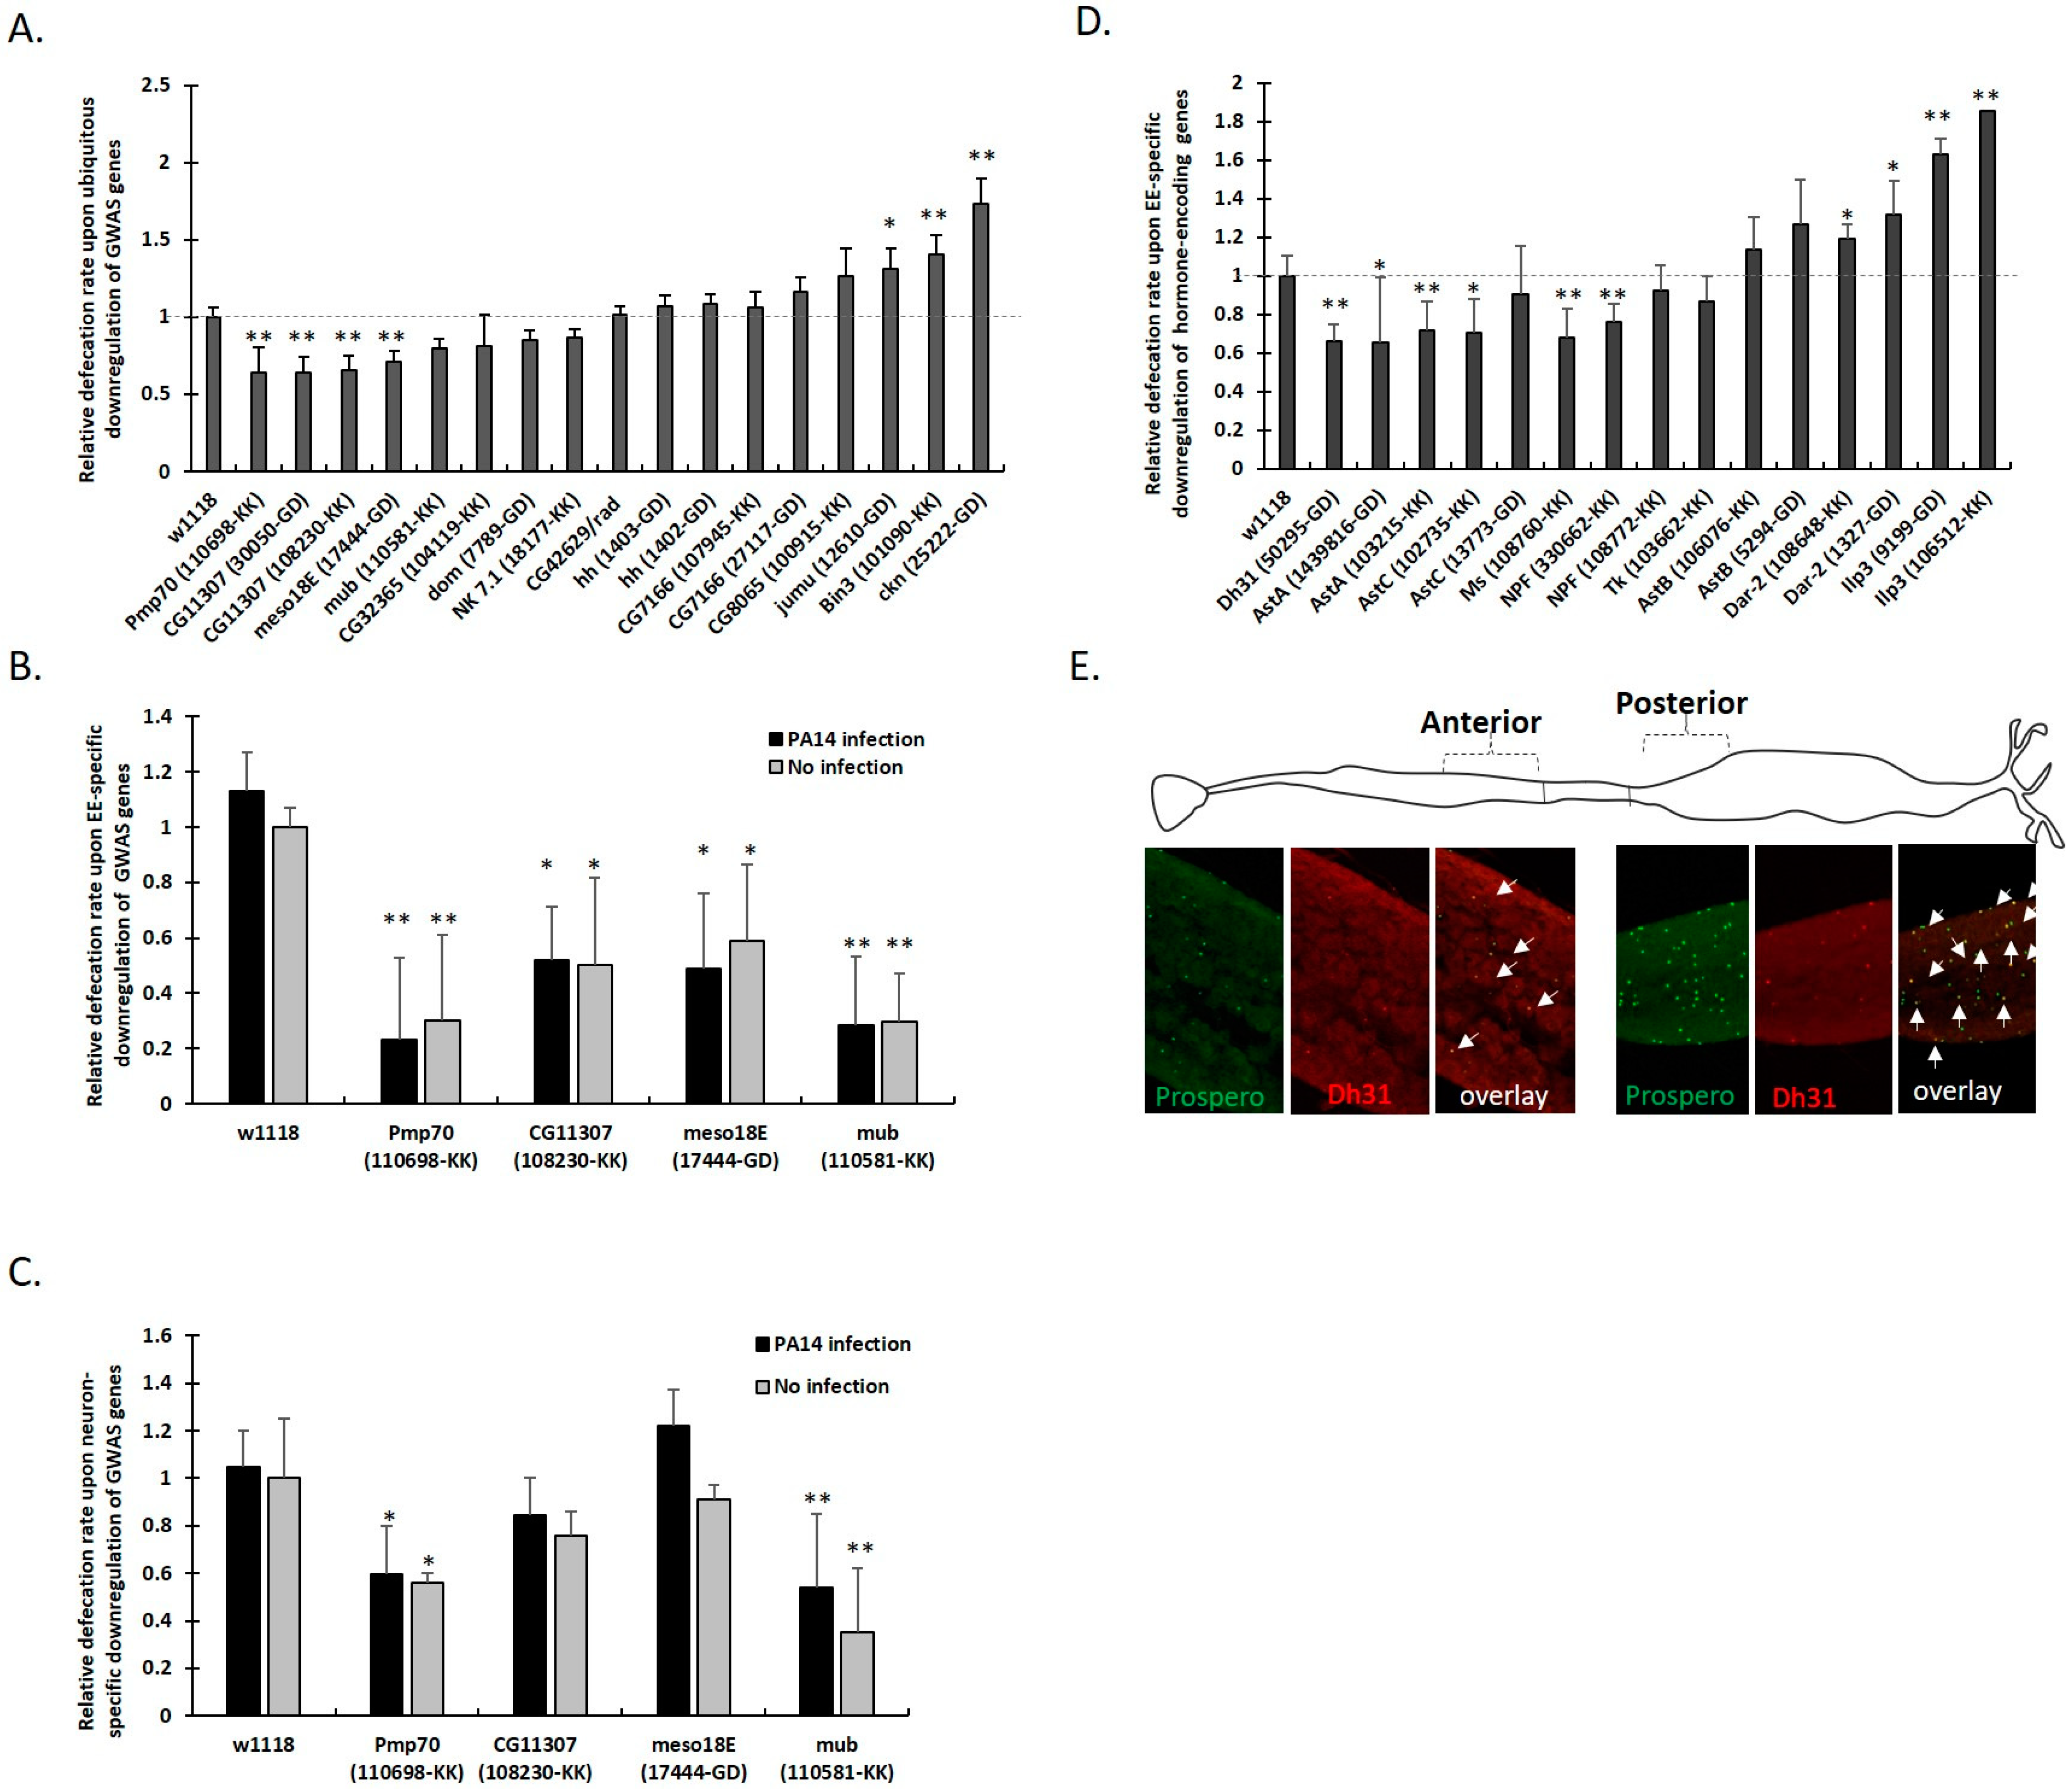
3.4. Defecation Rate Is Controlled in Female Midgut EEs and Neurons by GWAS-Identified and Hormone-Encoding Genes

To functionally validate genes identified through GWAS analysis, we crossed the corresponding UAS-RNAi lines—obtained from the Vienna Drosophila Research Center (VDRC)—with the ubiquitous Gal4 driver line, act-Gal4. Defecation rates were evaluated for each offspring and mean values were divided by those of the control (act-Gal4 crossed with w1118). As shown in Figure 4A, ubiquitous downregulation of Pmp70, CG11307, meso18E and mub decreased defecation rates, while that of Bin3, ckn and jumu increased defecation rates (Figure 4A).
To determine whether the inducers of defecation rate, Pmp70, CG11307, meso18E and mub, have a more direct involvement in the regulation of the gut-brain axis, we selectively downregulated them in either the midgut EEs via prosV1-Gal4 or in all neurons via elav-Gal4. Selective downregulation of all four genes in EEs (Figure 4B) and of Pmp70 and mub in all neurons (Figure 4C) decreased the defecation rate, irrespective of the infection status, suggesting that these genes are critical for hormonal signaling along the gut-brain axis.
To delineate the communication between midgut and neurons, we assessed the role of nine Drosophila hormone related genes expressed in the Drosophila neurons and midgut EEs, namely, AstA, AstB, AstC, Dh31, NPF, Dar2, Tk, Ms and insulin-like peptide 3 (ilp3) [21,23,35,36,37]. Downregulation of AstA, AstC, Dh31, NPF, and Ms in EEs led to decreased defecation rates, while downregulation of Dar2 and ilp3 led to increased defecation rates (Figure 4D and Figure S1A).
Co-localization of GFP with anti-prospero staining of Dh31-Gal4 UAS-gfp flies confirmed that Dh31 is expressed mainly in a subset of posterior midgut EEs and less so in a subset of anterior EEs (Figure 4E) [14,15,38]. The reduced defecation rate resulting from Dh31 downregulation in EEs (Supplementary Figure S1A) correlates with the reduced defecation rate observed upon downregulation of Dh31 receptor (Dh31R) in the visceral muscle (VM) using the 24B-Gal4 (Supplementary Figure S1B). Moreover, downregulation of either Dh31 or Dh31R in neurons, also led to reduced defecation rates (Supplementary Figure S1C). In conclusion: (a) expression of AstA, AstC, NPF, Ms and Dh31 in EEs induces defecation rate, (b) Dh31 signals from midgut EEs to its receptor in the VM, increasing the defecation rate, and presumably midgut muscle contractions, as previously reported [14], and (c), Dh31-expressing neurons can induce defecation rate via signaling to Dh31R-expressing neurons.

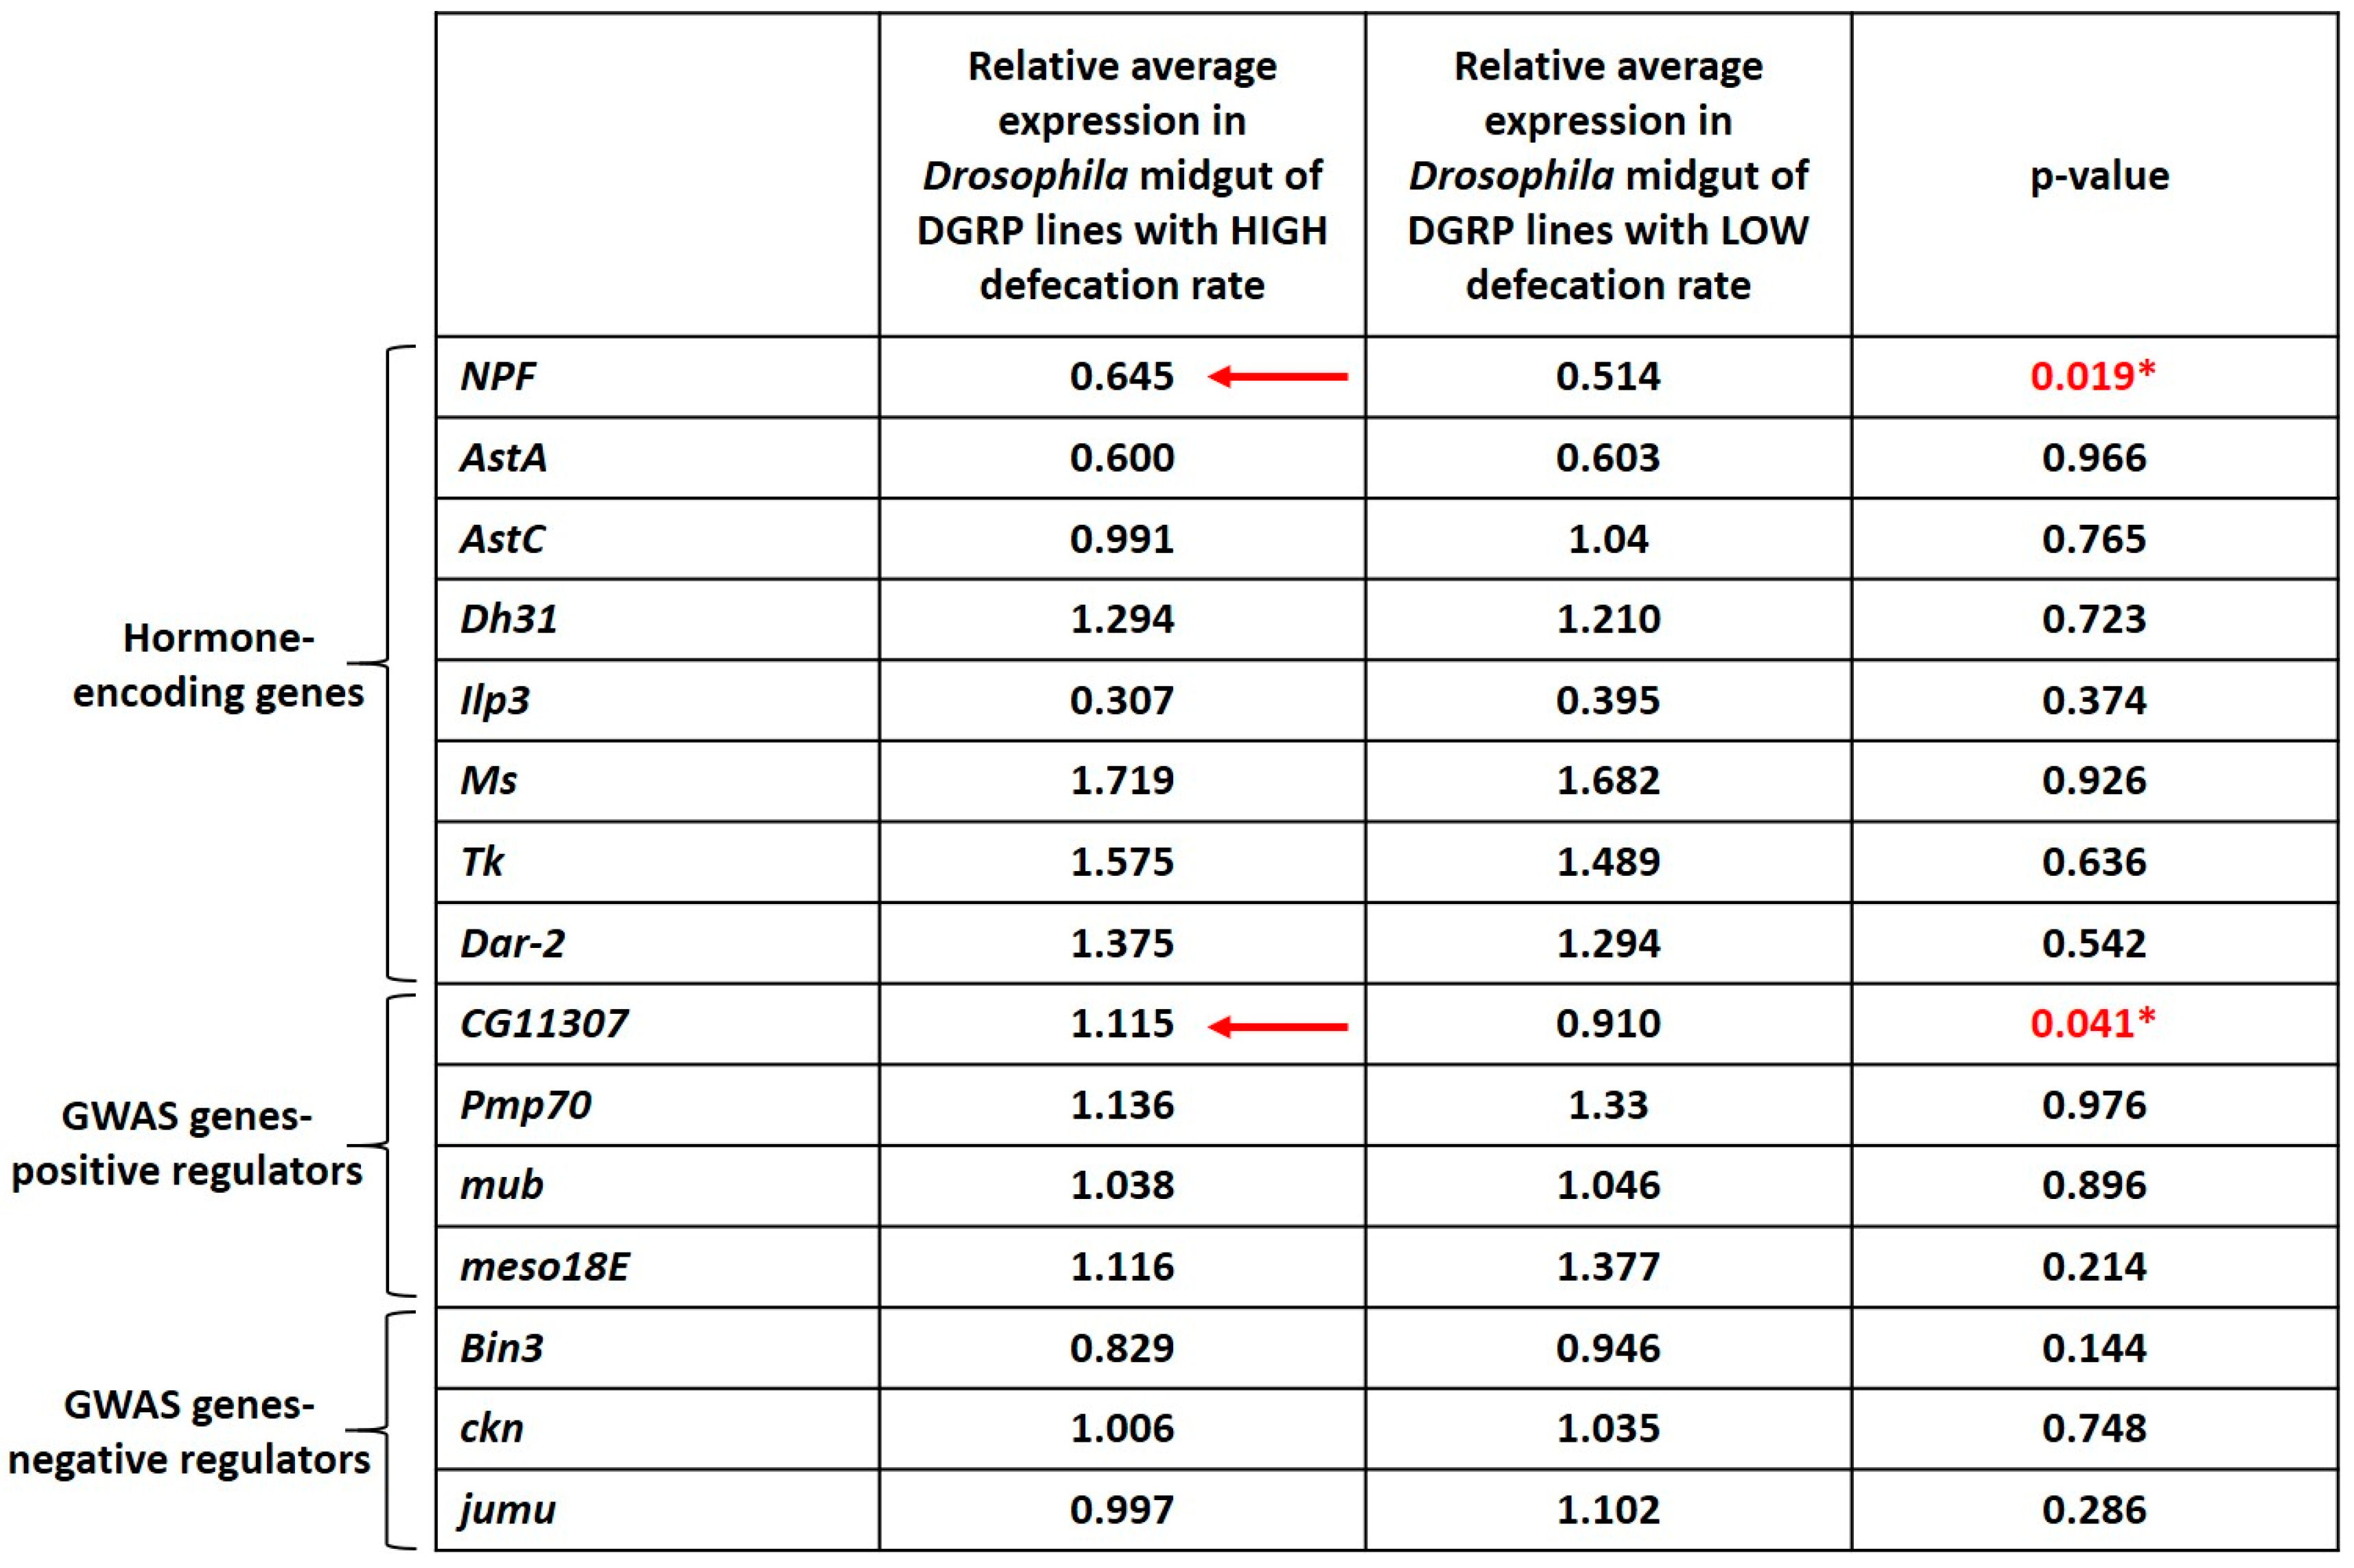
3.5. Higher Expression of NPF and CG11307 in DGRP Lines Displaying High Defecation Rates

To associate genes to defecation rate in an alternative way, we assessed midgut expression of seven GWAS-identified (4 positive regulators, Pmp70, CG11307, mub, meso18E, and 3 negative regulators, Bin3, ckn, jumu) and eight hormone-encoding genes (AstA, AstC, Dh31, NPF, Dar2, Tk, Ms, ilp3) comparing expression between a group of eight high and a group of eight low defecation rate DGRP strains. As shown in Figure 5, gene expression of NPF, was increased on average in DGRP lines displaying higher defecation rate.
This agrees with previous work, showing that NPF acts as a hunger signal, promoting wakefulness and adult feeding, which in turn may enhance gut motility and defecation rate [36]. Moreover, expression of CG11307, a novel gene identified through our GWAS, displayed a similar pattern, that is, a higher expression in the high defecation rate strains (Figure 5), further supporting the role of this gene in controlling defecation rate.

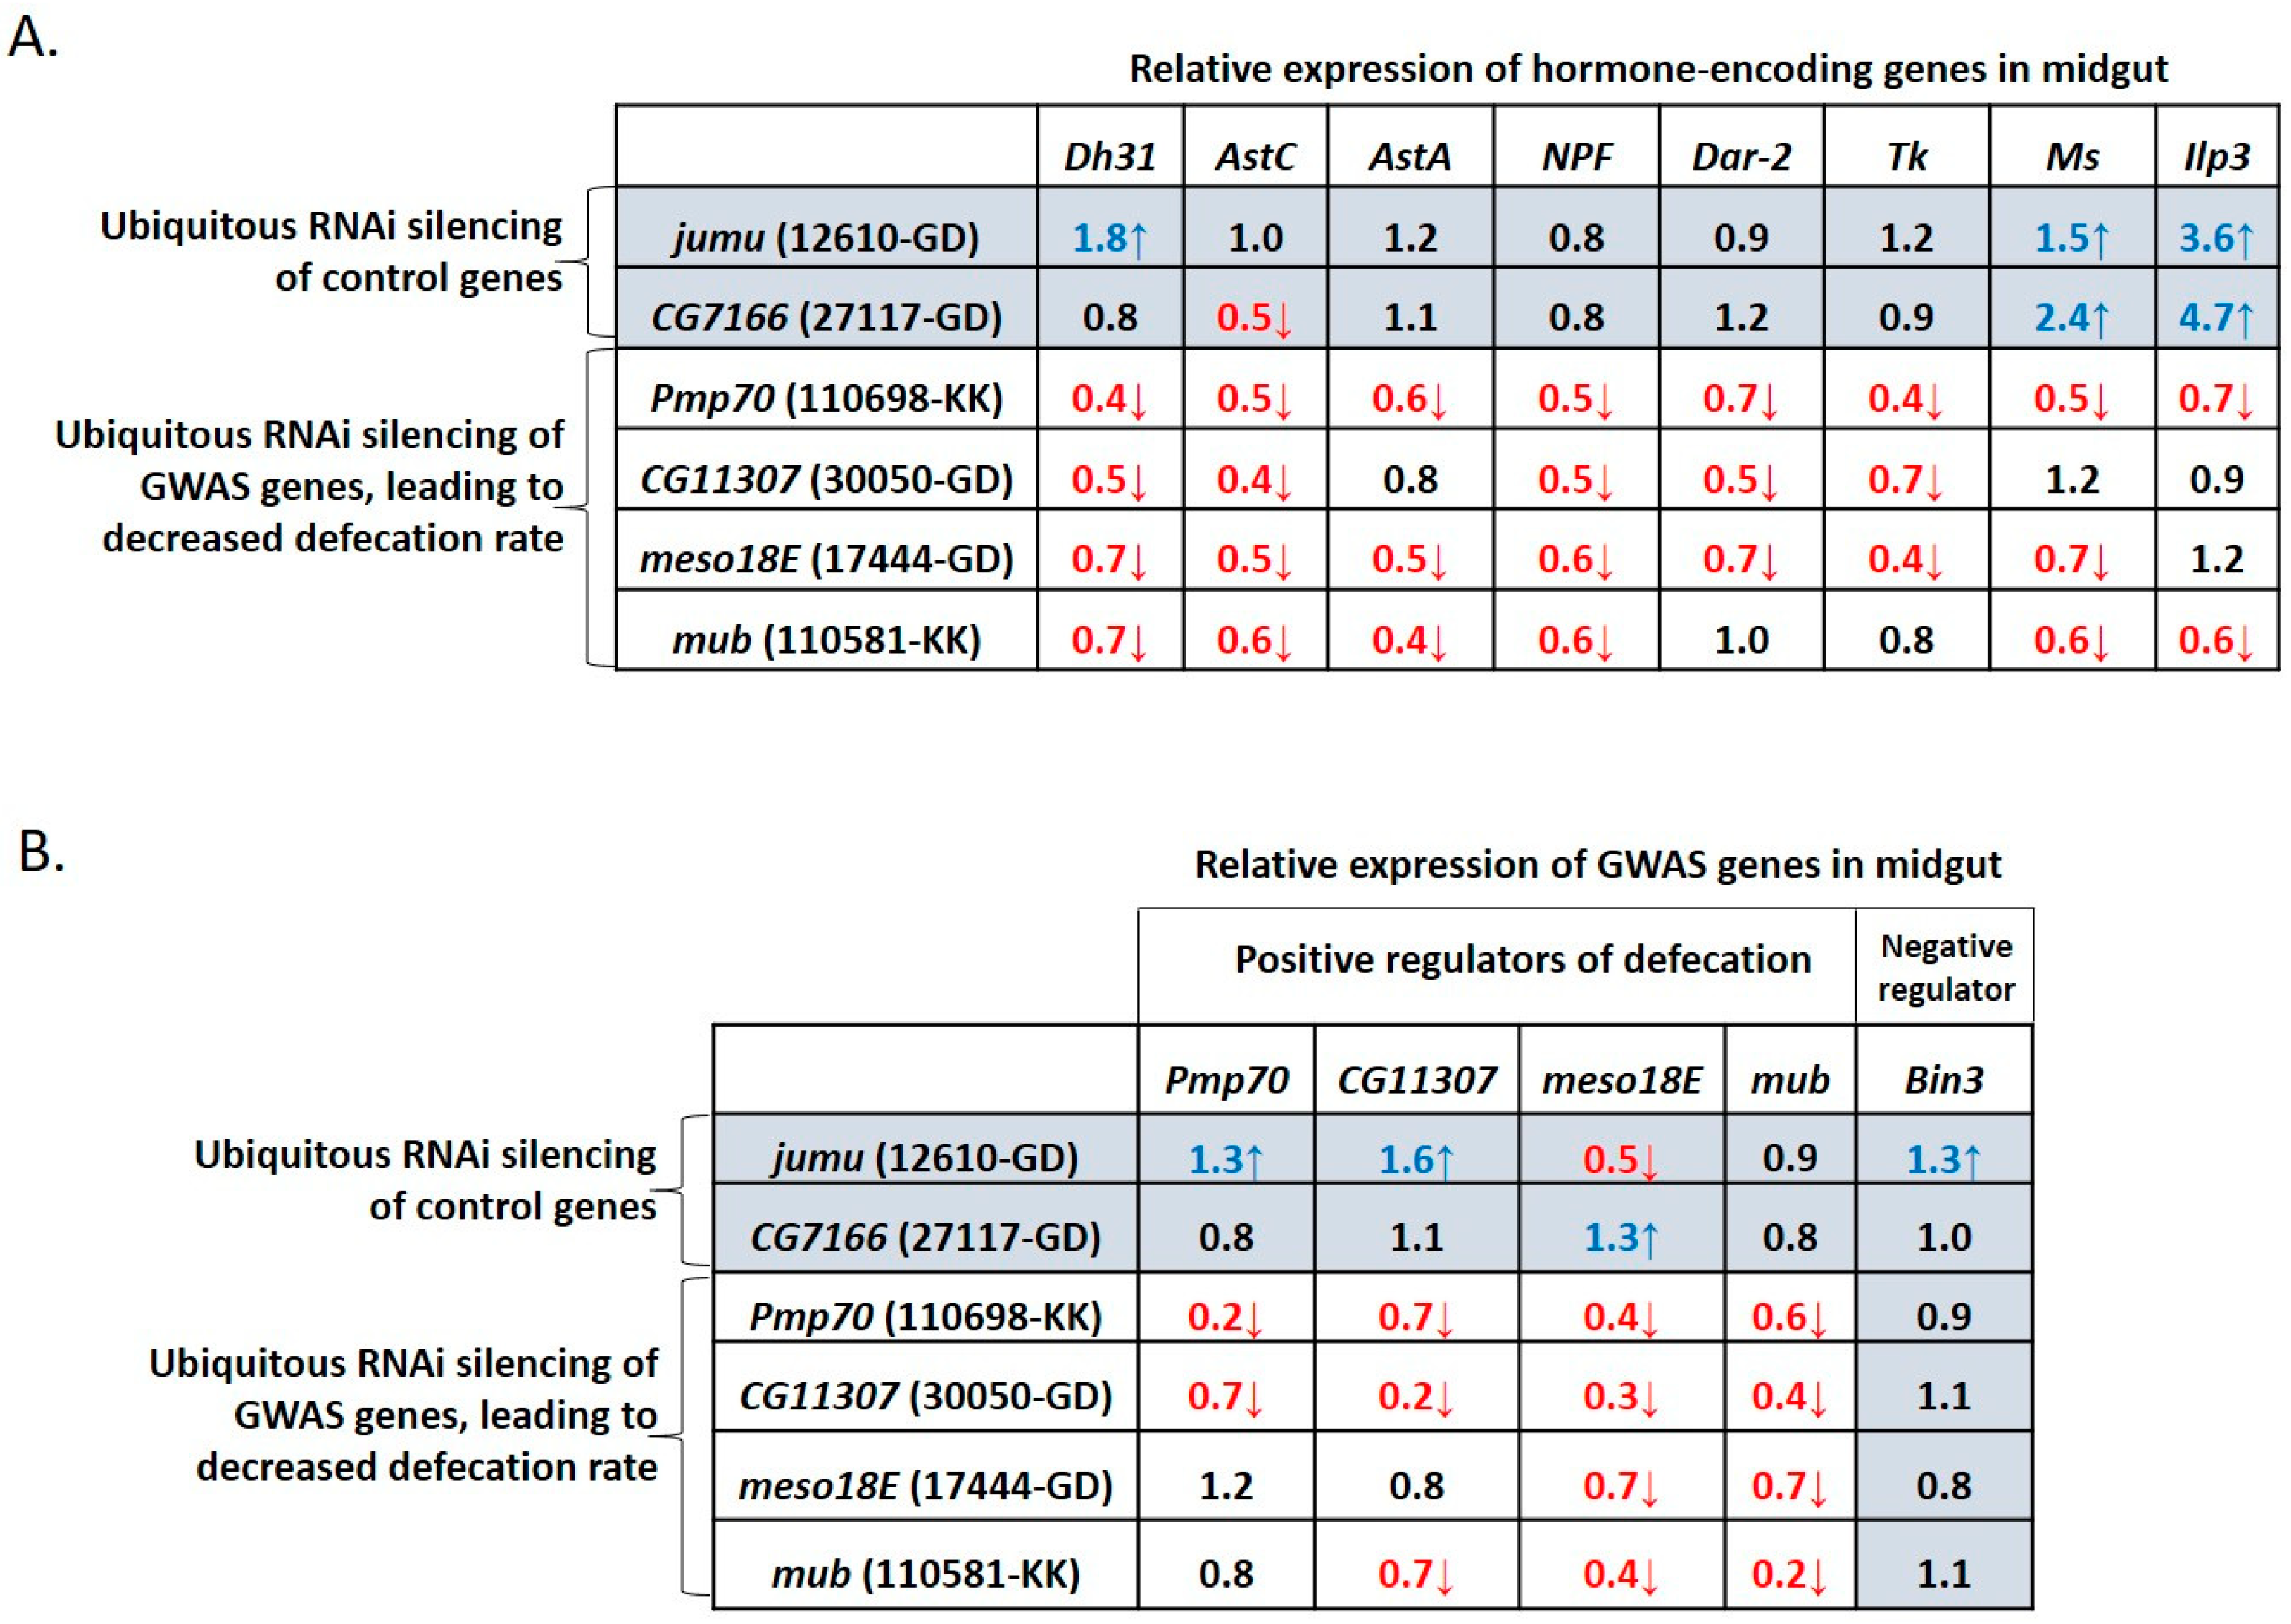
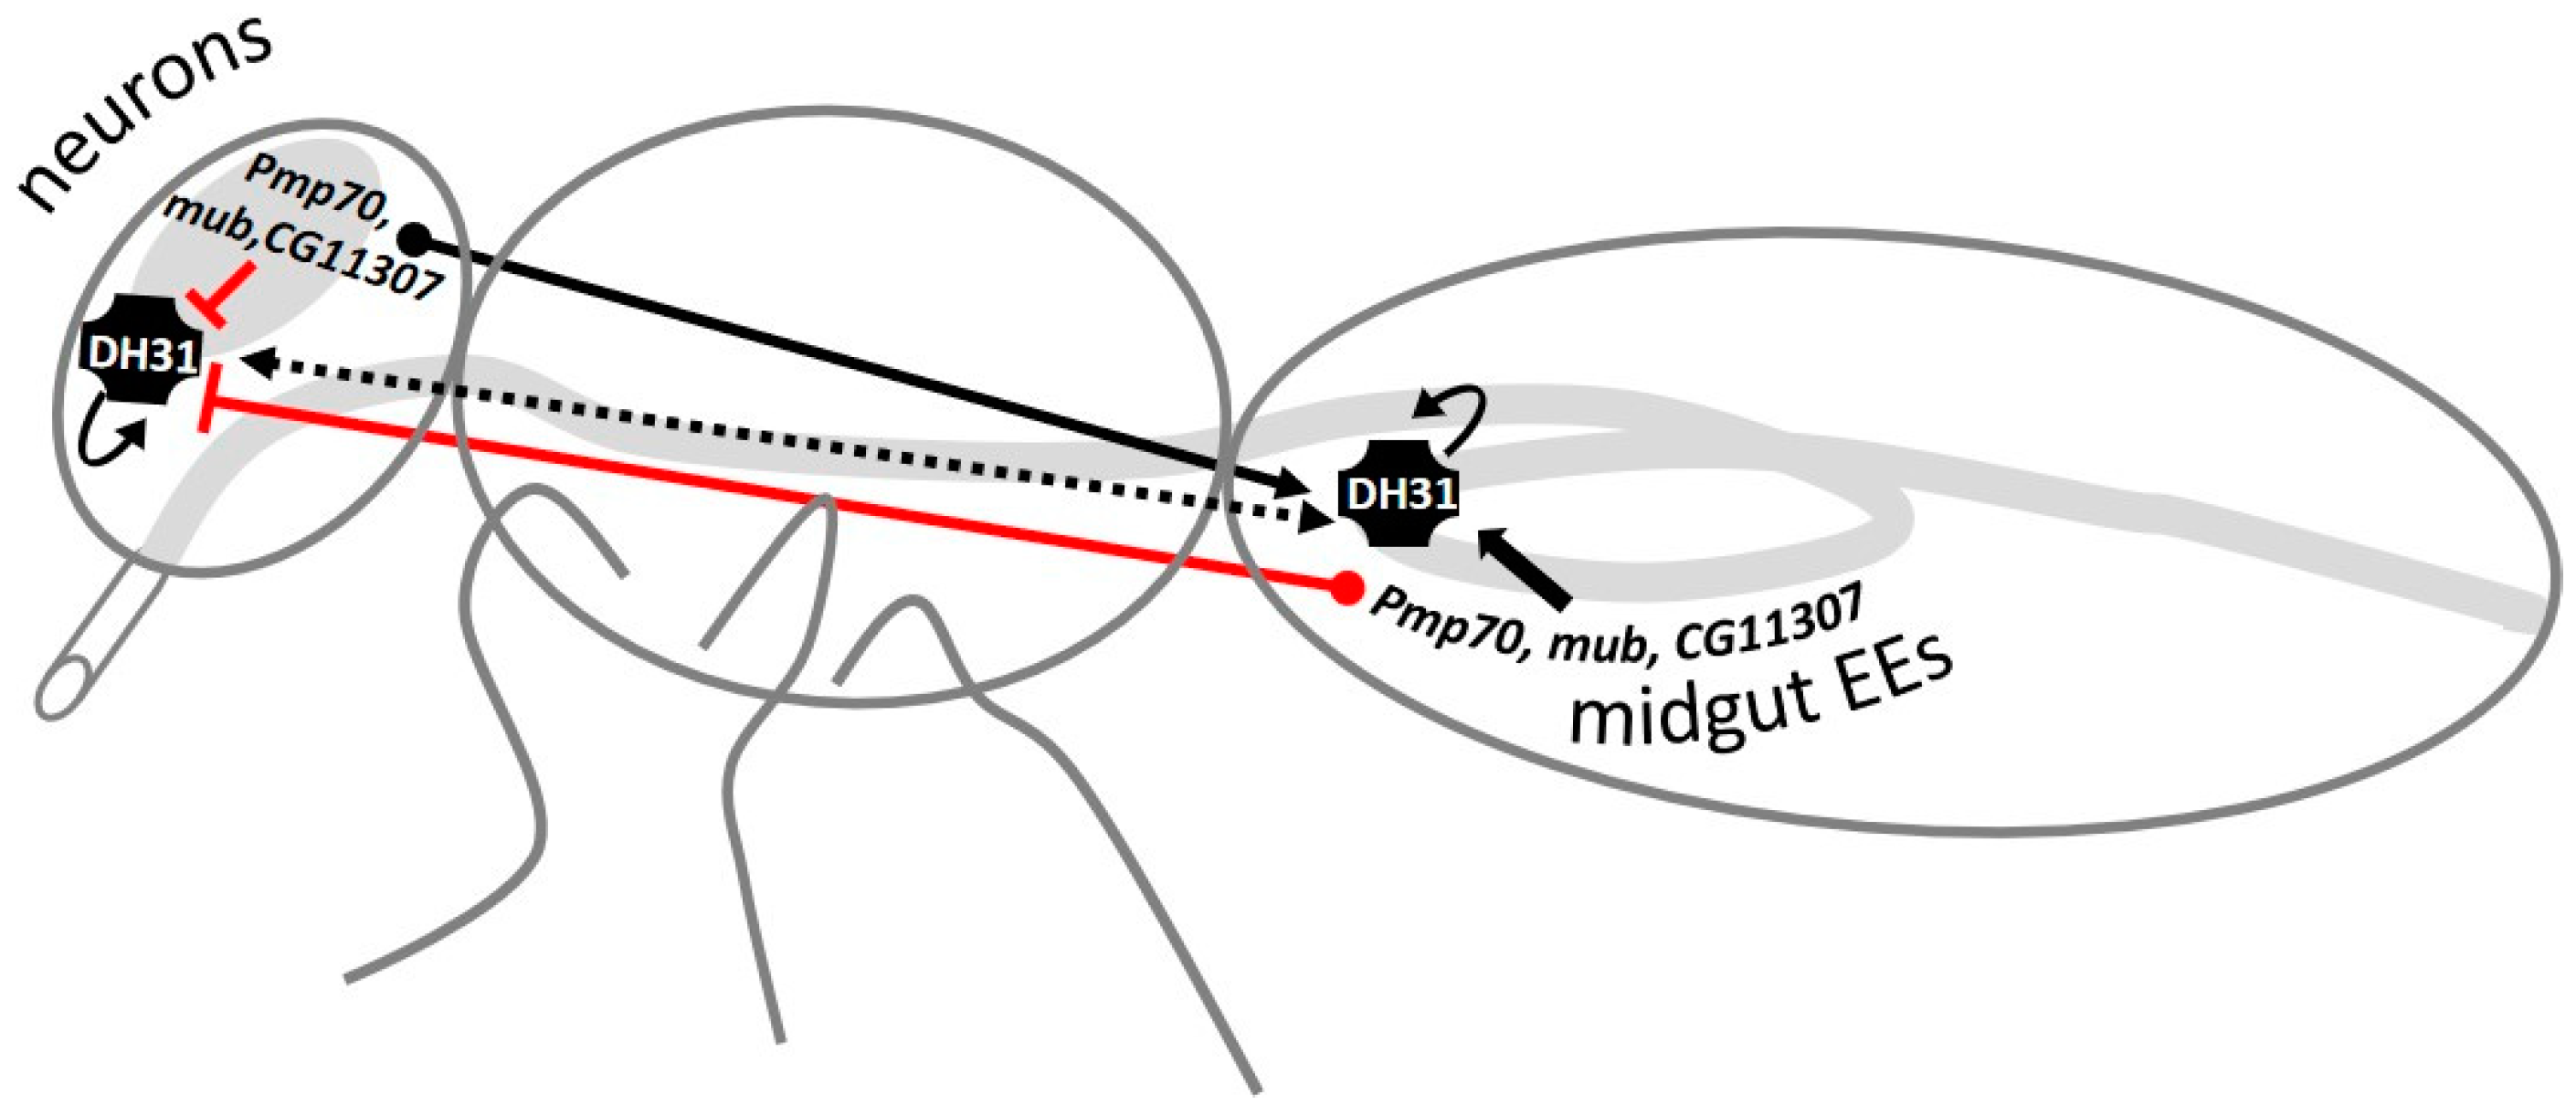
3.6. GWAS-Identified and Hormonal Genes Participate in a Defecation Rate Signaling Network

To assess the cross-regulation potential of defecation-controlling genes we assessed the expression pattern of the eight defecation-associated hormonal genes (AstA, AstC, Dh31, NPF, Dar2, Tk, Ms, ilp3) upon ubiquitous downregulation of the GWAS-identified genes, Pmp70, CG11307, meso18E and mub. Downregulation of CG7166 and jumu, served as independent controls, given that these genes did not act as positive regulators of the defecation rate under our experimental conditions (Figure 4A). Ubiquitous silencing of Pmp70 led to a 30–50% reduction in the expression levels of all hormones examined (red font in Figure 6A).
Ubiquitous downregulation of meso18E, mub and CG11307 led to a 30–70% reduction in the expression of most hormone genes examined, that is, seven, six and five out of eight, respectively. In contrast, downregulation of the control genes, CG7166 and jumu, showed no evidence of such a trend, since it led to reduced expression of one and zero genes, respectively, and induced expression of two and three out of eight hormonal genes, respectively (blue font in Figure 6A).
To determine whether the GWAS-identified genes, Pmp70, CG11307, meso18E and mub, could regulate each other, we examined how ubiquitous downregulation of each gene affected expression of the rest. Downregulation of Bin3, a GWAS-identified gene, served as a control, given that this gene acted as a negative regulator of the defecation rate under our experimental conditions (Figure 4A). Ubiquitous silencing of Pmp70 and CG11307 led to a 30–70% reduction in the expression levels of all GWAS-identified inducers of defecation (red font in Figure 6B) but had no obvious effect on the expression of Bin3, the negative regulator of defecation rate. Ubiquitous silencing of meso18E and mub led to a 30–60% decrease in the expression of two and three out of six GWAS-identified genes, respectively, all of which are potential positive regulators of the defecation rate. Importantly, silencing of the control genes CG7166 and jumu showed no evidence of such a trend, leading instead to increased expression of one and three out of six GWAS-identified genes, respectively, including that of the negative regulator gene, Bin3 (blue font in Figure 6B). Thus, GWAS-identified inducers of defecation participate in a gene network that involves their cross-regulation and the regulation of hormonal genes.

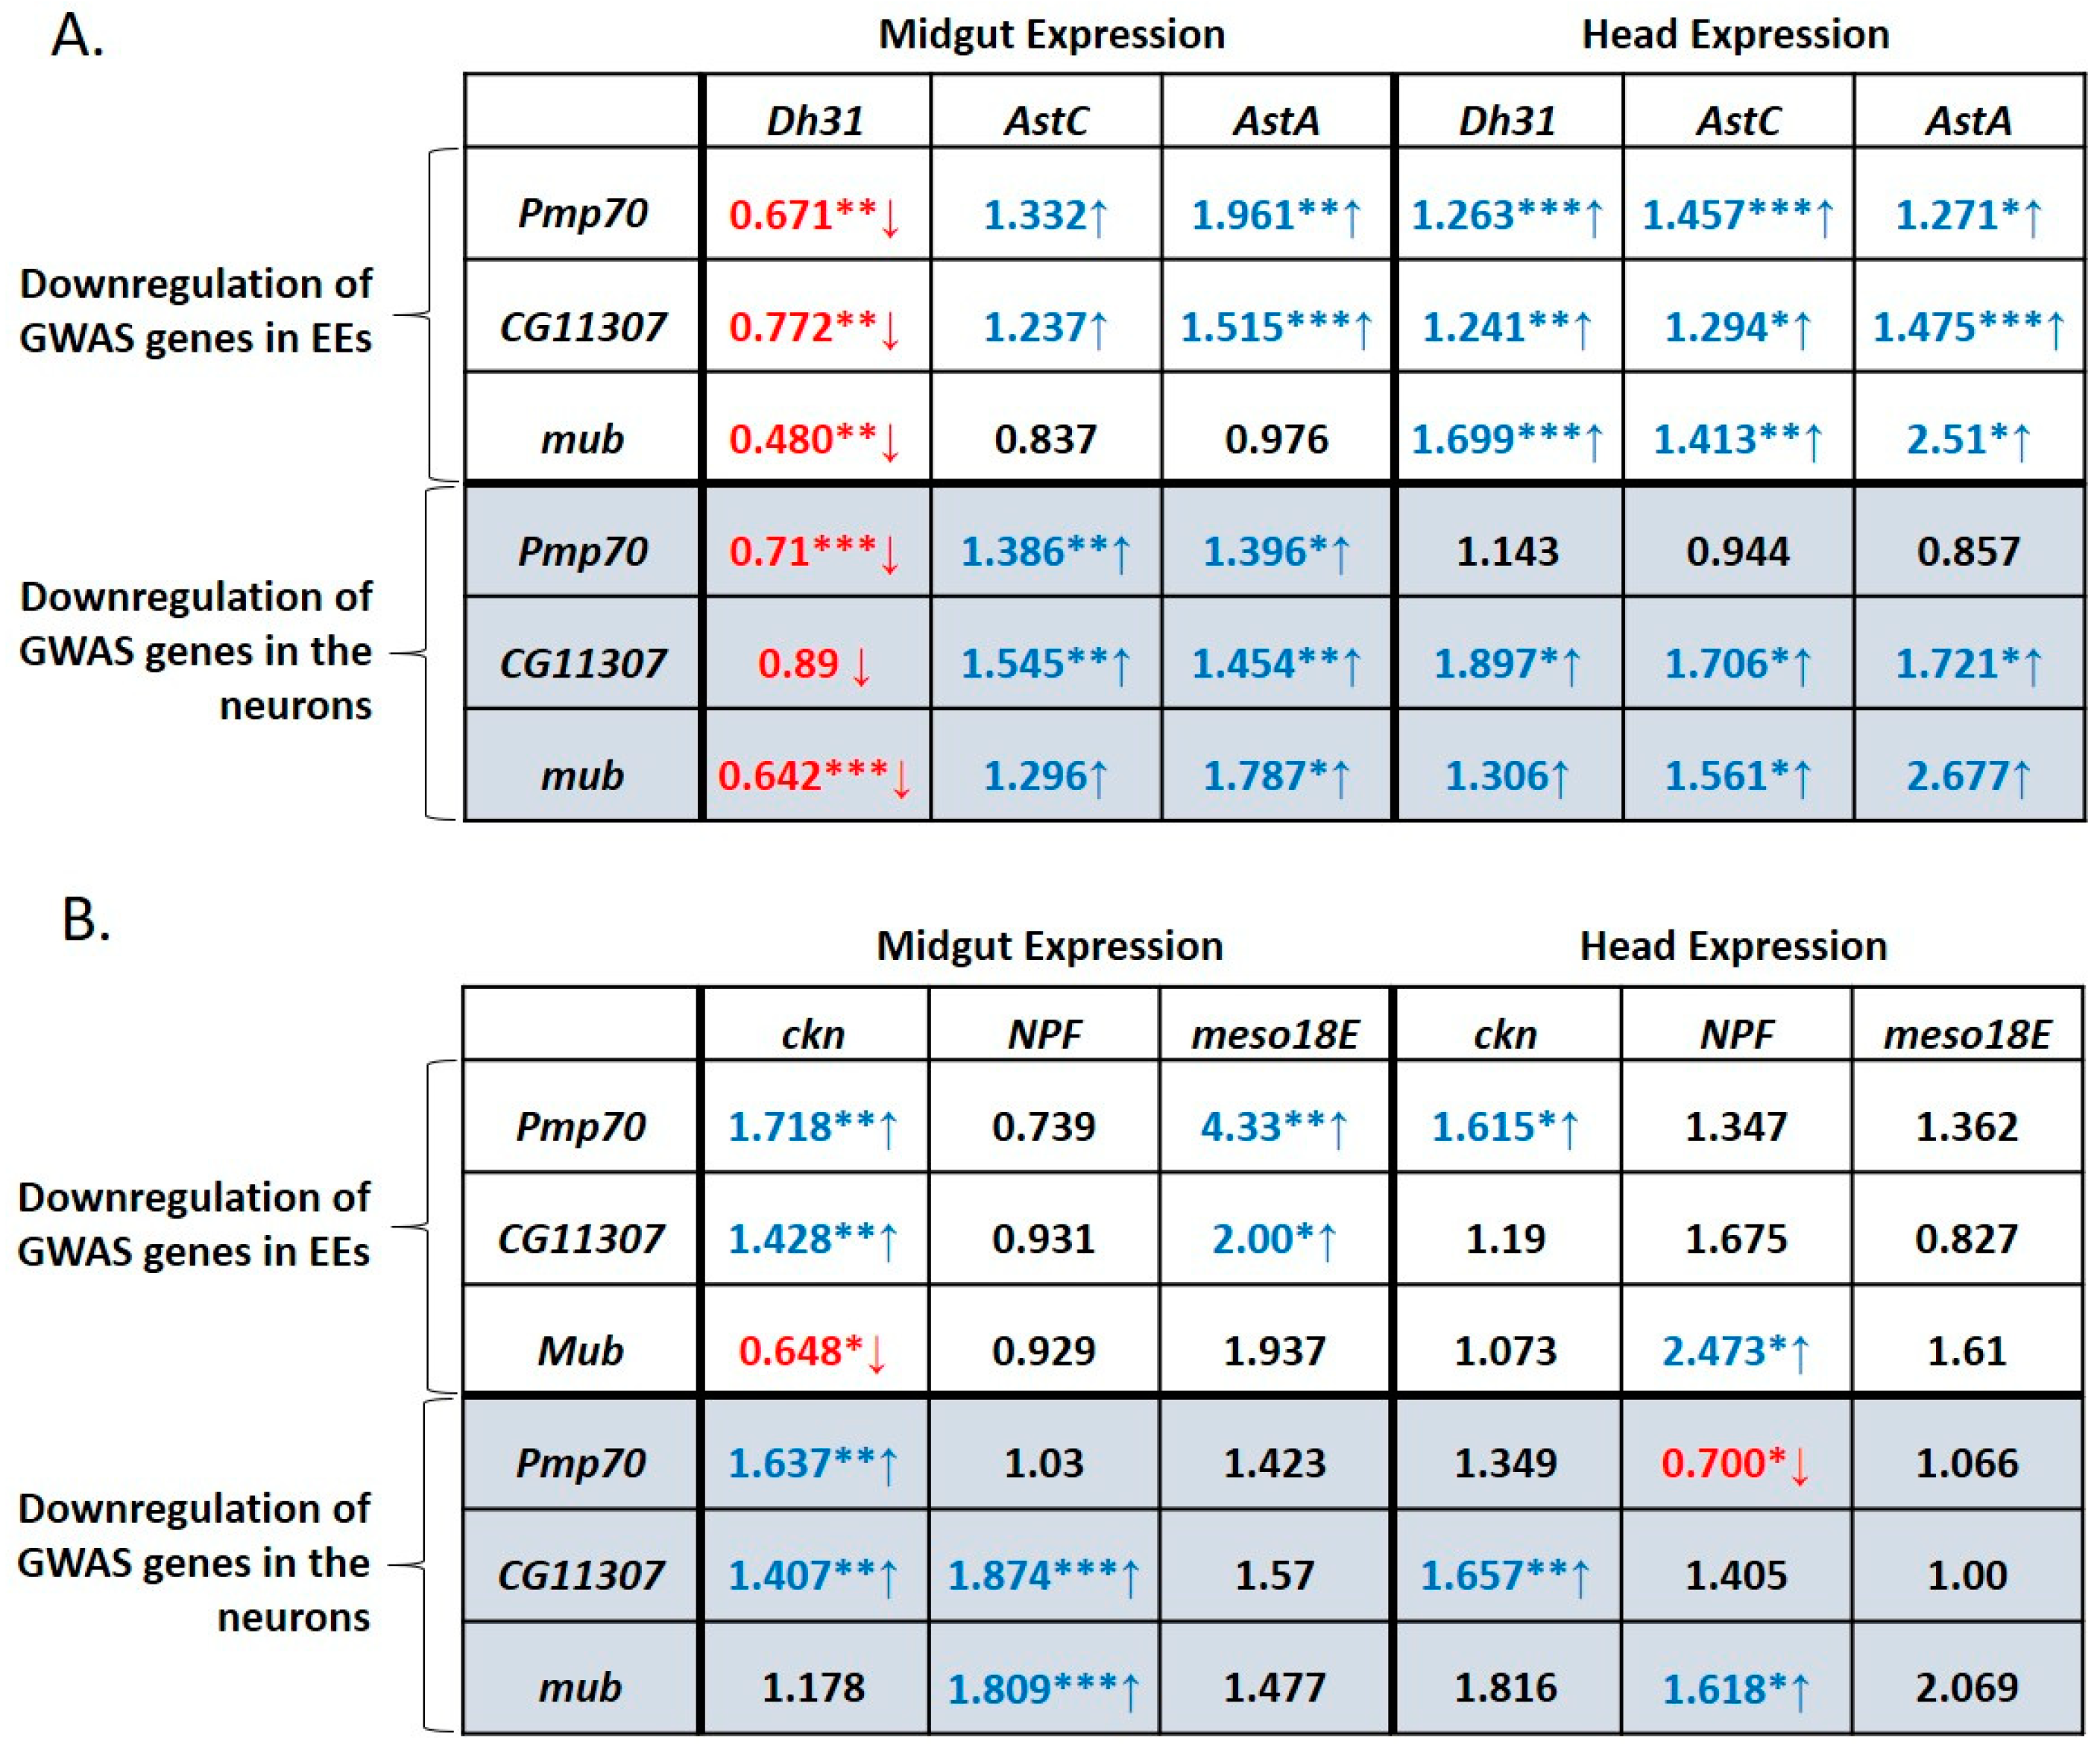
3.7. GWAS-Identified Inducers of Defecation Induce Dh31 Expression in the Midgut and Reduce it in the Head

To delineate key gene network factors involved in regulating the defecation rate via the gut-brain axis, we downregulated each of the GWAS-identified inducers of defecation, Pmp70, CG11307 and mub, in the midgut EEs and neurons, while assessing the expression of hormonal genes in dissected midguts and heads. As shown in Figure 7, a clear pattern emerged, involving three hormonal genes, Dh31, AstA and AstC. Either EE- or neuron-targeted downregulation of Pmp70, CG11307 or mub led to decreased Dh31 expression in the midgut and increased Dh31 expression in the head.
Concomitantly, the expression of AstC and AstA was significantly increased in both the midgut and the head, irrespective of which cells (EEs or neurons) were targeted for downregulation of Pmp70, CG11307 or mub. Thus, there is a crosstalk between the midgut and the head implicating the GWAS-identified positive regulators of defecation and the hormonal genes, Dh31, AstA and AstC. Notably, both EE- and neuron-expressed Pmp70, CG11307 and mub, regulate Dh31 expression positively in the midgut and negatively in the head.
In addition, we examined the expression of two potential positive regulators of gut motility, namely NPF and meso18E, as the former was overexpressed in DGRP strains displaying high defecation rate (Figure 5A) whereas ubiquitous silencing of both in EEs led to decreased defecation rate (Figure 4B,D), as well as ckn, a potential negative regulator, ubiquitous silencing of which led to increased defecation rate (Figure 4A). The expression of NPF remained largely unaffected in the midgut and head upon silencing of Pmp70, CG11307 or mub in EEs (Figure 7B). With the notable exception of decreased NPF expression in the head upon Pmp70 downregulation in the neurons, an inhibitory crosstalk between positive regulators by CG11307 and mub was noticed upon downregulation in neurons (Figure 7B).
The expression of meso18E remained unaffected in the head, but it was increased in the midgut upon Pmp70 and CG11307 (and potentially mub) downregulation in EEs (Figure 7B), revealing an inhibitory crosstalk between these positive regulators in the midgut. Lastly, expression of the negative regulator, ckn, in the midgut and/or head was increased upon downregulation of Pmp70 and CG11307 in EEs or neurons (Figure 7B). This points towards the existence of another crosstalk between the midgut and the head implicating the GWAS-identified genes pmp70 and CG11307 and the negative regulator ckn.

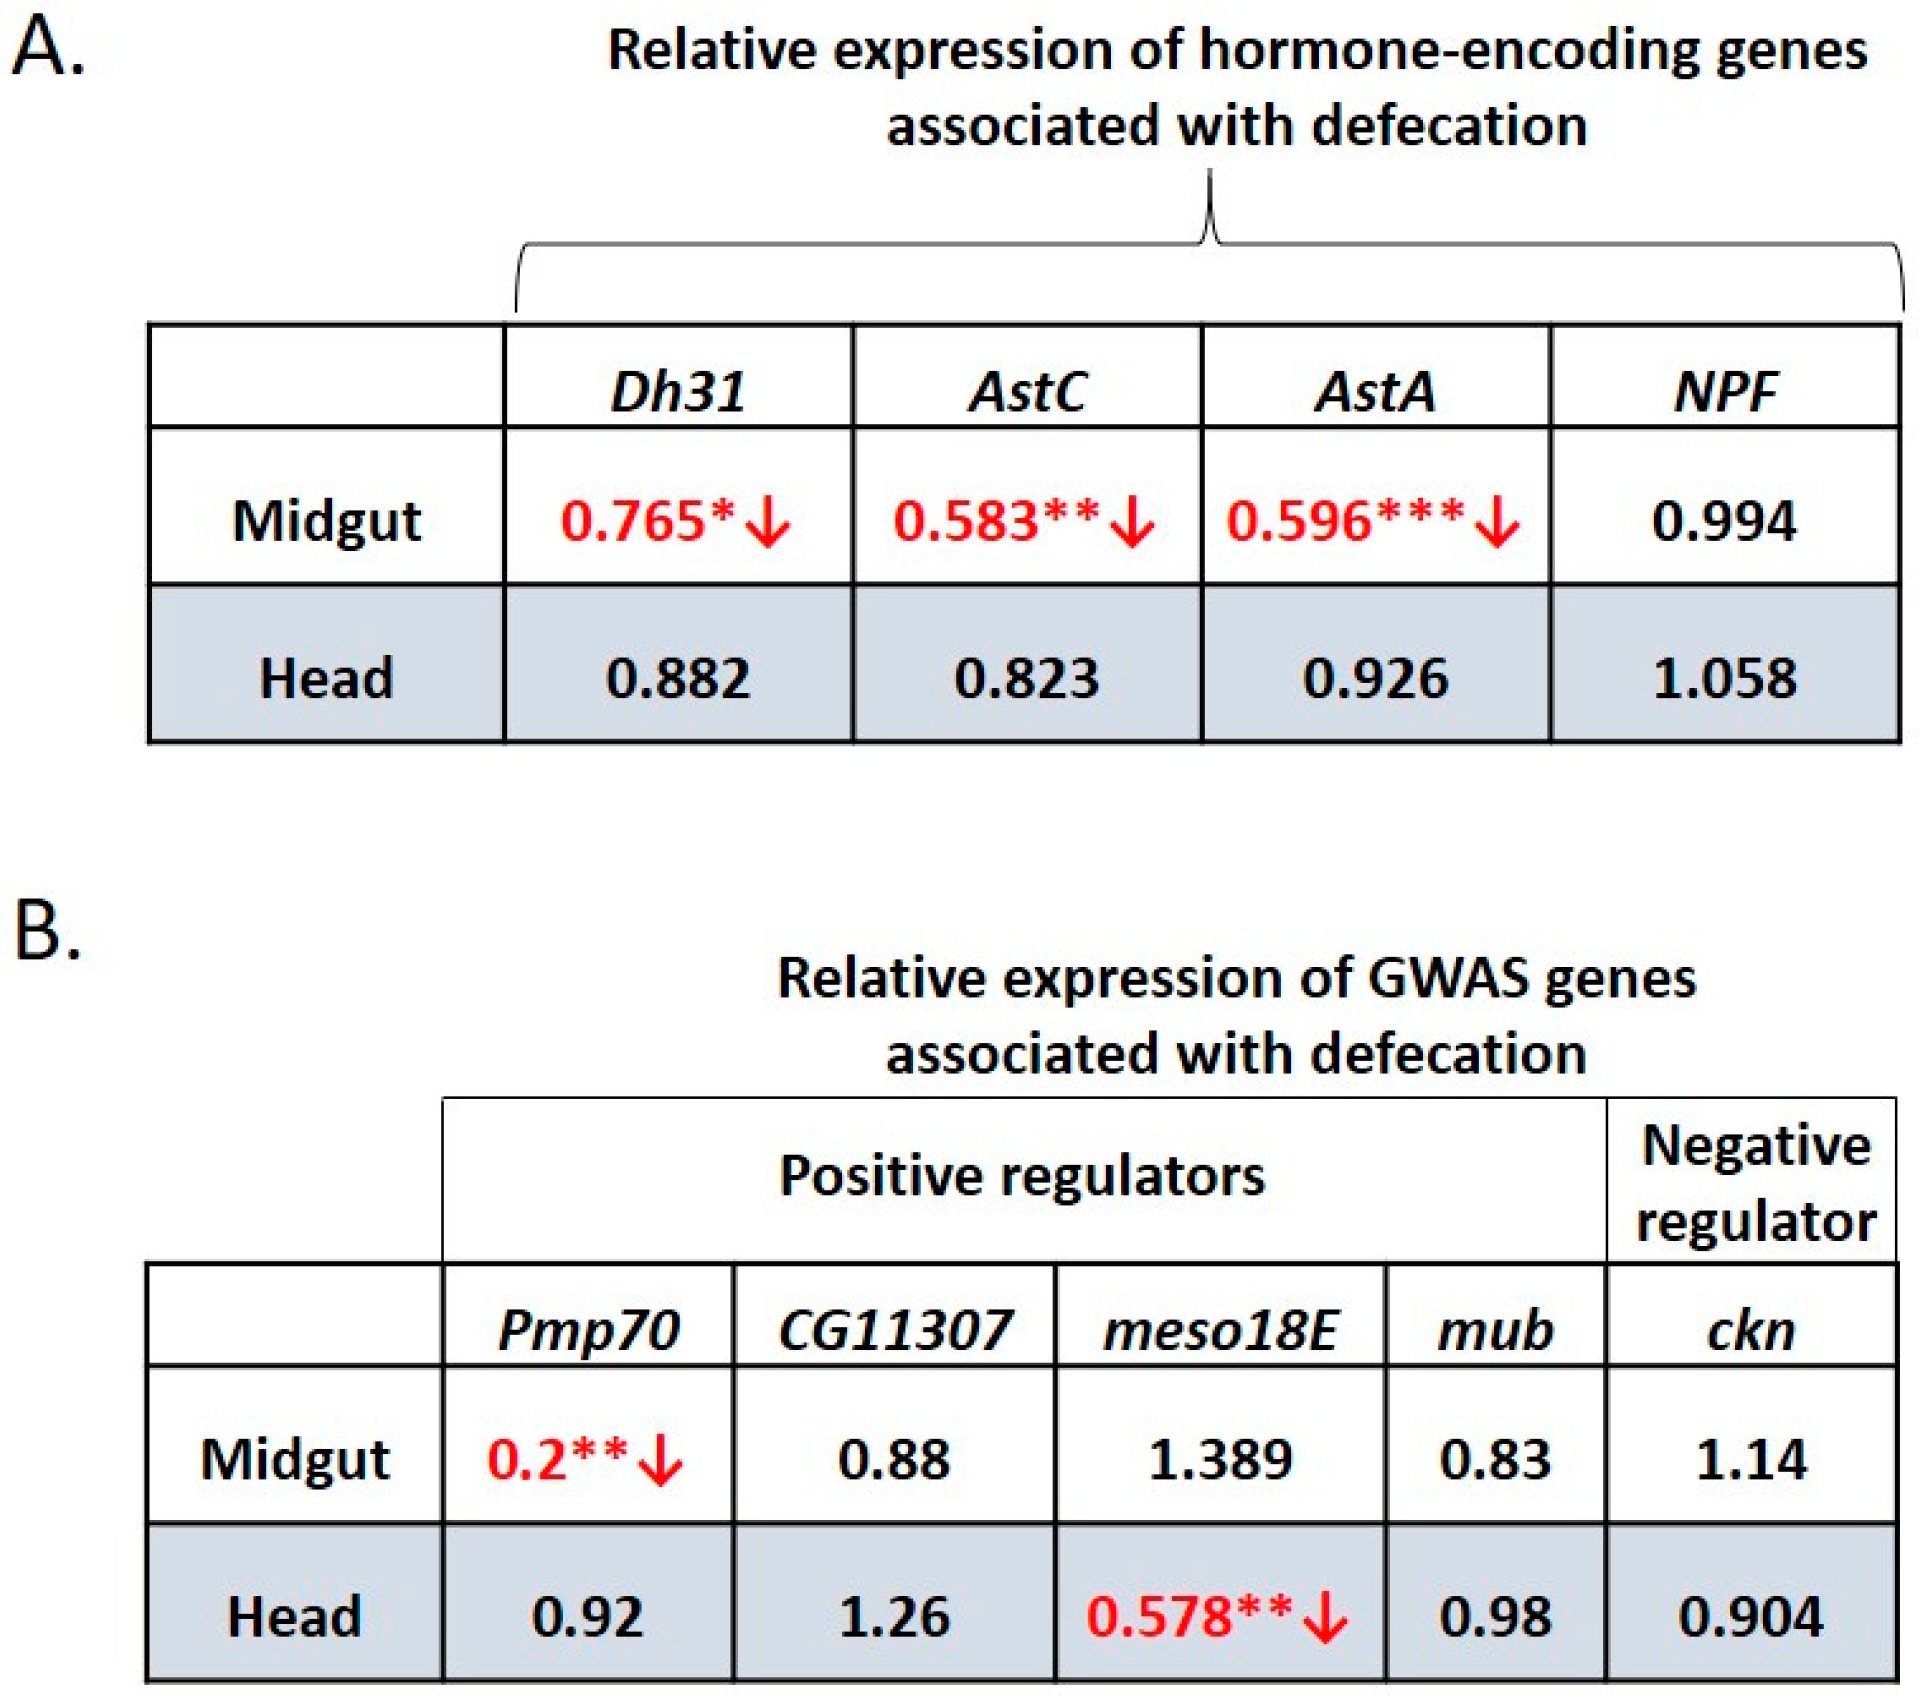
3.8. Water-Only Consumption Reduces Dh31, AstC, AstA and Pmp70 Expression in the Midgut and Reduced Expression of meso18E in the Head

Next, we sought to assess the impact of a dietary stressor on the expression of the hormonal genes, NPF, Dh31, AstA and AstC, and of the GWAS-identified genes, Pmp70, CG11307, meso18E, mub and ckn, in the midguts and heads of wild type female adults at 24 h of water-only consumption (starvation). As shown in Figure 8A, starvation led to a statistically significant decrease in the expression of Dh31, AstA, AstC and Pmp70 in the midgut but not the head.
Moreover, starvation also led to a statistically significant decrease in the expression of meso18E in the head (Figure 8B), further demonstrating that these GWAS-identified genes are implicated in the defecation rate.
In contrast, expression of NPF, was not significantly altered, in either organ, upon starvation. Similarly, expression of CG11307 and mub was not significantly altered, upon starvation, which however does not exclude their involvement in defecation under different stress conditions. Other stressors or homeostatic states may induce or involve different regulators of defecation.

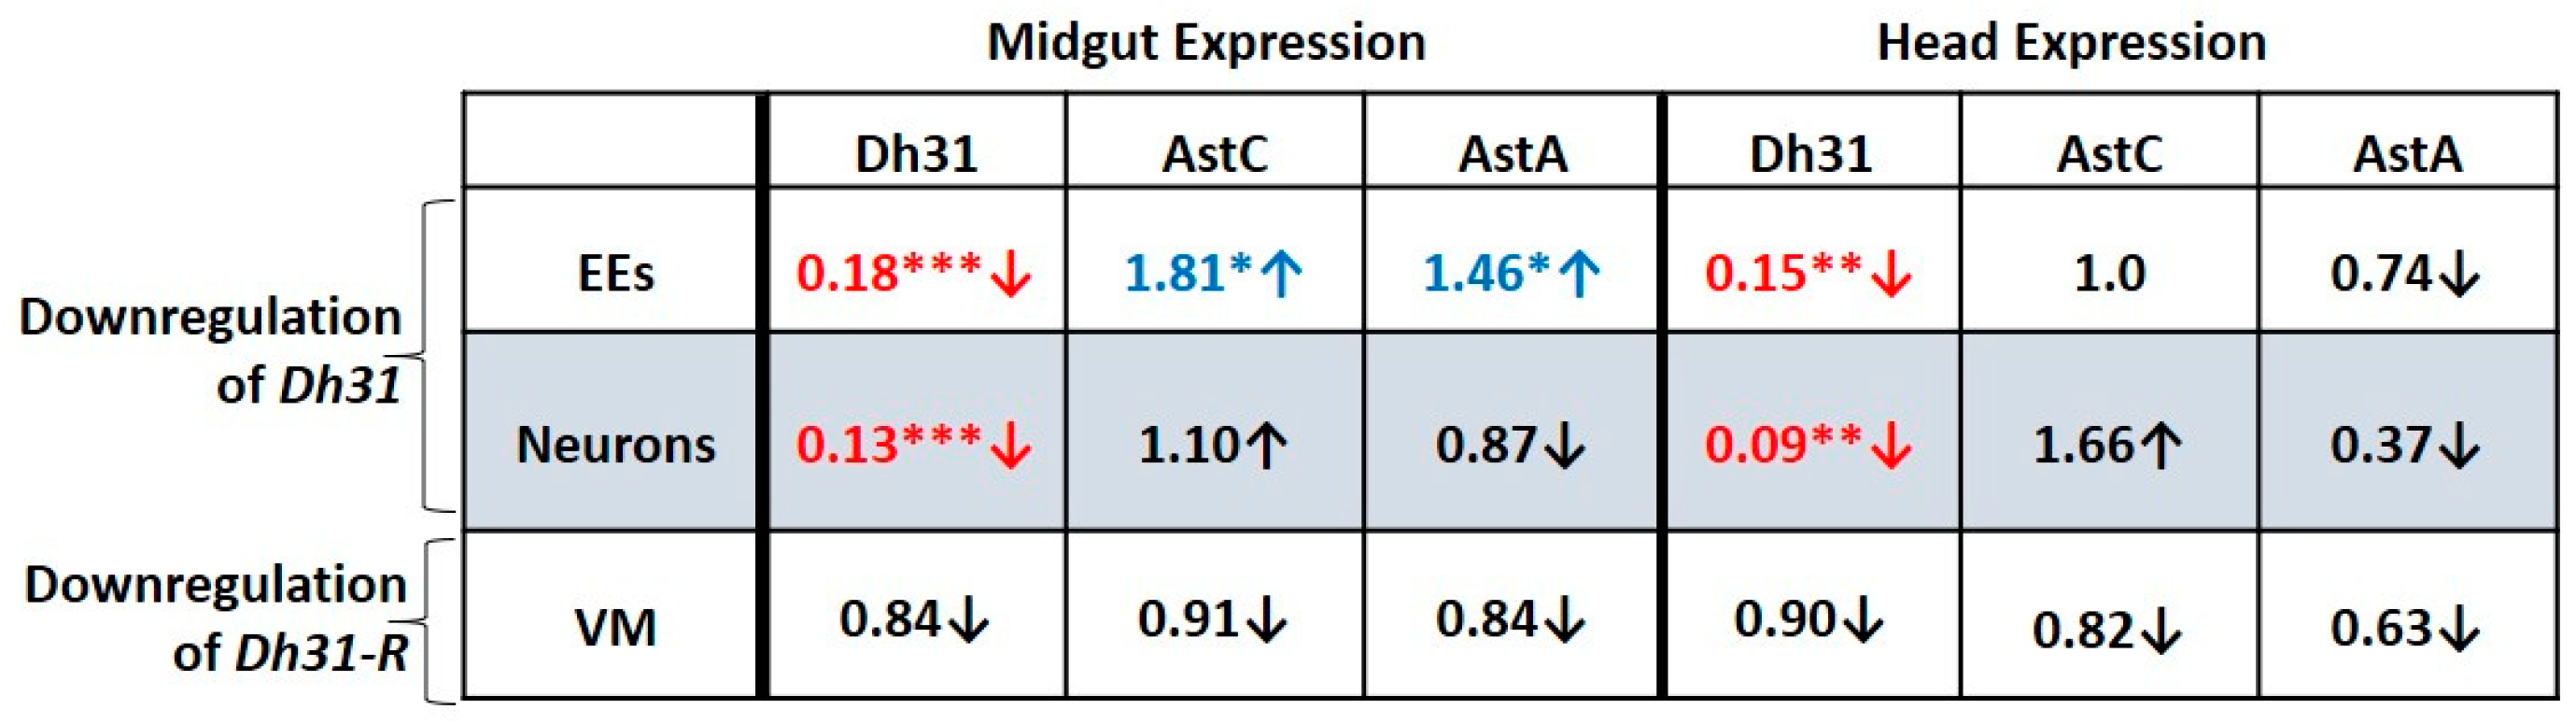
3.9. Downregulation of Dh31 in the Midgut EEs or in Neurons Reduces Dh31 Expression in Both the Midgut and Head

To determine whether Dh31 regulates its own expression and that of the associated peptide hormone genes, AstA and AstC, along the midgut-brain axis, we downregulated Dh31 in EEs using the prosV1-Gal4 and in all neurons using the elav-Gal4. We also downregulated its receptor, Dh31-R, in the visceral muscle using the 24B-Gal4. We then assessed the expression of Dh31, AstA and AstC in dissected midguts and heads. As shown in Figure 9, downregulation of Dh31 in either EEs or neurons led to reduced Dh31 expression in both the midgut and the head.
Moreover, downregulation of Dh31 in EEs increased AstA and AstC expression in the midgut but not the head, whereas downregulation of Dh31 in neurons did not significantly affect AstA and AstC expression in the midgut or head. Downregulation of Dh31-R in the visceral muscle did not significantly alter the expression of Dh31, AstA or AstC in the midgut or head, indicating that Dh31-Dh31R signaling in the VM does not affect the expression of these hormone peptide genes. Thus, Dh31 autoregulates itself within and between cells of the midgut and head.

4. Discussion

Gastrointestinal motility is a polygenic trait critical for energy homeostasis, host-microbiota interaction, and overall health. It is influenced by mechanistically complex genetic and environmental factors. Here, we addressed the contribution of environmental and genetic factors on gut motility using a customized Drosophila defecation assay amenable to microbial infection and dietary treatments.
We showed that wild type fly populations, of the same genotype, reared in parallel in the lab for a year, bear gut bacterial strains belonging to the species S. xylosus, S. homini, P. putida, B. mycoides and P. pabuli that are sensitive to the antibiotic rifampicin, as well as two rifampicin-resistant strains, namely E. haemoperoxidus and S. arlettae. Interestingly, the defecation rate is comparable and similarly induced upon oral bacterial infection, when these genetically identical populations, reared apart, are rendered germ-free. This agrees with previous studies showing that, even though some bacteria are frequent colonizers of the Drosophila gut, fly stock microbiota can differ greatly between laboratories and even between stocks raised independently within the same laboratory [39,40]. Similarly, the human microbiota is highly house-dependent, as it is more comparable among genetically unrelated individuals who share a household, than among relatives who do not have a history of household sharing [41].
Furthermore, we provide evidence of microbiota as cofounding factors, affecting the defecation rate. We identified E. haemoperoxidus, as a fly microbiota isolate, the ingestion of which sufficed to increase defecation rate in germ-free flies. On the other hand, ingestion of P. aeruginosa, a human opportunistic pathogen increased the defecation rate of gnotobiotic flies associated with E. haemoperoxidus and S. arlettae, but not of germ-free flies, indicating that P. aeruginosa requires intestinal microbiota to induce gut motility. Previous work showed that Dh31 expression in the fly midgut EEs is associated with strong visceral muscle contractions following the ingestion of harmful bacteria, a mechanism by which flies may propel quick expulsion of pathogens from the fly gut [14]. Therefore, metabolites or virulent factors produced by E. haemoperoxidus and P. aeruginosa may stimulate midgut EEs to release Dh31, which in turn increases defecation rate.
Moreover, water-only starvation and dietary ethanol impose significant stress and reduce defecation rate, analogously to their impact on fly survival. In our study, water-only consumption was compared to a 4% sucrose diet, both of which do not provide any solid residues, and agrees with previous work showing that starvation lowers the defecation rate long before the gut is emptied [42]. Starvation has been shown to influence various aspects of fly behavior, including foraging, feeding, sleep, agility, courtship, mating, reproduction, and nutrient sensing, thus emphasizing the importance of signaling along the gut-brain axis [42,43,44,45,46]. Mechanisms regulating the gut-brain axis communication involve a diverse array of neuropeptide hormones secreted primarily by midgut EEs and the brain [37,47]. Here, we show that starvation reduces the expression of Dh31, AstC and AstA in the fly midgut, but not in the head. By reducing Dh31 expression in the fly midgut starvation may in turn reduce midgut muscle contractions [14] and the rate of defecation. Estimation of heritability serves as a useful tool across a range of disciplines, from evolutionary biology to agriculture to human medicine [48]. It has been applied to the estimation of genetic variation in human behavioral phenotypes, such as IQ, and the risk for many disorders, such as schizophrenia, autism, and attention deficit hyperactivity disorder [49,50,51]. Genetic variation also determines gut motility. Defecation rate studies in C. elegans and rats, as well as four small and one large study of ~168,000 humans from the UK BioBank reported heritability in stool frequency [52,53,54]. Accordingly, we show that the naturally occurring genetic variation differentially affects the defecation rate in DGRP strains, identifying 16 strains displaying high and 11 strains displaying low defecation rates. We found the narrow-sense heritability ( h 2 ) in our customized assay to equal 0.91, indicating that the genetic variance in defecation rate is mostly additive, which is typical of a polygenic trait. Nevertheless, heritability is a population parameter. It depends on population-specific factors, such as allele frequencies, the effects of gene variants, and variation due to environmental factors [48]. It does not necessarily predict the value of heritability in other populations or other species. However, the heritability of many traits depends mainly on additive genetic variance across populations and species [34].
Peptide hormones have been previously associated with feeding behavior, metabolism, and energy homeostasis. For example, secretion of Dh31, Ast A and AstC suppresses feeding [22,24,55], NPF regulates food choice behavior [17,18], Tk confers both excitatory and inhibitory effects on gut motility [26], and Ms relaxes crop muscles, to allow expansion and increased food intake [10]. Herein we show that downregulation of AstA, AstC, Dh31, NPF, Tk or Ms in midgut EEs lead to decreased defecation rates. This result complements previous work showing that loss of Dh31 expression from the larval midgut EEs impairs peristalsis [13]. In contrast downregulation of Dar2 or ilp3 increased the defecation rate. Interestingly, the production of some of these peptides in the midgut EEs is very low compared for example to the expression of Dh31 and NPF [37]. This is also true at the gene expression level so that, for example, ilp3 and Ms expression, while more abundant in the midgut EEs compared to other midgut cell types, it is a few orders of magnitude lower than the expression of NPF and Dh31 [38]. However, we find that the downregulation of lowly expressed peptide hormones, such as Ilp3 and Ms, can have an impact on defecation rate comparable to that of Dh31 and NPF.
We also positively correlated expression of NPF and CG11307 (a newly identified GWAS gene) with the defecation rate of genetically disparate DGRP strains, reinforcing the regulatory role of these genes. This is in line, with previous work showing that NPF acts as a hunger signal promoting wakefulness and adult feeding [36], which presumably enhances gut motility. Accordingly, we show that starvation decreased Dh31, AstC and AstA expression in the midgut, while NPF expression remained unaltered upon starvation. Different treatments and stimuli may activate alternative hormone peptides and cell types leading to differential regulation of gut motility. For example, NPF does not specifically influence total food intake, but may rather regulate food choice behavior [17,18].
Our GWA analysis identified 17 genes associated with defecation rate. Functional assessment enabled focusing on four of these genes, namely Pmp70, CG11307, meso18E and mub, as inducers of defecation rate; CG11307 is not phenotypically annotated; Pmp70 is orthologous to human ABCD3 (ATP binding cassette subfamily D member 3) and is predicted to be involved in fatty acid catabolic processes, long-chain fatty acid import into the peroxisome and peroxisome organization [56,57]; meso18E is involved in mesoderm development, including development of the visceral muscle primordium [58,59]; mub is involved in thermosensory and satiety signals controlling food-seeking behavior [60,61,62]. Ubiquitous, independent downregulation of Pmp70, CG11307, meso18E and mub reduced the defecation rate, while ubiquitous, independent downregulation of jumu, ckn and Bin3 increased the defecation rate. Similarly, targeted downregulation of Pmp70, CG11307, meso18E and mub in midgut EEs reduced the defecation rate, indicating that these genes act tissue- and cell-specifically, in the midgut EEs promoting defecation.
We also found a role for the GWAS-identified inducers of defecation, Pmp70, CG11307, meso18E and mub, in altering the expression of the peptide hormone genes, Dh31, AstC and AstA, in the Drosophila midgut and head. These GWAS-identified genes are expressed in both the midgut EEs and in neurons, yet they have distinct roles depending on their site of action. They activate Dh31 in the midgut, but inhibit its expression in the head, irrespective of their own expression site of origin (Figure 10).
Despite the tissue specificity of the four GWAS-identified inducers of defecation, Dh31 functions as an activator of defecation rate, regardless of the cell type in which it is expressed (midgut EEs or neurons). This may be partly explained by recent work showing that feeding increases the production and release of DH31 from midgut EEs into the hemolymph and in turn excites two populations of Dh31-R expressing neurons in the brain, one inhibiting feeding through Ast-C and another promoting courtship through corazonin [55]. It is possible that the newly identified Dh31-controlling genes activate the Dh31-R expressing neurons in the fly brain, which may inhibit feeding and thus reduce gut motility [34,35,36,37].

Supplementary Materials

The following supporting information can be downloaded at https://0-www-mdpi-com.brum.beds.ac.uk/article/10.3390/metabo13020264/s1. Figure S1: Both downregulation of Dh31 in EEs or neurons and downregulation of Dh31-receptor (Dh31-R) in Visceral Muscle (VM) or neurons reduces the defecation rate; Table S1: Gene specific qPCR primer sequences.

Author Contributions

Conceptualization, K.K., A.E. and Y.A.; formal analysis, K.K., A.E., O.G. and Y.A.; investigation, K.K., A.E., A.D. and O.G.; resources, Y.A.; data curation, A.C.; writing—original draft preparation, A.C.; writing—review and editing, A.C. and Y.A.; visualization, A.C.; supervision, Y.A.; project administration, Y.A.; funding acquisition, Y.A. All authors have read and agreed to the published version of the manuscript.

Funding

This work was funded by the Republic of Cyprus “Restart 2016–2020 Programmes” through the Research and Innovation Foundation (LDDTA Project: EXCELLENCE/0421/0323).

Institutional Review Board Statement

Not applicable.

Informed Consent Statement

Not applicable.

Data Availability Statement

Data are contained within the article or the Supplementary Material.

Conflicts of Interest

The authors declare no conflict of interest.

References

  1. Kitazawa, T.; Kaiya, H. Regulation of Gastrointestinal Motility by Motilin and Ghrelin in Vertebrates. Front. Endocrinol. 2019, 10, 278. [Google Scholar] [CrossRef] [PubMed]
  2. Monteiro, M.P.; Batterham, R.L. The Importance of the Gastrointestinal Tract in Controlling Food Intake and Regulating Energy Balance. Gastroenterology 2017, 152, 1707–1717.e2. [Google Scholar] [CrossRef] [PubMed]
  3. Daniel, N.; Lécuyer, E.; Chassaing, B. Host/Microbiota Interactions in Health and Diseases-Time for Mucosal Microbiology! Mucosal Immunol. 2021, 14, 1006–1016. [Google Scholar] [CrossRef] [PubMed]
  4. Iacob, S.; Iacob, D.G.; Luminos, L.M. Intestinal Microbiota as a Host Defense Mechanism to Infectious Threats. Front. Microbiol. 2018, 9, 3328. [Google Scholar] [CrossRef]
  5. Rozé, C. Neurohumoral Control of Gastrointestinal Motility. Reprod. Nutr. Dev. 1980, 20, 1125–1141. [Google Scholar] [CrossRef]
  6. Daniel, E.; Tougas, G.; Allescher, H.D.; Vergara, P.; Fox-Threlkeld, J.A. Mediators and Enteric Nerve Pathways Controlling Gastric Emptying. Dig. Dis. Sci. 1994, 39, 63S–68S. [Google Scholar] [CrossRef]
  7. Travagli, R.A.; Anselmi, L. Vagal Neurocircuitry and Its Influence on Gastric Motility. Nat. Rev. Gastroenterol. Hepatol. 2016, 13, 389–401. [Google Scholar] [CrossRef]
  8. Boeckxstaens, G.; Camilleri, M.; Sifrim, D.; Houghton, L.A.; Elsenbruch, S.; Lindberg, G.; Azpiroz, F.; Parkman, H.P. Fundamentals of Neurogastroenterology: Physiology/Motility—Sensation. Gastroenterology 2016, 150, 1292–1304.e2. [Google Scholar] [CrossRef]
  9. Apidianakis, Y.; Rahme, L.G. Drosophila Melanogaster as a Model for Human Intestinal Infection and Pathology. Dis. Model. Mech. 2011, 4, 21–30. [Google Scholar] [CrossRef]
  10. Hadjieconomou, D.; King, G.; Gaspar, P.; Mineo, A.; Blackie, L.; Ameku, T.; Studd, C.; de Mendoza, A.; Diao, F.; White, B.H.; et al. Enteric Neurons Increase Maternal Food Intake during Reproduction. Nature 2020, 587, 455–459. [Google Scholar] [CrossRef]
  11. Charalambous, A.; Grivogiannis, E.; Dieronitou, I.; Michael, C.; Rahme, L.; Apidianakis, Y. Proteobacteria and Firmicutes Secreted Factors Exert Distinct Effects on Pseudomonas aeruginosa Infection under Normoxia or Mild Hypoxia. Metabolites 2022, 12, 449. [Google Scholar] [CrossRef] [PubMed]
  12. Pitsouli, C.; Apidianakis, Y.; Perrimon, N. Homeostasis in Infected Epithelia: Stem Cells Take the Lead. Cell Host Microbe 2009, 6, 301–307. [Google Scholar] [CrossRef] [PubMed]
  13. LaJeunesse, D.R.; Johnson, B.; Presnell, J.S.; Catignas, K.K.; Zapotoczny, G. Peristalsis in the Junction Region of the Drosophila Larval Midgut is Modulated by DH31 Expressing Enteroendocrine Cells. BMC Physiol. 2010, 10, 14. [Google Scholar] [CrossRef] [PubMed]
  14. Benguettat, O.; Jneid, R.; Soltys, J.; Loudhaief, R.; Brun-Barale, A.; Osman, D.; Gallet, A. The DH31/CGRP Enteroendocrine Peptide Triggers Intestinal Contractions Favoring the Elimination of Opportunistic Bacteria. PLoS Pathog. 2018, 14, e1007279. [Google Scholar] [CrossRef] [PubMed]
  15. Chen, J.; Kim, S.-M.; Kwon, J.Y. A Systematic Analysis of Drosophila Regulatory Peptide Expression in Enteroendocrine Cells. Mol. Cells 2016, 39, 358–366. [Google Scholar] [CrossRef] [PubMed]
  16. Coast, G.M.; Webster, S.G.; Schegg, K.M.; Tobe, S.S.; Schooley, D.A. The Drosophila Melanogaster Homologue of an Insect Calcitonin-like Diuretic Peptide Stimulates V-ATPase Activity in Fruit Fly Malpighian Tubules. J. Exp. Biol. 2001, 204, 1795–1804. [Google Scholar] [CrossRef]
  17. Wu, Q.; Zhao, Z.; Shen, P. Regulation of Aversion to Noxious Food by Drosophila Neuropeptide Y- and Insulin-like Systems. Nat. Neurosci. 2005, 8, 1350–1355. [Google Scholar] [CrossRef]
  18. Wu, Q.; Zhang, Y.; Xu, J.; Shen, P. Regulation of Hunger-Driven Behaviors by Neural Ribosomal S6 Kinase in Drosophila. Proc. Natl. Acad. Sci. USA 2005, 102, 13289–13294. [Google Scholar] [CrossRef]
  19. Wu, Q.; Wen, T.; Lee, G.; Park, J.H.; Cai, H.N.; Shen, P. Developmental Control of Foraging and Social Behavior by the Drosophila Neuropeptide Y-like System. Neuron 2003, 39, 147–161. [Google Scholar] [CrossRef]
  20. Yoshinari, Y.; Kosakamoto, H.; Kamiyama, T.; Hoshino, R.; Matsuoka, R.; Kondo, S.; Tanimoto, H.; Nakamura, A.; Obata, F.; Niwa, R. The Sugar-Responsive Enteroendocrine Neuropeptide F Regulates Lipid Metabolism through Glucagon-like and Insulin-like Hormones in Drosophila Melanogaster. Nat. Commun. 2021, 12, 4818. [Google Scholar] [CrossRef]
  21. Chen, J.; Reiher, W.; Hermann-Luibl, C.; Sellami, A.; Cognigni, P.; Kondo, S.; Helfrich-Förster, C.; Veenstra, J.A.; Wegener, C. Allatostatin A Signalling in Drosophila Regulates Feeding and Sleep and is Modulated by PDF. PLoS Genet. 2016, 12, e1006346. [Google Scholar]
  22. Hergarden, A.C.; Tayler, T.D.; Anderson, D.J. Allatostatin-A Neurons Inhibit Feeding Behavior in Adult Drosophila. Proc. Natl. Acad. Sci. USA 2012, 109, 3967–3972. [Google Scholar] [CrossRef]
  23. Hentze, J.L.; Carlsson, M.A.; Kondo, S.; Nässel, D.R.; Rewitz, K.F. The Neuropeptide Allatostatin A Regulates Metabolism and Feeding Decisions in Drosophila. Sci. Rep. 2015, 5, 11680. [Google Scholar] [CrossRef]
  24. Kubrak, O.; Koyama, T.; Ahrentløv, N.; Jensen, L.; Malita, A.; Naseem, M.T.; Lassen, M.; Nagy, S.; Texada, M.J.; Halberg, K.V.; et al. The Gut Hormone Allatostatin C/Somatostatin Regulates Food Intake and Metabolic Homeostasis under Nutrient Stress. Nat. Commun. 2022, 13, 692. [Google Scholar] [CrossRef]
  25. Chatterjee, N.; Perrimon, N. What Fuels the Fly: Energy Metabolism in Drosophila and Its Application to the Study of Obesity and Diabetes. Sci. Adv. 2021, 7, eabg4336. [Google Scholar] [CrossRef]
  26. Shimizu, Y.; Matsuyama, H.; Shiina, T.; Takewaki, T.; Furness, J.B. Tachykinins and Their Functions in the Gastrointestinal Tract. Cell. Mol. Life Sci. 2008, 65, 295–311. [Google Scholar] [CrossRef]
  27. Apidianakis, Y.; Pitsouli, C.; Perrimon, N.; Rahme, L. Synergy between Bacterial Infection and Genetic Predisposition in Intestinal Dysplasia. Proc. Natl. Acad. Sci. USA 2009, 106, 20883–20888. [Google Scholar] [CrossRef]
  28. Klindworth, A.; Pruesse, E.; Schweer, T.; Peplies, J.; Quast, C.; Horn, M.; Glöckner, F.O. Evaluation of General 16S Ribosomal RNA Gene PCR Primers for Classical and Next-Generation Sequencing-Based Diversity Studies. Nucleic Acids Res. 2013, 41, e1. [Google Scholar] [CrossRef]
  29. Mackay, T.F.C.; Richards, S.; Stone, E.A.; Barbadilla, A.; Ayroles, J.F.; Zhu, D.; Casillas, S.; Han, Y.; Magwire, M.M.; Cridland, J.M.; et al. The Drosophila Melanogaster Genetic Reference Panel. Nature 2012, 482, 173–178. [Google Scholar] [CrossRef] [PubMed]
  30. Huang, W.; Massouras, A.; Inoue, Y.; Peiffer, J.; Ràmia, M.; Tarone, A.M.; Turlapati, L.; Zichner, T.; Zhu, D.; Lyman, R.F.; et al. Natural Variation in Genome Architecture among 205 Drosophila Melanogaster Genetic Reference Panel Lines. Genome Res. 2014, 24, 1193–1208. [Google Scholar] [CrossRef] [PubMed]
  31. Heys, C.; Lizé, A.; Blow, F.; White, L.; Darby, A.; Lewis, Z.J. The Effect of Gut Microbiota Elimination in Drosophila Melanogaster: A How-to Guide for Host-Microbiota Studies. Ecol. Evol. 2018, 8, 4150–4161. [Google Scholar] [CrossRef] [PubMed]
  32. Ridley, E.V.; Wong, A.C.-N.; Westmiller, S.; Douglas, A.E. Impact of the Resident Microbiota on the Nutritional Phenotype of Drosophila Melanogaster. PLoS ONE 2012, 7, e36765. [Google Scholar] [CrossRef]
  33. Clark, A.G.; Fucito, C.D. Stress Tolerance and Metabolic Response to Stress in Drosophila Melanogaster. Heredity 1998, 81, 514–527. [Google Scholar] [CrossRef] [PubMed]
  34. Hill, W.G.; Goddard, M.E.; Visscher, P.M. Data and Theory Point to Mainly Additive Genetic Variance for Complex Traits. PLoS Genet. 2008, 4, e1000008. [Google Scholar] [CrossRef]
  35. Weng, Y.-L.; Liu, N.; DiAntonio, A.; Broihier, H.T. The Cytoplasmic Adaptor Protein Caskin Mediates Lar Signal Transduction during Drosophila Motor Axon Guidance. J. Neurosci. 2011, 31, 4421–4433. [Google Scholar] [CrossRef] [PubMed]
  36. Chung, B.Y.; Ro, J.; Hutter, S.A.; Miller, K.M.; Guduguntla, L.S.; Kondo, S.; Pletcher, S.D. Drosophila Neuropeptide F Signaling Independently Regulates Feeding and Sleep-Wake Behavior. Cell Rep. 2017, 19, 2441–2450. [Google Scholar] [CrossRef]
  37. Veenstra, J.A.; Agricola, H.-J.; Sellami, A. Regulatory Peptides in Fruit Fly Midgut. Cell Tissue Res. 2008, 334, 499–516. [Google Scholar] [CrossRef]
  38. Dutta, D.; Dobson, A.J.; Houtz, P.L.; Gläßer, C.; Revah, J.; Korzelius, J.; Patel, P.H.; Edgar, B.A.; Buchon, N. Regional Cell-Specific Transcriptome Mapping Reveals Regulatory Complexity in the Adult Drosophila Midgut. Cell Rep. 2015, 12, 346–358. [Google Scholar] [CrossRef]
  39. Broderick, N.A.; Lemaitre, B. Gut-Associated Microbes of Drosophila Melanogaster. Gut Microbes 2012, 3, 307–321. [Google Scholar] [CrossRef]
  40. Chandler, J.A.; Morgan Lang, J.; Bhatnagar, S.; Eisen, J.A.; Kopp, A. Bacterial Communities of Diverse Drosophila Species: Ecological Context of a Host–Microbe Model System. PLoS Genet. 2011, 7, e1002272. [Google Scholar] [CrossRef]
  41. Rothschild, D.; Weissbrod, O.; Barkan, E.; Kurilshikov, A.; Korem, T.; Zeevi, D.; Costea, P.I.; Godneva, A.; Kalka, I.N.; Bar, N.; et al. Environment Dominates over Host Genetics in Shaping Human Gut Microbiota. Nature 2018, 555, 210–215. [Google Scholar] [CrossRef]
  42. Cognigni, P.; Bailey, A.P.; Miguel-Aliaga, I. Enteric Neurons and Systemic Signals Couple Nutritional and Reproductive Status with Intestinal Homeostasis. Cell Metab. 2011, 13, 92–104. [Google Scholar] [CrossRef] [PubMed]
  43. Dus, M.; Lai, J.S.-Y.; Gunapala, K.M.; Min, S.; Tayler, T.D.; Hergarden, A.C.; Geraud, E.; Joseph, C.M.; Suh, G.S.B. Nutrient Sensor in the Brain Directs the Action of the Brain-Gut Axis in Drosophila. Neuron 2015, 87, 139–151. [Google Scholar] [CrossRef] [PubMed]
  44. Lin, S.; Senapati, B.; Tsao, C.-H. Neural Basis of Hunger-Driven Behaviour in Drosophila. Open Biol. 2019, 9, 180259. [Google Scholar] [CrossRef] [PubMed]
  45. Keene, A.C.; Duboué, E.R.; McDonald, D.M.; Dus, M.; Suh, G.S.B.; Waddell, S.; Blau, J. Clock and Cycle Limit Starvation-Induced Sleep Loss in Drosophila. Curr. Biol. 2010, 20, 1209–1215. [Google Scholar] [CrossRef] [PubMed]
  46. Chopra, G.; Kaushik, S.; Kain, P. Nutrient Sensing via Gut in Drosophila Melanogaster. Int. J. Mol. Sci. 2022, 23, 2694. [Google Scholar] [CrossRef]
  47. Veenstra, J.A.; Ida, T. More Drosophila Enteroendocrine Peptides: Orcokinin B and the CCHamides 1 and 2. Cell Tissue Res. 2014, 357, 607–621. [Google Scholar] [CrossRef]
  48. Visscher, P.M.; Hill, W.G.; Wray, N.R. Heritability in the Genomics Era—Concepts and Misconceptions. Nat. Rev. Genet. 2008, 9, 255–266. [Google Scholar] [CrossRef]
  49. O’Connell, K.S.; Hindley, G.; Smeland, O.B.; Shadrin, A.; Wang, Y.; Frei, O.; Andreassen, O.A. Chapter 16—Shared Heritability among Psychiatric Disorders and Traits. In Translational and Applied Genomics; Tsermpini, E.E., Alda, M., Patrinos, G.P.B.T.-P.G., Eds.; Academic Press: Cambridge, MA, USA, 2022; pp. 341–360. ISBN 978-0-12-819602-1. [Google Scholar]
  50. Martin, A.R.; Daly, M.J.; Robinson, E.B.; Hyman, S.E.; Neale, B.M. Predicting Polygenic Risk of Psychiatric Disorders. Biol. Psychiatry 2019, 86, 97–109. [Google Scholar] [CrossRef]
  51. Havdahl, A.; Niarchou, M.; Starnawska, A.; Uddin, M.; van der Merwe, C.; Warrier, V. Genetic Contributions to Autism Spectrum Disorder. Psychol. Med. 2021, 51, 2260–2273. [Google Scholar] [CrossRef]
  52. Blizard, D.A.; Adams, N. The Maudsley Reactive and Nonreactive Strains: A New Perspective. Behav. Genet. 2002, 32, 277–299. [Google Scholar] [CrossRef]
  53. Branicky, R.; Hekimi, S. What Keeps C. Elegans Regular: The Genetics of Defecation. Trends Genet. 2006, 22, 571–579. [Google Scholar] [CrossRef] [PubMed]
  54. Bonfiglio, F.; Liu, X.; Smillie, C.; Pandit, A.; Kurilshikov, A.; Bacigalupe, R.; Zheng, T.; Nim, H.; Garcia-Etxebarria, K.; Bujanda, L.; et al. GWAS of Stool Frequency Provides Insights into Gastrointestinal Motility and Irritable Bowel Syndrome. Cell Genom. 2021, 1, 100069. [Google Scholar] [CrossRef] [PubMed]
  55. Lin, H.-H.; Kuang, M.C.; Hossain, I.; Xuan, Y.; Beebe, L.; Shepherd, A.K.; Rolandi, M.; Wang, J.W. A Nutrient-Specific Gut Hormone Arbitrates between Courtship and Feeding. Nature 2022, 602, 632–638. [Google Scholar] [CrossRef]
  56. Jimenez-Sanchez, G.; Hebron, K.J.; Thomas, G.; Valle, D. Targeted Disruption of the 70 kDa Peroxisomal Membrane Protein (PMP70) in Mouse is Associated with an Increase in the Related P70R Protein, Deficiency of Hepatic Glycogen and a Dicarboxylic Aciduria. Pediatr. Res. 1999, 45, 139. [Google Scholar] [CrossRef]
  57. Imanaka, T.; Aihara, K.; Suzuki, Y.; Yokota, S.; Osumi, T. The 70-KDa Peroxisomal Membrane Protein (PMP70) an ATP-Binding Cassette Transporter. Cell Biochem. Biophys. 2000, 32, 131–138. [Google Scholar] [CrossRef] [PubMed]
  58. Schnorrer, F.; Schönbauer, C.; Langer, C.C.H.; Dietzl, G.; Novatchkova, M.; Schernhuber, K.; Fellner, M.; Azaryan, A.; Radolf, M.; Stark, A.; et al. Systematic Genetic Analysis of Muscle Morphogenesis and Function in Drosophila. Nature 2010, 464, 287–291. [Google Scholar] [CrossRef]
  59. Hudson, A.M.; Petrella, L.N.; Tanaka, A.J.; Cooley, L. Mononuclear Muscle Cells in Drosophila Ovaries Revealed by GFP Protein Traps. Dev. Biol. 2008, 314, 329–340. [Google Scholar] [CrossRef]
  60. Vasmer, D.; Pooryasin, A.; Riemensperger, T.; Fiala, A. Induction of Aversive Learning through Thermogenetic Activation of Kenyon Cell Ensembles in Drosophila. Front. Behav. Neurosci. 2014, 8, 174. [Google Scholar] [CrossRef]
  61. Pang, T.-L.; Ding, Z.; Liang, S.-B.; Li, L.; Zhang, B.; Zhang, Y.; Fan, Y.-J.; Xu, Y.-Z. Comprehensive Identification and Alternative Splicing of Microexons in Drosophila. Front. Genet. 2021, 12, 642602. [Google Scholar] [CrossRef]
  62. Tsao, C.-H.; Chen, C.-C.; Lin, C.-H.; Yang, H.-Y.; Lin, S. Drosophila Mushroom Bodies Integrate Hunger and Satiety Signals to Control Innate Food-Seeking Behavior. Elife 2018, 7, e35264. [Google Scholar] [CrossRef] [PubMed]
Figure 1. Ingestion of virulent bacteria and specific gut microbiota increase gut motility in Drosophila. (A) Defecation assay customized to examine the impact of PA14 on the defecation rate. At 15 h of feeding on PA14 or vehicle (4% sucrose) female flies were starved in empty fly vials for 5 h and then allowed to feed again for 5 h in fly vials containing 4% sucrose and 0.5% bromophenol blue (BPB) which colored fly food blue (at pH = 7). Conditioned flies were then transferred to plates feeding on 4% sucrose and 0.5% BPB for another day. Defecation rate was calculated as fecal spots per fly per day excreted by groups of 10 flies in 6 independent replicates. (B) Fecal spots per fly per day upon PA14 infection or without infection, of five populations of Oregon-R (OR) flies, reared in parallel in the lab for one year. Statistical analysis was performed using two-way ANOVA test with Tukey’s post-hoc correction. Statistical significance was observed in all cases (*** p < 0.001). (C) CFUs of intestinal bacteria per fly, shaped on LB or BHI media, in the absence or presence of rifampicin. Statistical analysis was performed using two-way ANOVA test with Tukey’s post-hoc correction. Statistical significance was observed in all cases (*** p < 0.001). (D) Bacterial species found in adult female flies of the OR9 and OR3 populations feeding on LB or BHI media, with and without rifampicin. Extraction of genomic DNA from single colonies and sequencing followed by BLAST search of the sequences, revealed five rifampicin-sensitive bacterial species, common to both OR9 and OR3 and two rifampicin-resistant strains (E. haemoperoxidus and S. arlettae), exclusive to OR9. (E) Fecal spots per day per female of the OR9 and OR3 populations, following ingestion of either PA14 or rifampicin-resistant strains E. haemoperoxidus or S. arlettae, alone or in combinations, in six independent replicates. Statistical analysis was performed using the Mann–Whitney U test. Statistical significance is indicated as * p < 0.05. All error bars represent standard deviation of the mean.
Metabolites 13 00264 g001
Figure 2. Starvation and dietary ethanol reduce Drosophila gut motility and lifespan. (A) Kaplan–Meyer survival curves of Oregon-R female flies, fed with either a 4% sucrose control diet (grey line) or 4% sucrose plus 25% ethanol (black line) (B) Survival curves of Oregon-R female flies, fed with either 4% sucrose (grey line) or starved, given only water (black line). For all experiments, n = 120 flies per condition. Statistical analysis was performed using the log-rank test. Statistical significance was observed in all cases (*** p < 0.001). (C) Fecal spots per fly per day upon feeding on 4% sucrose with and without 25% ethanol or upon water only starvation. Each column represents the mean value of six biological replicates. Error bars represent standard deviation of the mean. Statistical analysis was performed using the Mann–Whitney U test. Statistical significance indicated as * p < 0.05 or ** p < 0.01.
Metabolites 13 00264 g002
Figure 3. Phenotypic ranking and additive genetic basis of defecation rate of 150 DGRP strains. (A) Z-score analysis of the defecation rate of 150 DGRP strains, upon oral ingestion of P. aeruginosa. (B) Validation of defecation rate of 27 DGRP strains deviating by ≥1.25 SDs above or below the mean of the Z-score analysis, upon and without PA14 infection. Vertical red and blue arrows indicate a ≥2-fold change in the defecation rate, upon PA14 ingestion, in 6 out of 16 strains exhibiting extremely enhanced defecation rates and in 3 out of 11 strains exhibiting extremely reduced defecation rates, respectively. Each column represents the mean value of six biological replicates. Error bars represent standard deviation of the mean. Statistical analysis was performed using the Mann–Whitney U test. Statistical significance indicated as * p < 0.05 or ** p < 0.01, *** p < 0.001. (C) Narrow sense heritability ( h 2 ) of the defecation rate was calculated based on crossing schemes between DGRP strains displaying high defecation rates (25201, 28171 and 25208) or low defecation rates (28182, 28150 and 28153). The standard error for the calculation of h 2 was 0.11.
Metabolites 13 00264 g003
Figure 4. GWAS-identified and hormone gene downregulation either ubiquitously or specifically in EEs or neurons affects fly defecation rate. Fecal spots per fly per day upon (A) ubiquitous (via act-Gal4 UAS-RNAi), (B) EE-specific (via prosV1-Gal4 UAS-RNAi) and (C) pan-neuron-specific (via elav-Gal4 UAS-RNAi) downregulation of indicated GWAS-identified genes, divided by that of the uninfected progeny of Gal4 crossed to w1118. (D) Fecal spots per uninfected fly per day upon EE-specific (via prosV1-Gal4 UAS-RNAi) downregulation of hormone genes, divided by that of the progeny of Gal4 crossed to w1118 flies. Each column represents the mean value of six biological replicates. Error bars represent standard deviation of the mean. Statistical significance using the Mann–Whitney U test indicated as * p < 0.05 or ** p < 0.01. (E) Schematic of the Drosophila midgut, indicating the anterior and posterior regions and the expression of Dh31-Gal4 UAS-mCherry-NLS reporter (red) that colocalizes with anti-Prospero antibody staining of EEs (green), indicated by white arrows.
Metabolites 13 00264 g004
Figure 5. High defecation rate DGRP lines exhibit higher midgut expression of NPF and CG11307, indicated by horizontal red arrows. Midgut expression of hormone encoding genes (AstA, AstC, Dh31, Ilp3, Ms, Tk, Dar-2) and GWAS-identified genes considered either positive regulators of the defecation rate, (Pmp70, mub, meso18E) or negative regulators (Bin3, ckn and jumu), in eight DGRP lines displaying high (25208, 28128, 25201, 28180, 28171, 28123, 29658, 28244) versus eight DGRP lines displaying low (28206, 28182, 28153, 28246, 25745, 25189, 28242, 28150) defecation rates. For each of the 16 DGRP lines the mean expression value of six biological replicates per gene was calculated and normalized to that of the strain OR6, and then used to find the relative average expression per group of eight high and eight low defecation rate lines. Statistical analysis was performed using the Mann–Whitney U test. Statistical significance (p < 0.05) is indicated with asterisks and red font for NPF and CG11307.
Metabolites 13 00264 g005
Figure 6. Midgut expression levels of hormone-encoding and GWAS genes upon ubiquitous downregulation of GWAS-identified positive regulator genes of the defecation rate. Relative expression levels of (A) hormones and (B) GWAS-identified genes associated with defecation rate, in the midgut of flies upon ubiquitous downregulation (via act-Gal4-UAS-RNAi) of positive regulators of the defecation rate, Pmp70, or mub, or meso18E, or CG11307, normalized to flies prepared from Gal4 lines crossed to w1118. Ubiquitous downregulation of either jumu or CG7166 was used as a control. Values indicated in red represent a ≥0.3 decrease (red arrow pointing down), whereas values in blue represent a ≥0.3 increase (blue arrow pointing up) from the baseline value of 1. Each number represents the average of six values.
Metabolites 13 00264 g006
Figure 7. Downregulation of GWAS genes, mub, CG11307 and Pmp70, in EEs or neurons consistently reduces Dh31 and increases AstC and AstA expression in the midgut, while Dh31, AstC and AstA expression are all increased in the head. Relative expression levels of (A) hormone-encoding genes Dh31, AstC and AstA and (B) GWAS-identified genes ckn, NPF and meso18E in the midgut and head of flies upon EE-specific (via prosV1-Gal4-UAS-RNAi) or pan-neuronal (via elav-Gal4-UAS-RNAi) downregulation of Pmp70, mub or CG11307, normalized to flies prepared from Gal4 lines crossed to w1118. Values in red font accompanied by a red arrow pointing down represent statistically significant decrease. Values in blue font accompanied by a blue arrow pointing up represent statistically significant increase. Each number represents the average of 12 values. Statistical analysis was performed using the t-test. Statistical significance indicated as * p < 0.05, ** p < 0.01 or *** p < 0.001.
Metabolites 13 00264 g007
Figure 8. Starvation reduces expression of hormonal genes, Dh31, AstC and AstA, and positive regulators, Pmp70 in the midgut, and meso18E in the head. Relative expression of (A) hormone-encoding genes Dh31, AstA, AstC and NPF and (B) GWAS-identified positive (Pmp70, CG11307, meso18E and mub) and negative (ckn) regulators of the defecation rate, in midgut and head, upon starvation vs. feeding on 4% sucrose of female OR6 adults. Values indicated in red accompanied by a red arrow pointing down represent statistically significant decrease in the relative hormone gene expression. Each number represents the average of twelve values. Statistical significance using the t-test is indicated as * p < 0.05, ** p < 0.01 or *** p < 0.001.
Metabolites 13 00264 g008
Figure 9. Downregulation of Dh31 in EEs or neurons reduces Dh31 expression in both the midgut and the head, while downregulation of Dh31 in EEs increases AstC and AstA expression in the midgut. Relative expression levels of hormone-encoding genes Dh31, AstA and AstC in the midgut and the head upon EE-specific (via prosV1-Gal4-UAS-RNAi) or pan-neuron-specific (via elav-Gal4-UAS-RNAi) downregulation of Dh31 or VM-specific (via 24B-Gal4-UAS-RNAi) downregulation of Dh31-R, normalized to flies prepared from Gal4 lines crossed to w1118. Values indicated in red and blue represent statistically significant decrease (red arrow pointing down) and increase (blue arrow pointing up) respectively, of the relative hormone gene expression. Each number represents the average of 12 values. Statistical analysis was performed using the t-test. Statistical significance indicated as * p < 0.05, ** p < 0.01 or *** p < 0.001.
Metabolites 13 00264 g009
Figure 10. Pmp70, mub and CG11307, control Dh31 positively in the midgut and negatively in the head, irrespective of the tissue being targeted for downregulation (midgut EEs or neurons). Proposed mechanism depicting the communication between GWAS-identified genes and Dh31 along the gut-brain axis. While a positive regulator of defecation rate, Dh31 is induced in the midgut via Pmp70, mub, CG11307 expression in EEs or neurons. Interestingly, Dh31 is inhibited in the head via Pmp70, mub, CG11307 expression in EEs or neurons. However, Dh31 positively regulates itself, locally and remotely, in the midgut and head tissues, when expressed in either midgut EEs or neurons. Red lines on the diagram represent negative regulation while the black arrows represent positive regulation of defecation rate.
Metabolites 13 00264 g010
Table 1. Defecation rate associated genes identified by GWAS analysis. Genes associated with defecation rate identified by phenotypic analysis of 150 DGRP strains and the DGRP GWAS Webtool (http://dgrp2.gnets.ncsu.edu/) (accessed throughout 2017–2022). Commonly occurring polymorphisms (SNPs) associated with 17 genes and their function and midgut expression are shown.
Gene Affected (FlyBase ID, Name)Associated Variant ID (SNPs)Variant Hits per GeneGene Function and Midgut Expression (Flybase and FlyGutSeq)
FBgn0016075, vkg2L_5025290_SNP
2L_5025252_SNP
2L_5025248_SNP
3Subunit of Collagen IV, a major component of basement membranes. Anterior midgut visceral muscle expression and enteroendocrine cell induction by infection.
FBgn0261388, CG42629X_12955420_SNP
X_12955430_SNP
2radish (rad) encodes a protein involved in anesthesia-resistant memory, heart contraction regulation, and small GTPase mediated signal transduction.
FBgn0262222, mir-971X_12955420_SNP
X_12955430_SNP
2Micro-RNA gene (within the rad locus) of unknown function. Enterocyte and visceral muscle expression.
FBgn0020306, dom2R_17221075_SNP
2R_17220640_SNP
2R_17220646_SNP
3Tip60 acetyltransferase complex and functions in the exchange of histone His2Av. Uniform expression and stem cell induction upon infection.
FBgn0031069, Pmp70X_19647084_SNP1ATPase-coupled peroxisomal transmembrane transporter of long-chain fatty acids. High enteroendocrine cell and visceral muscle expression.
FBgn0037106, CG113073L_21612306_SNP
3L_21612307_SNP
2Unknown function. Enteroendocrine cell expression.
FBgn0037107, CG71663L_21612306_SNP
3L_21612307_SNP
2Predicted to be involved in homophilic cell adhesion. Enteroendocrine cell expression.
FBgn0262737, mub3L_21916473_SNP
3L_21853239_SNP
2Regulation of alternative mRNA splicing.
FBgn0033987, ckn2R_10853015_SNP1Cell contact and tyrosine phosphatase signaling pathway. Enteroendocrine cell expression.
FBgn0024321, NK7.13R_10187071_SNP1Regulation of transcription by RNA polymerase II. Uniform expression.
FBgn0040089, meso18EX_19604135_SNP1Visceral muscle development. Uniform expression and progenitor cell bias.
FBgn0004644, hh3R_18968168_SNP1Morphogen. Uniform expression and enteroblast bias.
FBgn0016075, CG80653L_10208120_SNP1Unknown function. Enterocyte lineage expression.
FBgn00263144, Bin32R_2126406_SNP1mRNA translation inhibition. Uniform expression and enterocyte bias.
FBgn0052365, CG323653L_7873543_SNP1Unknown function. Uniform expression and progenitor cell bias.
FBgn0001316, klar3L_461631_SNP1Organelle movement via microtubules. Uniform expression and enteroblast bias.
FBgn0011828, pxn3L_2603619_SNP1Collagen IV cross-linking. Uniform expression, enteroendocrine cell induction by infection.
Disclaimer/Publisher’s Note: The statements, opinions and data contained in all publications are solely those of the individual author(s) and contributor(s) and not of MDPI and/or the editor(s). MDPI and/or the editor(s) disclaim responsibility for any injury to people or property resulting from any ideas, methods, instructions or products referred to in the content.

