
Fecal Microbiota and Associated Volatile Organic Compounds Distinguishing No-Adenoma from High-Risk Colon Adenoma Adults

 , , , ,
Abstract
:1. Introduction
2. Materials and Methods
2.1. Sample Collection
2.2. Fecal Bacteria DNA Isolation and 16S Gene Amplicon Sequencing
2.3. Bioinformatics and Statistical Analyses for Metagenomics
2.4. HS-SPME-GC-MS Headspace Analysis of Fecal VOCs
2.5. Volatolomic and Combinatorial Omic Statistical Analyses
3. Results
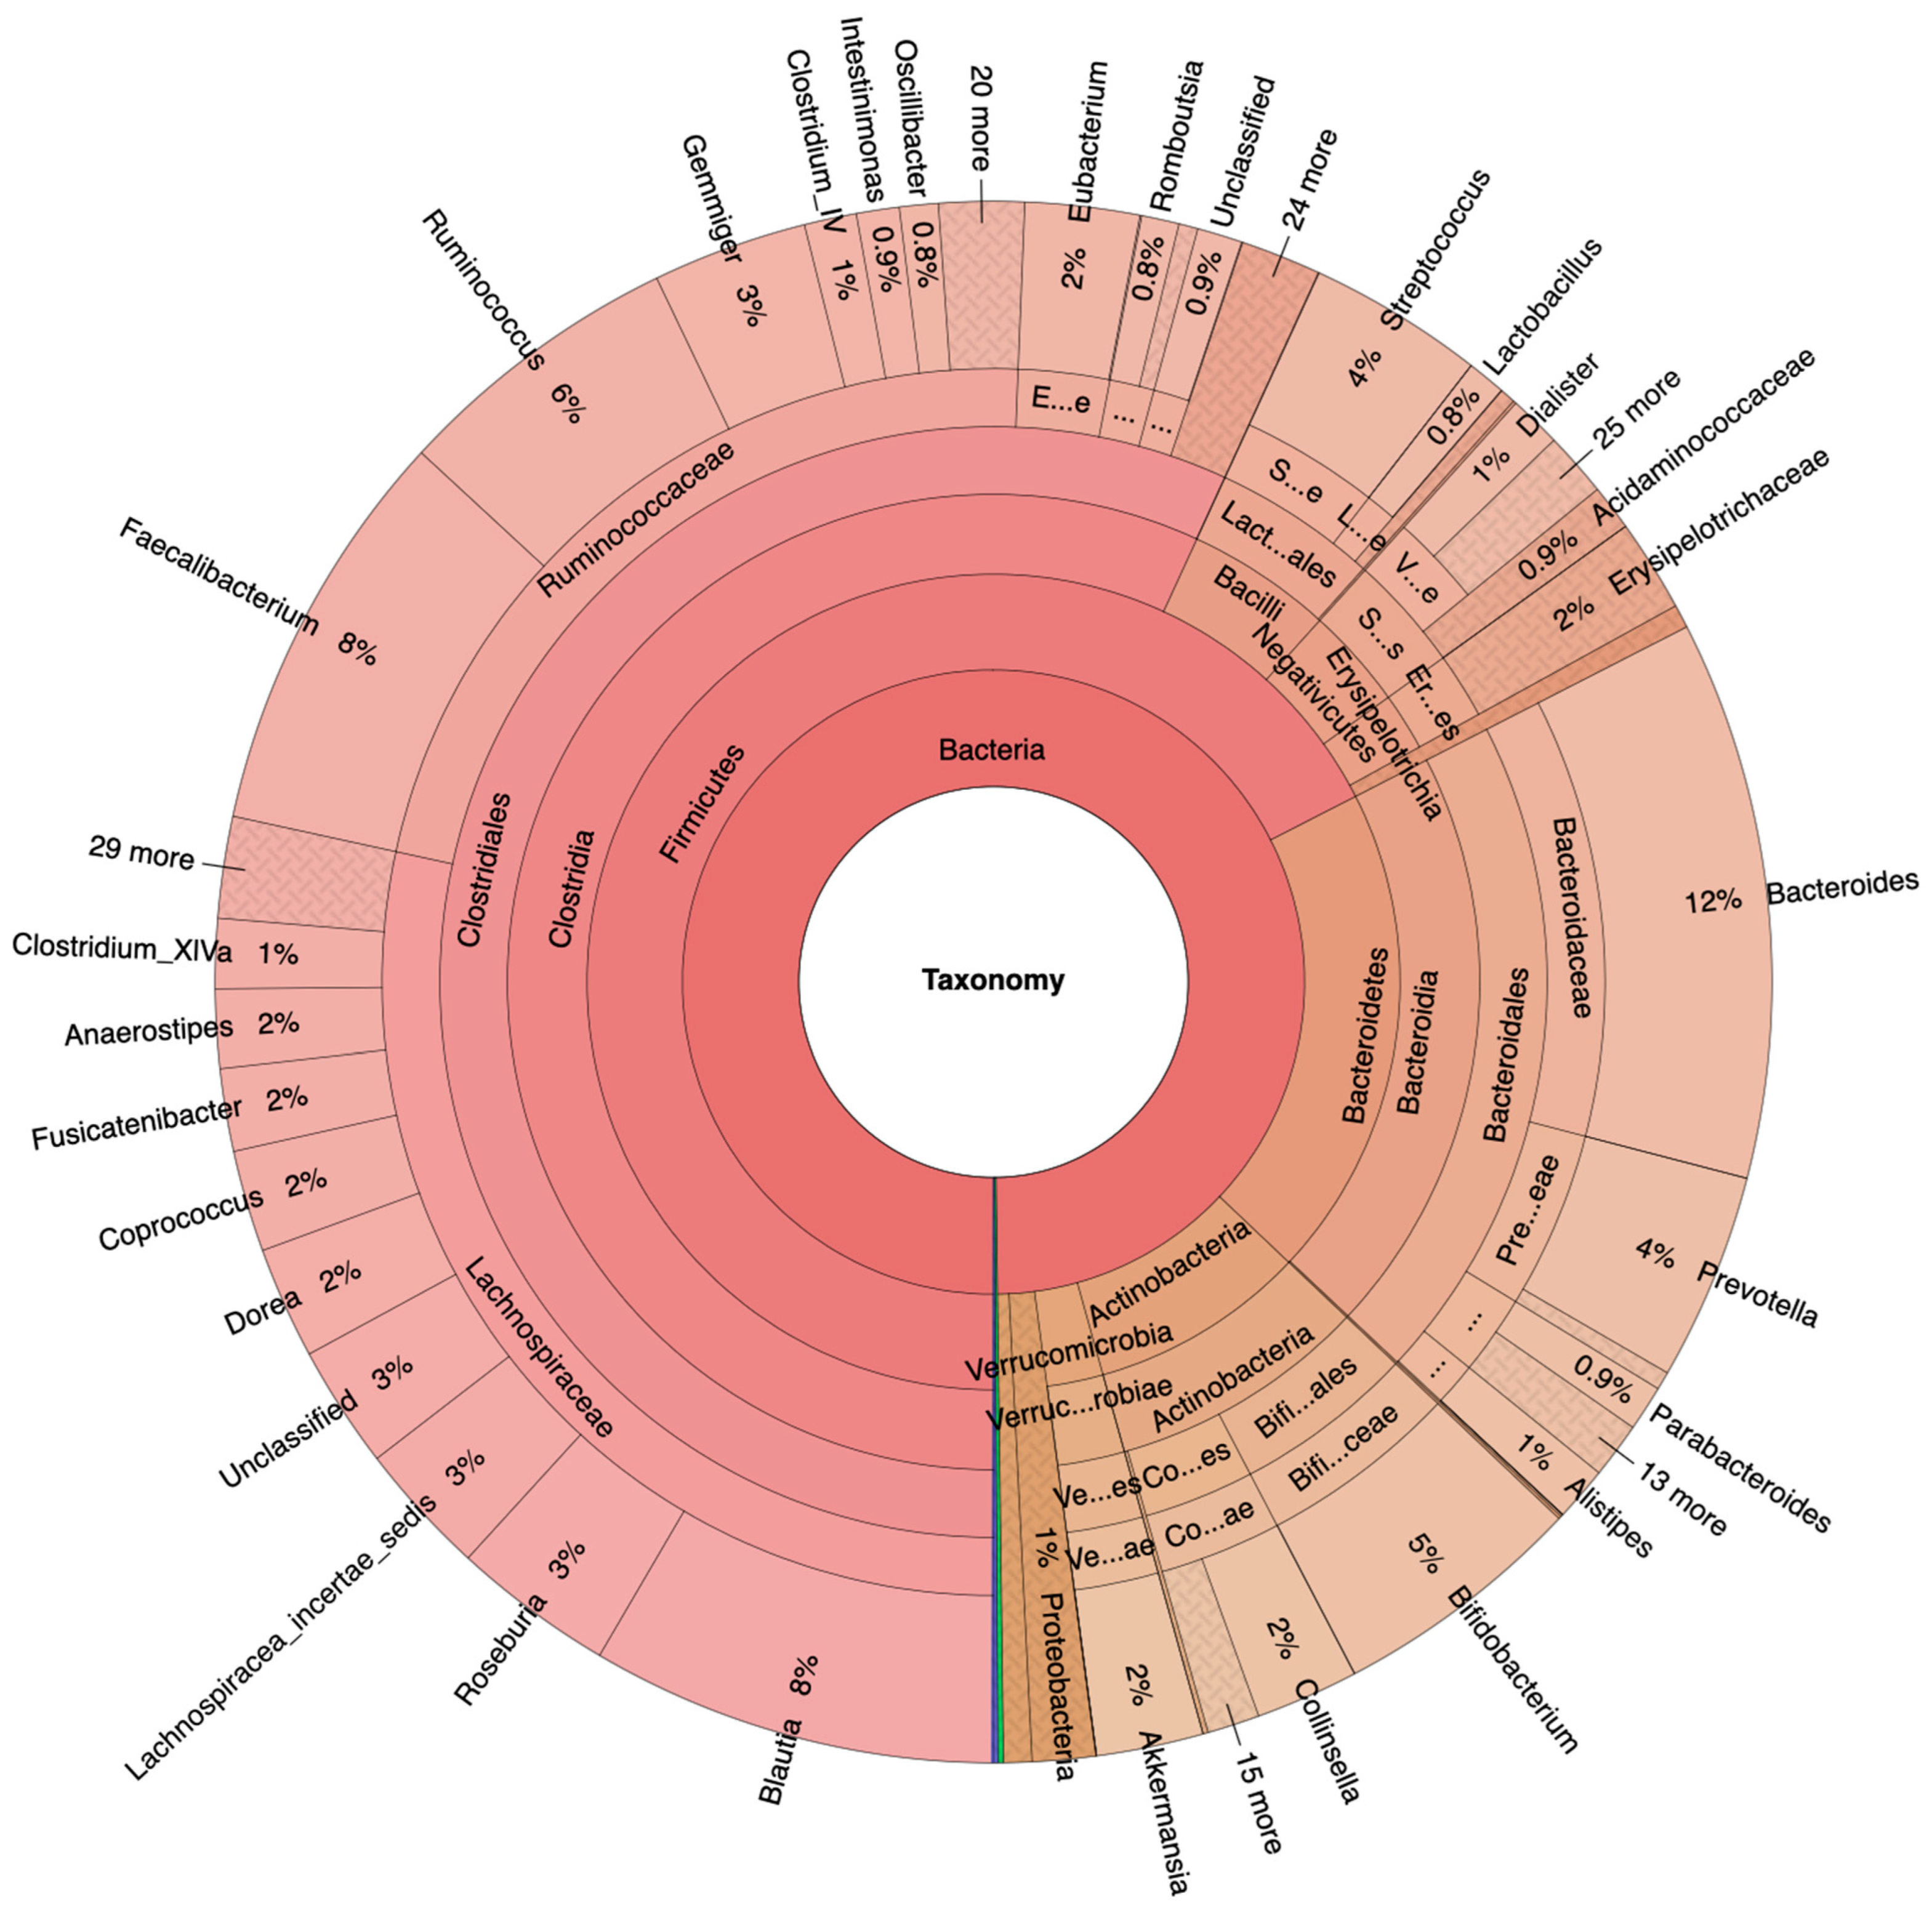
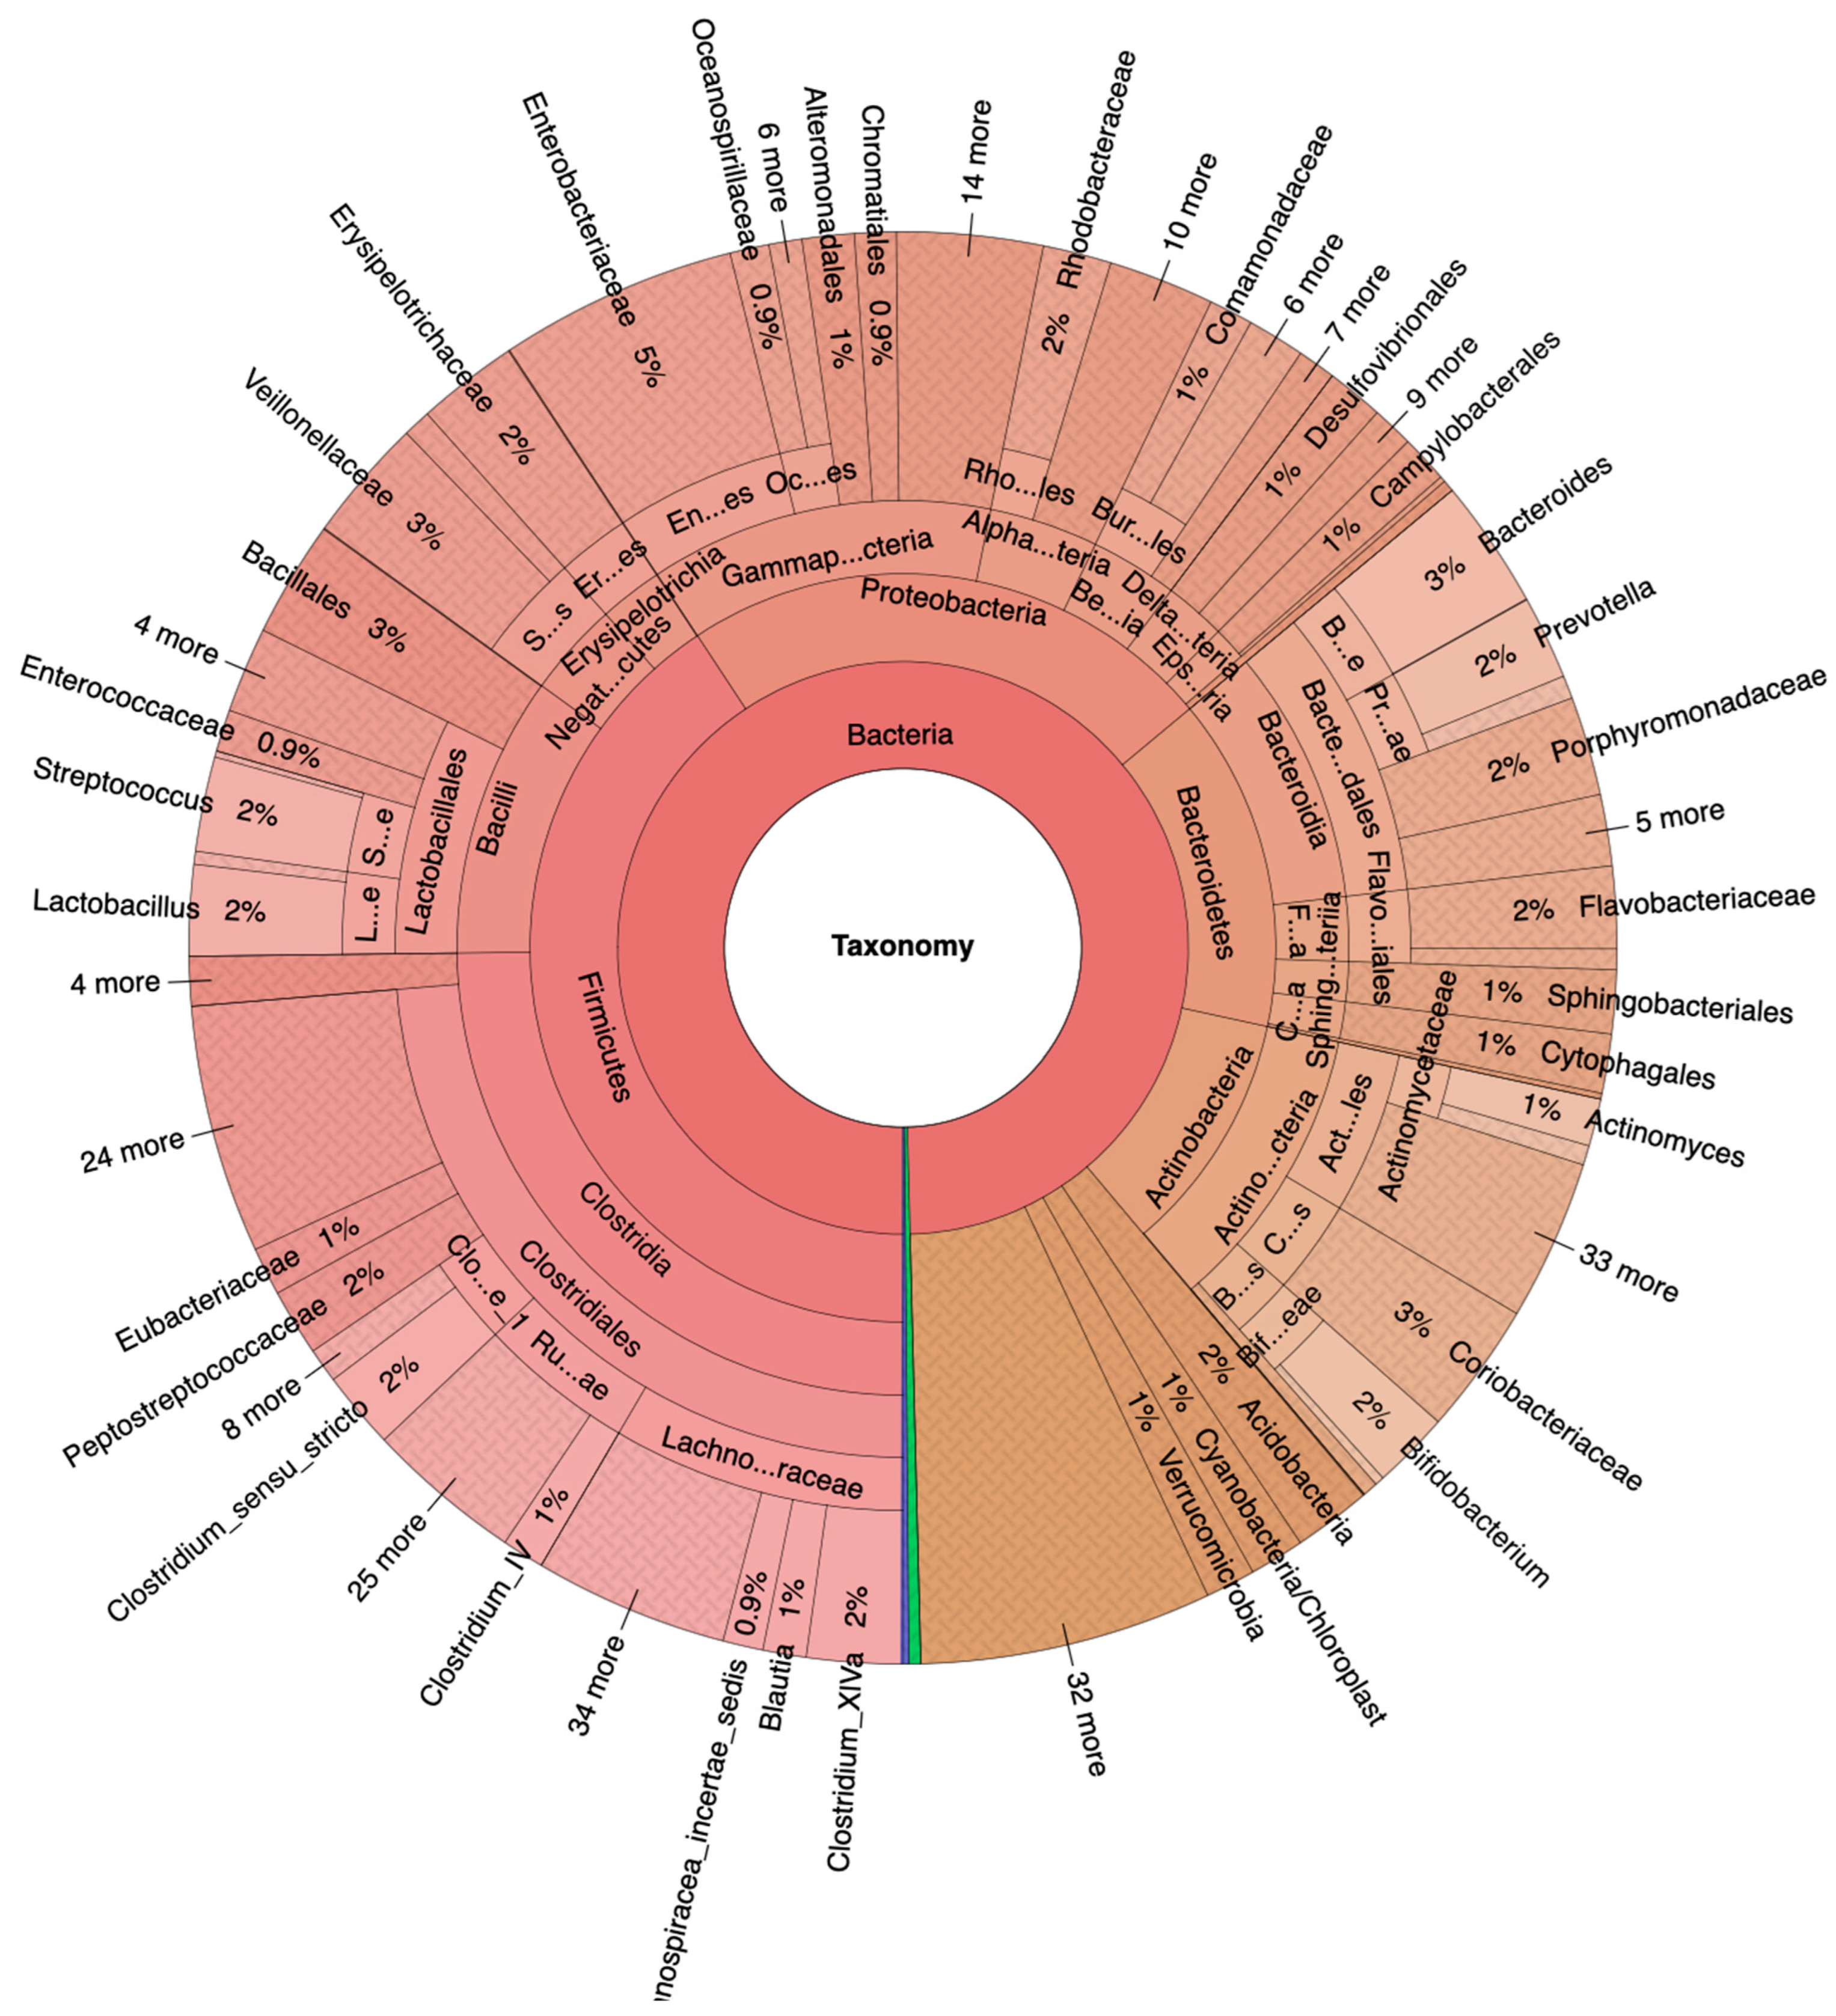
3.1. Fecal Bacteria Prevalence and Diversity in NA and HRA Individuals
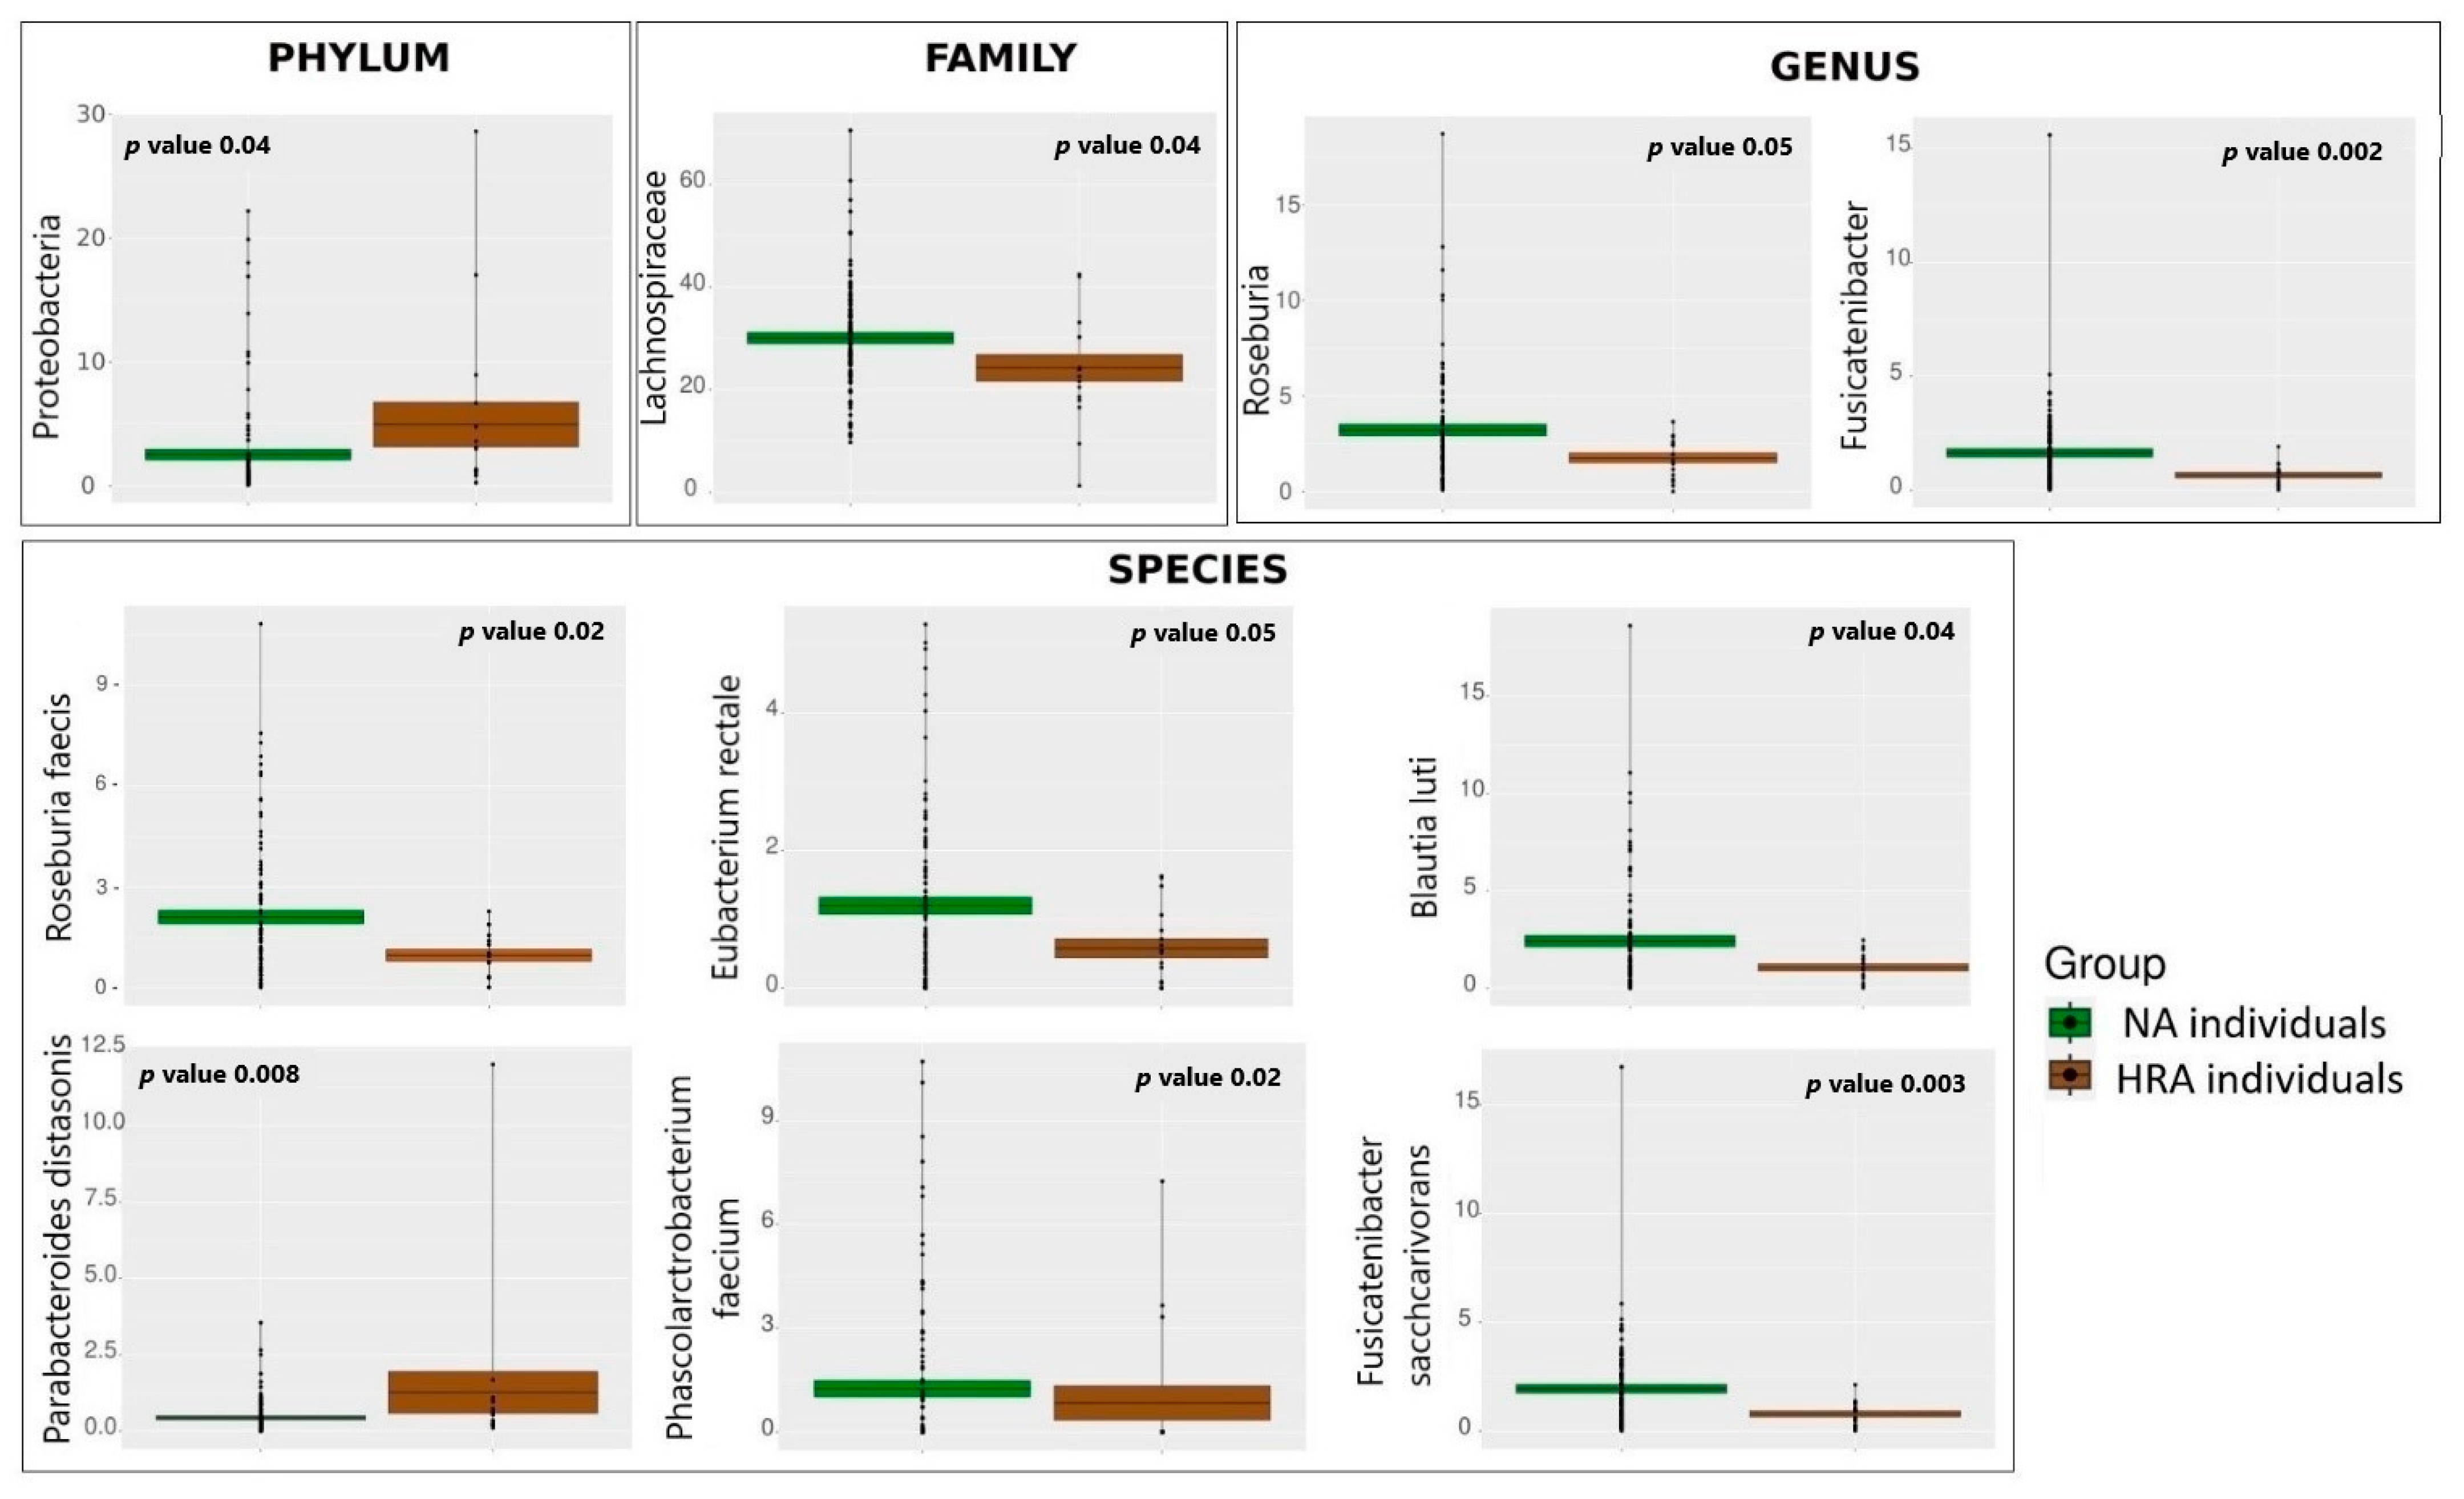
3.2. Significant Fecal Bacteria Differences between NA and HRA Individuals
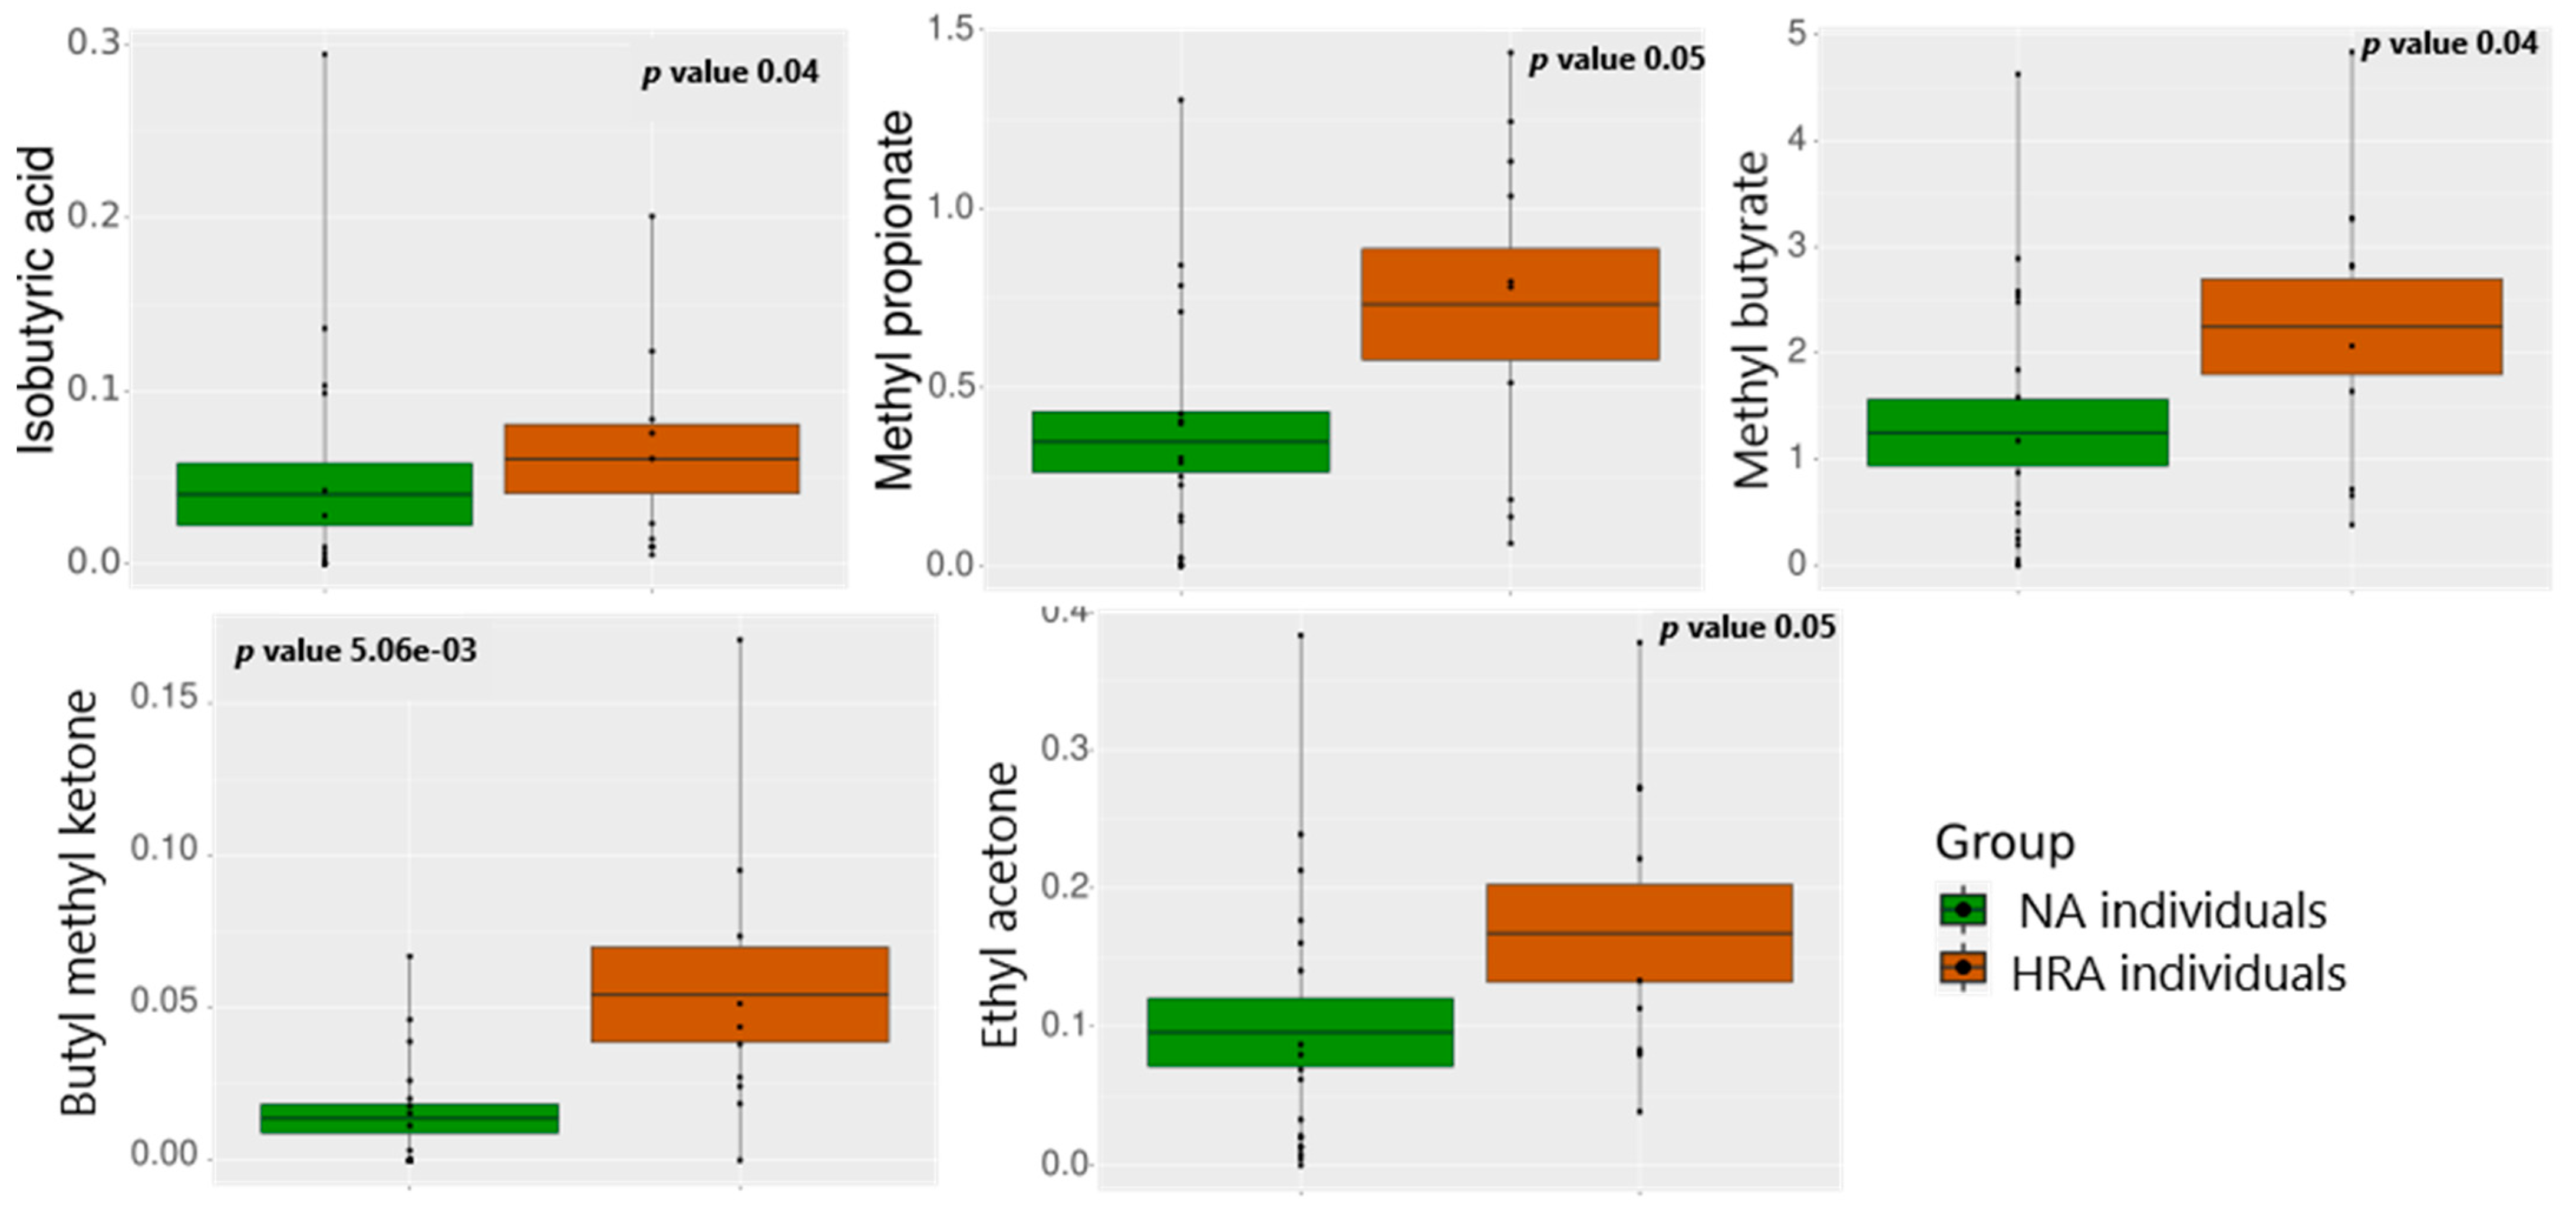
3.3. VOC Abundance in NA and HRA Individuals
3.4. Associations between Bacterial Families and VOCs in NA and HRA Individuals
3.5. Associations between Bacterial Genera and VOCs in NA and HRA Individuals
4. Discussion
4.1. Fecal Bacteriome Analysis
4.2. Fecal Volatilome Analysis
4.3. Fecal Bacteriome to Volatilome Analysis
5. Conclusions
Supplementary Materials
Author Contributions
Funding
Institutional Review Board Statement
Informed Consent Statement
Data Availability Statement
Acknowledgments
Conflicts of Interest
References
- Xi, Y.; Xu, P. Global colorectal cancer burden in 2020 and projections to 2040. Transl. Oncol. 2021, 14, 101174. [Google Scholar] [CrossRef] [PubMed]
- Katsaounou, K.; Nicolaou, E.; Vogazianos, P.; Brown, C.; Stavrou, M.; Teloni, S.; Hatzis, P.; Agapiou, A.; Fragkou, E.; Tsiaoussis, G.; et al. Colon Cancer: From Epidemiology to Prevention. Metabolites 2022, 12, 499. [Google Scholar] [CrossRef] [PubMed]
- Panayidou, S.; Apidianakis, Y. Regenerative inflammation: Lessons from Drosophila intestinal epithelium in health and disease. Pathogens 2013, 2, 209–231. [Google Scholar] [CrossRef] [PubMed] [Green Version]
- de Vos, W.M.; Tilg, H.; Van Hul, M.; Cani, P.D. Gut microbiome and health: Mechanistic insights. Gut 2022, 71, 1020–1032. [Google Scholar] [CrossRef] [PubMed]
- Rios-Covian, D.; Gonzalez, S.; Nogacka, A.M.; Arboleya, S.; Salazar, N.; Gueimonde, M.; de Los Reyes-Gavilan, C.G. An Overview on Fecal Branched Short-Chain Fatty Acids along Human Life and as Related with Body Mass Index: Associated Dietary and Anthropometric Factors. Front. Microbiol. 2020, 11, 973. [Google Scholar] [CrossRef]
- Kostic, A.D.; Chun, E.; Robertson, L.; Glickman, J.N.; Gallini, C.A.; Michaud, M.; Clancy, T.E.; Chung, D.C.; Lochhead, P.; Hold, G.L.; et al. Fusobacterium nucleatum potentiates intestinal tumorigenesis and modulates the tumor-immune microenvironment. Cell Host Microbe 2013, 14, 207–215. [Google Scholar] [CrossRef] [Green Version]
- Clos-Garcia, M.; Garcia, K.; Alonso, C.; Iruarrizaga-Lejarreta, M.; D’Amato, M.; Crespo, A.; Iglesias, A.; Cubiella, J.; Bujanda, L.; Falcon-Perez, J.M. Integrative Analysis of Fecal Metagenomics and Metabolomics in Colorectal Cancer. Cancers 2020, 12, 1142. [Google Scholar] [CrossRef]
- Xie, Y.H.; Gao, Q.Y.; Cai, G.X.; Sun, X.M.; Sun, X.M.; Zou, T.H.; Chen, H.M.; Yu, S.Y.; Qiu, Y.W.; Gu, W.Q.; et al. Fecal Clostridium symbiosum for Noninvasive Detection of Early and Advanced Colorectal Cancer: Test and Validation Studies. EBioMedicine 2017, 25, 32–40. [Google Scholar] [CrossRef] [Green Version]
- Rezasoltani, S.; Sharafkhah, M.; Asadzadeh Aghdaei, H.; Nazemalhosseini Mojarad, E.; Dabiri, H.; Akhavan Sepahi, A.; Modarressi, M.H.; Feizabadi, M.M.; Zali, M.R. Applying simple linear combination, multiple logistic and factor analysis methods for candidate fecal bacteria as novel biomarkers for early detection of adenomatous polyps and colon cancer. J. Microbiol. Methods 2018, 155, 82–88. [Google Scholar] [CrossRef]
- Long, X.; Wong, C.C.; Tong, L.; Chu, E.S.H.; Ho Szeto, C.; Go, M.Y.Y.; Coker, O.O.; Chan, A.W.H.; Chan, F.K.L.; Sung, J.J.Y.; et al. Peptostreptococcus anaerobius promotes colorectal carcinogenesis and modulates tumour immunity. Nat. Microbiol. 2019, 4, 2319–2330. [Google Scholar] [CrossRef]
- Iyadorai, T.; Mariappan, V.; Vellasamy, K.M.; Wanyiri, J.W.; Roslani, A.C.; Lee, G.K.; Sears, C.; Vadivelu, J. Prevalence and association of pks+ Escherichia coli with colorectal cancer in patients at the University Malaya Medical Centre, Malaysia. PLoS ONE 2020, 15, e0228217. [Google Scholar] [CrossRef]
- Vernia, F.; Valvano, M.; Fabiani, S.; Stefanelli, G.; Longo, S.; Viscido, A.; Latella, G. Are Volatile Organic Compounds Accurate Markers in the Assessment of Colorectal Cancer and Inflammatory Bowel Diseases? A Review. Cancers 2021, 13, 2361. [Google Scholar] [CrossRef]
- Monedeiro, F.; Monedeiro-Milanowski, M.; Ligor, T.; Buszewski, B. A Review of GC-Based Analysis of Non-Invasive Biomarkers of Colorectal Cancer and Related Pathways. J. Clin. Med. 2020, 9, 3191. [Google Scholar] [CrossRef]
- Nagata, N.; Tohya, M.; Fukuda, S.; Suda, W.; Nishijima, S.; Takeuchi, F.; Ohsugi, M.; Tsujimoto, T.; Nakamura, T.; Shimomura, A.; et al. Effects of bowel preparation on the human gut microbiome and metabolome. Sci. Rep. 2019, 9, 4042. [Google Scholar] [CrossRef] [Green Version]
- Lieberman, D.A.; Rex, D.K.; Winawer, S.J.; Giardiello, F.M.; Johnson, D.A.; Levin, T.R. Guidelines for colonoscopy surveillance after screening and polypectomy: A consensus update by the US Multi-Society Task Force on Colorectal Cancer. Gastroenterology 2012, 143, 844–857. [Google Scholar] [CrossRef] [PubMed] [Green Version]
- Lee, J.K.; Jensen, C.D.; Levin, T.R.; Doubeni, C.A.; Zauber, A.G.; Chubak, J.; Kamineni, A.S.; Schottinger, J.E.; Ghai, N.R.; Udaltsova, N.; et al. Long-term Risk of Colorectal Cancer and Related Death after Adenoma Removal in a Large, Community-Based Population. Gastroenterology 2020, 158, 884–894.e885. [Google Scholar] [CrossRef] [PubMed]
- Fadeev, E.; Cardozo-Mino, M.G.; Rapp, J.Z.; Bienhold, C.; Salter, I.; Salman-Carvalho, V.; Molari, M.; Tegetmeyer, H.E.; Buttigieg, P.L.; Boetius, A. Comparison of Two 16S rRNA Primers (V3-V4 and V4-V5) for Studies of Arctic Microbial Communities. Front. Microbiol. 2021, 12, 637526. [Google Scholar] [CrossRef]
- Alishum, A. DADA2 Formatted 16S rRNA Gene Sequences for both Bacteria & Archaea. 2022. Available online: https://zenodo.org/record/4735821 (accessed on 15 May 2023).
- Ondov, B.D.; Bergman, N.H.; Phillippy, A.M. Interactive metagenomic visualization in a Web browser. BMC Bioinform. 2011, 12, 385. [Google Scholar] [CrossRef] [Green Version]
- Vegan: Community Ecology Package. Available online: https://cran.r-project.org/web/packages/vegan/index.html (accessed on 15 May 2023).
- Factoextra: Extract and Visualize the Results of Multivariate Data Analyses. Available online: https://cran.r-project.org/web/packages/factoextra/index.html (accessed on 15 May 2023).
- Gplots: Various R Programming Tools for Plotting Data. Available online: https://cran.r-project.org/web/packages/gplots/index.html (accessed on 15 May 2023).
- He, T.; Cheng, X.; Xing, C. The gut microbial diversity of colon cancer patients and the clinical significance. Bioengineered 2021, 12, 7046–7060. [Google Scholar] [CrossRef]
- Hexun, Z.; Miyake, T.; Maekawa, T.; Mori, H.; Yasukawa, D.; Ohno, M.; Nishida, A.; Andoh, A.; Tani, M. High abundance of Lachnospiraceae in the human gut microbiome is related to high immunoscores in advanced colorectal cancer. Cancer Immunol. Immunother. 2023, 72, 315–326. [Google Scholar] [CrossRef] [PubMed]
- Zhao, L.; Cho, W.C.; Nicolls, M.R. Colorectal Cancer-Associated Microbiome Patterns and Signatures. Front. Genet. 2021, 12, 787176. [Google Scholar] [CrossRef] [PubMed]
- Nie, K.; Ma, K.; Luo, W.; Shen, Z.; Yang, Z.; Xiao, M.; Tong, T.; Yang, Y.; Wang, X. Roseburia intestinalis: A Beneficial Gut Organism From the Discoveries in Genus and Species. Front. Cell. Infect. Microbiol. 2021, 11, 757718. [Google Scholar] [CrossRef] [PubMed]
- Liu, X.; Mao, B.; Gu, J.; Wu, J.; Cui, S.; Wang, G.; Zhao, J.; Zhang, H.; Chen, W. Blautia-a new functional genus with potential probiotic properties? Gut Microbes 2021, 13, 1–21. [Google Scholar] [CrossRef] [PubMed]
- Nilsen, M.; Madelen Saunders, C.; Leena Angell, I.; Arntzen, M.O.; Lodrup Carlsen, K.C.; Carlsen, K.H.; Haugen, G.; Hagen, L.H.; Carlsen, M.H.; Hedlin, G.; et al. Butyrate Levels in the Transition from an Infant- to an Adult-Like Gut Microbiota Correlate with Bacterial Networks Associated with Eubacterium rectale and Ruminococcus gnavus. Genes 2020, 11, 1245. [Google Scholar] [CrossRef]
- Ikeyama, N.; Murakami, T.; Toyoda, A.; Mori, H.; Iino, T.; Ohkuma, M.; Sakamoto, M. Microbial interaction between the succinate-utilizing bacterium Phascolarctobacterium faecium and the gut commensal Bacteroides thetaiotaomicron. Microbiologyopen 2020, 9, e1111. [Google Scholar] [CrossRef]
- Liu, C.; Li, Z.; Ding, J.; Zhen, H.; Fang, M.; Nie, C. Species-Level Analysis of the Human Gut Microbiome Shows Antibiotic Resistance Genes Associated with Colorectal Cancer. Front. Microbiol. 2021, 12, 765291. [Google Scholar] [CrossRef]
- Adlung, L.; Elinav, E.; Greten, T.F.; Korangy, F. Microbiome genomics for cancer prediction. Nat. Cancer 2020, 1, 379–381. [Google Scholar] [CrossRef]
- Sivan, A.; Corrales, L.; Hubert, N.; Williams, J.B.; Aquino-Michaels, K.; Earley, Z.M.; Benyamin, F.W.; Lei, Y.M.; Jabri, B.; Alegre, M.L.; et al. Commensal Bifidobacterium promotes antitumor immunity and facilitates anti-PD-L1 efficacy. Science 2015, 350, 1084–1089. [Google Scholar] [CrossRef] [Green Version]
- Gopalakrishnan, V.; Spencer, C.N.; Nezi, L.; Reuben, A.; Andrews, M.C.; Karpinets, T.V.; Prieto, P.A.; Vicente, D.; Hoffman, K.; Wei, S.C.; et al. Gut microbiome modulates response to anti-PD-1 immunotherapy in melanoma patients. Science 2018, 359, 97–103. [Google Scholar] [CrossRef] [Green Version]
- Peters, B.A.; Dominianni, C.; Shapiro, J.A.; Church, T.R.; Wu, J.; Miller, G.; Yuen, E.; Freiman, H.; Lustbader, I.; Salik, J.; et al. The gut microbiota in conventional and serrated precursors of colorectal cancer. Microbiome 2016, 4, 69. [Google Scholar] [CrossRef] [Green Version]
- Coker, O.O.; Liu, C.; Wu, W.K.K.; Wong, S.H.; Jia, W.; Sung, J.J.Y.; Yu, J. Altered gut metabolites and microbiota interactions are implicated in colorectal carcinogenesis and can be non-invasive diagnostic biomarkers. Microbiome 2022, 10, 35. [Google Scholar] [CrossRef]
- Wei, P.L.; Hung, C.S.; Kao, Y.W.; Lin, Y.C.; Lee, C.Y.; Chang, T.H.; Shia, B.C.; Lin, J.C. Classification of Changes in the Fecal Microbiota Associated with Colonic Adenomatous Polyps Using a Long-Read Sequencing Platform. Genes 2020, 11, 1374. [Google Scholar] [CrossRef] [PubMed]
- Wu, F.; Guo, X.; Zhang, J.; Zhang, M.; Ou, Z.; Peng, Y. Phascolarctobacterium faecium abundant colonization in human gastrointestinal tract. Exp. Ther. Med. 2017, 14, 3122–3126. [Google Scholar] [CrossRef] [Green Version]
- Ezeji, J.C.; Sarikonda, D.K.; Hopperton, A.; Erkkila, H.L.; Cohen, D.E.; Martinez, S.P.; Cominelli, F.; Kuwahara, T.; Dichosa, A.E.K.; Good, C.E.; et al. Parabacteroides distasonis: Intriguing aerotolerant gut anaerobe with emerging antimicrobial resistance and pathogenic and probiotic roles in human health. Gut Microbes 2021, 13, 1922241. [Google Scholar] [CrossRef]
- Lu, X.-J.; Kang, Q.; Jin, P.; Sheng, J.-Q. The Interactions between Gut Microbiota and Lynch Syndrome. Clin. Gastroenterol. Hepatol. 2017, 15, e48. [Google Scholar] [CrossRef]
- Mori, G.; Orena, B.S.; Cultrera, I.; Barbieri, G.; Albertini, A.M.; Ranzani, G.N.; Carnevali, I.; Tibiletti, M.G.; Pasca, M.R. Gut Microbiota Analysis in Postoperative Lynch Syndrome Patients. Front. Microbiol. 2019, 10, 1746. [Google Scholar] [CrossRef] [PubMed] [Green Version]
- Mori, G.; Pasca, M.R. Gut Microbial Signatures in Sporadic and Hereditary Colorectal Cancer. Int. J. Mol. Sci. 2021, 22, 1312. [Google Scholar] [CrossRef] [PubMed]
- Dejea, C.M.; Wick, E.C.; Hechenbleikner, E.M.; White, J.R.; Mark Welch, J.L.; Rossetti, B.J.; Peterson, S.N.; Snesrud, E.C.; Borisy, G.G.; Lazarev, M.; et al. Microbiota organization is a distinct feature of proximal colorectal cancers. Proc. Natl. Acad. Sci. USA 2014, 111, 18321–18326. [Google Scholar] [CrossRef] [PubMed]
- Brennan, C.A.; Garrett, W.S. Fusobacterium nucleatum—Symbiont, opportunist and oncobacterium. Nat. Rev. Microbiol. 2019, 17, 156–166. [Google Scholar] [CrossRef]
- Yang, J.; McDowell, A.; Kim, E.K.; Seo, H.; Lee, W.H.; Moon, C.M.; Kym, S.M.; Lee, D.H.; Park, Y.S.; Jee, Y.K.; et al. Development of a colorectal cancer diagnostic model and dietary risk assessment through gut microbiome analysis. Exp. Mol. Med. 2019, 51, 1–15. [Google Scholar] [CrossRef] [Green Version]
- Olovo, C.V.; Huang, X.; Zheng, X.; Xu, M. Faecal microbial biomarkers in early diagnosis of colorectal cancer. J. Cell. Mol. Med. 2021, 25, 10783–10797. [Google Scholar] [CrossRef]
- Kostic, A.D.; Gevers, D.; Pedamallu, C.S.; Michaud, M.; Duke, F.; Earl, A.M.; Ojesina, A.I.; Jung, J.; Bass, A.J.; Tabernero, J.; et al. Genomic analysis identifies association of Fusobacterium with colorectal carcinoma. Genome Res. 2012, 22, 292–298. [Google Scholar] [CrossRef] [Green Version]
- Cheng, W.T.; Kantilal, H.K.; Davamani, F. The Mechanism of Bacteroides fragilis Toxin Contributes to Colon Cancer Formation. Malays. J. Med. Sci. 2020, 27, 9–21. [Google Scholar] [CrossRef]
- Sanna, S.; van Zuydam, N.R.; Mahajan, A.; Kurilshikov, A.; Vich Vila, A.; Võsa, U.; Mujagic, Z.; Masclee, A.A.M.; Jonkers, D.M.A.E.; Oosting, M.; et al. Causal relationships among the gut microbiome, short-chain fatty acids and metabolic diseases. Nature Genetics 2019, 51, 600–605. [Google Scholar] [CrossRef]
- de Lacy Costello, B.; Amann, A.; Al-Kateb, H.; Flynn, C.; Filipiak, W.; Khalid, T.; Osborne, D.; Ratcliffe, N.M. A review of the volatiles from the healthy human body. J. Breath Res. 2014, 8, 014001. [Google Scholar] [CrossRef] [PubMed]
- Niccolai, E.; Baldi, S.; Ricci, F.; Russo, E.; Nannini, G.; Menicatti, M.; Poli, G.; Taddei, A.; Bartolucci, G.; Calabro, A.S.; et al. Evaluation and comparison of short chain fatty acids composition in gut diseases. World J. Gastroenterol. 2019, 25, 5543–5558. [Google Scholar] [CrossRef]
- Horvath, T.D.; Ihekweazu, F.D.; Haidacher, S.J.; Ruan, W.; Engevik, K.A.; Fultz, R.; Hoch, K.M.; Luna, R.A.; Oezguen, N.; Spinler, J.K.; et al. Bacteroides ovatus colonization influences the abundance of intestinal short chain fatty acids and neurotransmitters. iScience 2022, 25, 104158. [Google Scholar] [CrossRef] [PubMed]
- Abdugheni, R.; Wang, W.-Z.; Wang, Y.J.; Du, M.-X.; Liu, F.-L.; Zhou, N.; Jiang, C.-Y.; Wang, C.-Y.; Wu, L.; Ma, J.; et al. Metabolite profiling of human-originated Lachnospiraceae at the strain level. iMeta 2022, 1, e58. [Google Scholar] [CrossRef]
- Markar, S.R.; Chin, S.T.; Romano, A.; Wiggins, T.; Antonowicz, S.; Paraskeva, P.; Ziprin, P.; Darzi, A.; Hanna, G.B. Breath Volatile Organic Compound Profiling of Colorectal Cancer Using Selected Ion Flow-tube Mass Spectrometry. Ann. Surg. 2019, 269, 903–910. [Google Scholar] [CrossRef]
- Woodfield, G.; Belluomo, I.; Laponogov, I.; Veselkov, K.; Cobra1 Working, G.; Cross, A.J.; Hanna, G.B. Diagnostic Performance of a Noninvasive Breath Test for Colorectal Cancer: COBRA1 Study. Gastroenterology 2022, 163, 1447–1449.e1448. [Google Scholar] [CrossRef] [PubMed]
- Amal, H.; Leja, M.; Funka, K.; Lasina, I.; Skapars, R.; Sivins, A.; Ancans, G.; Kikuste, I.; Vanags, A.; Tolmanis, I.; et al. Breath testing as potential colorectal cancer screening tool. Int. J. Cancer 2016, 138, 229–236. [Google Scholar] [CrossRef]
- Li, Y.; Faden, H.S.; Zhu, L. The Response of the Gut Microbiota to Dietary Changes in the First Two Years of Life. Front. Pharmacol. 2020, 11, 334. [Google Scholar] [CrossRef] [PubMed] [Green Version]
- Garner, C.E.; Smith, S.; de Lacy Costello, B.; White, P.; Spencer, R.; Probert, C.S.; Ratcliffe, N.M. Volatile organic compounds from feces and their potential for diagnosis of gastrointestinal disease. FASEB J. 2007, 21, 1675–1688. [Google Scholar] [CrossRef] [PubMed] [Green Version]
- Enzo, S.; Silvia, T.; Sheri, S.; Renato, S.; Dario, A.; Maria Chiara, V. Natural Compounds in the Modulation of the Intestinal Microbiota: Implications in Human Physiology and Pathology. In Alternative Medicine; Muhammad, A., Ed.; IntechOpen: Rijeka, Croatia, 2020; p. Ch. 9. [Google Scholar]
- Zagato, E.; Pozzi, C.; Bertocchi, A.; Schioppa, T.; Saccheri, F.; Guglietta, S.; Fosso, B.; Melocchi, L.; Nizzoli, G.; Troisi, J.; et al. Endogenous murine microbiota member Faecalibaculum rodentium and its human homologue protect from intestinal tumour growth. Nat. Microbiol. 2020, 5, 511–524. [Google Scholar] [CrossRef]
- Romani-Perez, M.; Lopez-Almela, I.; Bullich-Vilarrubias, C.; Rueda-Ruzafa, L.; Gomez Del Pulgar, E.M.; Benitez-Paez, A.; Liebisch, G.; Lamas, J.A.; Sanz, Y. Holdemanella biformis improves glucose tolerance and regulates GLP-1 signaling in obese mice. FASEB J. 2021, 35, e21734. [Google Scholar] [CrossRef] [PubMed]
- Hindson, J. Anti-tumorigenic endogenous gut bacteria in mice and humans. Nat. Rev. Gastroenterol. Hepatol. 2020, 17, 132. [Google Scholar] [CrossRef] [Green Version]
- Candeliere, F.; Simone, M.; Leonardi, A.; Rossi, M.; Amaretti, A.; Raimondi, S. Indole and p-cresol in feces of healthy subjects: Concentration, kinetics, and correlation with microbiome. Front. Mol. Med. 2022, 2, 1–13. [Google Scholar] [CrossRef]
- Amaretti, A.; Gozzoli, C.; Simone, M.; Raimondi, S.; Righini, L.; Perez-Brocal, V.; Garcia-Lopez, R.; Moya, A.; Rossi, M. Profiling of Protein Degraders in Cultures of Human Gut Microbiota. Front. Microbiol. 2019, 10, 2614. [Google Scholar] [CrossRef]
- Raimondi, S.; Calvini, R.; Candeliere, F.; Leonardi, A.; Ulrici, A.; Rossi, M.; Amaretti, A. Multivariate Analysis in Microbiome Description: Correlation of Human Gut Protein Degraders, Metabolites, and Predicted Metabolic Functions. Front. Microbiol. 2021, 12, 723479. [Google Scholar] [CrossRef]
- Zhou, W.; Tao, J.; Li, J.; Tao, S. Volatile organic compounds analysis as a potential novel screening tool for colorectal cancer: A systematic review and meta-analysis. Medicine (Baltimore) 2020, 99, e20937. [Google Scholar] [CrossRef]
- Louis, P.; Hold, G.L.; Flint, H.J. The gut microbiota, bacterial metabolites and colorectal cancer. Nat. Rev. Microbiol. 2014, 12, 661–672. [Google Scholar] [CrossRef] [PubMed]
- Zackular, J.P.; Rogers, M.A.M.; Mack, T.; Ruffin, I.V.; Schloss, P.D. The Human Gut Microbiome as a Screening Tool for Colorectal Cancer. Cancer Prev. Res. 2014, 7, 1112–1121. [Google Scholar] [CrossRef] [PubMed] [Green Version]


| Participants per Assay and NA/HRA Status | Sex | Age Bracket | |||
|---|---|---|---|---|---|
| Females | Males | 50–60 | 61–65 | 66–70 | |
| All 117 individuals | 62 (53%) | 55 (47%) | 32 (27%) | 43 (37%) | 42 (36%) |
| 16S-Seq: 100 NA individuals (85.5%) | 52 | 48 | 27 | 36 | 37 |
| 16S-Seq: 17 HRA individuals (14.5%) | 10 | 7 | 5 | 7 | 5 |
| GC-MS: 18 NA individuals (15.4%) | 10 | 8 | 5 | 7 | 6 |
| GC-MS: 10 HRA individuals (8.5%) | 4 | 6 | 3 | 4 | 3 |
| Organism p-Value | Average, Median, and IQR (Q1–Q3) of Relative Abundance (%) in HRA | Average, Median, and IQR (Q1–Q3) of Relative Abundance (%) in NA | Potential IMPACT on the Host | |
|---|---|---|---|---|
| PHYLUM | Proteobacteria p = 0.0440 | 4.96 2.17, 1.20–5.26 | 2.53 0.94, 0.60–2.15 | Potential pathogens, such as E. coli, Salmonella, Vibrio cholerae, and Helicobacter pylori. Infectious, inhibit immune function, cause dysbacteriosis, and exacerbate growth of colon cancer cells [23]. |
| FAMILY | Lachnospiraceae p = 0.0393 | 24.26 23.99, 18.63–30.29 | 30.09 29.02, 24.53–34.90 | Beneficial. Protect against colon cancer by producing butyrate via the butyrate kinase pathway [24]. |
| GENUS | Roseburia p = 0.0481 | 1.76 2.42, 1.22–2.87 | 3.23 2.40, 1.33–3.99 | Beneficial. SCFA producers protecting against gut inflammation, maintaining energy homeostasis, inhibiting NF-κB activation. |
| Fusicatenibacter p = 0.0025 | 0.67 0.79, 0.24–0.89 | 1.65 1.30, 0.60–2.28 | Beneficial. Butyrate producers maintaining intestinal regeneration, homeostasis, low inflammation [25]. | |
| SPECIES | Roseburia faecis p = 0.0189 | 0.96 0.93, 0.31–1.39 | 2.10 1.52, 0.68–2.75 | Beneficial. SCFA producer [26]. |
| Blautia luti p = 0.0423 | 1.06 1.03, 0.49–1.50 | 2.41 1.42, 0.75–2.81 | Beneficial. Potential anti-inflammatory action and inhibition of pathogen colonization via production of bacteriocins [27]. | |
| Fusicatenibacter saccharivorans p = 0.0030 | 0.79 0.92, 0.27–1.10 | 1.94 1.49, 0.72–2.74 | Beneficial. Butyrate producer decreased in the gut of CRC patients [23]. | |
| Eubacterium rectale p = 0.0456 | 0.58 0.52, 0.07–0.84 | 1.12 0.78, 0.24–1.74 | Beneficial. Butyrate producer [28]. | |
| Phascolarctobacterium faecium p = 0.0164 | 0.84 0.0025, 0.0–0.004 | 1.25 0.019, 0.002–1.45 | Beneficial. Propionate producer via the succinate metabolic pathway [29]. | |
| Parabacteroides distasonis p = 0.0084 | 1.26 0.57, 0.23–0.96 | 0.43 0.24, 0.05–0.49 | Potentially pathogenic and carcinogenic, associated with CRC [30]. |
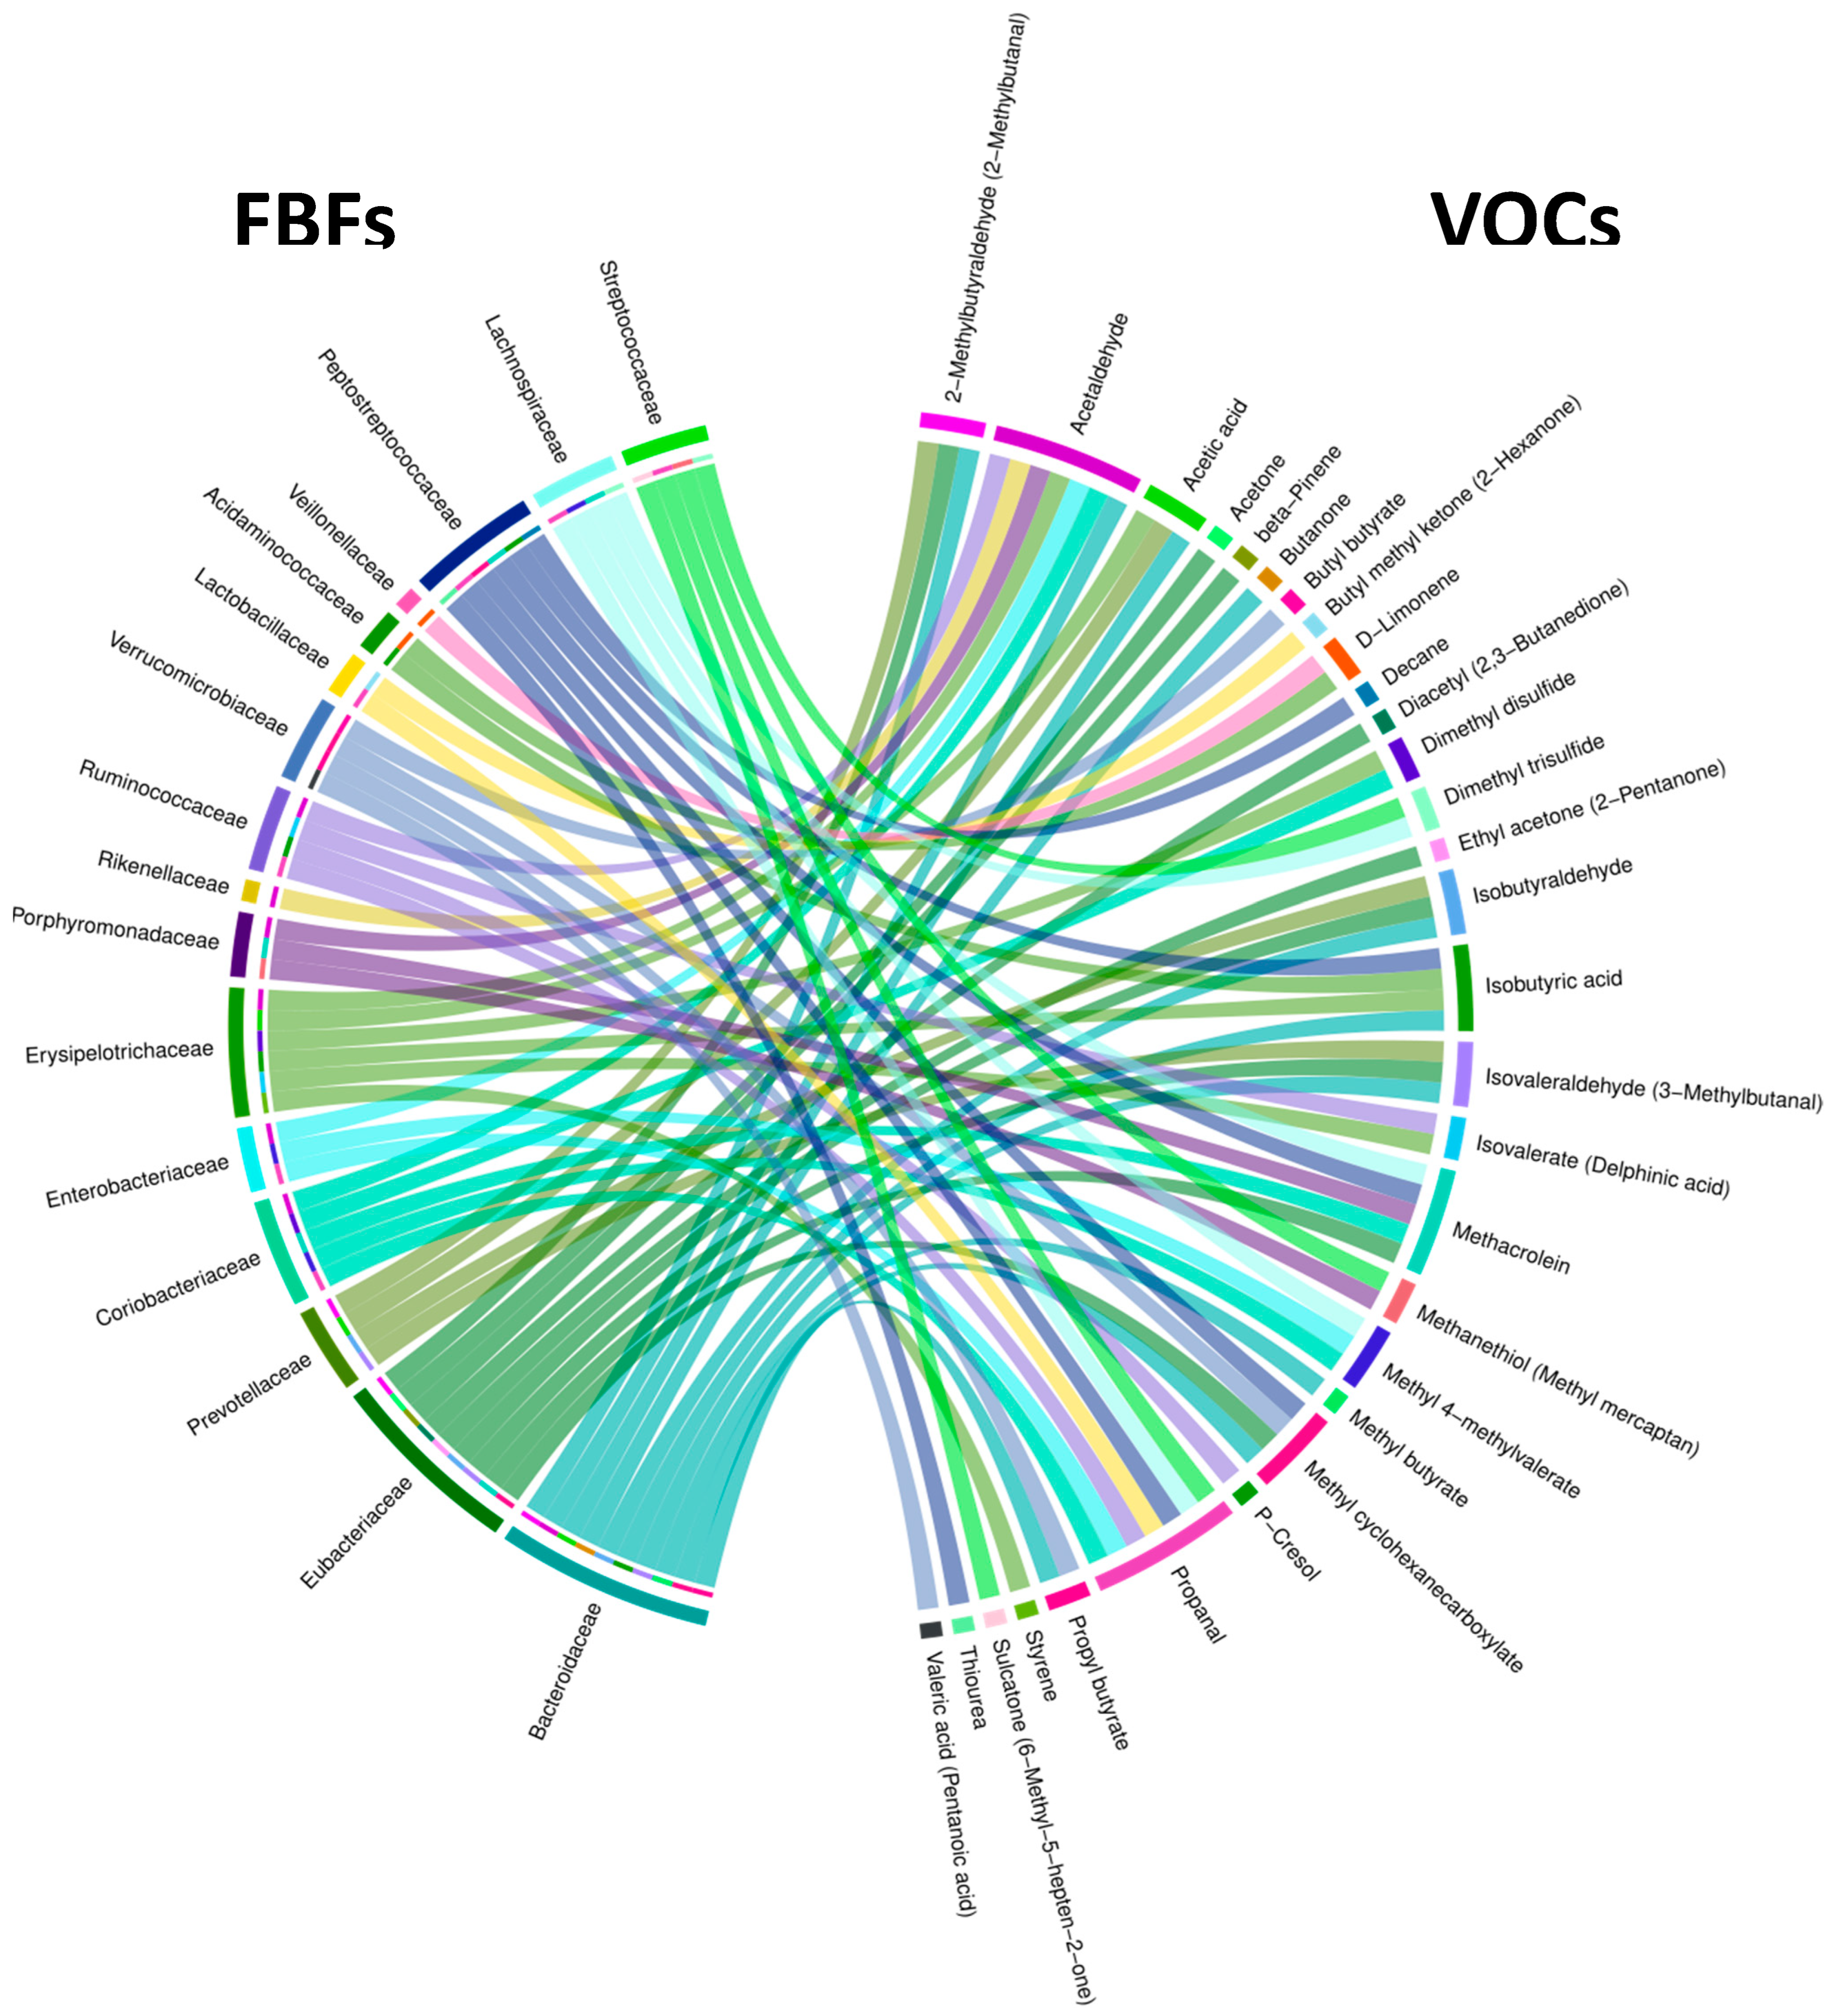
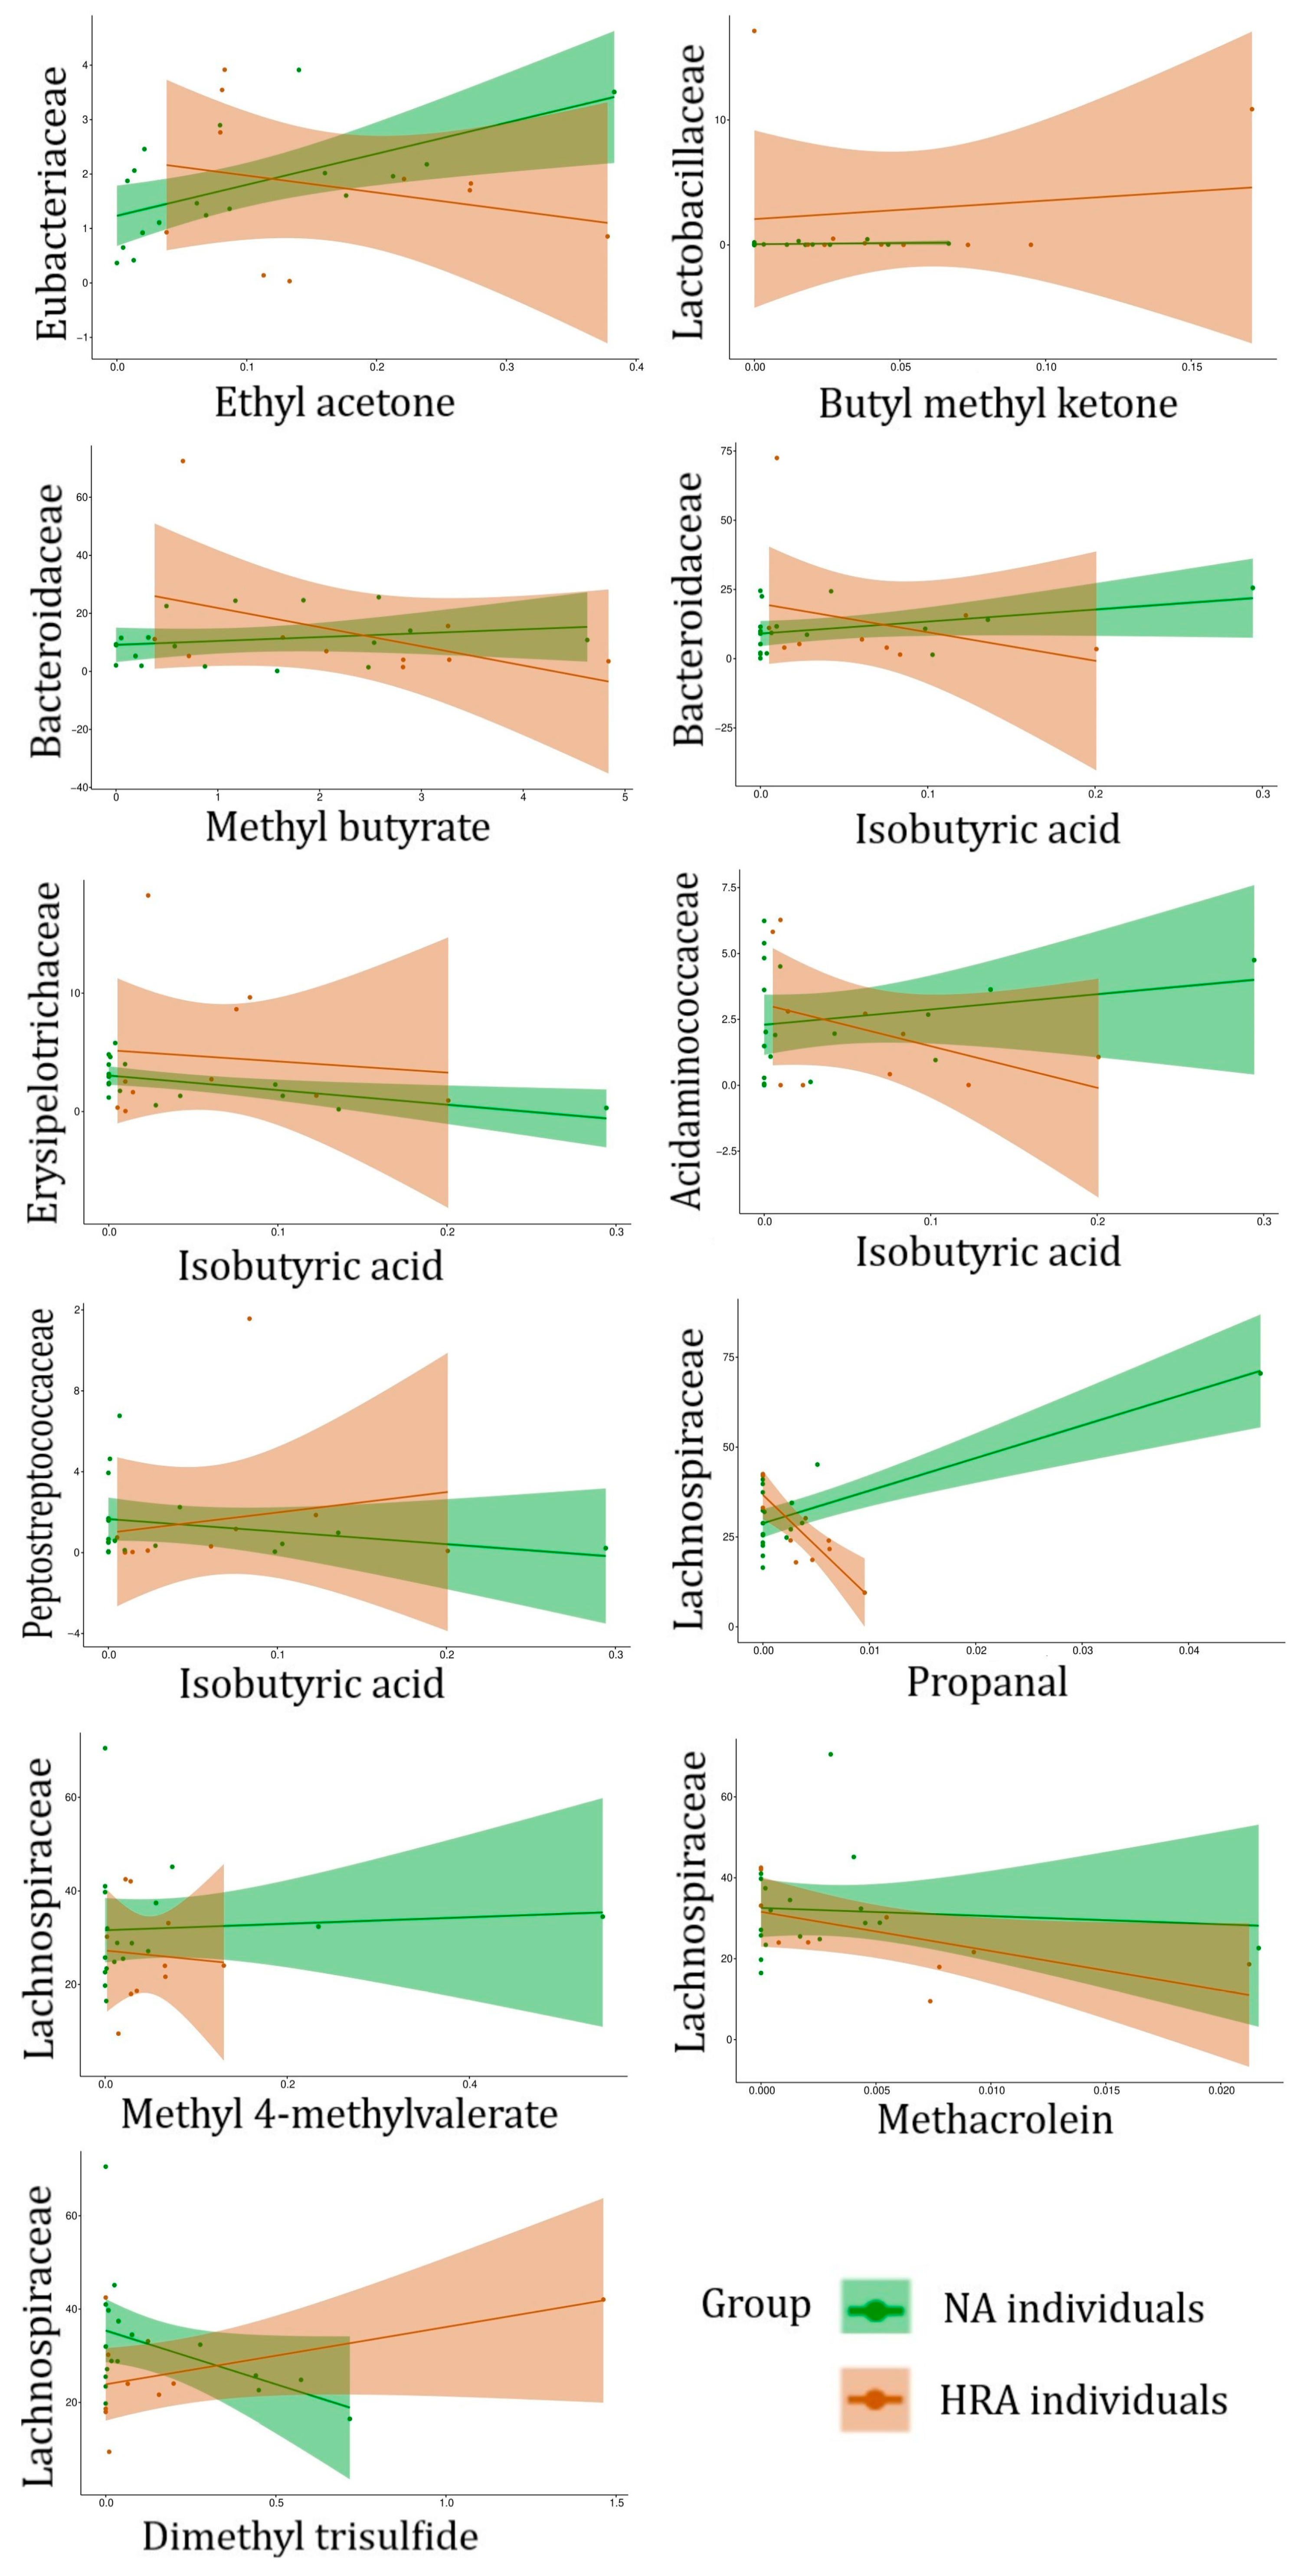
| FBFs | Associated VOC | Significance of Association, and Regression Line Slope for NA and HRA Endpoints | |
|---|---|---|---|
| FBFs associated with HRA-enriched VOCs | Eubacteriaceae | Ethyl acetone (2-Pentanone) | p = 0.02 NA (+) HRA (−) |
| Lactobacillaceae | Butyl methyl ketone (2-Hexanone) | p = 0.04 NA (+) HRA (+) | |
| Bacteroidaceae | Methyl butyrate | p = 0.03 NA (+) HRA (−) | |
| Isobutyric acid | p = 0.04 NA (+) HRA (−) | ||
| Erysipelotrichaceae | p = 0.03 NA (−) HRA (−) | ||
| Acidaminococcaceae | p = 0.03 NA (+) HRA (−) | ||
| Peptostreptococcaceae | p = 0.04 NA (−) HRA (+) | ||
| VOCs associated withNA-enriched FBFs | Lachnospiraceae | Propanal | p = 0.007 NA (+) HRA (−) |
| Methacrolein | p = 0.04 NA (−) HRA (−) | ||
| Methyl 4-methylvalerate | p = 0.03 NA (+) HRA (−) | ||
| Dimethyl trisulfide | p = 0.04 NA (−) HRA (+) |
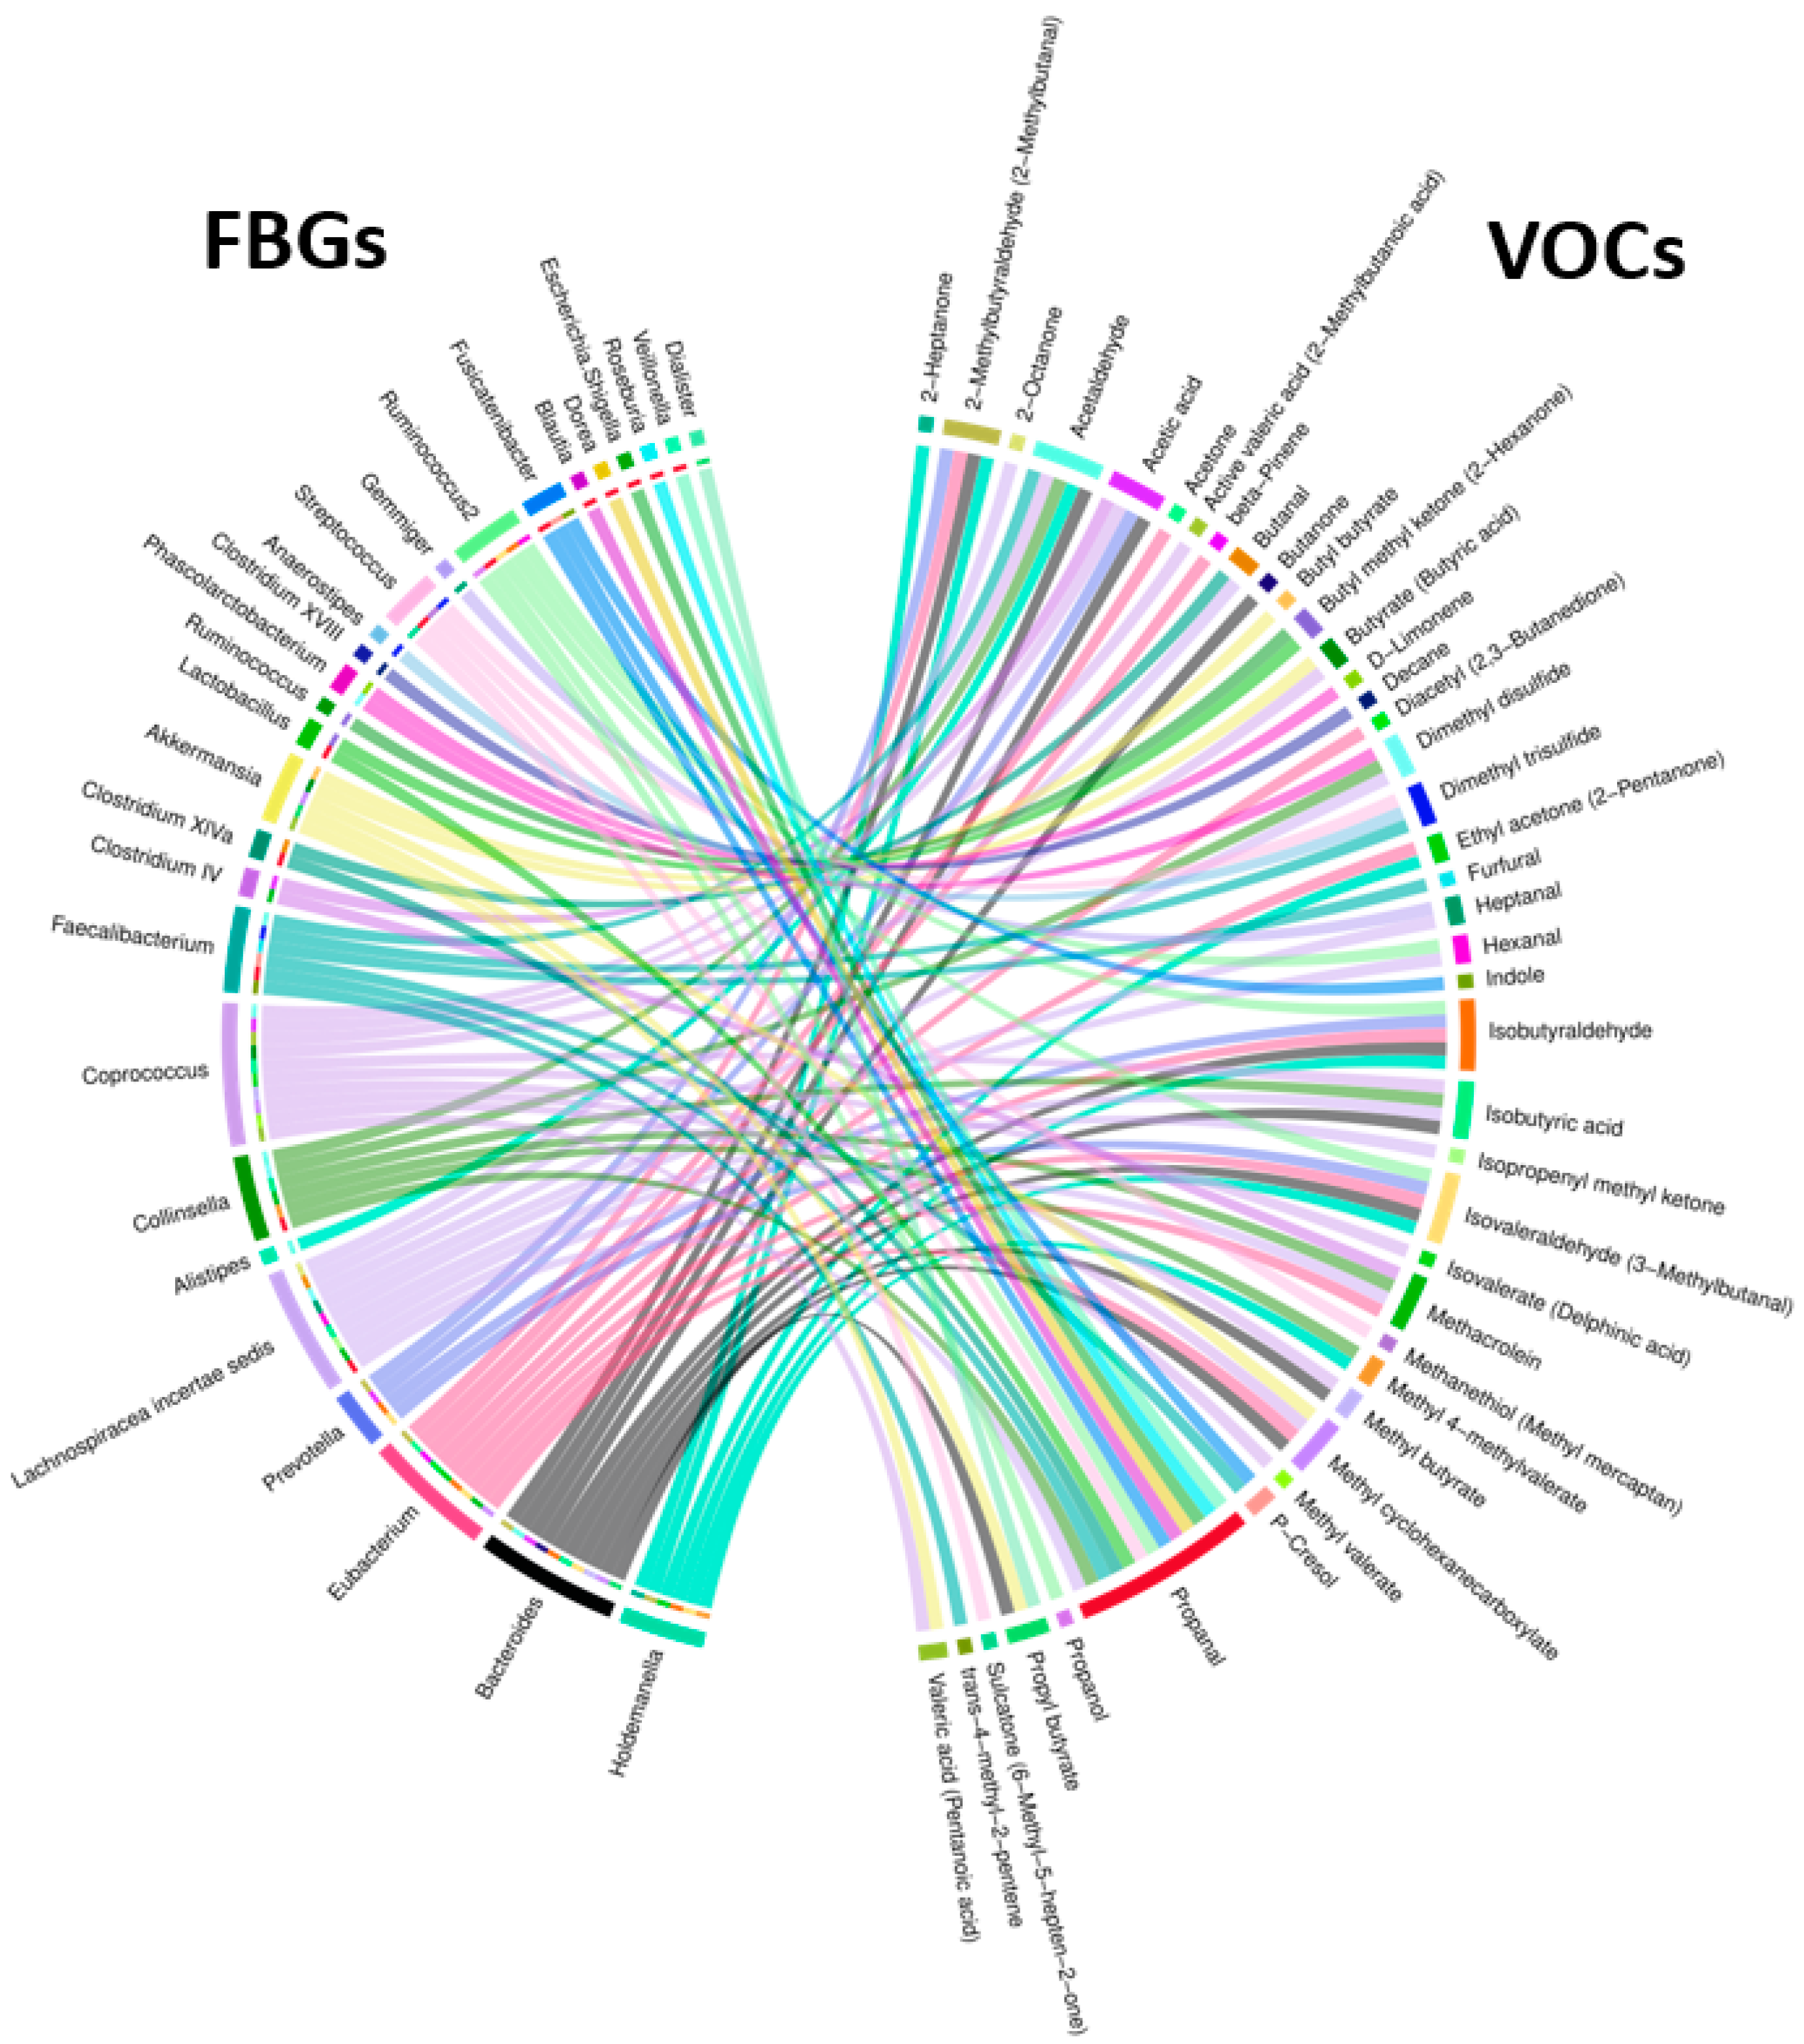
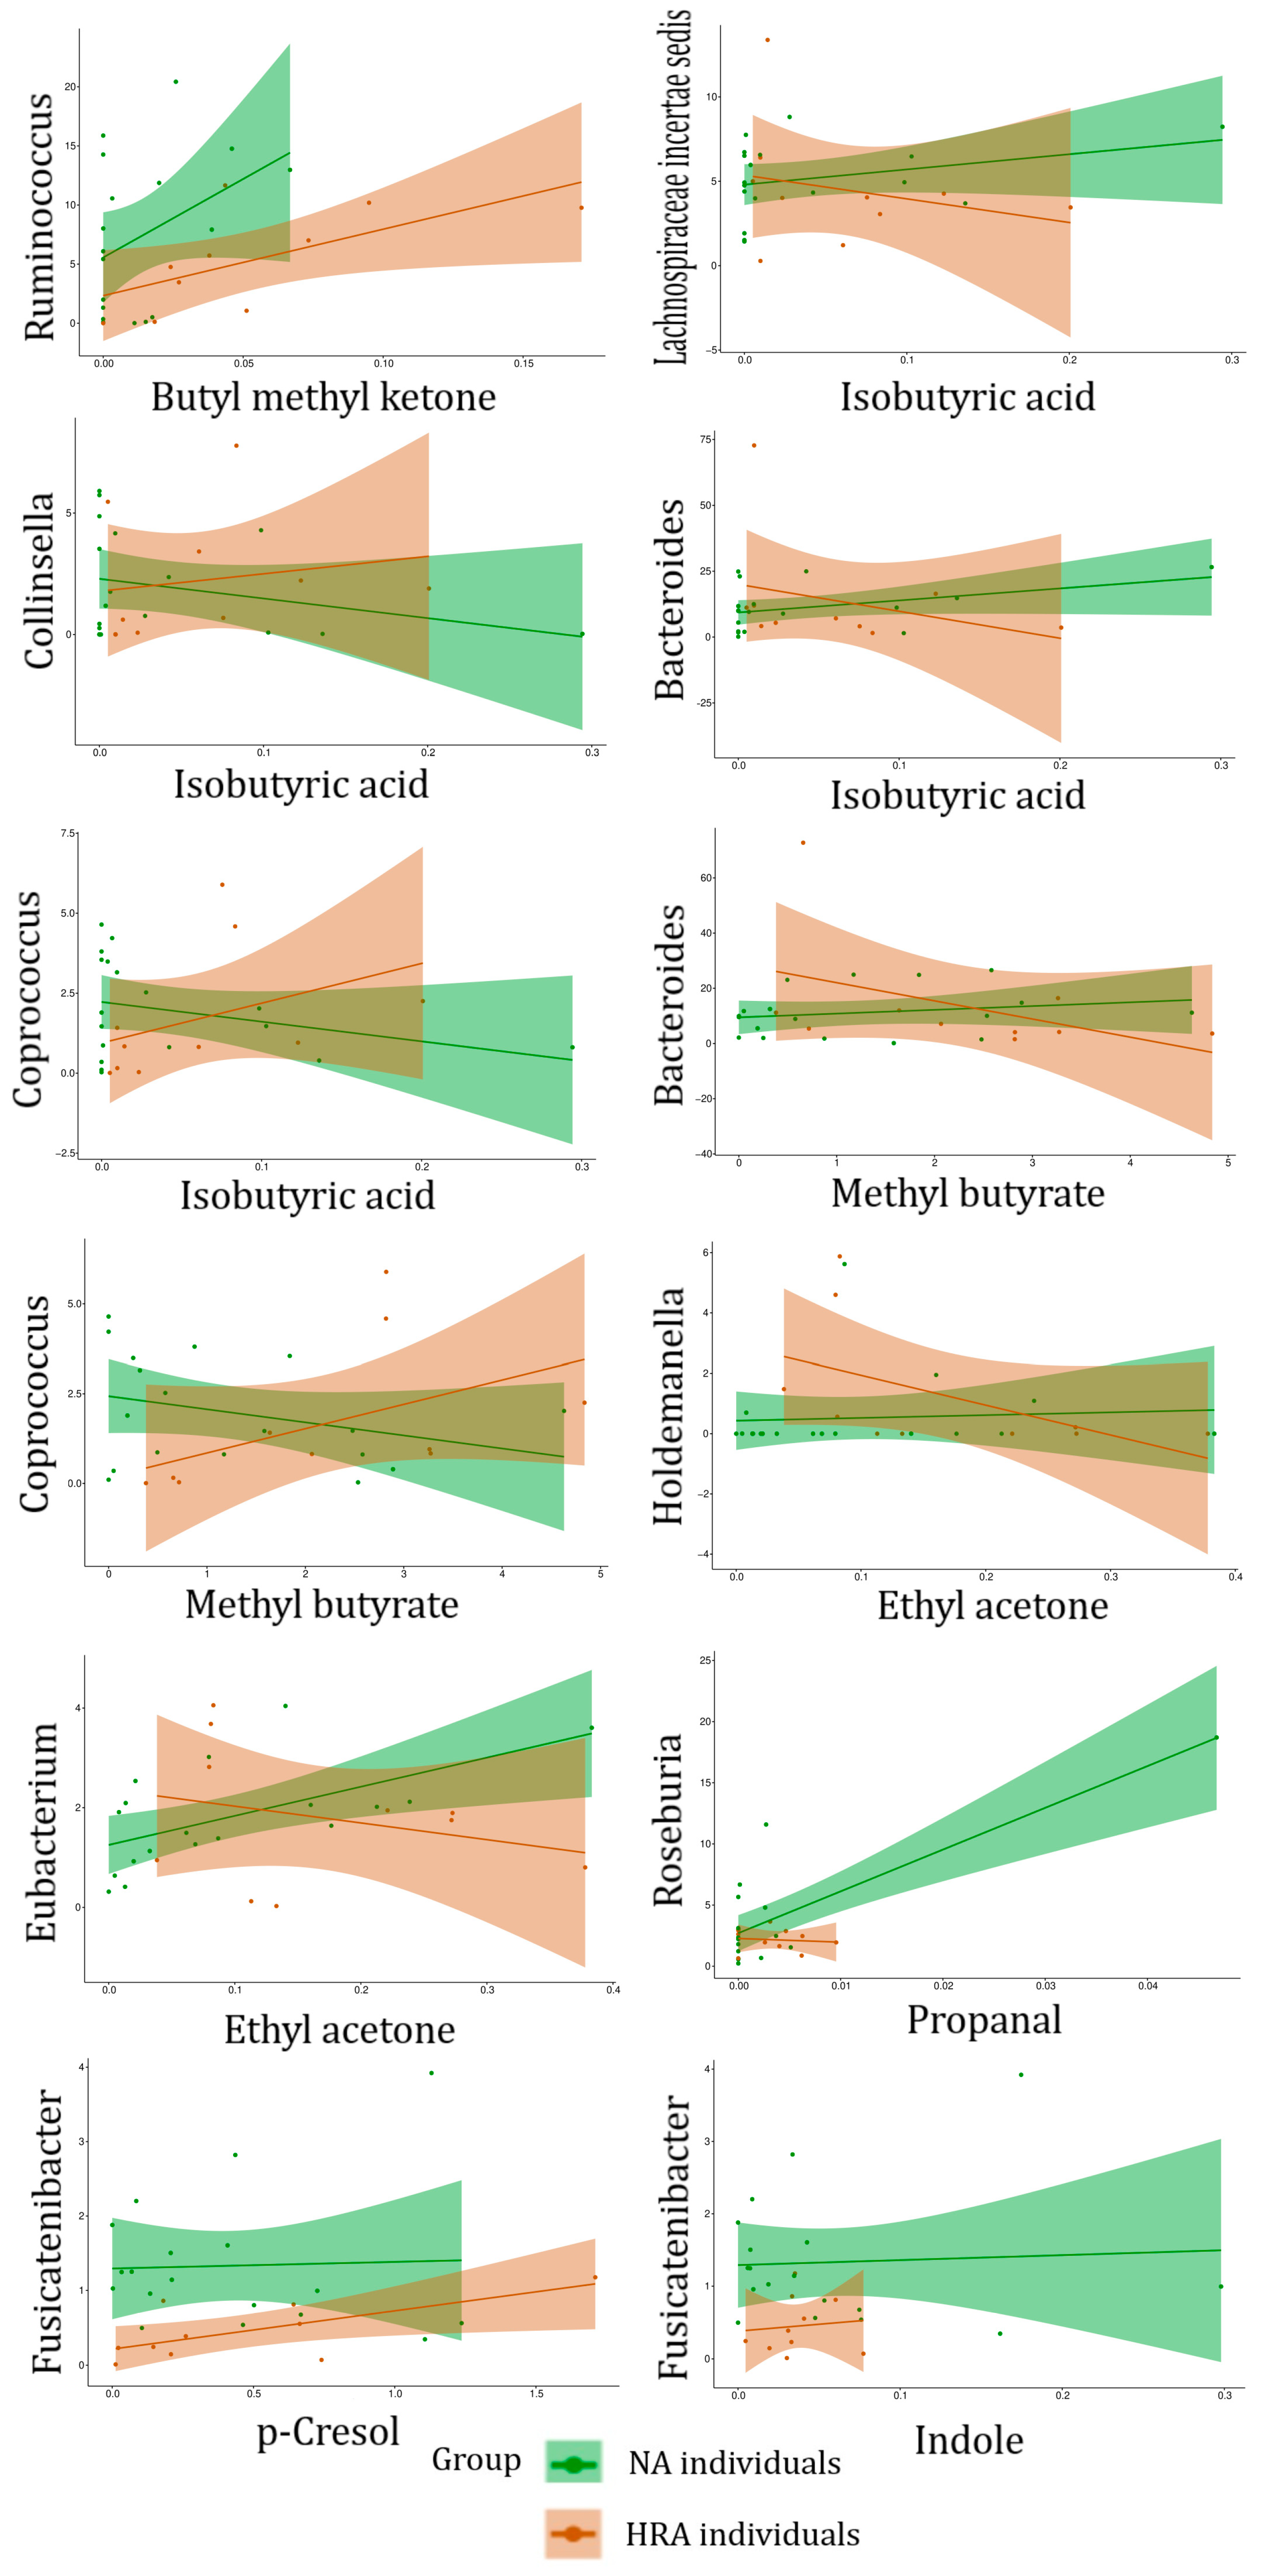
| FBGs | Associated VOC | Significance of Association, and Regression Line Slope for NA and HRA Endpoints | |
|---|---|---|---|
| FBGs associated with HRA-enriched VOCs | Ruminococcus | Butyl methyl ketone (2-Hexanone) | p = 0.04 NA (+) HRA (+) |
| Lachnospiraceae incertae sedis | Isobutyric acid | p = 0.04 NA (+) HRA (−) | |
| Collinsella | p = 0.05 NA (−) HRA (+) | ||
| Bacteroides | p = 0.04 NA (+) HRA (−) | ||
| Coprococcus | p = 0.004 NA (−) HRA (+) | ||
| Bacteroides | Methyl butyrate | p = 0.03 NA (+) HRA (−) | |
| Coprococcus | p = 0.05 NA (−) HRA (+) | ||
| Holdemanella | Ethyl acetone (2-Pentanone) | p = 0.04 NA (+) HRA (−) | |
| Eubacterium | p = 0.03 NA (+) HRA (−) | ||
| VOCs associated with NA-enriched FBGs | Roseburia | Propanal | p = 0.02 NA (+) HRA (−) |
| Fusicatenibacter | p-Cresol | p = 0.03 NA (+) HRA (+) | |
| Indole | p = 0.02 NA (+) HRA (+) |
Disclaimer/Publisher’s Note: The statements, opinions and data contained in all publications are solely those of the individual author(s) and contributor(s) and not of MDPI and/or the editor(s). MDPI and/or the editor(s) disclaim responsibility for any injury to people or property resulting from any ideas, methods, instructions or products referred to in the content. |
© 2023 by the authors. Licensee MDPI, Basel, Switzerland. This article is an open access article distributed under the terms and conditions of the Creative Commons Attribution (CC BY) license (https://creativecommons.org/licenses/by/4.0/).
Share and Cite
Katsaounou, K.; Yiannakou, D.; Nikolaou, E.; Brown, C.; Vogazianos, P.; Aristodimou, A.; Chi, J.; Costeas, P.; Agapiou, A.; Frangou, E.; et al. Fecal Microbiota and Associated Volatile Organic Compounds Distinguishing No-Adenoma from High-Risk Colon Adenoma Adults. Metabolites 2023, 13, 819. https://0-doi-org.brum.beds.ac.uk/10.3390/metabo13070819
Katsaounou K, Yiannakou D, Nikolaou E, Brown C, Vogazianos P, Aristodimou A, Chi J, Costeas P, Agapiou A, Frangou E, et al. Fecal Microbiota and Associated Volatile Organic Compounds Distinguishing No-Adenoma from High-Risk Colon Adenoma Adults. Metabolites. 2023; 13(7):819. https://0-doi-org.brum.beds.ac.uk/10.3390/metabo13070819
Chicago/Turabian StyleKatsaounou, Kyriaki, Danae Yiannakou, Elpiniki Nikolaou, Cameron Brown, Paris Vogazianos, Aristos Aristodimou, Jianxiang Chi, Paul Costeas, Agapios Agapiou, Elisavet Frangou, and et al. 2023. "Fecal Microbiota and Associated Volatile Organic Compounds Distinguishing No-Adenoma from High-Risk Colon Adenoma Adults" Metabolites 13, no. 7: 819. https://0-doi-org.brum.beds.ac.uk/10.3390/metabo13070819