
Abnormal Phenylalanine Metabolism of Procapra przewalskii in Chronic Selenosis in Selenium-Enriched Habitats
1
North Sichuan Medical College, Nanchong 637100, China
2
State Key Laboratory of Sheep Genetic Improvement and Healthy Production, Xinjiang Academy of Agricultural and Reclamation Sciences, Shihezi 832000, China
3
School of Life Science and Engineering, Southwest University of Science and Technology, Mianyang 621010, China
4
World Bank Poverty Alleviation Project Office in Guizhou, Guiyang 550004, China
*
Author to whom correspondence should be addressed.
Metabolites 2023, 13(9), 982; https://0-doi-org.brum.beds.ac.uk/10.3390/metabo13090982
Submission received: 20 July 2023
/
Revised: 22 August 2023
/
Accepted: 28 August 2023
/
Published: 30 August 2023
(This article belongs to the Special Issue Environmental Pollution and Animal Health: Toxicity and Metabolism)
Abstract
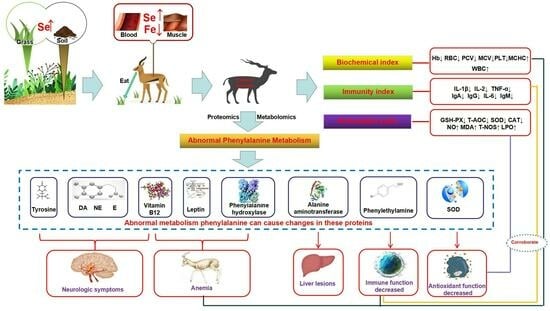
:Selenium (Se)-enriched habitats have led to chronic selenosis, seriously affecting the health and survival of Procapra przewalskii (P. przewalskii). Our targets were to explore the molecular mechanisms of chronic selenosis and to look for a new way to protect endangered species. The mineral contents of soils, grass, blood, and muscle were analyzed. The biochemical indices, antioxidant capability, and immune function were also investigated. The analyses of proteomics and metabolomics were also carried out. The results showed that the Se contents in the muscle and blood of P. przewalskii, and the soil and grass in the Se-enriched habitats were significantly higher than those in healthy pastures. The P. przewalskii in the Se-enriched habitats showed symptoms of anemia, decreased antioxidant capability, and low immune function. A total of 44 differential proteins and 36 differential metabolites were screened by analyzing their proteomics and metabolomics. These differential proteins and metabolites were involved in glycolysis pathway, amino acid biosynthesis, carbon metabolism, phenylalanine metabolism, and energy metabolism. In particular, phenylalanine metabolism was the common pathway of proteomics and metabolomics, which was an important finding in studying the mechanism of chronic selenosis in animals. This study will help us to further understand the mechanism of chronic selenosis in P. przewalskii, and it provides a scientific basis for the protection of endangered species in Se-enriched habitats.
1. Introduction
The Qinghai Lake Basin is the only natural habitat for Procapra przewalskii (P. przewalskii), with the coexistence of selenium (Se)-deficient ranches and Se-rich habitats [1]. P. przewalskii is the most endangered artiodactyl on the Tibetan Plateau and is mainly distributed on the ranches near the Qinghai Lake in China [1]. In recent years, many protection measures of rangelands have strictly limited their foraging range. The balancing mechanisms of mineral nutrition have been seriously damaged. Animals on Se-deficient ranches are incapable of foraging for Se-enriched plants in all seasons, resulting in Se deficiencies. P. przewalskii in a Se-enriched habitat are fed Se-enriched forage for a long time, resulting in chronic selenosis [2]. In addition, the use of Se-containing wastewater from industrial pollution for pasture irrigation will also lead to the passive storage of Se in plants; therefore, chronic selenosis might also be found in grazing animals in Se-polluted ranches [3]. Problems may also arise from the careless administration of Se supplements. As a result, accidental acute and chronic problems have become more common [4,5,6]. Se is necessary for animals and has various biological functions, such as strengthening their antioxidant defense, increasing their growth rate, improving reproductive performance, enhancing immunity, and decreasing the occurrence of diseases [7]. Se is also the most toxic essential element for animals. It was generally believed that 1–6 mg/kg of Se in soil and 3–4 mg/kg of Se in feed might cause chronic selenosis [8]. As Se poisoning is incurable, it has brought about severe challenges in terms of survival [9]. The symptoms of chronic selenosis in P. przewalskii are indigestion, weight loss, anemia, unresponsiveness, and a lack of vitality [10]. In addition, it can also affect fetal development, cause fetal malformations, and increase the mortality of neonatal animals. Samples of the liver, kidney, heart, spleen, lung, lymph nodes, pancreas, and brain also show lesions of degeneration, necrosis, nuclear deformation, telangiectasia, hyperemia, and hemorrhage in pathological examinations [11,12]. Chronic selenosis has brought great harm to the health of P. przewalskii and has seriously hindered the protection of other endangered species in the Qinghai Lake Basin [13,14]. However, so far, few researchers have studied chronic selenosis in P. przewalskii, especially using a combination of serology, proteomics, and metabolomics for exploring the mechanisms of chronic selenosis [15].
The purpose of this study was to explore the molecular mechanisms of chronic selenosis in P. przewalskii and look for a new way to protect endangered species in Se-enriched habitats. It also provides a reference for the study and prevention of chronic selenosis.
2. Materials and Methods
2.1. Geographical Environment
The habitat of P. przewalskii is located on the Qinghai Lake basin, which has a plateau continental climate. It has strong sunshine, dry and windy conditions, short warm seasons, long cold seasons, and low rainfall (annual rainfall of 778 mm). Their Se-enriched habitats are located in the natural pasture of Shengge Township, Tianjun County, China (N: 38°53′23″–39°33′21″, E: 96°49′42″–97°31′48″). The healthy habitat belongs to the Bird Island Reserve in the ranches near the Qinghai Lake in China (N: 36°28′42″–38°25′53″, E: 97°51′23″–99°27′35″) (Figure 1). The vegetation is mainly Roegneria nutans (Keng) Keng, Leymus secalinus, Carex mooscroftii, Artemisia frigida Willd, Elymus dahuricus Turcz, Artemisia frigida, Taraxacum mongolicum Hand.-Mazz, Carex stenophylla, Dactylis glomerata L, Stipa purpurea, Poa pratensis, Blysmus sinocompressus, Elymus nutans, and Agropyron cristatum.
2.2. Sample Collection and Analysis
The samples of soil and plants from the ranches and blood and muscle from P. przewalskii included in this study were collected in August 2022. The soil samples were collected using a 30 mm diameter cylindrical core in the surface layer (0–10 cm). Four soil samples, each separated by 600 m, were bulked and placed in polythene bags. The soil sample was ground into a powder and filtered through a 10 mm screen. In order to avoid contamination of the grass samples, they were collected from 1 to 2 cm above the ground. According to previous experience, the researcher hid approximately 10–15 m away from the animals at 17–20 o’clock in July and used a tranquilizer gun (model: L50, China) with ketamine hydrochloride (SINICS approval: H35020148) as an anesthetic. Then, the anesthetic was injected into the animals (30 mg/time, 5 times within 3 min), and blood and muscle samples were collected. The samples of muscle and blood were stored in plastic test tubes that did not contain trace minerals. The blood was obtained from the jugular veins and the muscle was skeletal muscle obtained from the thigh. The muscle was extracted by penetrating the inside of the thigh skeletal muscle tissue with a puncture needle [16]. Approximately 20 min later, the animals returned to normal. The blood and muscle samples were subsequently transported to the laboratory for further analysis.
These samples of soil, grass, blood, and muscle were dried and crushed in a vacuum freeze dryer (GIPP-5000FDA) at −80 °C. Samples of 0.2–1.0 g were dissolved using microwave digestion apparatus (Apole technology group Co., Ltd., Chengdu, China). The soil samples were dissolved by adding HF, HNO3, and HClO4 (5:2:5), and the samples of plant, blood, and muscle were dissolved by adding HNO3 and HClO4 (4:1). The concentrations of copper (Cu), iron (Fe), zinc (Zn), manganese (Mn), selenium (Se), and molybdenum (Mo) in the soil, grass, blood, and muscle samples were determined using an atomic absorption spectrophotometer (AA-7000, Shimadzu Co., Ltd., Tokyo, Japan). The results were then compared with certified elemental concentrations from the International Atomic Energy Agency and the National Institute of Standards standard substances to verify the accuracy of the results. The limited accuracy of the samples with very low contents resulted in concentrations below a particular threshold being recorded as containing trace amounts, as measurements of zero are difficult to prove.
2.3. Biochemical Tests on Blood
The blood samples were placed in a fully automated blood analyzer (BC2800 Vet, Mindray Biotechnology Co., Ltd., Shanghai, China) to determine the cell volume (PCV), red blood cell count (RBC), hemoglobin (Hb), white blood cell count (WBC), and platelet count (PLT). According to the detection results for Hb, RBC, and PCV, the mean corpuscular hemoglobin (MCH), mean corpuscular volume (MCV), and mean corpuscular hemoglobin concentration (MCHC) were calculated. The blood samples were tested for antioxidant and immune function indicators according to the procedure of the diagnostic kit (Jianchen Biotechnology Co., LTD., Xiamen, China). The antioxidant capacity indices included lipid peroxide (LPO), total antioxidant capacity (T-AOC), total nitric oxide synthase (TNOS), catalase (CAT), glutathione peroxidase (GSH-Px), nitric oxide (NO), superoxide dismutase (SOD), and malondialdehyde (MDA). The immune indices included immunoglobulin G (IgG), tumor necrosis factor-alpha (TNF-α), interleukin-2 (IL-2), immunoglobulin A (IgA), included interleukin (IL)-1β, immunoglobulin M (IgM), and interleukin 6 (IL-6).
2.4. Proteomic Analysis of Serum
2.4.1. TMT Mark
The serum samples were ground into a powder in liquid nitrogen, and the protein was extracted using the SDT cracking method and quantified using the BCA method. Then, FASP was used for tryptic hydrolysis, and a C18 cartridge was used to desalinate the enzymolysis peptide, followed by quantification using OD280. The samples were labeled as 100 μg peptides from each serum according to the instructions of the TMT kit (Thermo Fisher Scientific, Waltham, MA, USA).
2.4.2. SCX Chromatographic Fractionation
All the TMT-labeled peptides were mixed and graded using an AKTA Purifier 100. The buffer conditions were 10 mM KH2PO4 and pH 3.0, in which liquid A was 25% (acetonitrile) can and liquid B was 500 mM KCl. The sample was separated at a flow rate of 1 mL/min by flowing through a chromatographic column which was balanced with liquid A. The time gradients of the liquid phase were 0–25 min, 25–32 min, 32–42 min, 42–47 min, 47–52 min, and 52–60 min. The concentration gradients of the liquid phase were 0–10%, 10–20%, 20–45%, 45–100%, and 100%. The time gradient phase corresponded to the concentration gradient of the liquid. During the elution process, the absorbance (D) value at a wavelength of 214 nm was monitored, and elution components were collected every 1 min, lyophilized, and desalted using a C18 cartridge.
2.4.3. LC–MS/MS Analysis
The peptides were injected into a nanometric electrospray source using an ultra-high-performance liquid-phase separation system for tandem mass spectrometry with a sample column (Thermo scientific EASY column, 100 μm*2 × cm, 5 μm, C18). A Q-Exactive mass spectrometer (Thermo Fisher) was used to detect and analyze the isolated peptides. The resolution for detecting complete peptides was set to 70,000 at 200 m/z. The time was 60 min. The automatic gain control target was 3 × 10⁶, the maximum IT was 10 milliseconds, and the dynamic exclusion time was 40.0 s. The structure of the peptide was identified by means of the ion information obtained using high-energy impact dissociation (HCD). The impact energy was set to 30 eV. The underfill ratio was 0.1%. The resolution for detecting ion fragments was set to 17,500 at 200 m/z.
2.4.4. Protein Identification and Analysis
To search the corresponding database for raw mass spectrometry test files, the protein identification and quantitative analysis results were obtained from the Proteome Discoverer 1.4 (Table 1).
2.4.5. Bioinformatics Analysis
OmicsBean software was used to carry out GO annotation, and KEGG pathway annotation was used for the target protein set (http://www.omicsbean.cn/ (accessed on 30 September 2022). The process can be divided into four steps: blast, mapping, annotation, and annotation augmentation. The Fisher exact test was used to compare the distribution of each GO analysis and KEGG pathway in the target protein set and the total protein set. Then, the enrichment analysis of the GO annotation and KEGG annotation was performed on the target protein set.
2.5. Metabolomics Analysis in Serum
2.5.1. Sample Processing
The serum samples were ground into a powder with liquid nitrogen and added to 400 μL of a pre-cooled H2O/MeOH/ACN solution (2:4:4, v/v). These were then swirl-mixed at −20 °C for 1 h, then stratified at 14,000× g for 1200 s. The supernatant was vacuum-dried, and 100 μL of acetonitrile aqueous solution (1:1, v/v) was added for the mass spectrometry analysis. This was reconstituted, vortexed, and centrifuged at 14,000× g for 900 s.
2.5.2. Chromatography and Mass Spectrometry
The chromatographic conditions were as follows: Waters ACQUITY UPLC BEH Amide Column (2.1 mm × 150 mm,.1.7 μm). The mobile phase A was an aqueous solution containing 0.1% formic acid, and the mobile phase B was an aqueous solution containing 5% acetonitrile. The flow rate of the mobile phase was 0.40 mL/min. The gradient elution procedure was as follows: 0–0.5 min, 5% B; 0.5–1.0 min, 5% B; 1.0–9.0 min, 5~100% B; 9.0–12.0 min, 100% B; and 12.0–15.0 min, 5% B. Under the positive and negative ion modes, the sample size was 2.5 μL. The samples were placed in a 4 °C automatic injector during the entire analysis process.
The mass spectrum conditions were as follows: the positive and negative ion patterns were detected using an electrospray ion source (ESI) and a Q-Exactive four-pole and electrostatic field orbital trap high-resolution mass spectrometer (Thermo Fisher Scientific). The spray voltage was set to ±3.5 kV, the mass spectrum collection range was 80~1200 m/z, the resolution was 17,500, and the ion source was HESI. The capillary voltage was 3500 V/3500 V (positive/negative ion mode), the capillary temperature was 300 °C, the internal temperature was 320 °C, the Sheath gas was 45 arb, the auxiliary gas was 10 arb, and the RF level of the S-Lens was 55.
The application software SIMCA-P 14.1 (Umetrics, Umea, Sweden) was used for pattern recognition and data analysis. A multi-dimensional statistical analysis was performed after Pareto-scaling pretreatment.
2.6. Data Processing
The mineral content and biochemical indices of different groups were analyzed with an ANOVA, and the significance was verified through bilateral testing, with differences of 5% (p < 0.05) or 1% (p < 0.01). p < 0.05 was considered to represent a significant difference. p < 0.01 was considered to be highly statistically significant. The results are presented as the mean ± standard deviation. SPSS software and DPS software were used for data processing.
Compound Discoverer 3.0 software was used to pre-process the original proteomics and metabolomics data, such as peak extraction, peak comparison, peak correction, and normalization. The quality matching and secondary spectrum matching of metabolites were accurately identified by searching the laboratory database and BioCyc, HMDB, Lipidmaps, HFMDBmetlin, and other databases.
3. Results
3.1. Mineral Content Analysis
The mineral contents of the soil and plants are shown in Table 2. The Se contents of soil and grass in the Se-enriched habitat were significantly higher than those in the healthy habitat (p < 0.01). The Fe contents of the soils and forages in the Se-rich habitat were slightly lower than those in healthy pastures (p < 0.05). The mineral contents of the blood and muscle samples are shown in Table 3. The Se contents of the blood and muscle samples from the Se-enriched habitat were significantly higher than those in the healthy habitat (p < 0.01). The Fe contents of the blood and muscle samples from the Se-rich habitat were significantly lower than those from the healthy pastures (p < 0.05).
3.2. Biochemical Indices in the Blood
The levels of Hb, MCV, PLT, RBC (p < 0.05), and PCV(p < 0.01) from the Se-enriched habitat were significantly lower than those from the healthy habitat. The WBC count from the Se-enriched habitat was significantly higher than that from the healthy habitat (p < 0.01, Table 4). The levels of serum GSH-PX, T-AOC, SOD, and CAT from the Se-enriched habitat were significantly lower than those from the healthy habitat (p < 0.01). The levels of serum NO, MDA, T-NOS (p < 0.01), and LPO (p < 0.05) from the Se-enriched habitat were significantly higher than those from the healthy habitat (Table 5). The levels of serum IL-1β, IL-2, TNF-α, IgA, IgG, IL-6 (p < 0.01), and IgM (p < 0.05) from the Se-enriched habitat were significantly lower than those from the healthy habitat (Table 6).
3.3. The Proteomic Results in Serum
A total of 780 proteins and 2789 peptides were identified using quantitative proteomics technology and TMT labeling. The results of the volcanic map showed that there were significant differences between the two groups of sample data (Figure 2). The results of the cluster heat map showed that the differentially expressed proteins could be effectively distinguished from the comparison group, which further indicated the rationality of differentially expressed protein screening (Figure 3).
The differentially expressed proteins were screened according to the criteria of a fold change greater than 1.5 times (upregulation greater than 1.5 times or downregulation less than 0.667 times) and a p-value < 0.05. The results are shown in Table 7.
3.3.1. Differential Protein Bioinformatics Analysis
GO Function Annotations
The software OmicsBean was used to annotate the target protein set. According to the classification of the biological process (BP), the target set was mainly involved in single-organism processes, metabolic processes, and biological regulation. According to the cellular component (CC), these differential proteins were mainly found in cell parts, cells, and organelles. Their molecular functions (MFs) mainly included binding and catalytic activity (Chart 1).
KEGG Pathway Annotations
The software OmicsBean was used to annotate the KEGG pathway for the target protein set. The KEGG metabolic pathway analysis showed that the differential proteins were enriched in five pathways: glycolysis/gluconeogenesis, biosynthesis of amino acids, carbon metabolism, metabolic pathways, and phenylalanine metabolism (Chart 2).
3.4. Metabolomics Results in Serum
A total of 3246 metabolites were identified using LC–MS untargeted metabolomics technology. Thirty-six differentially expressed metabolites were screened according to the criteria of VIP ≥ 1 and p-value < 0.05. Among them, 13 proteins were upregulated and 23 proteins were downregulated (Table 8). The results of the total ion chromatogram showed that the response intensity and retention time of each chromatographic peak overlapped, indicating that the error was small throughout the entire experimental process (Figure 4). The results of the PCA analysis showed that the metabolic profiles of the two groups of samples had significant changes (Figure 5). The clustering heat map further confirmed this difference (Figure 6).
Differential Metabolite Bioinformatics Analysis
The differential metabolites obtained from the example group were submitted to the KEGG website for pathway analysis to obtain the metabolic pathways involved in the differential metabolites. The KEGG metabolic pathway analysis showed that the differential proteins were enriched in the two pathways of lysine degradation and phenylalanine metabolism (Chart 3).
4. Discussion
Natural weathering has led to an increase in the selenium content of rocks in some areas of China, the United States, Russia, and other regions. Domestic animals that lick these selenium-rich rocks can develop selenium poisoning [17,18]. For example, in the Qinghai Lake area of China, selenium-rich shale geological outcrops have led to selenium poisoning due to dry weather and high wind. Geochemical mapping can widely predict this risk [19,20]. The vegetation growing in Se-enriched soils also plays a part. When the content of available Se in the soil decreases or increases, it will directly affect the content of Se in plants. Plants are the main medium for transferring mineral elements in the soil to animals [21]. Therefore, the Se content in the soil will directly affect the nutrition and health of animals after being enriched by plants and transferred to animals [22]. Chronic selenosis in P. przewalskii is usually caused by consuming a large amount of Se-containing herbage for a long time, resulting in depression, dyspnea, abnormal gait, hair removal, hoof shedding, and other comprehensive symptoms [23,24]. Therefore, studying the effects of chronic selenosis on P. przewalskii is of great significance for protecting this endangered species.
In this study, we detected the Se content of soils and grass in a Se-enriched habitat and a healthy habitat. The detection data showed that the Se contents of the soil and grass samples from the Se-enriched habitat were significantly higher than those from the healthy habitat. We also examined the Se levels in blood and muscle samples taken from P. przewalskii, which again showed that the Se levels of the samples from the Se-rich pasture were significantly higher than those from the healthy habitat. Combined with the clinical symptoms of the animals in the Se-enriched habitat, it was confirmed that chronic selenosis has occurred in the Se-enriched habitat. The results of Se detection in the soil, grass, blood, and muscle samples were also consistent with the theory of Se mineral flow (soil, plant, and animal) [25].
The anemia index of animals can be reflected in the hematological parameters and blood Fe content. [26,27]. The results, in terms of the hematological parameters, showed that the contents of Hb, MCV, PLT, RBC, and PCV in the Se-enriched habitat in P. przewalskii were lower than those in the healthy habitat. In addition, the Fe levels in the blood and muscle samples from P. przewalskii in the Se-enriched habitat were significantly lower than those in the healthy habitat. These results showed that P. przewalskii had symptoms of anemia. Studies have shown that when the Se content in an organism is significantly elevated, the methyl transfer reaction is blocked, and the metabolism of VB12 and folate is abnormal. This leads to Fe deficiency and Fe-deficiency anemia [28]. In addition, the content of iron in soil and plants in selenium-rich habitats was significantly lower than that in healthy habitats, which may also be one of the causes of anemia in P. przewalskii.
The body’s defense system includes the non-enzymatic system and enzymatic system. Non-enzymatic systems mainly include VE, VC, cysteine, GSH, Cu, Fe, Zn, and Se. The enzymatic system consists of SOD, GSH-Px, CAT, and other antioxidant enzymes. Antioxidants are important substances in the body’s defense system, and their main function is to stabilize and neutralize free radicals [29,30,31,32]. In addition, T-AOC and MDA reflect antioxidant functions, while NOS and NO are directly affected by antioxidant functions [33,34,35,36]. The results of antioxidant capacity in P. przewalskii showed that the levels of GSH-Px, T-AOC, SOD, and CAT in the Se-enriched habitat were significantly lower than those in the healthy habitat. The levels of NO, MDA, T-NOS, and LPO were significantly higher than those in the healthy habitat. These results indicated that Se-rich habitats will lead to antioxidant function problems, the oxidation system being out of balance, and serious oxidation dysfunction in the body. On the other hand, studies have shown that decreased GSH-Px activity in the blood leads to an increase in peroxides on membrane lipids, the destruction of the biological activity of hemoglobin, and a decrease in the resistance of red blood cells to the hypotonic environment, ultimately leading to chronic anemia [37,38,39]. This is consistent with the symptoms of anemia, as indicated by the biochemical results in the blood.
The levels of IL-1β, IL-2, TNF-α, IgA, IgG, IL-6, and IgM in the serum directly reflect the immune function of the organism [40]. Regarding the results of immune function, the levels of serum IL-1β, IL-2, TNF-α, IgA, IgG, IL-6, and IgM in the Se-enriched habitats were significantly lower than those in the healthy habitats. These results indicated that the immune function of P. przewalskii in the Se-enriched habitat was decreased. Some studies have reported that antioxidant function is closely related to immune function, and a reduction in the antioxidant function of an organism will lead to an increase in oxygen free radicals and others. In addition, the occurrence of the lipid peroxygenation reaction will cause peroxygenation damage to the body tissue, causing cell metabolism disorders and an immunity decline [41,42,43,44,45]. In this study, the detected immune and antioxidant indices in the serum confirmed that the changing trend in antioxidant and immune functions was consistent, which was also consistent with previous studies.
A total of 44 differential proteins and the 36 differential metabolites were screened using proteomics and metabolomics technology in the serum of P. przewalskii. Among them, 13 differential metabolites were upregulated, and the remaining 23 differential metabolites were downregulated. The selected proteins and metabolites were involved in glycolytic pathway disorders, amino acid biosynthesis, carbon metabolism, phenylalanine metabolism, and energy metabolism. It is particularly noteworthy that the results of the proteomic and metabolomic enriched pathways in this study mapped to a common pathway, namely, phenylalanine metabolism.
Phenylalanine is an essential amino acid, which is converted to tyrosine by phenylalanine hydroxylase [46]. Phenylalanine hydroxylase is an Fe enzyme. When the Fe in the organism is deficient, its activity decreases; therefore, the conversion of phenylalanine to tyrosine is blocked, resulting in an increase in serum phenylalanine levels. Studies have shown that the plasma phenylalanine levels in Fe-deficient mice increased significantly and decreased after treatment with Fe [47]. Abnormal phenylalanine metabolism can lead to anemia symptoms in an organism, which are consistent with the anemia symptoms found using serum biochemical indicators and Fe content.
Phenylalanine is also closely related to antioxidant function. Studies have found that phenylalanine can increase SOD in the plasma, protect the vascular endothelium from damage due to reactive oxygen species (the product of cellular REDOX), regulate the antioxidant function of the organism by regulating the removal of oxygen free radicals, and improve the secretion of endothelial cells [48,49]. In this study, we measured serum antioxidant function indices and found that the SOD in the Se-enriched habitat was significantly lower than in the healthy habitat. Combined with the analysis of other antioxidant indices, this showed that the antioxidant function was significantly decreased, indicating that abnormal metabolism of phenylalanine might be associated with decreased antioxidant function.
Phenylalanine metabolism affects immune function. Studies have shown that phenylalanine deficiencies can atrophy the thymus and spleen in animals, impairing the function of the mononuclear phagocytic system [50]. It has also been found that high-dose intraperitoneal injection of phenylalanine in mice can inhibit the antibody response, which might be related to the inhibition of the humoral immune function through phenylalanine metabolism, especially phenylethylamine [51]. The results in this study showed that immune function decreased, suggesting that these findings might be related to abnormal phenylalanine metabolism.
The main function of phenylalanine is to produce tyrosine, which acts on the nerves, liver, and other tissues [52]. Phenylalanine metabolism can also synthesize certain hormones; neurotransmitters such as DA, NE, E; and the production of melanin in the skin and adrenal medulla [53]. Therefore, stable phenylalanine metabolism at a reasonable level is an important condition for the normal growth, development, and physiological functioning of the body. [54,55,56]. Diseases of the liver and kidney, genetics, immunity, neurohumoral activation, and other factors can cause phenylalanine metabolism disorders, resulting in the obstruction of phenylalanine conversion to tyrosine and an increase in blood phenylalanine concentration or the phenylalanine/tyrosine ratio [57]. Studies have shown that long-term high levels of phenylalanine or a decline in the ratio of tyrosine to phenylalanine can cause nervous system damage, albinism, phenylketonuria, and other diseases [58,59]. In particular, damage to the nervous system can lead to intellectual developmental deficits, motor dysfunction, depression, mental disorders, developmental delays, coma, and even death [59,60]. Both chronic and acute selenosis can present varying degrees of neurological symptoms in P. przewalskii. Based on this analysis, we speculated that the neurological symptoms of selenosis might be related to abnormal phenylalanine metabolism.
Leptin is the expression product of obesity genes [61]. It is widely involved in the regulation of various physiological activities of the human body, such as food intake, energy consumption and metabolism, hormone regulation, immunity, and vascular proliferation [62]. The levels of leptin, as a negative feedback signal of central fat deposition in the brain, increase with increasing fat deposition [63,64]. A study found that human plasma leptin levels and phenylalanine concentrations are positively correlated [65]. Compared with healthy controls and patients with PKU on a strictly controlled diet (the content of phenylalanine in the diet was controlled below 0.19 mmo/L), the plasma leptin levels in patients with PKU without a controlled diet were significantly higher [66]. It has been suggested that disorders of phenylalanine metabolism can affect the occurrence of various diseases through leptin. Chronic selenosis in P. przewalskii resulted in symptoms such as weight loss, anemia, and lack of vitality, which may be related to abnormal phenylalanine metabolism, resulting in abnormal leptin levels [67,68,69].
Some studies have found that abnormal metabolism of phenylalanine can also lead to abnormal metabolism of vitamin B12 (VB12), thereby causing related diseases [70]. The main functions of VB12 include promoting the development and maturation of red blood cells, maintaining hematopoietic function in a normal state, preventing pernicious anemia, maintaining the health of the nervous system, promoting the metabolism of carbohydrates, promoting fat and protein synthesis, eliminating restlessness, and improving concentration. VB12 is also necessary for nervous system function [71,72]. Previously, we also analyzed the relationship between Se and VB12, indicating that excessive Se leads to abnormal metabolism of VB12 in organisms, leading to Fe-deficiency anemia. It has been suggested that Se enrichment in P. przewalskii may lead to abnormal phenylalanine metabolism. This may lead to abnormal metabolism of VB12 and eventually lead to Fe-deficiency anemia and neurological symptoms.
In addition, the liver is the main location for phenylalanine metabolism [73]. When liver diseases occur, such as cirrhosis and necrosis, the enzymes required for phenylalanine metabolism are destroyed, resulting in disorders of phenylalanine metabolism [74]. Studies have shown that the plasma phenylalanine concentration in patients with liver cirrhosis and liver cancer is at a high level, which is positively correlated with the removal of phenylalanine metabolism through alanine aminotransferase (reflecting the degree of liver damage) [75,76]. The liver is the main lesion site of chronic selenosis in P. przewalskii, which will cause expansion, rupture, hemorrhage of the central hepatic vein and hepatic sinusoids, and focal necrosis, revealing that abnormal phenylalanine metabolism is consistent with the pathological changes associated with Se poisoning in P. przewalskii [77,78].
The above analysis showed that abnormal phenylalanine metabolism may be one of the reasons for the symptoms of chronic selenosis in P. przewalskii, such as weight loss, anemia, a low antioxidant capacity, decreased immune function, lack of vitality, depression, and sluggishness.
In summary, the series of symptoms caused by abnormal phenylalanine metabolism coincides with the symptoms of chronic selenosis, which is an important finding for studying the mechanism of chronic selenosis in P. przewalskii. The exact mechanisms of abnormal phenylalanine metabolism caused by chronic selenosis in P. przewalskii remain to be verified by further experiments. We will address this topic in our next study.
5. Conclusions
In our study, we found that a Se-enriched habitat caused chronic selenosis in P. przewalskii. This was characterized by anemia, decreased antioxidant function, decreased immune function, and abnormal phenylalanine metabolism. The findings of this study will help to improve the understanding of the mechanism of chronic selenosis in P. przewalskii and provide a scientific basis for the protection of endangered species in relation to excessive Se in natural habitats.
Author Contributions
X.S.: funding acquisition, conceptualization, methodology, investigation, and data curation. P.Z.: preparation, writing—original draft, software, and project administration. H.R.: supervision, methodology, writing—reviewing and editing, formal analysis, and resources. All authors have read and agreed to the published version of the manuscript.
Funding
This work was supported by the National Natural Science Foundation of China (42171060), the Innovation Development Supporting Plan Project of Key Industries in Southern Xinjiang (2021DB014), and the Modern Agricultural Industry Technology System in China (CARS-38).
Institutional Review Board Statement
Ethical Standards in all experiments were carried out in accordance with the Guide for the Care and Use of Animals in Research and Teaching (Federation of Animals Science Societies, Project A033). The protocol for the present experiment was approved by the Institutional Animal Care and Use Committee of the Southwest University of Science and Technology in China. All authors confirm that ethical responsibilities were upheld.
Informed Consent Statement
Not applicable.
Data Availability Statement
The datasets generated and analyzed in the current study are available from the corresponding author upon reasonable request. The data are not publicly available due to privacy.
Conflicts of Interest
The authors have no relevant financial or non-financial interest to disclose, and the authors declare no conflict of interest.
References
- Ping, X.G.; Li, C.W.; Li, C.L.; Tang, S.H.; Fang, H.X.; Cui, S.P.; Chen, J.; Wang, E.G.; He, Y.B.; Cai, P.; et al. The distribution, population and conservation status of Przewalski’s gazelle, Procapra przewalskii. Biodivers Sci. 2018, 26, 177–184. [Google Scholar] [CrossRef]
- Yang, J.; Wang, X. Proteomics in organ dysfunction today: A new way to understand the disease. J. Organ Dysfunct. 2006, 2, 66–67. [Google Scholar] [CrossRef]
- Li, C.L.; Jiang, Z.G.; Ping, X.G.; Cai, J.; You, Z.Q.; Li, C.W.; Wu, Y.L. Current status and conservation of the endangered Przewalski’s ga-zelle (P.przewalskii), endemic to the Qinghai-Tibetan Plateau, China. Oryx 2012, 46, 145–153. [Google Scholar] [CrossRef]
- Li, Z.; Jiang, Z. Sexual segregation in Tibetan gazelle: A test of the activity budget hypothesis. Proc. Zool. Soc. Lond. 2008, 274, 327–331. [Google Scholar] [CrossRef]
- Abstracts for a conference on trace elements in diet, nutrition, and health: Essentiality and toxicity. Cell Biol. Toxicol. 2008, 24 (Suppl. S1), 1–130. [CrossRef]
- Bhatnagar, Y.V.; Wangchuk, R.; Mishra, C. Decline of the Tibetan gazelle, Procapra picticaudata in Ladakh, India. Oryx 2006, 40, 229–232. [Google Scholar] [CrossRef]
- Zhao, B.; Xing, C.; Zhou, S.; Wu, X.; Yang, R.; Yan, S. Sources, Fraction Distribution and Health Risk Assessment of Selenium (Se) in Dashan Village, a Se-Rich Area in Anhui Province, China. Bull. Environ. Contam. Toxicol. 2020, 104, 545–550. [Google Scholar] [CrossRef]
- Zhang, L.; Liu, J.; Wang, D.; Wang, H.; Wu, Y.; Lü, Z. Fencing for conservation?—The impacts of fencing on grasslands and the endangered Prze-walski’s gazelle on the Tibetan Plateau. Sci. China Life Sci. 2018, 61, 1593–1595. [Google Scholar] [CrossRef]
- Shen, X.Y.; Huo, B.; Wu, T.; Song, C.J. Chi YK iTRAQ-based proteomic analysis to identify molecular mechanisms of the selenium deficiency response in the Przewalski’s gazelle. J. Proteome 2019, 203, 103389. [Google Scholar] [CrossRef]
- Jiang, Z.G.; Li, D.Q.; Wang, Z.W. Population declines of Przewalski’s gazelle around Qinghai Lake, China. Oryx 2000, 34, 129–135. [Google Scholar] [CrossRef]
- Mallon, D.; Kingswood, S. Antelopes. Part 4: North Africa, the Middle East, and Asia. Global Survey and Regional Action Plans; SSC Antelope Specialist Group; IUCN: Gland, Switzerland, 2001. [Google Scholar]
- Song, C.; Jiang, Q.; Shen, X. Responses of Przewalski’s Gazelle (Procapra przewalskii) to Zinc Nutrition in Physical Habitat. Biol. Trace Element Res. 2021, 199, 142–147. [Google Scholar] [CrossRef]
- Huo, B.; He, J.; Shen, X. Effects of Selenium-Deprived Habitat on the Immune Index and Antioxidant Capacity of Przewalski’s gazelle. Biol. Trace Elem. Res. 2020, 198, 149–156. [Google Scholar] [CrossRef]
- Zhao, K.; Huo, B.; Shen, X. Studies on Antioxidant Capacity in Selenium-Deprived the Choko Yak in the Shouqu Prairie. Biol. Trace Element Res. 2021, 199, 3297–3302. [Google Scholar] [CrossRef]
- Li, Z.; Beauchamp, J.G. Nonrandom mixing between groups of Przewalski’s gazelle and Tibetan gazelle. J. Mammal. 2010, 91, 674–680. [Google Scholar] [CrossRef]
- Dai, C.; Sun, Z.; Zhang, X.; Qiu, M.C. Erratum to: Elevated muscle enzymes and muscle biopsy in idiopathic hypoparathyroidism patients. J. Endocrinol. Investig. 2012, 35, 451. [Google Scholar]
- Fordyce, F.M. Selenium Deficiency and Toxicity in the Environment. In Essentials of Medical Geology; Selinus, O., Ed.; Springer: Dordrecht, The Netherlands, 2013. [Google Scholar] [CrossRef]
- Zhang, B.; Yang, L.; Wang, W.; Li, Y.; Li, H. Erratum to: Environmental selenium in the Kaschin–Beck disease area, Tibetan Plateau, China. Environ. Geochem. Health 2012, 34, 297. [Google Scholar] [CrossRef]
- Hao, L.; Zhang, J.; Zhang, S.; Ma, S.; Li, B.; Long, J.; Fan, J.; Luo, K. Distribution characteristics and main influencing factors of selenium in surface soil of natu-ral selenium-rich area: A case study in Langao County, China. Environ. Geochem. Health 2021, 43, 333–346. [Google Scholar] [CrossRef]
- Combs, G.F., Jr. Selenium in global food systems. Br. J. Nutr. 2001, 85, 517–547. [Google Scholar] [CrossRef]
- Zhao, C.; Ren, J.; Xue, C.; Lin, E. Study on the Relationship between Soil Selenium and Plant Selenium Uptake. Plant Soil 2005, 277, 197–206. [Google Scholar] [CrossRef]
- Song, T.; Su, X.; He, J.; Liang, Y.; Zhou, T.; Liu, C. Selenium (Se) uptake and dynamic changes of Se content in soil–plant systems. Environ. Sci. Pollut. Res. 2018, 25, 34343–34350. [Google Scholar] [CrossRef]
- Su, Y.; Li, L.; Farooq, M.U.; Huang, X.; Zheng, T.; Zhang, Y.J.; Ei, H.H.; Panhwar, F.H.; Tang, Z.; Zeng, R.; et al. Rescue effects of Se-enriched rice on physiological and biochemical characteristics in cadmi-um poisoning mice. Environ. Sci. Pollut. Res. 2021, 28, 20023–20033. [Google Scholar] [CrossRef]
- Nieradko-Iwanicka, B.; Borzęcki, A. Subacute poisoning of mice with deltamethrin produces memory impairment, reduced locomotor activity, liver damage and changes in blood morphology in the mechanism of oxidative stress. Pharmacol. Rep. 2015, 67, 535–541. [Google Scholar] [CrossRef]
- Száková, J.; Tremlová, J.; Pegová, K.; Najmanová, J.; Tlustoš, P. Soil-to-plant transfer of native selenium for wild vegetation cover at selected locations of the Czech Republic. Environ. Monit. Assess. 2015, 187, 358. [Google Scholar] [CrossRef]
- Kurt, B.O.; Konukoglu, D.; Kalayci, R.; Ozdemir, S. Investigation of the Protective Role of Selenium in the Changes Caused by Chlorpyrifos in Trace Elements, Biochemical and Hematological Parameters in Rats. Biol. Trace Element Res. 2022, 200, 228–237. [Google Scholar] [CrossRef]
- Xiao, C.; Lei, X.; Wang, Q.; Du, Z.; Jiang, L.; Chen, S.; Zhang, M.; Zhang, H.; Ren, F. Effects of a Tripeptide Iron on Iron-Deficiency Anemia in Rats. Biol. Trace Element Res. 2016, 169, 211–217. [Google Scholar] [CrossRef]
- Acharyya, N.; Deb, B.; Chattopadhyay, S.; Maiti, S. Arsenic-Induced Antioxidant Depletion, Oxidative DNA Breakage, and Tissue Damages are Prevented by the Combined Action of Folate and Vitamin B12. Biol. Trace Element Res. 2015, 168, 122–132. [Google Scholar] [CrossRef]
- Wu, L.; Zhang, H.; Xu, C.; Xia, C. Critical Thresholds of Antioxidant and Immune Function Parameters for Se deficiency Prediction in Dairy Cows. Biol. Trace Element Res. 2016, 172, 320–325. [Google Scholar] [CrossRef]
- Roman, M.; Jitaru, P.; Barbante, C. Selenium biochemistry and its role for human health. Metallomics 2014, 6, 25–54. [Google Scholar] [CrossRef]
- Chen, M.; Mahfuz, S.; Cui, Y.; Jia, L.; Liu, Z.; Song, H. The Antioxidant Status of Serum and Egg Yolk in Layer Fed with Mushroom Stembase (Flammulina velutipes). Pak. J. Zool. 2019, 52, 389–392. [Google Scholar] [CrossRef]
- Herena, Y.H.; Naghum, A.; Marla, J.B.; Lucia, A.S. From selenium absorption to selenoprotein degradation. Biol. Trace Elem. Res. 2019, 192, 26–37. [Google Scholar]
- Huma, N.; Sajid, A.; Khalid, A.; Wardah, H.; Moazama, B.; Shakeela, P.; Sadia, M.; Sajida, M. Toxic effect of insecticides mixtures on antioxidant enzymes in different organs of fish, Labeo rohita. Pak. J. Zool. 2019, 51, 1355–1361. [Google Scholar]
- Iqra, B.; Moolchand, M.; Pershotam, K.; Saeed, A.S.; Hira, S. Effect of dietary selenium yeast supplementation on morphology and antioxidant status in testes of young goat. Pak. J. Zool. 2019, 51, 979–988. [Google Scholar]
- Meng, T.; Liu, Y.-L.; Xie, C.-Y.; Zhang, B.; Huang, Y.-Q.; Zhang, Y.-W.; Yao, Y.; Huang, R.; Wu, X. Effects of Different Selenium Sources on Laying Performance, Egg Selenium Concentration, and Antioxidant Capacity in Laying Hens. Biol. Trace Element Res. 2019, 189, 548–555. [Google Scholar] [CrossRef] [PubMed]
- Cao, C.; Fan, R.; Chen, M.; Li, X.J.; Xing, M.Y.; Zhu, F.T. Inflammatory response occurs in veins of broiler chickens treated with a se-lenium deficiency diet. Biol. Trace Elem. Res. 2017, 183, 1–9. [Google Scholar]
- Han, Y.-H.; Kim, S.-U.; Kwon, T.-H.; Lee, D.-S.; Ha, H.-L.; Park, D.-S.; Woo, E.-J.; Kim, J.-M.; Chae, H.-B.; Lee, S.Y.; et al. Peroxiredoxin II is essential for preventing hemolytic anemia from oxidative stress through maintaining hemoglobin stability. Biochem. Biophys. Res. Commun. 2012, 426, 427–432. [Google Scholar] [CrossRef]
- Zhao, J.; Xing, H.; Liu, C.; Zhang, Z.; Xu, S. Effect of Selenium Deficiency on Nitric Oxide and Heat Shock Proteins in Chicken Erythrocytes. Biol. Trace Element Res. 2016, 171, 208–213. [Google Scholar] [CrossRef]
- Liao, C.; Hardison, R.C.; Kennett, M.J.; Carlson, B.A.; Paulson, R.F.; Prabhu, K.S. Selenoproteins regulate stress erythroid progenitors and spleen microenvironment during stress erythropoiesis. Blood 2018, 131, 2568–2580. [Google Scholar] [CrossRef]
- Qiu, J.; Zhou, P.; Shen, X. Effects of Se-Yeast on Immune and Antioxidant in the Se-Deprived Pishan Red Sheep. Biol. Trace Element Res. 2022, 200, 2741–2749. [Google Scholar] [CrossRef]
- Exner, R.; Wessner, B.; Manhart, N.; Roth, E. Therapeutic potential of glutathione. Wien. Klin. Wochenschr. 2000, 112, 610–616. [Google Scholar]
- Safdari-Rostamabad, M.; Hosseini-Vashan, S.J.; Perai, A.H.; Sarir, H. Nanoselenium Supplementation of Heat-Stressed Broilers: Effects on Performance, Carcass Characteristics, Blood Metabolites, Immune Response, Antioxidant Status, and Jejunal Morphology. Biol. Trace Elem. Res. 2017, 178, 105–116. [Google Scholar] [CrossRef]
- Ashrafi, H.; Sadeghi, A.A.; Chamani, M. Effect of Organic Selenium Supplementation on the Antioxidant Status, Immune Response, and the Relative Expression of IL-2 and IFN-γ Genes in Ewes During the Hot Season. Biol. Trace Elem. Res. 2023. [Google Scholar] [CrossRef] [PubMed]
- Zhang, Y.; Zhou, P.; Shen, X. Effects of Se-Enriched Malt on the Immune and Antioxidant Function in the Se-Deprived Rec-lamation Merino Sheep in Southern Xinjiang. Biol. Trace Elem. Res. 2022, 200, 3621–3629. [Google Scholar] [CrossRef] [PubMed]
- Qiu, H.; Gao, S.; Hou, L.; Li, A.; Zhu, L.-Q.; Dong, J.; Chen, F. Selenium-enriched Bacillus subtilis Improves Growth Performance, Antioxidant Capacity, Immune Status, and Gut Health of Broiler Chickens. Biol. Trace Element Res. 2023. [Google Scholar] [CrossRef] [PubMed]
- Wilson, C.J.; Van Wyk, K.G.; Leonard, J.V.; Clayton, P.T. Phenylalanine supplementation improves the phenylalanine profile in tyro-sinaemia. J. Inherit. Metab. Dis. 2000, 23, 677–683. [Google Scholar] [CrossRef]
- Furuyama, K.; Kaneko, K. Iron metabolism in erythroid cells and patients with congenital sideroblastic anemia. Int. J. Hematol. 2018, 107, 44–54. [Google Scholar] [CrossRef]
- Liapi, C.; Feskou, I.; Zarros, A.; Carageorgiou, H.; Galanopoulou, P.; Tsakiris, S. Equilibrated diet restores the effects of early age choline-deficient feeding on rat brain antioxidant status and enzyme activities: The role of homocysteine, l-phenylalanine and l-alanine. Metab. Brain Dis. 2008, 23, 289–301. [Google Scholar] [CrossRef]
- Berti, S.L.; Nasi, G.M.; Garcia, C.; de Castro, F.L.; Nunes, M.L.; Rojas, D.B.; Moraes, T.B.; Dutra-Filho, C.S.; Wannmacher, C.M.D. Pyruvate and creatine prevent oxidative stress and behavioral alterations caused by phenylalanine administration into hippocampus of rats. Metab. Brain Dis. 2012, 27, 79–89. [Google Scholar] [CrossRef]
- Sikalidis, A.K. Amino Acids and Immune Response: A Role for Cysteine, Glutamine, Phenylalanine, Tryptophan and Argi-nine in T-cell Function and Cancer? Pathol. Oncol. Res. 2015, 21, 9–17. [Google Scholar] [CrossRef]
- Meadows, G.G.; Abdallah, R.M.; Starkey, J.R.; Aslakson, C.J. Response of natural killer cells from dietary tyrosine-and phenylala-nine-restricted mice to biological response modifiers. Cancer Immunol. Immunother. 1988, 26, 67–73. [Google Scholar] [CrossRef]
- Cesaro, L.; Marin, O.; Venerando, A.; Donella-Deana, A.; Pinna, L.A. Phosphorylation of cystic fibrosis transmembrane conductance regulator (CFTR) serine-511 by the combined action of tyrosine kinases and CK2: The implication of tyrosine-512 and phenylalanine-508. Amino Acids 2013, 45, 1423–1429. [Google Scholar] [CrossRef]
- Roy, S.; Das, T.K. Study of Interaction Between Tryptophan, Tyrosine, and Phenylalanine Separately with Silver Nanoparticles by Fluorescence Quenching Method. J. Appl. Spectrosc. 2015, 82, 598–606. [Google Scholar] [CrossRef]
- Kawai, R.; Toya, Y.; Shimizu, H. Metabolic pathway design for growth-associated phenylalanine production using synthetically designed mutualism. Bioprocess Biosyst. Eng. 2022, 45, 1539–1546. [Google Scholar] [CrossRef] [PubMed]
- Ngiwsara, L.; Vatanavicharn, N.; Sawangareetrakul, P.; Liammongkolkul, S.; Ratanarak, P.; Boonyawat, B.; Srisomsap, C.; Champattanachai, V.; Ketudat-Cairns, J.; Wasant, P.; et al. Molecular characterization of Thai patients with phenylalanine hydroxylase deficiency and in vitro functional study of two novel PAH variants. Mol. Biol. Rep. 2021, 48, 2063–2070. [Google Scholar] [CrossRef]
- Ding, D.; Liu, Y.; Xu, Y.; Zheng, P.; Li, H.; Zhang, D.; Sun, J. Improving the Production of L-Phenylalanine by Identifying Key Enzymes through Multi-Enzyme Reaction System in Vitro. Sci. Rep. 2016, 6, 32208. [Google Scholar] [CrossRef] [PubMed]
- Swierczynski, J.; Sledzinski, T.; Slominska, E.; Smolenski, R.; Sledzinski, Z. Serum Phenylalanine Concentration as a Marker of Liver Function in Obese Patients Before and After Bariatric Surgery. Obes. Surg. 2009, 19, 883–889. [Google Scholar] [CrossRef]
- Sapropterin reduces phenylalanine levels in phenylketonuria. Inpharma Wkly. 2007, 1569, 7.
- Hong, S.; Zhu, T.; Zheng, S.; Zhan, X.; Xu, F.; Gu, X.; Liang, L. Gene expression profiles in the brain of phenylketonuria mouse model reversed by the low phenylalanine diet therapy. Metab. Brain Dis. 2021, 36, 2405–2414. [Google Scholar] [CrossRef]
- Preissler, T.; Bristot, I.J.; Costa, B.M.L.; Fernandes, E.K.; Rieger, E.; Bortoluzzi, V.T.; de Franceschi, I.D.; Dutra-Filho, C.S.; Moreira, J.C.F.; Wannmacher, C.M.D. Phenylalanine induces oxidative stress and decreases the viability of rat astrocytes: Possible relevance for the pathophysiology of neurodegeneration in phenylketonuria. Metab. Brain Dis. 2016, 31, 529–537. [Google Scholar] [CrossRef]
- Buchanan, F.C.; Fitzsimmons, C.J.; Van Kessel, A.G.; Thue, T.D.; Winkelman-Sim, D.C.; Schmutz, S.M. Association of a missense mutation in the bovine leptin gene with carcass fat content and leptin mRNA levels. Genet. Sel. Evol. 2002, 34, 105. [Google Scholar] [CrossRef]
- Afifi, A.E.M.A.; Shaat, R.M.; Gharbia, O.M.; Elhanafy, M.; Hasan, A.S.G. Role of serum leptin levels and leptin receptor gene polymorphisms in systemic lupus erythematosus. Clin. Rheumatol. 2020, 39, 3465–3472. [Google Scholar] [CrossRef]
- Unsal, M.; Kara, N.; Karakus, N.; Tural, S.; Elbistan, M. Effects of leptin and leptin receptor gene polymorphisms on lung cancer. Tumor Biol. 2014, 35, 10231–10236. [Google Scholar] [CrossRef] [PubMed]
- Pliszka, M.; Oleszczak, B.; Szablewski, L. Leptin at gender-specific concentrations does not affect glucose transport, expres-sion of glucose transporters and leptin receptors in human lymphocytes. Endocrine 2015, 49, 97–105. [Google Scholar] [CrossRef]
- Wasim, M.; Awan, F.R.; Najam, S.S.; Khan, A.R.; Khan, H.N. Role of Leptin Deficiency, Inefficiency, and Leptin Receptors in Obesity. Biochem. Genet. 2016, 54, 565–572. [Google Scholar] [CrossRef]
- Szczepankiewicz, D.; Sobkowiak, P.; Narożna, B.; Wojsyk-Banaszak, I.; Bręborowicz, A.; Szczepankiewicz, A. Leptin gene polymorphism affects leptin level in childhood asthma. World J. Pediatr. 2018, 14, 601–606. [Google Scholar] [CrossRef] [PubMed]
- Hui, L.; Desen, W.; Zhizhong, P.; Lijing, C.; Xiaojun, W.; Zhenhai, L.; Tai, K. Expression and Biological Significance of Leptin, Leptin Receptor, VEGF, and CD34 in Colorectal Carcinoma. Cell Biochem. Biophys. 2011, 60, 241–244. [Google Scholar] [CrossRef] [PubMed]
- Mitsuyama, S.; Abe, F.; Kimura, M.; Yoshida, M.; Higuchi, T. Association between leptin gene expression in subcutaneous adipose tissue and cir-culating leptin levels in obese patients with psoriasis. Arch. Dermatol. Res. 2015, 307, 539–544. [Google Scholar] [CrossRef] [PubMed]
- Leptin receptor (LEPR.; CD295). Sci. Bus. Exch. 2010, 3, 559. [CrossRef]
- MacDonald, A.; Lee, P.; Davies, P.; Daly, A.; Lilburn, M.; Ozel, H.G.; Preece, M.A.; Hendriksz, C.; Chakrapani, A. Long-term compliance with a novel vitamin and mineral supplement in older people with PKU. J. Inherit. Metab. Dis. 2008, 31, 718–723. [Google Scholar] [CrossRef] [PubMed]
- Zhang, H.; Gu, X.F. A Study of Gene Expression Profiles of Cultured Embryonic Rat Neurons Induced by Phenylalanine. Metab. Brain Dis. 2005, 20, 61–72. [Google Scholar] [CrossRef]
- Hvas, A.M.; Nexo, E.; Nielsen, J.B. Vitamin B12 and vitamin B6 supplementation is needed among adults with phenylke-tonuria (PKU). J. Inherit. Metab. Dis. 2006, 29, 47–53. [Google Scholar] [CrossRef]
- Chen, L.; Yang, P.; Hu, L.; Yang, L.; Chu, H.; Hou, X. Modulating phenylalanine metabolism by L. acidophilus alleviates alcohol-related liver disease through enhancing intestinal barrier function. Cell Biosci. 2023, 13, 24. [Google Scholar] [CrossRef] [PubMed]
- Ishii, Y.; Suzuki, S.; Kohno, T.; Aoki, M.; Goto, I.; Kohno, T.; Ito, A.; Asai, S. Patients with severe liver cirrhosis followed up by L-[1- 13 C] phenylalanine breath test. J. Gastroenterol. 2003, 38, 1086–1090. [Google Scholar] [CrossRef] [PubMed]
- Zheng, H.; Chen, M.; Lu, S.; Zhao, L.; Ji, J.; Gao, H. Metabolic characterization of hepatitis B virus-related liver cirrhosis using NMR-based serum metabolomics. Metabolomics 2017, 13, 121. [Google Scholar] [CrossRef]
- Tietge, U.J.F.; Bahr, M.J.; Manns, M.P.; Böker, K.H.W. Hepatic amino-acid metabolism in liver cirrhosis and in the long-term course after liver transplantation. Transpl. Int. 2003, 16, 1–8. [Google Scholar] [CrossRef] [PubMed]
- Shen, X.; Huo, B.; Gan, S. Effects of Nano-Selenium on Antioxidant Capacity in Se-Deprived Tibetan Gazelle (Procapra picti-caudata) in the Qinghai–Tibet Plateau. Biol. Trace Elem. Res. 2021, 199, 981–988. [Google Scholar] [CrossRef]
- Xiang, Z.; Yang, J.; Ikhumhen, H.O.; Sheng, C.; Wong, L.; Ren, X.; Zhou, J.; Wang, W. Complete mitochondrial genome sequence of the Przewalski’s gazelle (Procapra przewalskii). Conserv. Genet. Resour. 2018, 11, 369–371. [Google Scholar] [CrossRef]
Figure 1.
P. przewalskii habitats. A represents a Se-enriched habitat. B represents a healthy habitat.
Figure 1.
P. przewalskii habitats. A represents a Se-enriched habitat. B represents a healthy habitat.

Figure 2.
The differential protein volcano diagram. The abscissa is the multiple of difference, and the ordinate is the significant p-value of difference. The red dots are significantly upregulated proteins, the blue dots are significantly downregulated proteins, and the gray dots are proteins with no significant difference.

Figure 3.
Results of cluster analysis of differentially expressed proteins. Each row represents a protein, and each column represents a group of samples. The logarithmic values of the expression amounts of significantly differentially expressed proteins in different samples are displayed in different colors in the heat map, with red representing a relatively high protein content and blue representing a relatively low protein content.

Chart 1.
Differential protein GO (MF BP CC) functional annotation chart. The abscissa in the figure represents the enriched GO functional classification. The figure shows the top-ten level 2 entries in the enrichment analysis of three categories of BP, CC, and MF. The entries of each category are sorted from left to right according to their log value (p-value). The left side is more prominent. The vertical axis on the left represents the percentage of the number of proteins or genes corresponding to each entry to the total number of submitted proteins or genes. The vertical axis on the right represents the number of proteins or genes corresponding to each entry.

Chart 2.
Pathway enrichment map of differentially expressed proteins based on KEGG metabolic pathway analysis.
Chart 2.
Pathway enrichment map of differentially expressed proteins based on KEGG metabolic pathway analysis.

Figure 4.
Total ionogram.

Figure 5.
PCA scores of positive and negative ion modes. (A) the PCA score chart of the positive ion mode, and (B) the PCA score chart of the negative ion mode.
Figure 5.
PCA scores of positive and negative ion modes. (A) the PCA score chart of the positive ion mode, and (B) the PCA score chart of the negative ion mode.

Figure 6.
Results of the cluster analysis of differentially expressed metabolites. Each row represents a metabolite, and each column represents a group of samples. The logarithmic values of the expression amounts of significantly differentially expressed metabolites in different samples are displayed in different colors in the heat map, with red representing a relatively high metabolite content and blue representing a relatively low protein content. (A) the clustering heat map under the positive ion model, and (B) the clustering heat map under the negative ion model.

Chart 3.
Pathway enrichment map of differentially expressed metabolites based on KEGG metabolic pathway analysis.
Chart 3.
Pathway enrichment map of differentially expressed metabolites based on KEGG metabolic pathway analysis.


Table 1.
Proteome Discoverer parameters used for searching the database.
| Item | Value |
|---|---|
| Type of search | MS/MS ion search |
| Enzyme | Trypsin |
| Mass values | Monoisotopic |
| Max missed cleavages | 2 |
| Fixed modifications | Carbamidomethyl (C), TMT 10 plex (N-term), TMT 10 plex (K) |
| Variable modifications | Oxidation (M), TMT 10 plex (Y) |
| Peptide mass tolerance | ±20 ppm |
| Fragment mass tolerance | 0.1 Da |
| Protein mass | Unrestricted |
| Database | Uniprot |
| Database pattern | Decoy |
| FDR | ≤0.01 |
| Protein quantification | The protein ratios are calculated as the median of only the unique peptides of the protein |
| Experimental bias | Normalizes all peptide ratios by the median protein ratio. The median protein ratio should be 1 after the normalization. |
Table 2.
Mineral contents in the soil and grass (μg/g).
| Elements | Soil | Grass | ||
|---|---|---|---|---|
| Se-Rich Habitat | Healthy Habitat | Se-Rich Habitat | Healthy Habitat | |
| Copper (Cu) | 5.24 ± 1.36 | 5.82 ± 1.68 | 3.69 ± 1.01 | 4.03 ± 0.79 |
| Manganese (Mn) | 274.63 ± 35.69 | 266.84 ± 28.94 | 71.54 ± 11.58 | 68.74 ± 13.68 |
| Iron (Fe) | 7681.89 ± 741.52 * | 7985.51 ± 661.21 | 699.73 ± 197.13 * | 714.58 ± 187.95 |
| Zinc (Zn) | 44.84 ±7.51 | 43.11 ± 6.85 | 31.21 ± 8.04 | 33.57 ± 9.11 |
| Selenium (Se) | 2.82 ± 0.043 ** | 0.67 ± 0.022 | 3.39 ± 0.059 ** | 0.89 ± 0.021 |
| Molybdenum (Mo) | 1.78 ± 0.31 | 1.86 ± 0.28 | 1.57 ± 0.22 | 1.96 ± 0.67 |
* At the level of p < 0.05, ** at the level of p < 0.01.
Table 3.
Mineral contents in the blood and muscle.
| Elements | Blood (μg/mL) | Muscle (μg/g) | ||
|---|---|---|---|---|
| Se-Rich Habitat | Healthy Habitat | Se-Rich Habitat | Healthy Habitat | |
| Cu | 0.84 ± 0.17 | 0.91 ± 0.27 | 35 ± 1.04 | 39 ± 1.17 |
| Mn | 0.49 ± 0.057 | 0.51 ± 0.033 | 6.17 ± 0.19 | 5.98 ± 0.16 |
| Fe | 381.35 ± 56.87 ** | 519.45 ± 49.76 | 141.75 ± 18.28 ** | 189.65 ± 20.41 |
| Zn | 7.79 ± 1.68 | 7.48 ± 1.72 | 95.84 ± 3.47 | 87.65 ± 3.77 |
| Se | 0.54 ± 0.021 ** | 0.11 ± 0.017 | 1.16 ± 0.05 ** | 0.35 ± 0.03 |
| Mo | 0.29 ± 0.016 | 0.31 ± 0.023 | 0.98 ± 0.03 | 1.07 ± 0.04 |
** at the level of p < 0.01.
Table 4.
Results of hematological tests.
| Hematological Parameters | Blood | |
|---|---|---|
| Se-Rich Habitat | Healthy Habitat | |
| Hb (g/L) | 145.48 ± 5.25 * | 178.94 ± 7.94 |
| RBC (×1012/L) | 10.02 ± 0.26 * | 12.04 ± 0.24 |
| PCV (%) | 38.17 ± 1.77 ** | 51.87 ± 1.54 |
| MCV (fl) | 38.09 ± 0.66 * | 43.08 ± 0.68 |
| MCH (pg) | 14.52 ± 0.38 | 14.86 ± 0.24 |
| MCHC (g/L) | 381.14 ± 14.61 | 344.98 ± 10.54 * |
| WBC (109/L) | 18.67 ± 0.42 | 11.37 ± 0.84 ** |
| PLT (×109/L) | 441.74 ± 13.87 * | 468.85 ± 21.98 |
* At the level of p < 0.05, ** at the level of p < 0.01.
Table 5.
Results of antioxidant indices.
| Antioxidant Indices | Serum | |
|---|---|---|
| Se-Rich Habitat | Healthy Habitat | |
| GSH-Px (U/mL) | 46.84 ± 3.98 ** | 69.54 ± 6.61 |
| SOD (U/mL) | 49.86 ± 7.69 ** | 67.85 ± 13.54 |
| CAT (U/mL) | 3.13 ± 0.54 ** | 6.11 ± 0.75 |
| T-AOC (U/mL) | 4.01 ± 0.41 ** | 7.88 ± 1.14 |
| MDA (nmol/mL) | 13.02 ± 3.11 | 4.44 ± 2.97 ** |
| NOS (U/mL) | 70.98 ±7.79 | 39.74 ± 6.83 ** |
| NO (μmol/mL) | 8.94 ± 2.14 | 4.39 ± 1.17 ** |
| LPO (mmol/mL) | 3.25 ± 0.97 | 2.11 ± 0.64 * |
* At the level of p < 0.05, ** at the level of p < 0.01.
Table 6.
Results of immune indices.
| Immune Indices | Serum | |
|---|---|---|
| Se-Rich Habitat | Healthy Habitat | |
| IL-1β (ng/L) | 42.98 ± 7.64 ** | 104.91 ± 10.28 |
| IL-2 (ng/L) | 174.65 ± 19.97 ** | 255.41 ± 22.68 |
| IL-6 (ng/L) | 296.15 ± 38.17 ** | 502.96 ± 55.47 |
| TNF-α (ng/L) | 523.63 ± 55.41 ** | 711.47 ± 79.51 |
| IgA (g/L) | 048 ± 0.066 ** | 1.02 ± 0.19 |
| IgG (g/L) | 5.99 ± 0.64 ** | 9.07 ± 0.64 |
| IgM (g/L) | 3.35 ± 0.17 * | 4.11 ± 0.36 |
* At the level of p < 0.05, ** at the level of p < 0.01.
Table 7.
The differential proteins screened.
| Number | Proteins | Ratio |
|---|---|---|
| A0A452ED36 | B-cell receptor-associated protein | 0.180 |
| A0A452EAH6 | PDZ domain-containing protein | 0.273 |
| A0A452F8A2 | GYF domain-containing protein | 0.289 |
| A0A452FR97 | Phosphoglycerate mutase | 0.317 |
| A0A452E132 | Phosphoglycerate kinase | 0.336 |
| A0A452F4C8 | Exocyst complex component Sec8 | 0.346 |
| A0A452EWA3 | Non-specific serine/threonine protein kinase | 0.366 |
| A0A452E2F6 | Alpha-1-acid glycoprotein | 0.371 |
| A0A452EMX2 | Uncharacterized protein | 0.372 |
| A0A452FZ73 | Creatine kinase | 0.372 |
| A0A452EH63 | Fructose-bisphosphate aldolase | 0.457 |
| A0A452DZ49 | Uncharacterized protein | 0.479 |
| A0A452G1C7 | Uncharacterized protein | 0.494 |
| A0A452FNW6 | Glyceraldehyde-3-phosphate dehydrogenase | 0.519 |
| A0A452FAN0 | 2-phospho-D-glycerate hydrolyase | 0.530 |
| A0A452FHR5 | Uncharacterized protein | 0.533 |
| A0A452EQR9 | RRM domain-containing protein | 0.539 |
| A0A452ET10 | Uncharacterized protein | 0.555 |
| A0A452FHU9 | Uncharacterized protein | 0.562 |
| A0A452FIH4 | PITH-domain-containing protein | 0.563 |
| A0A452EBM8 | Chloride channel protein | 0.563 |
| A0A452DNM6 | Arp2/3 complex 34 kDa subunit | 0.596 |
| A0A452EB57 | Proteasome subunit beta | 0.597 |
| A0A452DSW4 | Amine oxidase | 0.601 |
| A0A452E3A4 | Uncharacterized protein | 0.617 |
| A0A452ET55 | Triosephosphate isomerase | 0.617 |
| A0A452EJV5 | SAM domain-containing protein | 0.635 |
| A0A452DX94 | Glutathione transferase | 0.645 |
| A0A452F6I3 | Uncharacterized protein | 0.653 |
| A0A452G3A7 | Uncharacterized protein | 1.512 |
| A0A452FXT0 | DZF-domain-containing protein | 1.525 |
| A0A452EVP1 | Apolipoprotein D | 1.532 |
| A0A452EUI8 | Apolipoprotein C-II | 1.635 |
| A0A452FF95 | Ig-like domain-containing protein | 1.638 |
| A0A452EI28 | Uncharacterized protein | 1.697 |
| A0A452F2V9 | V-type proton ATPase subunit C | 1.782 |
| A0A452FMH2 | Serum amyloid A protein | 1.852 |
| A0A452FTY4 | Serum amyloid A protein | 1.863 |
| A0A452EH87 | Ig-like domain-containing protein | 1.879 |
| A0A452DZA7 | Ig-like domain-containing protein | 2.012 |
| A0A452FQK6 | Uncharacterized protein | 2.075 |
| A0A452FM96 | Uncharacterized protein | 3.199 |
| A0A452DYK6 | LRRcap domain-containing protein | 5.170 |
| A0A452G5R6 | Haptoglobin | 5.198 |
Number: the number of the differential proteins; Proteins: the name of the differential proteins; Ratio: the expression ratio of the differential protein compared with the control group (healthy habitat).
Table 8.
The differential metabolites screened.
| Number | Metabolites | Ratio |
|---|---|---|
| M1136 | MFCD00133175 | 0.236674101 |
| M1131 | Methyl 3-hydroxypalmitate | 0.245912491 |
| M0096 | Pregabalin | 0.360438539 |
| M0217 | Vigabatrin | 0.405421635 |
| M0830 | N~6~,N~6~-Dimethyllysine | 0.462717965 |
| M0518 | L-Theanine | 0.505753644 |
| M0476 | Fasoracetam | 0.530718405 |
| M1143 | Coumarin | 0.584921507 |
| M0781 | Afegostat | 0.586163676 |
| M0279 | g-Butyrobetaine | 0.598788438 |
| M0333 | Acetanilide | 0.600654881 |
| M0456 | 235BBF3K97 | 0.602385586 |
| M0430 | N.pi.-Methyl-L-histidine | 0.654847868 |
| M0168 | Ricinoleic Acid | 0.352162448 |
| M0223 | Benzoic acid | 0.46156872 |
| M0124 | N~2~-Acetyl-L-ornithine | 0.515348311 |
| M0068 | Hydroxynorleucine | 0.589651438 |
| M0075 | 3-(3,4-dihydroxyphenyl)propanoic acid | 0.599884946 |
| M0216 | Allantoin | 0.624748837 |
| M0105 | N,N-dimethylarginine | 0.627098881 |
| M0113 | (2R)-2-Acetoxy-3-[(9Z)-9-octadecen-1-yloxy]propyl 2-(trimethylammonio)ethyl phosphate | 0.673983498 |
| M0121 | N6,N6,N6-Trimethyl-L-lysine | 0.802597421 |
| M0189 | Methyl palmitate | 0.820344187 |
| M0009 | PC | 1.240687574 |
| M0306 | Octadecanamine | 1.415271685 |
| M0019 | Bis(4-ethylbenzylidene)sorbitol | 1.432326828 |
| M0324 | Bis(2-ethylhexyl) amine | 1.441261393 |
| M0308 | Cinnamyl alcohol | 1.471295541 |
| M0341 | Autumnolide | 1.523646777 |
| M1020 | Umbelliferone | 1.075196303 |
| M0481 | Maraniol | 1.189934366 |
| M1275 | 1-hexadecanoyl-2-octadecanoyl-sn-glycero-3-phosphocholine | 1.373282197 |
| M0115 | Inspra | 1.527846994 |
| M1220 | Phaseic acid | 1.548361001 |
| M0339 | Propionylcarnitine | 1.756348021 |
| M0422 | 2-methylbutyrylcarnitine | 1.953783596 |
Number: the number of the differential metabolites; Metabolites: the name of the differential metabolites; Ratio: the expression ratio of the differential metabolite compared with the control group (healthy habitat).
Disclaimer/Publisher’s Note: The statements, opinions and data contained in all publications are solely those of the individual author(s) and contributor(s) and not of MDPI and/or the editor(s). MDPI and/or the editor(s) disclaim responsibility for any injury to people or property resulting from any ideas, methods, instructions or products referred to in the content. |
© 2023 by the authors. Licensee MDPI, Basel, Switzerland. This article is an open access article distributed under the terms and conditions of the Creative Commons Attribution (CC BY) license (https://creativecommons.org/licenses/by/4.0/).
Share and Cite
MDPI and ACS Style
Ren, H.; Zhou, P.; Shen, X. Abnormal Phenylalanine Metabolism of Procapra przewalskii in Chronic Selenosis in Selenium-Enriched Habitats. Metabolites 2023, 13, 982. https://0-doi-org.brum.beds.ac.uk/10.3390/metabo13090982
AMA Style
Ren H, Zhou P, Shen X. Abnormal Phenylalanine Metabolism of Procapra przewalskii in Chronic Selenosis in Selenium-Enriched Habitats. Metabolites. 2023; 13(9):982. https://0-doi-org.brum.beds.ac.uk/10.3390/metabo13090982
Chicago/Turabian StyleRen, Hong, Ping Zhou, and Xiaoyun Shen. 2023. "Abnormal Phenylalanine Metabolism of Procapra przewalskii in Chronic Selenosis in Selenium-Enriched Habitats" Metabolites 13, no. 9: 982. https://0-doi-org.brum.beds.ac.uk/10.3390/metabo13090982
Note that from the first issue of 2016, this journal uses article numbers instead of page numbers. See further details here.