Oxygraphy Versus Enzymology for the Biochemical Diagnosis of Primary Mitochondrial Disease


 , ,
, ,
Abstract
:
1. Introduction
2. Results
2.1. Patient Cohort
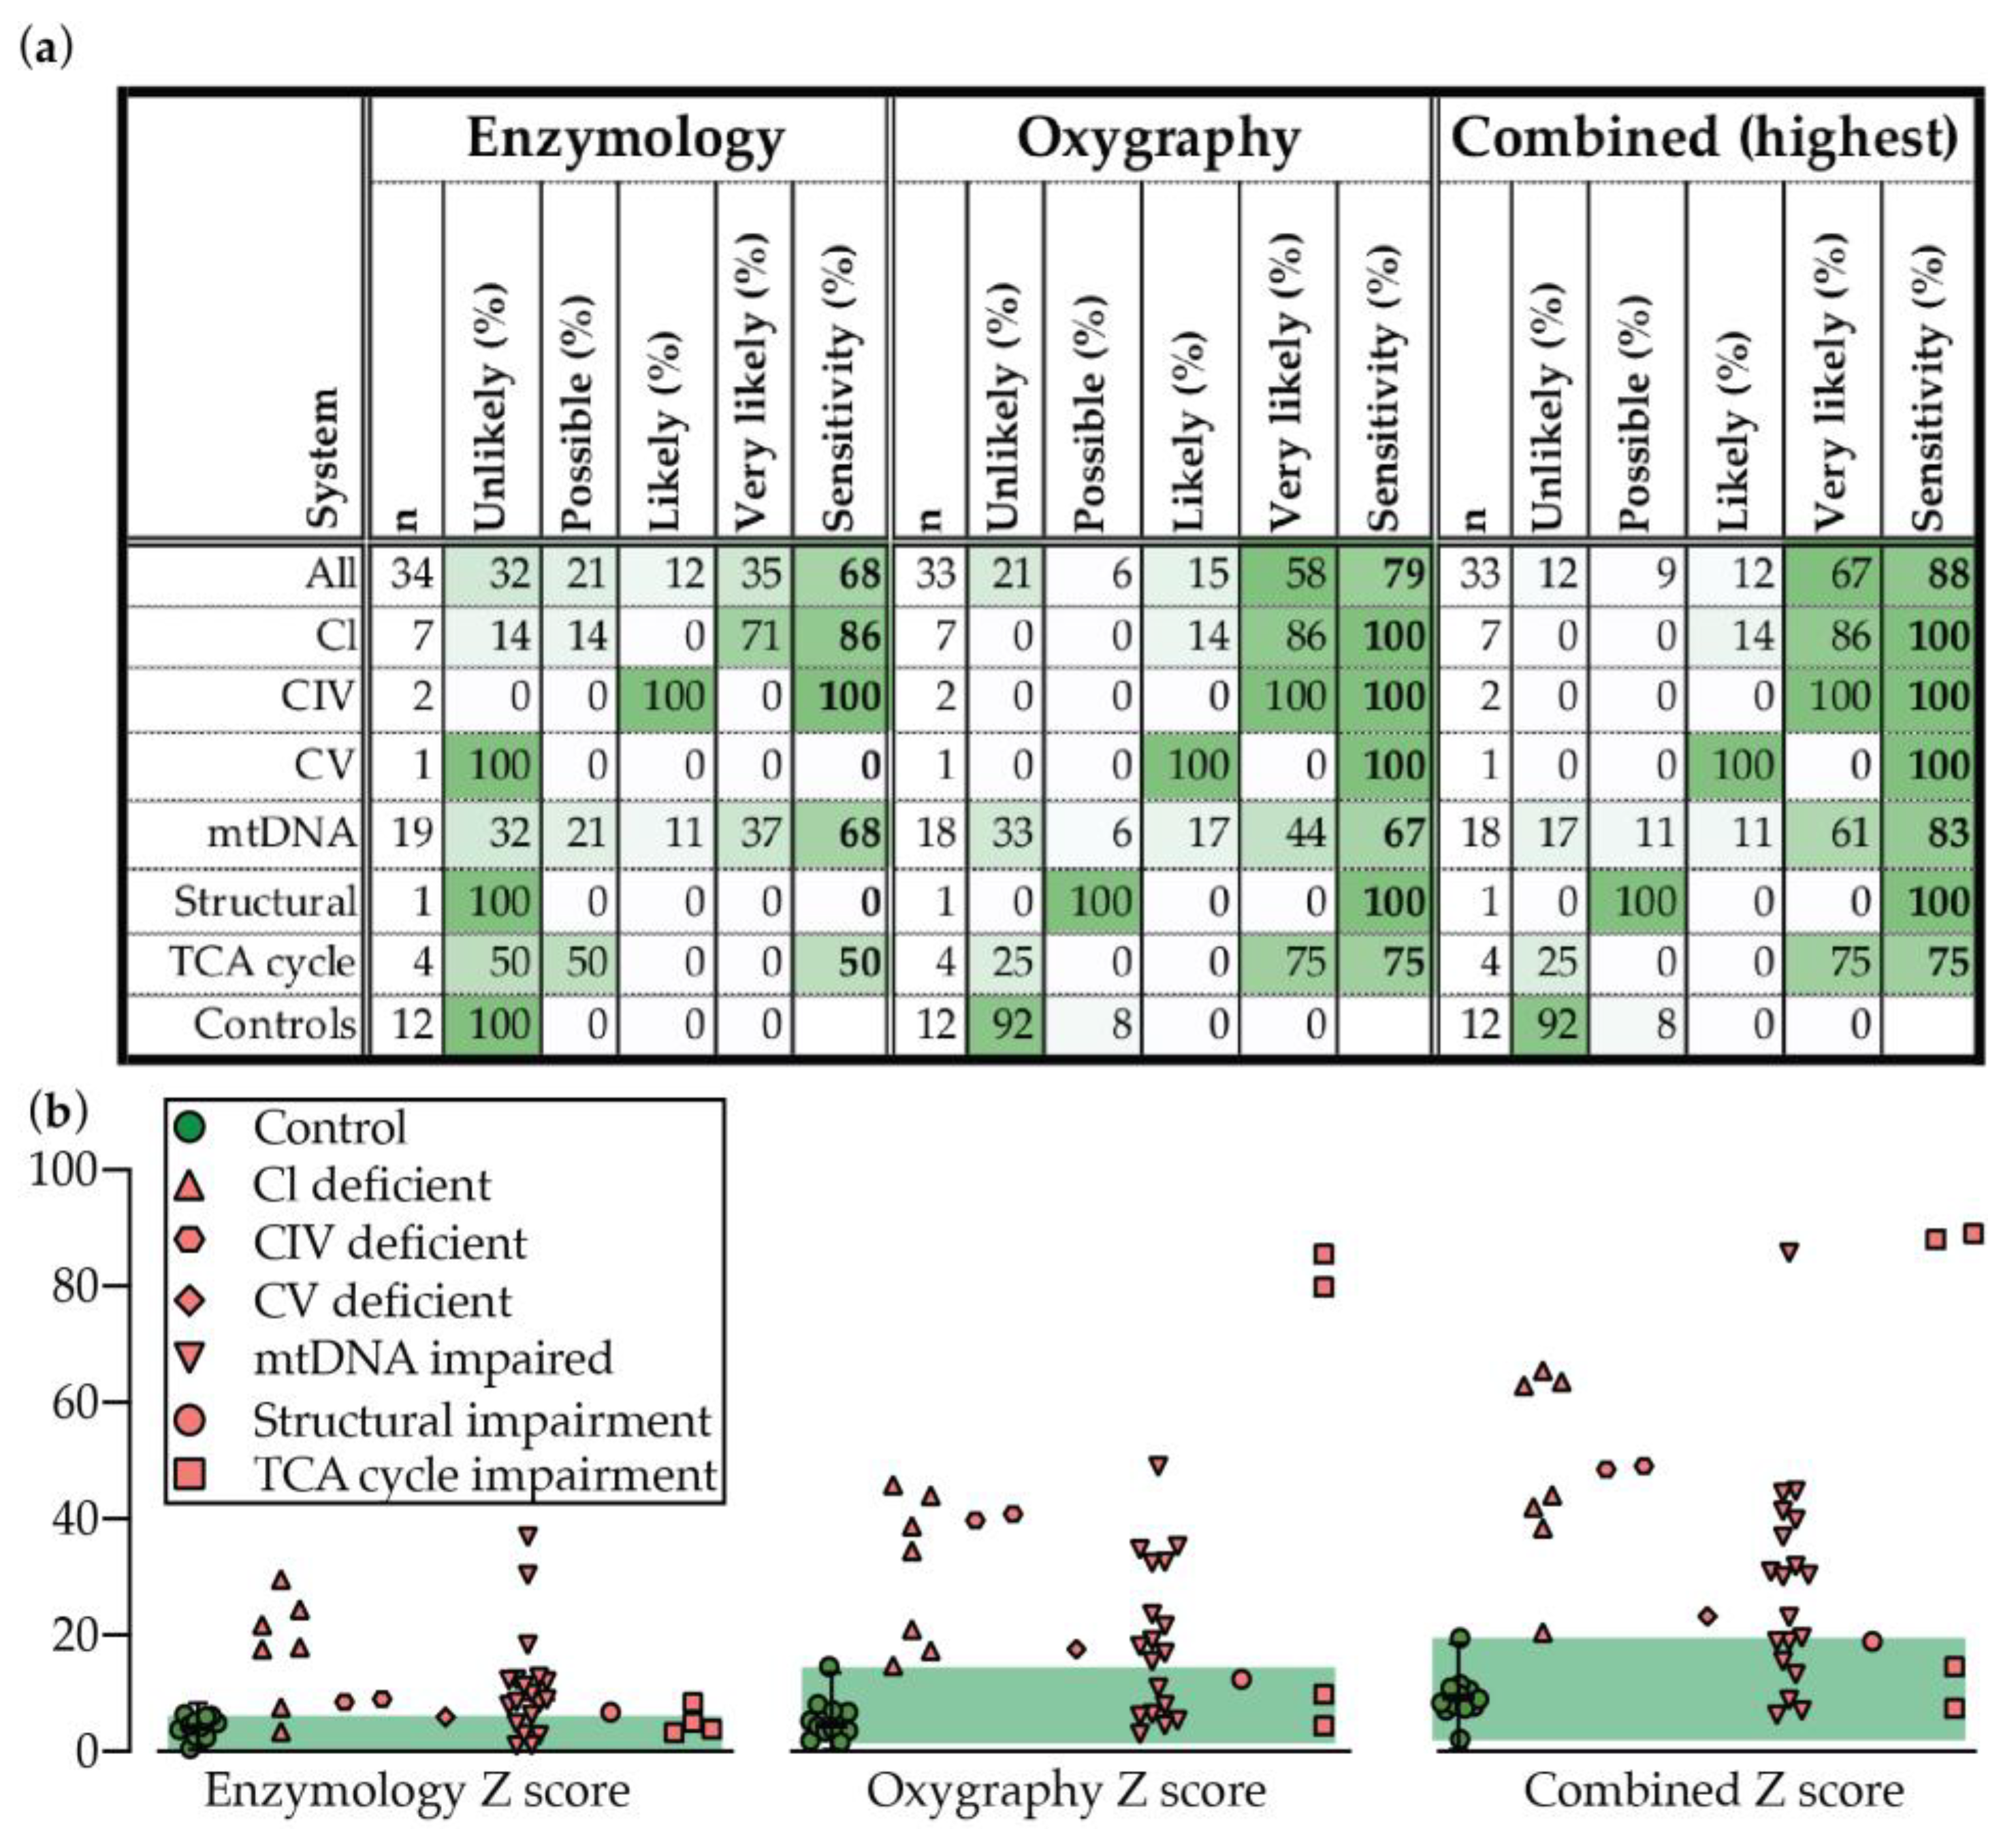
2.2. Enzymology
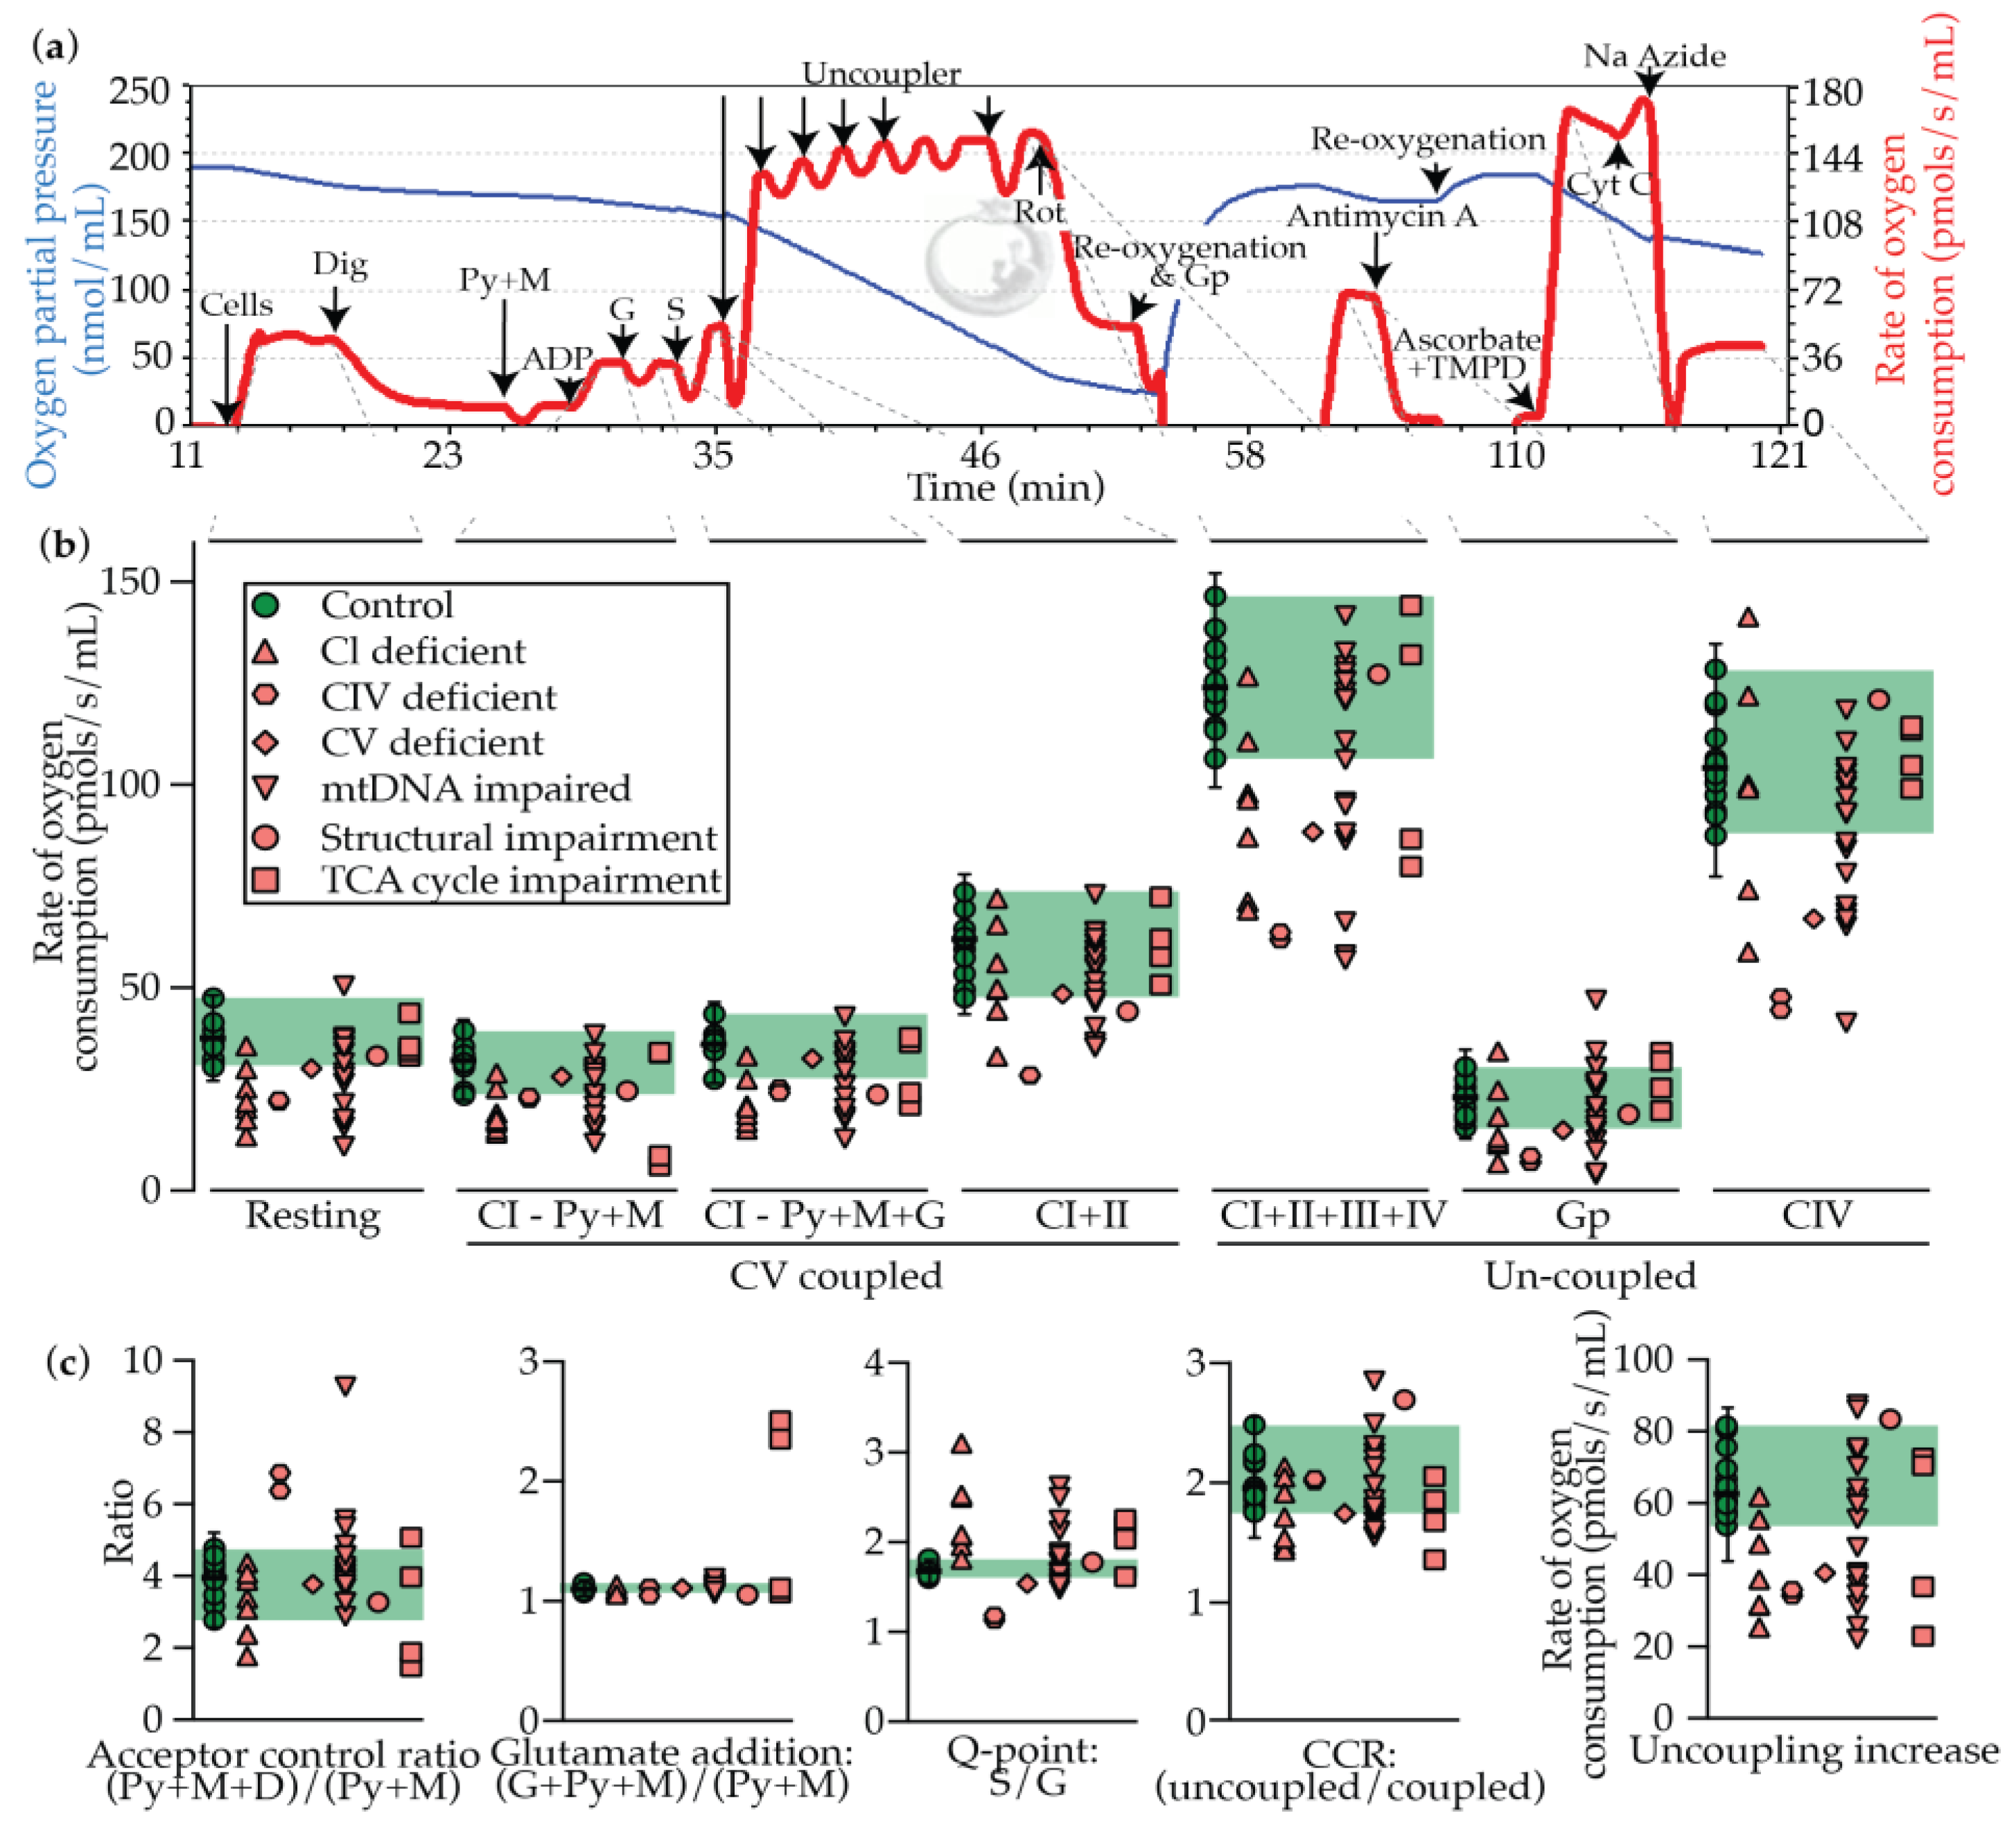
2.3. Oxygraphy
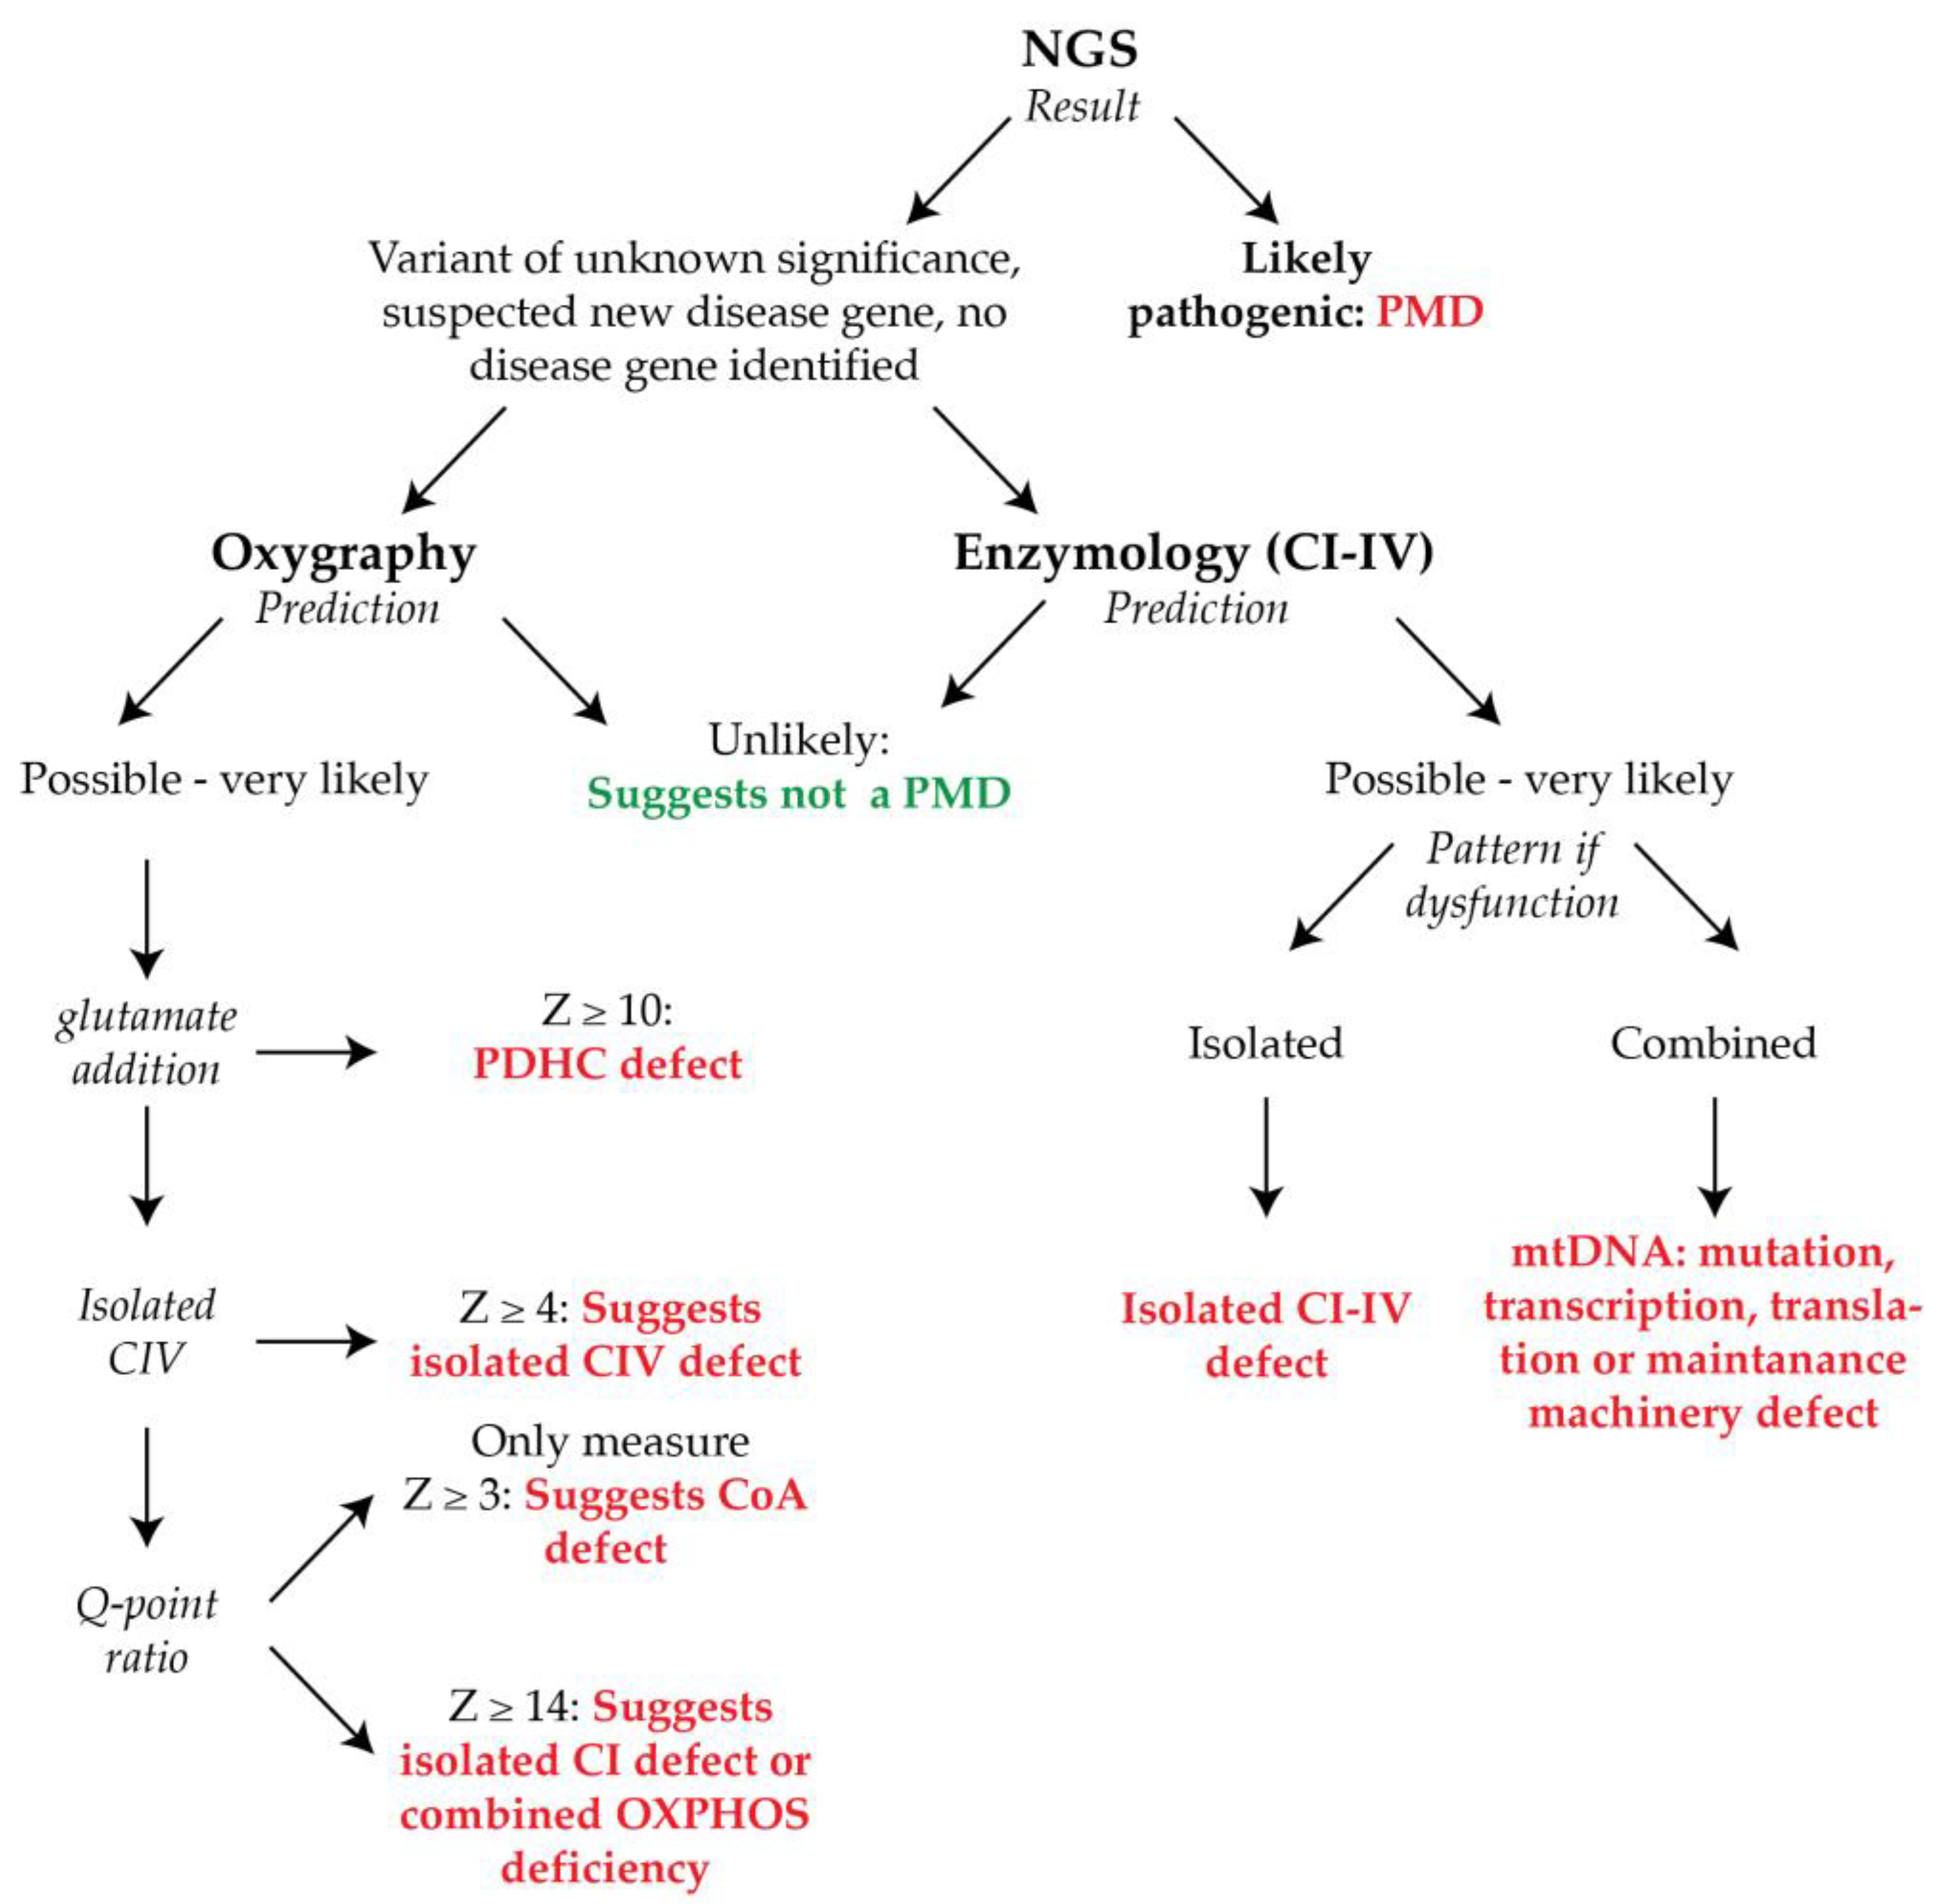
2.4. Oxygraphy versus Enzymology
3. Discussion
4. Materials and Methods
4.1. Ethics
4.2. Cell Culture
4.3. Enzymology
4.4. Oxygraphy
4.5. Reagents
4.6. Clinical Diagnostic Prediction Scoring
4.7. Diagnostic Prediction
4.8. Statistics
Supplementary Materials
Author Contributions
Funding
Acknowledgments
Conflicts of Interest
References
- Boengler, K.; Heusch, G.; Schulz, R. Nuclear-encoded mitochondrial proteins and their role in cardioprotection. Biochim. Biophys. Acta 2011, 1813, 1286–1294. [Google Scholar] [CrossRef] [PubMed] [Green Version]
- Calvo, S.E.; Mootha, V.K. The mitochondrial proteome and human disease. Annu. Rev. Genom. Hum. Genet. 2010, 11, 25–44. [Google Scholar] [CrossRef] [PubMed]
- Chinnery, P.F.; Hudson, G. Mitochondrial genetics. Br. Med. Bull. 2013, 106, 135–159. [Google Scholar] [CrossRef] [Green Version]
- Grier, J.; Hirano, M.; Karaa, A.; Shepard, E.; Thompson, J.L.P. Diagnostic odyssey of patients with mitochondrial disease: Results of a survey. Neurol. Genet. 2018, 4, e230. [Google Scholar] [CrossRef] [PubMed]
- Alston, C.L.; Rocha, M.C.; Lax, N.Z.; Turnbull, D.M.; Taylor, R.W. The genetics and pathology of mitochondrial disease. J. Pathol. 2017, 241, 236–250. [Google Scholar] [CrossRef]
- Vockley, J.; Dobrowolski, S.F.; Arnolda, G.L.; Guerrero, R.B.; Derks, T.G.J.; Weinsteine, D.A. Complex patterns of inheritance, including synergistic heterozygosity, in inborn errors of metabolism: Implications for precision medicine driven diagnosis and treatment. Mol. Genet. Metab. 2019, in press. [Google Scholar] [CrossRef]
- Gorman, G.S.; Chinnery, P.F.; DiMauro, S.; Hirano, M.; Koga, Y.; McFarland, R.; Suomalainen, A.; Thorburn, D.R.; Zeviani, M.; Turnbull, D.M. Mitochondrial diseases. Nat. Rev. Dis. Primers 2016, 2, 16080. [Google Scholar] [CrossRef]
- Niyazov, D.M.; Kahler, S.G.; Frye, R.E. Primary Mitochondrial Disease and Secondary Mitochondrial Dysfunction: Importance of Distinction for Diagnosis and Treatment. Mol. Syndr. 2016, 7, 122–137. [Google Scholar] [CrossRef] [Green Version]
- Chretien, D.; Rustin, P.; Bourgeron, T.; Rotig, A.; Saudubray, J.M.; Munnich, A. Reference charts for respiratory chain activities in human tissues. Clin. Chim. Acta 1994, 228, 53–70. [Google Scholar] [CrossRef]
- Frazier, A.E.; Thorburn, D.R. Biochemical analyses of the electron transport chain complexes by spectrophotometry. Methods Mol. Biol. 2012, 837, 49–62. [Google Scholar] [CrossRef]
- Spinazzi, M.; Casarin, A.; Pertegato, V.; Salviati, L.; Angelini, C. Assessment of mitochondrial respiratory chain enzymatic activities on tissues and cultured cells. Nat. Protoc. 2012, 7, 1235–1246. [Google Scholar] [CrossRef] [PubMed]
- Rodenburg, R.J. Biochemical diagnosis of mitochondrial disorders. J. Inherit. Metab. Dis. 2011, 34, 283–292. [Google Scholar] [CrossRef] [PubMed]
- Rodenburg, R.J.; Schoonderwoerd, G.C.; Tiranti, V.; Taylor, R.W.; Rotig, A.; Valente, L.; Invernizzi, F.; Chretien, D.; He, L.; Backx, G.P.; et al. A multi-center comparison of diagnostic methods for the biochemical evaluation of suspected mitochondrial disorders. Mitochondrion 2013, 13, 36–43. [Google Scholar] [CrossRef] [PubMed] [Green Version]
- Gerbitz, K.D.; Obermaier-Kusser, B.; Zierz, S.; Pongratz, D.; Muller-Hocker, J.; Lestienne, P. Mitochondrial myopathies: Divergences of genetic deletions, biochemical defects and the clinical syndromes. J. Neurol. 1990, 237, 5–10. [Google Scholar] [CrossRef] [PubMed]
- Rustin, P.; Chretien, D.; Bourgeron, T.; Gerard, B.; Rotig, A.; Saudubray, J.M.; Munnich, A. Biochemical and molecular investigations in respiratory chain deficiencies. Clin. Chim. Acta 1994, 228, 35–51. [Google Scholar] [CrossRef]
- Swalwell, H.; Kirby, D.M.; Blakely, E.L.; Mitchell, A.; Salemi, R.; Sugiana, C.; Compton, A.G.; Tucker, E.J.; Ke, B.X.; Lamont, P.J.; et al. Respiratory chain complex I deficiency caused by mitochondrial DNA mutations. Eur. J. Hum. Genet. 2011, 19, 769–775. [Google Scholar] [CrossRef] [Green Version]
- Janssen, A.J.; Smeitink, J.A.; van den Heuvel, L.P. Some practical aspects of providing a diagnostic service for respiratory chain defects. Ann. Clin. Biochem. 2003, 40, 3–8. [Google Scholar] [CrossRef] [Green Version]
- Gorman, G.S.; Schaefer, A.M.; Ng, Y.; Gomez, N.; Blakely, E.L.; Alston, C.L.; Feeney, C.; Horvath, R.; Yu-Wai-Man, P.; Chinnery, P.F.; et al. Prevalence of nuclear and mitochondrial DNA mutations related to adult mitochondrial disease. Ann. Neurol. 2015, 77, 753–759. [Google Scholar] [CrossRef] [Green Version]
- Milenkovic, D.; Blaza, J.N.; Larsson, N.G.; Hirst, J. The Enigma of the Respiratory Chain Supercomplex. Cell Metab. 2017, 25, 765–776. [Google Scholar] [CrossRef] [Green Version]
- Calvo, S.E.; Compton, A.G.; Hershman, S.G.; Lim, S.C.; Lieber, D.S.; Tucker, E.J.; Laskowski, A.; Garone, C.; Liu, S.; Jaffe, D.B.; et al. Molecular diagnosis of infantile mitochondrial disease with targeted next-generation sequencing. Sci. Transl. Med. 2012, 4, 118ra10. [Google Scholar] [CrossRef]
- Legati, A.; Reyes, A.; Nasca, A.; Invernizzi, F.; Lamantea, E.; Tiranti, V.; Garavaglia, B.; Lamperti, C.; Ardissone, A.; Moroni, I.; et al. New genes and pathomechanisms in mitochondrial disorders unraveled by NGS technologies. Biochim. Biophys. Acta 2016, 1857, 1326–1335. [Google Scholar] [CrossRef] [PubMed]
- Farre, R.; Almendros, I.; Montserrat, J.M.; Gozal, D.; Navajas, D. Gas Partial Pressure in Cultured Cells: Patho-Physiological Importance and Methodological Approaches. Front. Physiol. 2018, 9, 1803. [Google Scholar] [CrossRef] [PubMed]
- Radenkovic, S.; Bird, M.J.; Emmerzaal, T.L.; Wong, S.Y.; Felgueira, C.; Stiers, K.M.; Sabbagh, L.; Himmelreich, N.; Poschet, G.; Windmolders, P.; et al. The Metabolic Map into the Pathomechanism and Treatment of PGM1-CDG. Am. J. Hum. Genet. 2019, 104, 835–846. [Google Scholar] [CrossRef] [PubMed] [Green Version]
- Ye, F.; Hoppel, C.L. Measuring oxidative phosphorylation in human skin fibroblasts. Anal. Biochem. 2013, 437, 52–58. [Google Scholar] [CrossRef] [PubMed]
- Witters, P.; Saada, A.; Honzik, T.; Tesarova, M.; Kleinle, S.; Horvath, R.; Goldstein, A.; Morava, E. Revisiting mitochondrial diagnostic criteria in the new era of genomics. Genet. Med. 2018, 20, 444–451. [Google Scholar] [CrossRef] [PubMed] [Green Version]
- Metsalu, T.; Vilo, J. ClustVis: A web tool for visualizing clustering of multivariate data using Principal Component Analysis and heatmap. Nucleic Acids Res. 2015, 43, W566–W570. [Google Scholar] [CrossRef]


| Identifier # | Gene | Mutation | System | Gender | Disease | Symptoms | Age of Onset (years) | Current Age (years) | Age at Death (years) | Diagnostic Score (/8, see Table S1) |
|---|---|---|---|---|---|---|---|---|---|---|
| 45 | TMEM126B | c.401het_delA (p.134N>IIefs*2), c.635G>T (p.212G>V) | Cl | M | Myopathy | 11 | 40 | 6 | ||
| 30 | ACAD9 | c.976G>C (p.326A>T), c.1552C> T (p.518R>C) | Cl | F | Hypertrophic cardiomyopathy | HCM | 2 | 8 | 6 | |
| 33 | MT-ND1 | mtDNA.3481G>A (p.59E>K) | Cl | F | GDD, cardiomyopathy, lactic acidosis | 0 | 2 | 8 | ||
| 48 | ND6 | mtDNA.14487T>C (p.63E*) | Cl | M | Acute vision loss, progressive myoclonic epilepsy with extrapyramidal syndrome and psychosis | 19 | 43 | 7 | ||
| 2737 | NDUFS1 | c.1057G>C (p.353A>P), c.420+2T>C (splice site mutation) | Cl | M | Leigh syndrome | GDD, neurocognitive regression | 2 | 3 | 8 | |
| 2736 | NDUFS2 | Homozygous: c.1336G>A (p.446D>N) | Cl | F | Leigh syndrome | Necrotic encephalopathy after vaccination | 0 | 0 | 6 | |
| 2497 | NDUFA13 AND PGM1 | NDUFA13, homozygous: c.170G>A(p.57R>H), PGM1, homozygous: c.1108A>T (p.370K*) | CI | F | Leigh syndrome/CDG | Deafness, GDD, spastic dystonic quadriplegia, epilepsy | 0.5 | 17 | 8 | |
| 52 | SURF1 | c.312del10 insAT (p.fs*), c.544 GT>CA (p.182V>H) | CIV | F | Leigh syndrome | Ataxia, myopathy, respiratory insufficiency | 1 | 8 | 8 | |
| 55 | SURF1 | c.845-856del (p.282S>Cfs*), c.870insA (p.292K>E) | CIV | F | Leigh syndrome | Ataxia, dystrophy, FTT, renal tubular acidosis | 2 | 3 | 8 | |
| 2264 | MT-ATP6 | mtDNA.8993T>G (p.156L>R) | CV | M | Infantile NARP | GDD, ataxia, epilepsy, dystrophy | 1 | 19 | 8 | |
| 47 | AGK | c.409C>T (p.137R>X), c.1131+5G>A (splice site exon 15) | Com OXPHOS | M | Sengers syndrome | Congenital cataract, HCM, myopathy | 0 | 23 | 8 | |
| 34 | EARS2 | c.286G>A (p.96Q>K), c.500G>A (p.167C>Y) | Com OXPHOS | M | LTBL | GDD | 1 | 12 | 7 | |
| 43 | MRPL44 | ND | Com OXPHOS | M | Myopathy, cardiomyopathy, encephalopathy with epilepsy | 1 | 33 | 5 | ||
| 42 | Large mtDNA deletion | mtDNA.12113_14421del2309 | Com OXPHOS | F | Kearns-sayre | Bilateral ptosis, scoliosis, myopathy, ophtalmoplegia | 16 | 63 | 2 | |
| 41 | Large mtDNA deletion | mtDNA.8937_14422del | Com OXPHOS | F | PEO+ | Ptosis, PEO, dysphagia, myopathy | 12 | 63 | 6 | |
| 50 | MT-TD | mtDNA.7526A>G | Com OXPHOS | F | Myopathy, migraine | 9 | 36 | 6 | ||
| 36 | MT-TE | mtDNA.14674T>G | Com OXPHOS | F | GDD, metabolic decompensations, CKD | 0 | 15 | 4 | ||
| 57 | MT-TE | mtDNA.14709T>C | Com OXPHOS | F | Hypotonia, GDD, DM | 0 | 14 | 7 | ||
| 58 | MT-TL1 | mtDNA.3291T>C | Com OXPHOS | F | Myopathy, respiratory failure (on ventilation), DM, CKD , HCM | 41 | 73 | 4 | ||
| 123 | MT-TL1 | mtDNA.3261A>G | Com OXPHOS | F | Myopathy, exercice intolerance, lactic acidosis, sudden death during respiratory infection at home | 1 | 33 | 7 | ||
| 53 | MT-TL1 | mtDNA.3243A>G | Com OXPHOS | M | MELAS | Cardiopathy, DM, deafness, frontal syndrome, myopathy, ophthalmoplegia | 41 | 61 | 8 | |
| 54 | MT-TL1 | mtDNA.3243A>G | Com OXPHOS | F | MELAS | Exercice intolerance, lactic acidosis, epilepsy | 10 | 35 | 6 | |
| 72 | MT-TL1 | mtDNA.3243A>G | Com OXPHOS | M | MELAS | DM, epilepsy, pseudo-strokes, deafness | 30 | 42 | 8 | |
| 40 | MT-TL1 | mtDNA.3243A>G | Com OXPHOS | F | MELAS | DM, deafness, HCM, weight loss, CKD, biliary cysts | 40 | 72 | 4 | |
| 51 | MT-TN | mtDNA.5728A>G | Com OXPHOS | M | Growth hormone deficiency, CKD, GDD, epilepsy, myopathy | 2.3 | 17 | 8 | ||
| 124 | TWNK | Heterozygous c.1358G>C (p.453R>P), WT | Com OXPHOS | M | PEO+ | Myopathy with external ophtalmoplegia | 42 | 55 | 3 | |
| 35 | POLG | c.1402A>G(p.468N>D), WT | Com OXPHOS | F | Alpers | Liver fibrosis, ataxia, spastic hemiparesis | 38 | 58 | 7 | |
| 38 | POLG | c.1399G>A (p.467A>T), c.2542G>A (P.848G>S) | Com OXPHOS | F | Alpers | NALF, refractory epilepsy | 1 | 1.5 | 7 | |
| 120 | POLG | c.1252T>G (p.418C>G), WT | Com OXPHOS | M | Myopathy | 56 | 81 | 3 | ||
| 59 | ATAD3 | c.1582C>T (p.528R>W), WT | Structural | F | GDD, Spastic dystonic quadriplegia, morphea | 1 | 7 | 6 | ||
| 2130 | PDHA1 | c.904C>T (302R>C), WT | TCA cycle | F | GDD, spastic dystonic quadriplegia, epilepsy | 0.6 | 40 | 6 | ||
| 31 | PDHA1 | c.523G>A (p.175A>T), WT | TCA cycle | F | Deafness, infantile spasms, GDD | 0 | 6 | 8 | ||
| 128 | SLC25A42 | Homozygous c.309C>G (p.103Y>X) | TCA cycle | M | Myopathy, acidocetosis | 9 | 28 | 7 | ||
| 2738 | SLC25A42 | Homozygous c.871A>G (p. 291N>D) | TCA cycle | M | GDD, lactic acidosis, severe spastic quadriplegia, dysarthria, severe kyphosis, epilepsy | <5 | 30 | 6 |
| Identifier # | Gene | System | Rates of Enzymes Activity and Ratios to CS | Z Scores | Disease prediction | |||||||||||||||||||
|---|---|---|---|---|---|---|---|---|---|---|---|---|---|---|---|---|---|---|---|---|---|---|---|---|
| CS (nmol/min/mg) | CI (⎢nmol/min/mg⎢) | Rotenone sens (%) | CII (⎢nmol/min/mg⎢) | CIII (⎢/min/mg⎢) | CIV (⎢/min/mg⎢) | CI/CS | CII/CS | CIII/CS | CIV/CS | CS (nmol/min/mg) | CI (⎢nmol/min/mg⎢) | Rotenone sens (%) | CII (⎢nmol/min/mg⎢) | CIII (⎢/min/mg⎢) | CIV (⎢/min/mg⎢) | CI/CS | CII/CS | CIII/CS | CIV/CS | Sum (+ Z only) | ||||
| 45 | TMEM126B | Cl | 143 | 27 | 42 | 69 | 29 | 2.6 | 0.19 | 0.48 | 0.20 | 0.018 | 1.7 | 5.2 | 8.4 | 1.9 | −0.3 | 1.6 | 3.3 | 1.5 | −1.3 | 0.5 | 24.2 | Very likely |
| 30 | ACAD9 | 157 | 84 | 67 | 110 | 57 | 3.7 | 0.54 | 0.70 | 0.37 | 0.024 | 1.4 | 2.3 | 1.8 | 0.9 | −3.8 | 0.8 | 0.3 | −0.6 | −4.7 | −0.3 | 7.4 | Possible | |
| 33 | MT-ND1 | 139 | 25 | 39 | 86 | 28 | 4.5 | 0.18 | 0.62 | 0.20 | 0.032 | 1.7 | 5.3 | 9.1 | 1.5 | −0.1 | 0.3 | 3.4 | 0.2 | −1.1 | −1.6 | 21.5 | Very likely | |
| 48 | ND6 | 221 | 176 | 80 | 108 | 26 | 5.1 | 0.80 | 0.49 | 0.12 | 0.023 | 0.1 | −2.5 | −1.6 | 0.9 | 0.1 | −0.2 | −1.9 | 1.5 | 0.6 | −0.2 | 3.2 | Unlikely | |
| 2737 | NDUFS1 | 247 | 42 | 41 | 280 | 24 | 8.4 | 0.17 | 1.14 | 0.10 | 0.034 | −0.5 | 4.4 | 8.6 | −3.6 | 0.3 | −2.5 | 3.5 | -4.8 | 1.0 | −1.9 | 17.7 | Very likely | |
| 2736 | NDUFS2 | 265 | 10 | 20 | 133 | 29 | 3.5 | 0.04 | 0.51 | 0.11 | 0.014 | −0.8 | 6.1 | 14.2 | 0.2 | −0.2 | 1.0 | 4.6 | 1.3 | 0.8 | 1.3 | 29.4 | Very likely | |
| 2497 | NDUFA13 AND PGM1 | 191 | 41 | 59 | 99 | 23 | 3.2 | 0.22 | 0.52 | 0.12 | 0.017 | 0.7 | 4.5 | 3.8 | 1.1 | 0.5 | 1.2 | 3.1 | 1.1 | 0.5 | 0.8 | 17.4 | Very likely | |
| 52 | SURF1 | CIV | 175 | 138 | 75 | 105 | 31 | 0.3 | 0.78 | 0.60 | 0.17 | 0.002 | 1.0 | −0.5 | −0.4 | 1.0 | −0.5 | 3.3 | −1.8 | 0.4 | −0.6 | 3.1 | 8.8 | Likely |
| 55 | SURF1 | 192 | 141 | 77 | 132 | 24 | 0.3 | 0.73 | 0.69 | 0.12 | 0.001 | 0.7 | −0.7 | −0.8 | 0.3 | 0.4 | 3.3 | −1.4 | −0.5 | 0.5 | 3.2 | 8.3 | Likely | |
| 2264 | MT-ATP6 | CV | 252 | 114 | 75 | 127 | 33 | 3.7 | 0.45 | 0.51 | 0.13 | 0.015 | −0.6 | 0.7 | −0.3 | 0.4 | −0.8 | 0.9 | 1.1 | 1.3 | 0.3 | 1.1 | 5.7 | Unlikely |
| 47 | AGK | mtDNA | 285 | 52 | 44 | 33 | 20 | 1.8 | 0.18 | 0.12 | 0.07 | 0.006 | −1.2 | 3.9 | 7.9 | 2.8 | 0.9 | 2.2 | 3.4 | 5.1 | 1.6 | 2.4 | 30.1 | Very likely |
| 34 | EARS2 | 200 | 98 | 75 | 107 | 29 | 2.4 | 0.49 | 0.53 | 0.15 | 0.012 | 0.5 | 1.6 | −0.4 | 0.9 | −0.3 | 1.8 | 0.7 | 1.0 | 0.0 | 1.5 | 8.0 | Possible | |
| 43 | MRPL44 | 186 | 88 | 68 | 101 | 25 | 1.6 | 0.47 | 0.54 | 0.13 | 0.009 | 0.8 | 2.1 | 1.5 | 1.1 | 0.3 | 2.4 | 0.9 | 0.9 | 0.2 | 2.0 | 12.1 | Very likely | |
| 42 | Large mtDNA deletion | 177 | 121 | 74 | 120 | 24 | 7.1 | 0.68 | 0.68 | 0.14 | 0.040 | 1.0 | 0.4 | −0.2 | 0.6 | 0.4 | −1.6 | −0.9 | −0.4 | 0.2 | −2.9 | 2.5 | Unlikely | |
| 41 | Large mtDNA deletion | 280 | 162 | 79 | 161 | 37 | 8.1 | 0.58 | 0.57 | 0.13 | 0.029 | −1.1 | −1.8 | −1.4 | −0.5 | −1.2 | −2.3 | 0.0 | 0.6 | 0.3 | −1.1 | 0.9 | Unlikely | |
| 50 | MT-TD | 215 | 83 | 65 | 143 | 32 | 2.4 | 0.39 | 0.67 | 0.15 | 0.011 | 0.2 | 2.3 | 2.2 | 0.0 | −0.6 | 1.8 | 1.6 | −0.3 | −0.1 | 1.6 | 9.7 | Likely | |
| 36 | MT-TE | 241 | 136 | 72 | 172 | 40 | 4.8 | 0.56 | 0.71 | 0.16 | 0.020 | −0.4 | −0.4 | 0.4 | −0.8 | −1.6 | 0.1 | 0.1 | −0.7 | −0.4 | 0.3 | 0.8 | Unlikely | |
| 57 | MT-TE | 249 | 107 | 71 | 85 | 25 | 2.7 | 0.43 | 0.34 | 0.10 | 0.011 | −0.5 | 1.1 | 0.7 | 1.5 | 0.2 | 1.6 | 1.3 | 2.9 | 0.9 | 1.7 | 11.8 | Very likely | |
| 58 | MT-TL1 | 300 | 142 | 76 | 147 | 22 | 3.0 | 0.47 | 0.49 | 0.07 | 0.010 | −1.5 | −0.7 | −0.5 | −0.1 | 0.6 | 1.4 | 0.9 | 1.4 | 1.5 | 1.8 | 7.7 | Possible | |
| 123 | MT-TL1 | 160 | 74 | 61 | 136 | 15 | 7.8 | 0.46 | 0.85 | 0.10 | 0.049 | 1.3 | 2.8 | 3.3 | 0.2 | 1.4 | −2.1 | 1.0 | −2.1 | 1.0 | −4.2 | 11.0 | Likely | |
| 53 | MT-TL1 | 115 | 76 | 65 | 143 | 25 | 3.0 | 0.66 | 1.24 | 0.22 | 0.026 | 2.2 | 2.7 | 2.2 | 0.0 | 0.2 | 1.4 | −0.7 | −5.8 | −1.6 | −0.7 | 8.7 | Possible | |
| 54 | MT-TL1 | 216 | 9 | 16 | 119 | 8 | 1.7 | 0.04 | 0.55 | 0.04 | 0.008 | 0.2 | 6.2 | 15.3 | 0.6 | 2.4 | 2.3 | 4.6 | 0.8 | 2.3 | 2.1 | 36.7 | Very likely | |
| 72 | MT-TL1 | 392 | 163 | 70 | 208 | 28 | 5.6 | 0.42 | 0.53 | 0.07 | 0.014 | −3.4 | −1.8 | 0.9 | −1.7 | −0.1 | −0.5 | 1.4 | 1.0 | 1.5 | 1.2 | 6.0 | Unlikely | |
| 40 | MT-TL1 | 286 | 70 | 60 | 93 | 29 | 2.8 | 0.24 | 0.32 | 0.10 | 0.010 | −1.3 | 3.0 | 3.6 | 1.3 | −0.2 | 1.5 | 2.9 | 3.0 | 0.9 | 1.9 | 18.1 | Very likely | |
| 51 | MT-TN | 179 | 90 | 70 | 100 | 20 | 1.9 | 0.50 | 0.56 | 0.11 | 0.010 | 0.9 | 2.0 | 1.0 | 1.1 | 0.9 | 2.2 | 0.6 | 0.8 | 0.7 | 1.8 | 12.0 | Very likely | |
| 124 | TWNK | 214 | 94 | 73 | 94 | 24 | 1.3 | 0.44 | 0.44 | 0.11 | 0.006 | 0.2 | 1.7 | 0.1 | 1.3 | 0.4 | 2.6 | 1.2 | 2.0 | 0.7 | 2.4 | 12.5 | Very likely | |
| 35 | POLG | 176 | 144 | 73 | 112 | 46 | 3.9 | 0.82 | 0.64 | 0.26 | 0.022 | 1.0 | −0.8 | 0.2 | 0.8 | −2.4 | 0.7 | −2.1 | 0.0 | −2.5 | −0.1 | 2.7 | Unlikely | |
| 38 | POLG | 191 | 123 | 84 | 110 | 19 | 4.6 | 0.64 | 0.58 | 0.10 | 0.024 | 0.7 | 0.2 | −2.6 | 0.8 | 1.0 | 0.2 | −0.6 | 0.6 | 0.9 | −0.4 | 4.5 | Unlikely | |
| 120 | POLG | 120 | 83 | 67 | 97 | 20 | 5.0 | 0.69 | 0.80 | 0.17 | 0.041 | 2.1 | 2.3 | 1.8 | 1.2 | 0.8 | -0.1 | −1.0 | −1.6 | −0.5 | −3.1 | 8.3 | Possible | |
| 59 | ATAD3 | Str | 156 | 101 | 67 | 109 | 26 | 3.6 | 0.66 | 0.71 | 0.18 | 0.023 | 1.4 | 1.4 | 1.7 | 0.9 | 0.1 | 0.9 | −0.7 | −0.7 | −0.8 | −0.3 | 6.5 | Unlikely |
| 2130 | PDHA1 | TCA cycle | 205 | 118 | 70 | 147 | 30 | 3.4 | 0.58 | 0.73 | 0.15 | 0.019 | 0.4 | 0.5 | 1.1 | -0.1 | -0.4 | 1.1 | 0.0 | −0.9 | 0.0 | 0.5 | 3.6 | Unlikely |
| 31 | PDHA1 | 147 | 85 | 71 | 111 | 26 | 2.3 | 0.58 | 0.75 | 0.18 | 0.016 | 1.6 | 2.2 | 0.7 | 0.8 | 0.2 | 1.8 | 0.0 | −1.1 | −0.6 | 0.9 | 8.2 | Possible | |
| 128 | SLC25A42 | 369 | 225 | 76 | 219 | 18 | 5.0 | 0.61 | 0.59 | 0.05 | 0.013 | −3.0 | −5.0 | −0.7 | −2.0 | 1.1 | −0.1 | −0.3 | 0.4 | 2.0 | 1.3 | 4.8 | Possible | |
| 2738 | SLC25A42 | 128 | 132 | 76 | 149 | 19 | 4.9 | 1.03 | 1.16 | 0.15 | 0.038 | 2.0 | −0.2 | −0.7 | −0.2 | 1.0 | 0.0 | −3.9 | −5.1 | 0.0 | −2.6 | 3.0 | Unlikely | |
| Median (+Z only) | Controls | 224 | 128 | 74 | 143 | 27 | 4.9 | 0.58 | 0.64 | 0.14 | 0.022 | 0.4 | 0.4 | 0.4 | 0.4 | 0.4 | 0.4 | 0.3 | 0.3 | 0.6 | 0.3 | 4.1 | 100% unlikely | |
| Min | 129 | 100 | 67 | 86 | 15 | 3.1 | 0.42 | 0.52 | 0.06 | 0.014 | −1.9 | −1.7 | −1.7 | −1.4 | −2.0 | −2.0 | −2.3 | −2.2 | −1.0 | −1.9 | 0.3 | |||
| Max | 318 | 160 | 80 | 195 | 43 | 7.6 | 0.84 | 0.87 | 0.19 | 0.034 | 1.9 | 1.4 | 1.7 | 1.5 | 1.5 | 1.3 | 1.4 | 1.2 | 1.8 | 1.2 | 6.1 | |||
| 1/4 percentile | 184 | 109 | 72 | 113 | 21 | 3.6 | 0.51 | 0.59 | 0.08 | 0.018 | −0.6 | −0.7 | −0.9 | −1.0 | −0.5 | −0.7 | −0.8 | −1.0 | −0.5 | −0.9 | 2.3 | |||
| 3/4 percentile | 253 | 142 | 77 | 182 | 31 | 5.9 | 0.67 | 0.74 | 0.17 | 0.027 | 0.8 | 1.0 | 0.6 | 0.8 | 0.8 | 0.9 | 0.6 | 0.5 | 1.3 | 0.6 | 5.6 | |||
| n | 12 | 12 | 12 | 11 | 12 | 12 | 12 | 11 | 12 | 12 | 12 | 12 | 12 | 11 | 12 | 12 | 12 | 11 | 12 | 12 | 12 | |||
| % Coefficient of variation | 22 | 15 | 5 | 27 | 30 | 28 | 20 | 16 | 33 | 30 | ||||||||||||||
| Shapiro-Wilk test (p=) | 0.98 | 0.95 | 0.98 | 0.89 | 0.96 | 0.94 | 0.96 | 0.95 | 0.91 | 0.95 | ||||||||||||||
| Kolmogorov-Smirnov test (p=) | >0.1 | >0.1 | >0.1 | >0.1 | >0.1 | >0.1 | >0.1 | >0.1 | >0.1 | >0.1 | ||||||||||||||

| Identifier # | Gene | System | Rates of Oxygen Consumption (pmols/s/mL) and Ratios | Z Scores | Disease prediction | |||||||||||||||||||||||
|---|---|---|---|---|---|---|---|---|---|---|---|---|---|---|---|---|---|---|---|---|---|---|---|---|---|---|---|---|
| Resting | P(CI - Py+M) | P(CI - Py+M+G) | P(CI+II) | E (CI+II+III+IV) | E(GP) | E(CIV) | Acceptor control ratio | Glutamate addition | Q-point: S/G | Coupling control ratio | Uncoupling increase | Resting | P(CI - Py+M) | P(CI - Py+M+G) | P(CI+II) | E (CI+II+III+IV) | E(GP) | E(CIV to As/TMPD) | Acceptor control ratio | Glutamate addition | Q-point: S/G | Coupling control ratio | Uncoupling increase | Sum (+ Z only) | ||||
| 45 | TMEM126B | Cl | 18 | 18 | 21 | 57 | 88 | 7 | 100 | 3.0 | 1.05 | 2.5 | 1.5 | 31 | 4.3 | 3.4 | 3.4 | 0.8 | 3.2 | −3.4 | 0.4 | 1.5 | 1.4 | 14.9 | 1.9 | 3.3 | 38 | Very likely |
| 30.0 | ACAD9 | 14 | 15 | 16 | 34 | 72 | 12 | 59 | 3.8 | 1.07 | 1.9 | 2.0 | 38 | 5.2 | 4.2 | 4.6 | 3.8 | 4.6 | −2.4 | 3.6 | 0.2 | 0.7 | 5.0 | −0.4 | 2.6 | 34 | Very likely | |
| 33 | MT-ND1 | 21 | 16 | 17 | 45 | 70 | 13 | 100 | 1.7 | 1.09 | 2.5 | 1.5 | 25 | 3.7 | 4.0 | 4.2 | 2.3 | 4.7 | −2.2 | 0.4 | 3.8 | 0.0 | 14.5 | 2.2 | 4.0 | 44 | Very likely | |
| 48 | ND6 | 26 | 26 | 28 | 50 | 98 | 14 | 75 | 4.3 | 1.09 | 1.8 | 1.9 | 48 | 2.6 | 1.6 | 1.8 | 1.6 | 2.3 | −2.0 | 2.4 | 0.7 | 0.1 | 2.4 | 0.2 | 1.5 | 17 | Likely | |
| 2737 | NDUFS1 | 22 | 17 | 19 | 66 | 97 | 25 | 101 | 3.3 | 1.09 | 3.1 | 1.4 | 31 | 3.4 | 3.6 | 3.8 | −0.5 | 2.4 | 0.4 | 0.3 | 1.1 | 0.1 | 25.0 | 2.3 | 3.3 | 46 | Very likely | |
| 2736 | NDUFS2 | 36 | 30 | 34 | 73 | 127 | 35 | 142 | 4.0 | 1.12 | 2.1 | 1.7 | 55 | 0.3 | 0.7 | 0.5 | −1.3 | −0.3 | 2.4 | −3.0 | 0.2 | 1.4 | 7.2 | 1.1 | 0.8 | 15 | Very likely | |
| 2497 | NDUFA13 AND PGM1 | 30 | 20 | 21 | 50 | 111 | 19 | 122 | 2.3 | 1.08 | 2.0 | 2.1 | 61 | 1.6 | 3.1 | 3.3 | 1.7 | 1.1 | −1.0 | −1.4 | 2.8 | 0.2 | 7.0 | −0.8 | 0.1 | 21 | Very likely | |
| 52 | SURF1 | CIV | 22 | 23 | 26 | 29 | 62 | 7 | 48 | 6.3 | 1.10 | 1.1 | 2.0 | 34 | 3.3 | 2.2 | 2.3 | 4.4 | 5.3 | −3.3 | 4.5 | 4.2 | 0.7 | 9.5 | −0.3 | 3.0 | 39 | Very likely |
| 55 | SURF1 | 23 | 24 | 25 | 29 | 64 | 9 | 45 | 6.8 | 1.03 | 1.1 | 2.0 | 35 | 3.2 | 2.1 | 2.6 | 4.4 | 5.2 | −3.0 | 4.7 | 5.0 | 1.9 | 8.6 | −0.4 | 2.9 | 41 | Very likely | |
| 2264 | MT-ATP6 | CV | 31 | 29 | 33 | 49 | 89 | 15 | 68 | 3.7 | 1.10 | 1.5 | 1.7 | 40 | 1.5 | 0.9 | 0.7 | 1.8 | 3.1 | −1.7 | 2.9 | 0.3 | 0.4 | 2.4 | 1.0 | 2.4 | 17 | Likely |
| 47 | AGK | mtDNA | ND | |||||||||||||||||||||||||
| 34 | EARS2 | 35 | 39 | 43 | 64 | 124 | 31 | 93 | 5.5 | 1.10 | 1.4 | 1.9 | 59 | 0.7 | −1.5 | −1.6 | −0.2 | 0.1 | 1.5 | 0.9 | 2.7 | 0.6 | 3.5 | 0.4 | 0.3 | 11 | Possible | |
| 43 | MRPL44 | 27 | 23 | 27 | 64 | 111 | 31 | 94 | 3.2 | 1.13 | 2.6 | 1.7 | 47 | 2.3 | 2.1 | 2.1 | −0.2 | 1.1 | 1.6 | 0.9 | 1.3 | 1.5 | 16.6 | 1.3 | 1.6 | 32 | Very likely | |
| 42 | Large mtDNA deletion | 36 | 29 | 32 | 58 | 121 | 27 | 119 | 3.6 | 1.09 | 1.7 | 2.0 | 61 | 0.3 | 0.8 | 0.9 | 0.6 | 0.3 | 0.6 | −1.1 | 0.5 | 0.3 | 1.7 | −0.1 | 0.1 | 6 | Unlikely | |
| 41 | Large mtDNA deletion | 51 | 31 | 33 | 55 | 142 | 27 | 104 | 2.8 | 1.06 | 1.6 | 2.5 | 87 | −2.9 | 0.4 | 0.8 | 1.0 | −1.5 | 0.7 | 0.1 | 1.9 | 1.1 | 0.0 | −2.4 | −2.7 | 6 | Unlikely | |
| 50 | MT-TD | 16 | 16 | 18 | 36 | 67 | 27 | 42 | 4.5 | 1.10 | 1.8 | 1.7 | 31 | 4.7 | 3.9 | 4.0 | 3.5 | 5.0 | 0.7 | 5.0 | 1.0 | 0.4 | 2.1 | 1.0 | 3.3 | 35 | Very likely | |
| 36 | MT-TE | 37 | 30 | 34 | 56 | 130 | 26 | 100 | 4.1 | 1.14 | 1.6 | 2.3 | 74 | 0.1 | 0.6 | 0.5 | 0.8 | −0.5 | 0.5 | 0.3 | 0.2 | 1.9 | 0.3 | −1.4 | −1.3 | 5 | Unlikely | |
| 57 | MT-TE | 38 | 28 | 32 | 60 | 96 | 47 | 85 | 4.0 | 1.12 | 1.7 | 1.6 | 36 | 0.0 | 1.0 | 0.8 | 0.4 | 2.4 | 5.0 | 1.6 | 0.1 | 1.4 | 1.8 | 1.8 | 2.7 | 19 | Likely | |
| 58 | MT-TL1 | 38 | 30 | 34 | 73 | 128 | 35 | 102 | 3.6 | 1.13 | 2.1 | 1.7 | 55 | −0.2 | 0.5 | 0.5 | −1.4 | −0.3 | 2.3 | 0.2 | 0.5 | 1.5 | 7.9 | 1.0 | 0.7 | 15 | Very likely | |
| 123 | MT-TL1 | 30 | 31 | 33 | 52 | 122 | 20 | 98 | 3.9 | 1.05 | 1.6 | 2.3 | 70 | 1.7 | 0.3 | 0.8 | 1.4 | 0.2 | −0.7 | 0.6 | 0.0 | 1.3 | 1.3 | −1.6 | −0.8 | 8 | Unlikely | |
| 53 | MT-TL1 | 38 | 29 | 33 | 59 | 133 | 18 | 111 | 3.8 | 1.10 | 1.7 | 2.2 | 75 | 0.0 | 0.8 | 0.8 | 0.5 | −0.8 | −1.1 | −0.5 | 0.3 | 0.4 | 1.6 | −1.1 | −1.4 | 4 | Unlikely | |
| 54 | MT-TL1 | 11 | 12 | 13 | 37 | 59 | 4 | 66 | 4.5 | 1.06 | 2.5 | 1.7 | 25 | 5.7 | 4.8 | 5.1 | 3.3 | 5.7 | −4.0 | 3.1 | 0.9 | 0.7 | 14.5 | 1.0 | 3.9 | 49 | Very likely | |
| 72 | MT-TL1 | 18 | 17 | 19 | 47 | 87 | 13 | 79 | 4.8 | 1.11 | 2.2 | 1.8 | 40 | 4.3 | 3.8 | 3.8 | 2.1 | 3.2 | −2.2 | 2.0 | 1.6 | 1.0 | 10.0 | 0.8 | 2.3 | 35 | Very likely | |
| 40 | MT-TL1 | 29 | 24 | 26 | 50 | 89 | 10 | 69 | 3.7 | 1.07 | 1.9 | 1.8 | 39 | 2.0 | 1.9 | 2.2 | 1.7 | 3.1 | −2.7 | 2.8 | 0.4 | 0.4 | 3.7 | 0.7 | 2.5 | 21 | Very likely | |
| 51 | MT-TN | 32 | 30 | 35 | 61 | 95 | 21 | 71 | 4.2 | 1.18 | 1.7 | 1.6 | 34 | 1.2 | 0.7 | 0.3 | 0.1 | 2.5 | −0.4 | 2.7 | 0.4 | 3.4 | 1.8 | 1.8 | 3.0 | 18 | Likely | |
| 124 | TWNK | 38 | 34 | 37 | 63 | 126 | 27 | 105 | 3.2 | 1.08 | 1.6 | 2.0 | 64 | −0.1 | −0.5 | −0.3 | 0.0 | −0.2 | 0.8 | 0.0 | 1.3 | 0.2 | 0.5 | −0.1 | −0.2 | 3 | Unlikely | |
| 35 | POLG | 22 | 28 | 30 | 48 | 107 | 15 | 86 | 5.3 | 1.05 | 1.5 | 2.1 | 59 | 3.4 | 1.0 | 1.4 | 2.0 | 1.5 | −1.7 | 1.4 | 2.4 | 1.2 | 2.2 | −0.8 | 0.3 | 17 | Likely | |
| 38 | POLG | 18 | 21 | 24 | 36 | 57 | 5 | 67 | 4.5 | 1.11 | 1.5 | 1.6 | 21 | 4.2 | 2.6 | 2.8 | 3.5 | 5.8 | −3.8 | 2.9 | 0.9 | 0.9 | 2.6 | 1.6 | 4.3 | 32 | Very likely | |
| 120 | POLG | 36 | 19 | 21 | 41 | 126 | 17 | 94 | 9.2 | 1.07 | 1.8 | 2.9 | 86 | 0.4 | 3.1 | 3.4 | 2.9 | −0.1 | −1.4 | 0.9 | 9.2 | 0.5 | 3.1 | −4.1 | −2.5 | 23 | Very likely | |
| 59 | ATAD3 | Str | 34 | 25 | 24 | 45 | 128 | 19 | 122 | 3.2 | 1.04 | 1.7 | 2.7 | 83 | 0.8 | 1.7 | 2.7 | 2.3 | −0.3 | −0.9 | −1.4 | 1.2 | 1.6 | 1.8 | −3.4 | −2.3 | 12 | Possible |
| 2130 | PDHA1 | TCA cycle | 34 | 7 | 22 | 51 | 87 | 35 | 114 | 1.4 | 2.50 | 2.1 | 1.7 | 36 | 0.9 | 6.1 | 3.3 | 1.5 | 3.2 | 2.3 | −0.8 | 4.4 | 50.8 | 8.9 | 1.2 | 2.8 | 85 | Very likely |
| 31 | PDHA1 | 35 | 9 | 25 | 58 | 80 | 20 | 100 | 1.8 | 2.35 | 2.2 | 1.4 | 22 | 0.6 | 5.5 | 2.6 | 0.6 | 3.8 | -0.7 | 0.4 | 3.8 | 45.4 | 10.2 | 2.7 | 4.3 | 80 | Very likely | |
| 128 | SLC25A42 | 44 | 34 | 37 | 73 | 145 | 32 | 115 | 3.9 | 1.06 | 2.0 | 1.9 | 72 | −1.4 | −0.5 | −0.2 | −1.4 | −1.8 | 1.8 | −0.8 | 0.0 | 1.0 | 6.3 | 0.4 | −1.1 | 10 | Very likely | |
| 2738 | SLC25A42 | 36 | 35 | 38 | 63 | 133 | 26 | 105 | 5.0 | 1.10 | 1.6 | 2.1 | 70 | 0.4 | −0.5 | −0.5 | 0.0 | −0.7 | 0.5 | −0.1 | 1.8 | 0.4 | 1.1 | −0.5 | −0.9 | 4 | Unlikely | |
| Median (+Z only) | Controls | 38 | 32 | 36 | 63 | 124 | 23 | 104 | 3.9 | 1.09 | 1.6 | 2.0 | 62 | 0.3 | 0.4 | 0.4 | 0.5 | 0.3 | 0.4 | 0.3 | 0.7 | 0.8 | 0.7 | 0.2 | 0.2 | 5 | 92% unlikely, 8% possible | |
| Min | 31 | 24 | 28 | 48 | 107 | 16 | 88 | 2.7 | 1.06 | 1.6 | 1.8 | 53 | −2.3 | −1.8 | −1.8 | −1.5 | −1.9 | −1.6 | −2.0 | 0.1 | 0.0 | 0.1 | −2.4 | −2.0 | 1 | |||
| Max | 48 | 40 | 44 | 74 | 147 | 31 | 129 | 4.7 | 1.14 | 1.8 | 2.5 | 81 | 1.5 | 1.9 | 1.9 | 1.9 | 1.5 | 1.5 | 1.3 | 2.1 | 2.0 | 2.5 | 0.9 | 0.9 | 14 | |||
| 1/4 percentile | 34 | 31 | 35 | 55 | 116 | 19 | 95 | 3.5 | 1.07 | 1.6 | 1.9 | 58 | −0.5 | −0.4 | −0.3 | −0.3 | −0.8 | −0.9 | −1.1 | 0.2 | 0.4 | 0.1 | −1.2 | −1.3 | 3 | |||
| 3/4 percentile | 40 | 34 | 38 | 65 | 134 | 28 | 118 | 4.2 | 1.12 | 1.7 | 2.2 | 74 | 0.8 | 0.3 | 0.3 | 1.0 | 0.7 | 0.9 | 0.7 | 1.2 | 1.3 | 1.1 | 0.4 | 0.5 | 7 | |||
| n | 12 | 12 | 12 | 12 | 12 | 12 | 12 | 12 | 12 | 12 | 12 | 12 | 12 | 12 | 12 | 12 | 12 | 12 | 12 | 12 | 12 | 12 | 12 | 12 | 12 | |||
| % Coefficient of variation | 12 | 13 | 12 | 12 | 9 | 20 | 12 | 15 | 3 | 3 | 11 | 15 | ||||||||||||||||
| Shapiro-Wilk test (p=) | 0.56 | 0.23 | 0.16 | 0.80 | 1.00 | 0.82 | 0.78 | 0.60 | 0.16 | 0.32 | 0.34 | 0.18 | ||||||||||||||||
| Kolmogorov-Smirnov test (p=) | >0.1 | 0.05 | 0.05 | >0.1 | >0.1 | >0.1 | >0.1 | >0.1 | >0.1 | >0.1 | >0.1 | >0.1 | ||||||||||||||||
| State | Description | Region | Interpretation |
|---|---|---|---|
| Coupled respiration: refers to the intact nature of the ΔΨ, and is thus limited by the proton motive force from CV (P) | Resting | Cells only | Unstimulated state with no substrates or inhibitors, and therefore could be influenced by any OXPHOS complex or TCA cycle impairment |
| P(CI - Py+M) | As above + digitonin + pyruvate + malate + ADP | CI, III, IV, V and PDHC activity is limiting | |
| P(CI - Py+M+G) | As above + glutamate | CI, III, IV, V activity is limiting | |
| P(CI+II) | As above + succinate | CI, II, , III, IV, V activity is limiting | |
| Uncoupled respiration: respiration refers to the state in which the ΔΨ is abolished, and is thus limited by the electron transport chain (E, CI-CIV) | E (CI+II+III+IV) | As above + uncoupler | Maximal uncoupled rate, which should therefore be limited by CI-IV activity |
| E(GP) | (As above + glycerophosphate) - (as above) | Limited by glycerol-3-phosphate dehydrogenase (mGPDH) | |
| E(CIV) | (TMPD + Acorbate) - azide | Isolated rate of CIV activity | |
| Derived values | Acceptor control ratio | Influenced by the abundance of endogenous ADP, and is therefore an indicator of the charge ratio (ATP on ATP + ADP + AMP) | |
| Glutamate addition | P(CI - Py+M+G) P(CI - Py+M) | Indicates that pyruvate is limiting, pinpointing a PDHC deficiency | |
| Q-point: S/G | Limited by CI (high ratio) and CII (low ratio) | ||
| Coupling control ratio | E (CI+II+III+IV) P(CI+II) | A large increase would be expected to indicate impaired CV activity, while a smaller increase should indicate impaired CI-CIV activity | |
| Uncoupling increase | E (CI+II+III+IV) - P(CI+II) | As above |
| Unlikely | Possible | Likely | Very Likely | ||
|---|---|---|---|---|---|
| Enzmology | Individual Z | Z < 2 | Z ≥ 2 | Z ≥ 3 | Z ≥ 4 |
| Sum + Z only | Z < 7 | Z ≥ 7 | Z ≥ 9 | Z ≥ 11 | |
| Oxygraphy | Individual Z | Z < 3 | Z ≥ 3 | Z ≥ 4 | Z ≥ 5 |
| Sum + Z only | Z < 10 | Z ≥ 10 | Z ≥ 15 | Z ≥ 20 |
© 2019 by the authors. Licensee MDPI, Basel, Switzerland. This article is an open access article distributed under the terms and conditions of the Creative Commons Attribution (CC BY) license (http://creativecommons.org/licenses/by/4.0/).
Share and Cite
Bird, M.J.; Adant, I.; Windmolders, P.; Vander Elst, I.; Felgueira, C.; Altassan, R.; Gruenert, S.C.; Ghesquière, B.; Witters, P.; Cassiman, D.; et al. Oxygraphy Versus Enzymology for the Biochemical Diagnosis of Primary Mitochondrial Disease. Metabolites 2019, 9, 220. https://0-doi-org.brum.beds.ac.uk/10.3390/metabo9100220
Bird MJ, Adant I, Windmolders P, Vander Elst I, Felgueira C, Altassan R, Gruenert SC, Ghesquière B, Witters P, Cassiman D, et al. Oxygraphy Versus Enzymology for the Biochemical Diagnosis of Primary Mitochondrial Disease. Metabolites. 2019; 9(10):220. https://0-doi-org.brum.beds.ac.uk/10.3390/metabo9100220
Chicago/Turabian StyleBird, Matthew J, Isabelle Adant, Petra Windmolders, Ingrid Vander Elst, Catarina Felgueira, Ruqaiah Altassan, Sarah C Gruenert, Bart Ghesquière, Peter Witters, David Cassiman, and et al. 2019. "Oxygraphy Versus Enzymology for the Biochemical Diagnosis of Primary Mitochondrial Disease" Metabolites 9, no. 10: 220. https://0-doi-org.brum.beds.ac.uk/10.3390/metabo9100220