Photoionization of KCs Molecule: Origin of the Structured Continuum?
by
Goran Pichler
1,*, 
Robert Beuc
1,
Jahja Kokaj
2,
David Sarkisyan
3,
Nimmy Jose
2 and
Joseph Mathew
2 1
Institute of Physics, 10000 Zagreb, Croatia
2
Department of Physics, Kuwait University, P.O. Box 5969, Safat 13060, Kuwait
3
Institute for Physical Research, Armenian Academy of Science, Ashtarak 0203, Armenia
*
Author to whom correspondence should be addressed.
Atoms 2020, 8(2), 24; https://0-doi-org.brum.beds.ac.uk/10.3390/atoms8020024
Submission received: 30 April 2020
/
Revised: 22 May 2020
/
Accepted: 26 May 2020
/
Published: 28 May 2020
(This article belongs to the Special Issue Atomic and Ionic Collisions with Formation of Quasimolecules)
Abstract
:We report the experimental observation of photoionization bands of the KCs molecule in the deep ultraviolet spectral region between 200 and 420 nm. We discuss the origin of observed photoionization bands as stemming from the absorption from the ground state of the KCs molecule to the excited states of KCs+ molecule for which we used existing potential curves of the KCs+ molecule. An alternative explanation relies on the absorption from the ground state of the KCs molecule to the doubly excited states of the KCs** molecule, situated above the lowest molecular state of KCs+. The relevant potential curves of KCs** are not known yet, but all those KCs** potential curves are certainly autoionizing. However, these two photoionization pathways may interfere resulting in a special interference structured continuum, which is observed as complex bands.
1. Introduction
High-temperature alkali mixtures possessing high densities of constituents enable observation of the characteristic bands of mixed alkali molecules [1]. Heavy alkali heteronuclear molecules are interesting because they have a permanent dipole moment which enables many applications like orientation in an external electric field and quantum computing. Additionally, spectral transitions are relaxed because there are no gerade and ungerade symmetries in their quantum state description, as is the case in homonuclear dimers. As a polar molecule, the KCs molecule, with a permanent dipole moment of 1.92 Debye, has been extensively studied by several research groups using high-resolution spectroscopy techniques. The lower excited states with asymptotes at K(4s) + Cs(6p) and/or K(4p) + Cs(6s) were usually the goals of several groups [2,3]. Some of the KCs intermediate high excited states were also investigated [4,5], of which the E state has a shelf-like shape. Even the formation of ultracold polar ground state KCs molecules via an optical process has been discussed in [6]. Much higher excited states and, especially, Rydberg molecular states have been much less studied.
The structured photoionization continuum was first observed by Marr and Creek [7] with the conclusion that molecular photoionization is behind the process. Later, Hotop and Niemax [8,9,10] interpreted observed bands as atomic-pair absorption bands. The final resolution of the atomic or molecular nature of the problem of the observed structured bands within the photoionization continuum came from the time of flight (TOF) measurements by Suemitsu and Samson [11]. Recently, a structured photoionization continuum was studied by Pichler et al. [12], where the superheating of cesium vapor was used to reveal the molecular origin of the observed absorption bands. Quite recently, a structured photoionization continuum of Rb2 was measured at very high temperatures of up to 600 °C, which enabled the appreciable enhancement of the sought absorption bands [13]. This measurement confirmed the molecular origin of the observed rubidium absorption photoionization bands.
There are autoionizing [14] molecular doubly excited states (DES) above the ground molecular ion, such as Cs2** and Rb2** dimers, which have not yet been well investigated and are not fully supported by adequate quantum-mechanical calculations. The RbCs molecule in the visible spectrum has already been studied at high temperatures and densities in an all-sapphire cell [15] and the interpretation of some of the observed bands used existing potential curves [16].
In the present work, we undertook to study the structured photoionization continuum which appeared in the form of the absorption bands of the KCs molecule in the 220300 nm spectral interval. We adopt the conclusion of the previous works [7,11,12,13] that observed photoionization KCs bands are of molecular origin. For such a study, it was very important to use an all-sapphire cell which enabled measurements of absorption coefficient at very high temperatures and particle densities. Much of the observed visible spectra were previously interpreted with ab initio quantum-mechanical calculations using potential energy curves calculated by the Allouche and Korek group [17]. In the present study, we were mainly interested in searching for the autoionizing molecular states of KCs lying above the ground state of the molecular ion KCs+. Some of the related photoionization bands were initially studied by Hotop and Niemax almost 40 years ago in 1981, using a very sensitive thermionic diode filled with equal quantities of potassium and cesium. Unfortunately, some of the photoionizing KCs bands were hidden by Cs2 photoionizing bands [10]. We, therefore, used the mixture of K [80%] and of Cs [20%] which reduced Cs2 absorption and enabled clear observation of eight KCs photoionization bands in the spectral region 220–300 nm without disturbance from the presence of either Cs2 or K2 photoionization bands. We interpreted these bands as KCs ground state transitions to a) to excited states of the KCs+ molecule [18] or b) autoionizing doubly excited molecular states (DES) of a neutral KCs molecule lying above the first ionization limit (lowest molecular state of the KCs+ ion). We could not run the experiment to very high temperatures and densities because the presence of hot potassium atoms in the alkali mixture would destroy the special glue at the sapphire windows. We, therefore, measured those photoionization bands up to 600 °C, which was well above the suggested secure limit of about 450 °C. Higher temperatures and densities of KCs would be possible using a heat-pipe oven in which the windows are not in direct contact with aggressive alkali vapor.
2. Experimental Background
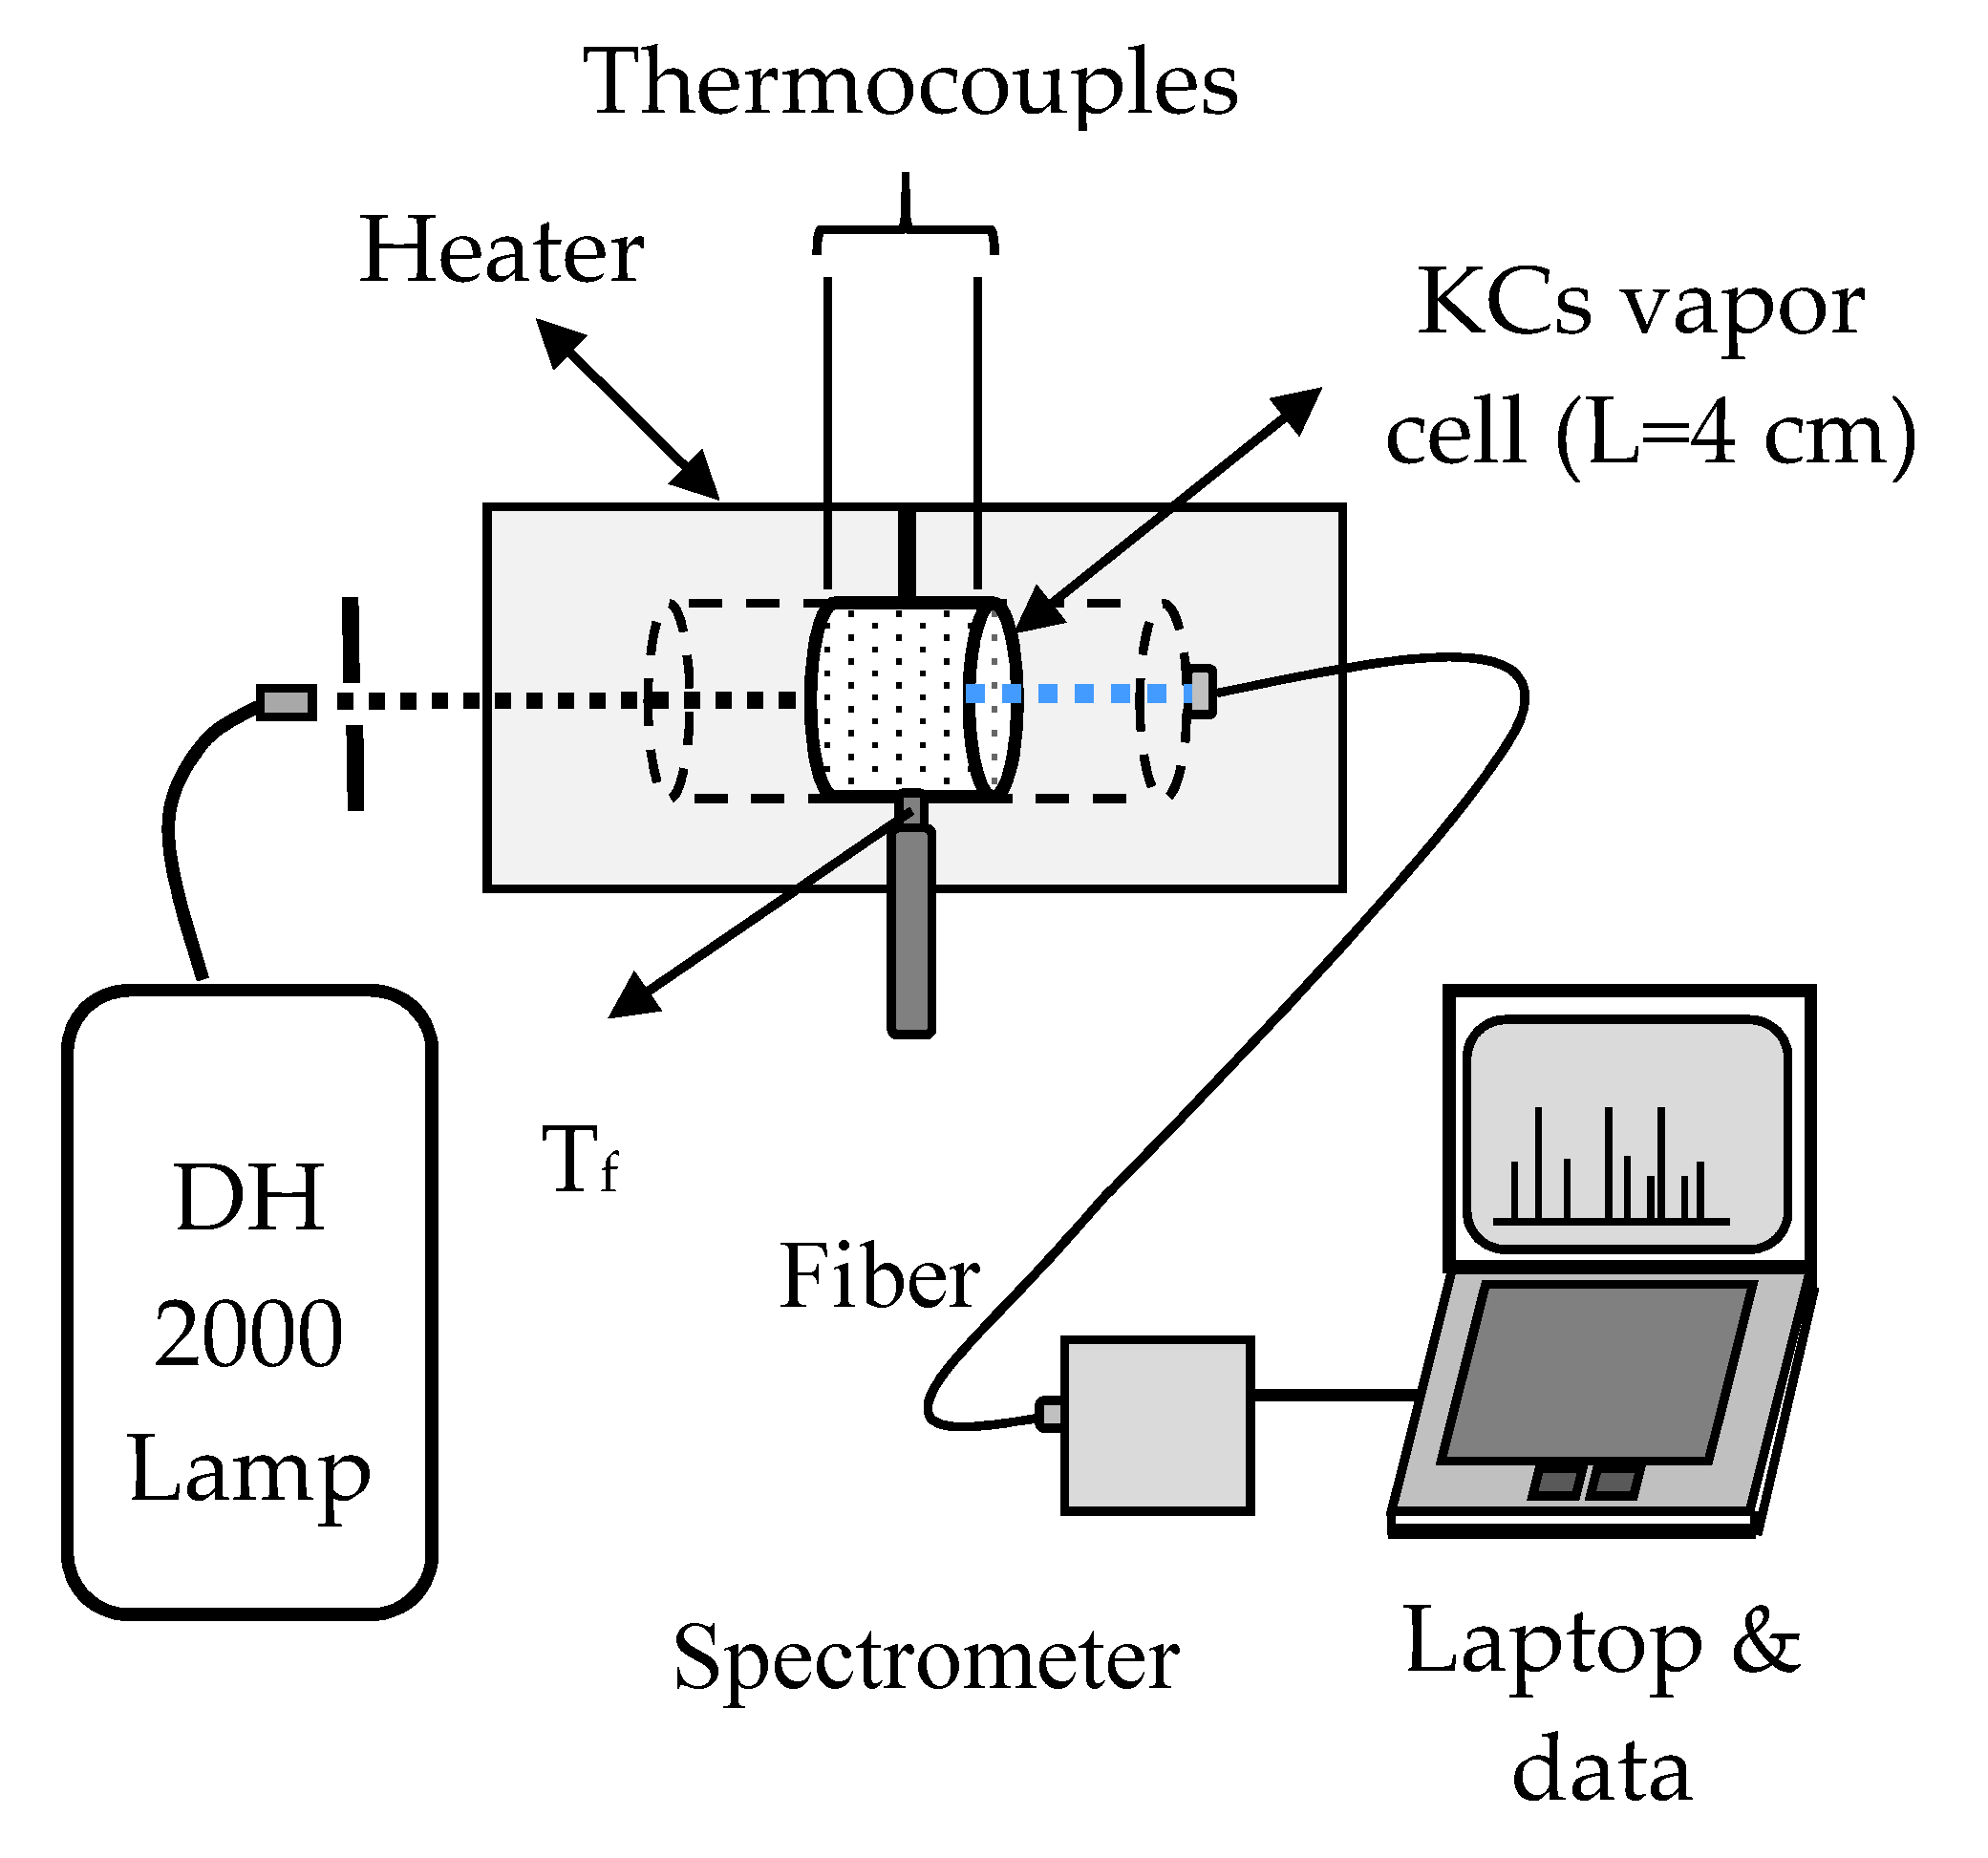
In our absorption experiment, the background lamp was a Deuterium lamp (Hamamatsu) and the spectrometer was OceanOptics USB4000 ES with enhanced sensitivity in the UV spectral region. A T-type all-sapphire cell (ASC), 4 cm in length and 1 cm in inner diameter, was used for the transmission measurements in the K-Cs mixture vapor. The concentration of these components could be determined approximately by the temperature at the tip of the side-arm finger (Tf) and the cell body (Tc). Tc was always kept higher than Tf by at least 30 °C to prevent condensation of the vapors on the inside surface of both sapphire windows. The optical axes of the cell windows were perpendicular to the plane of the windows to avoid birefringence. A special glass extension, a few mm in length, was attached to the sapphire side-arm to enable filling with the mixture. The temperature of the cell body should not usually exceed 450 °C. However, we managed up to Tf = 600 °C after the subsequent four weeks of daily measurements by slowly increasing the cell temperature without damaging the cell. All previous ASC cells were filled either with pure potassium or with K-Cs mixtures which could easily be damaged because of the aggressive action of hot potassium atoms on the special glue used in the construction of the ASC. The oven, in which the quartz tubes were wound round by nichrome wire, consisted of two parts. The temperature of the two parts of the oven was controlled by two Chromel-Alumel Thermocouples (CAT). A third CAT measured the temperature (Tf) near the top of the alkali metal mixture column in the finger (side-arm). At all times we avoided any mechanical strain and the temperatures were changed very slowly. The experimental setup is shown in Figure 1.
A spectrometer in Figure 1 is a special kind of small USB 4000 with enhanced UV option (OceanOptics, ES enhanced sensitivity). It enables large spectral regions to be measured at once for different high temperatures of the alkali mixture and with a low resolution of about 10 cm−1 or more exactly, 0.17nm/pixel. From the transmission spectrum, we obtained the spectrum of the absorption coefficient, k(λ), for all temperatures from Tf = 300 °C up to Tf = 600 °C using Beer-Lambert Law: k(λ) = 1/L ln(Io(λ)/I(λ)), where λ is a wavelength, L the length of the homogeneous vapor mixture in the cell, and Io(λ)/I(λ) is the ratio of the intensity at the entrance and the exit from the vapor in the cell.
3. Results
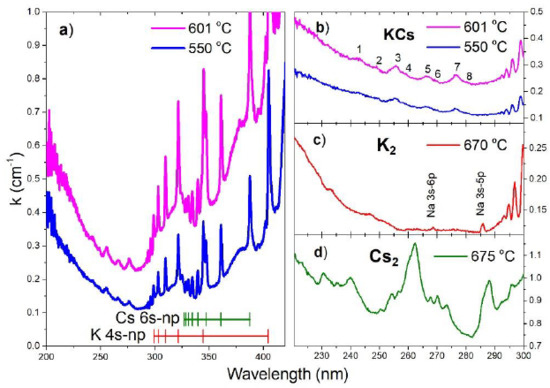
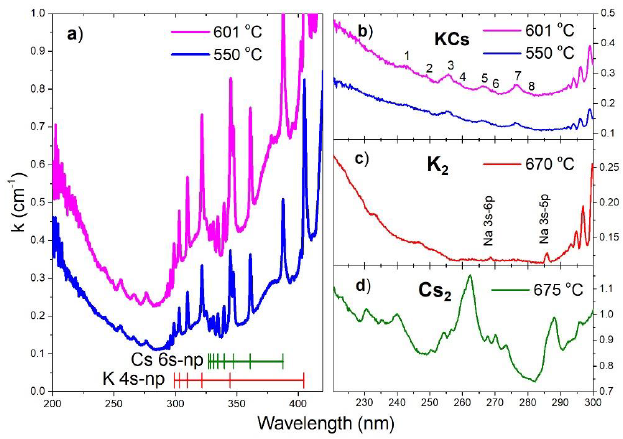
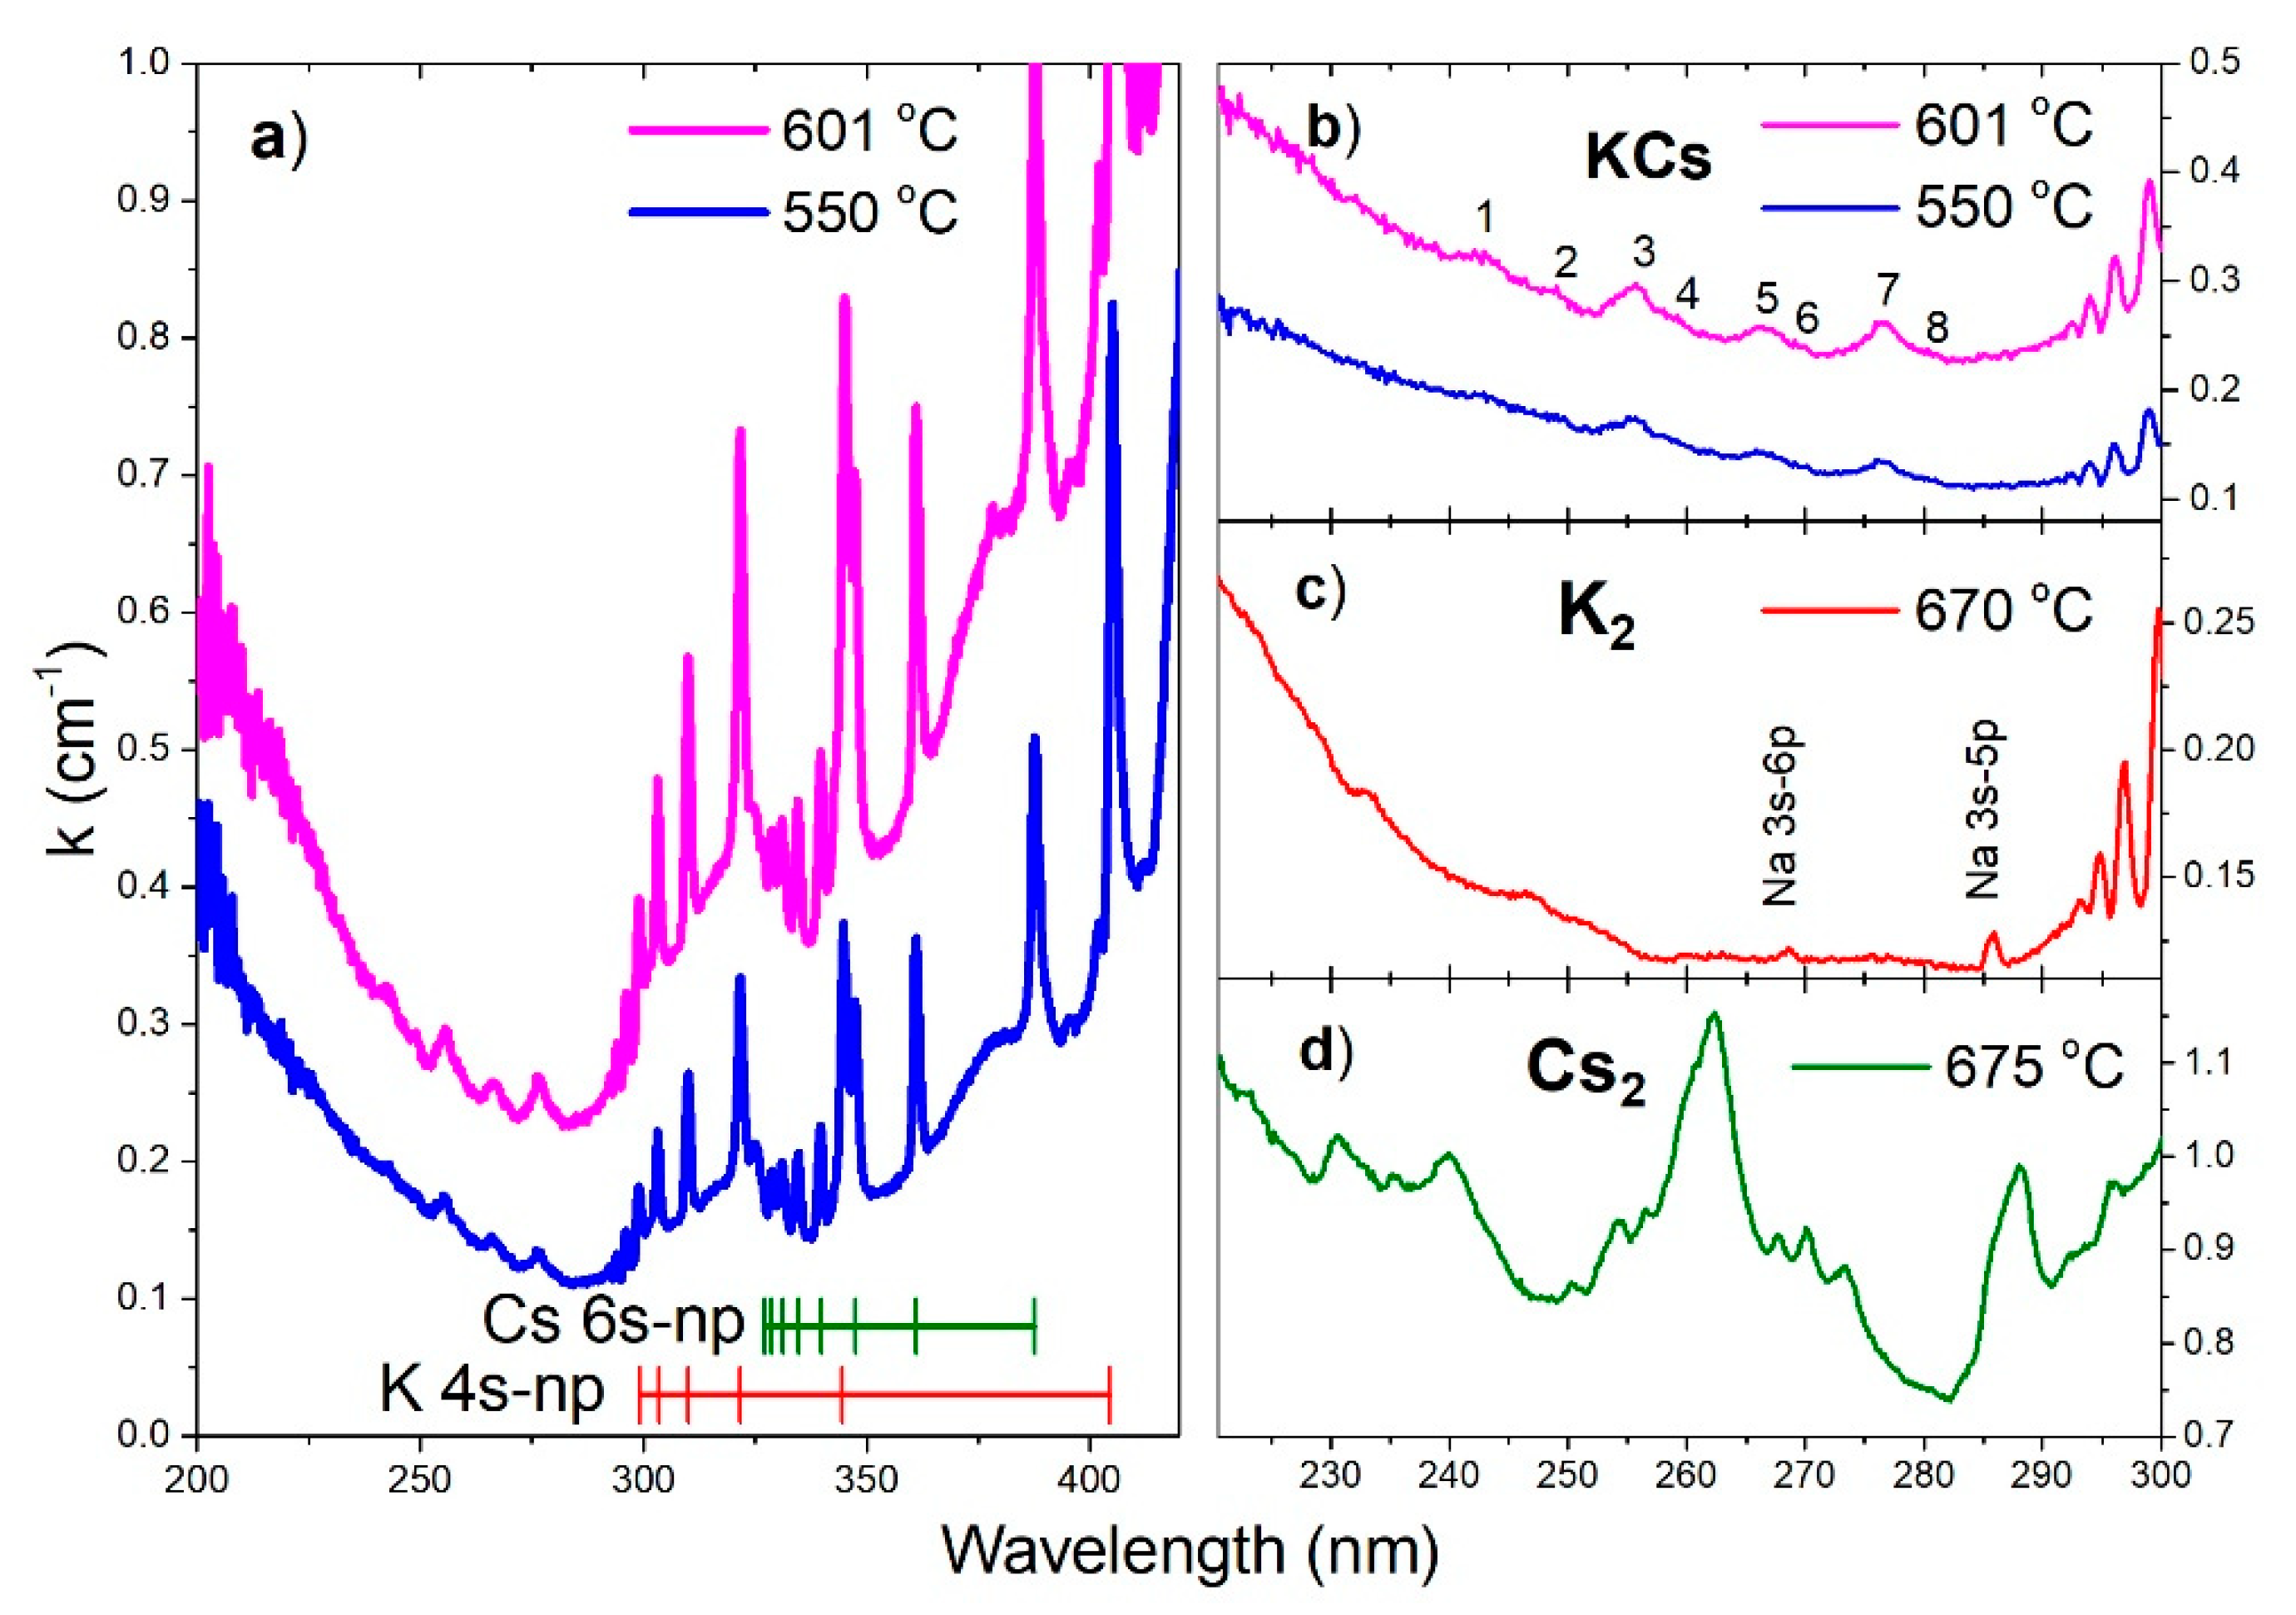
In Figure 2a, we present two absorption spectra between 200 and 420 nm for the two highest Tf temperatures measured at the top of the vertical side-arm. All measured spectra are from the low-resolution OceanOptics spectrometer. For the UV part of the spectrum, low resolution is justified by the fact that the photoionization of KCs molecule are on one hand subject to ejected electron energy which is not zero but rather spread over a certain energy interval and on the other hand if it is excitation to doubly excited states of KCs molecule (KCs**), then these states are subject to autoionization. In both cases, UV bands will appear as a structured continuum or quasi-continuum bands. Therefore, the low resolution of the spectrometer does not present experimental inferiority. The resolution of the spectrometer is 700 nm over 4000 pixels, equal to 0.17 nm/pixel.
The main result in Figure 2a,b is the observation of eight photoionization bands as listed in Table 1. Two of these eight bands at 256 and 277 nm have previously been observed [10]. The band at 266 nm was not previously observed since it was covered by the presence of the cesium photoionization bands [12]. The cesium contribution in the present experiment is much more suppressed because of the appropriate initial composition of alkali constituents (80% potassium and 20% cesium). Our previous measurements of the pure potassium vapor did not reveal any significant photoionization bands in the spectral region below 300 nm, at least for measurements at temperatures below 600 °C. The ionization energy of cesium is 31406.467 cm−1 and the Principal series limit is at 318.84 nm. The ionization energy of potassium is a bit larger 35009.14 cm−1 and the Principal series limit is at 285.63 nm. In Figure 2a, the grouping of the K and Cs Principal Series lines toward these two limits can readily be seen. The oval shape of the background photoionization continuum stems from overlapping atomic potassium and atomic cesium photoionization processes, both of which are oval. The overlapped atomic photoionization continua possess Seaton-Cooper minimum [19,20]. Because of the larger amount of potassium atoms, the Seaton-Cooper minimum in the present case is more determined by the potassium atoms. From Figure 2b we see that the minimum of the observed absorption spectrum is located at 285 nm.
4. Discussion
The eight photoionization bands of KCs in Table 1 most probably belong to spectral transitions from the ground state of the KCs molecule to excited states of KCs+ ion molecule or to doubly excited states of the KCs** molecule that lie above the first ionization limit. KCs is a heteronuclear molecule and there is no restriction due to the gerade–ungerade selection rules. Unfortunately, the relevant potential curves of those doubly excited states (DES) KCs** (autoionizing states) and the corresponding transition dipole moments are presently not available.
To obtain the cross-section for the photoionization of the KCs molecule, it is necessary to determine the density of KCs molecules at each temperature in an all-sapphire cell, which would be a difficult task. Therefore, we concluded that measured absorption coefficients profiles of the bands are sufficiently good information for the existence of the KCs photoionization bands. However, a very rough estimate of the cross-section of the photoionization bands quoted in Table 1 is about 10−39 cm2.
4.1. Direct Photoionization
There is a direct photoionization process from KCs molecule to all states of KCs+ ion molecule, but it is not a resonance process, because the ejected electron can have an excess of energy:
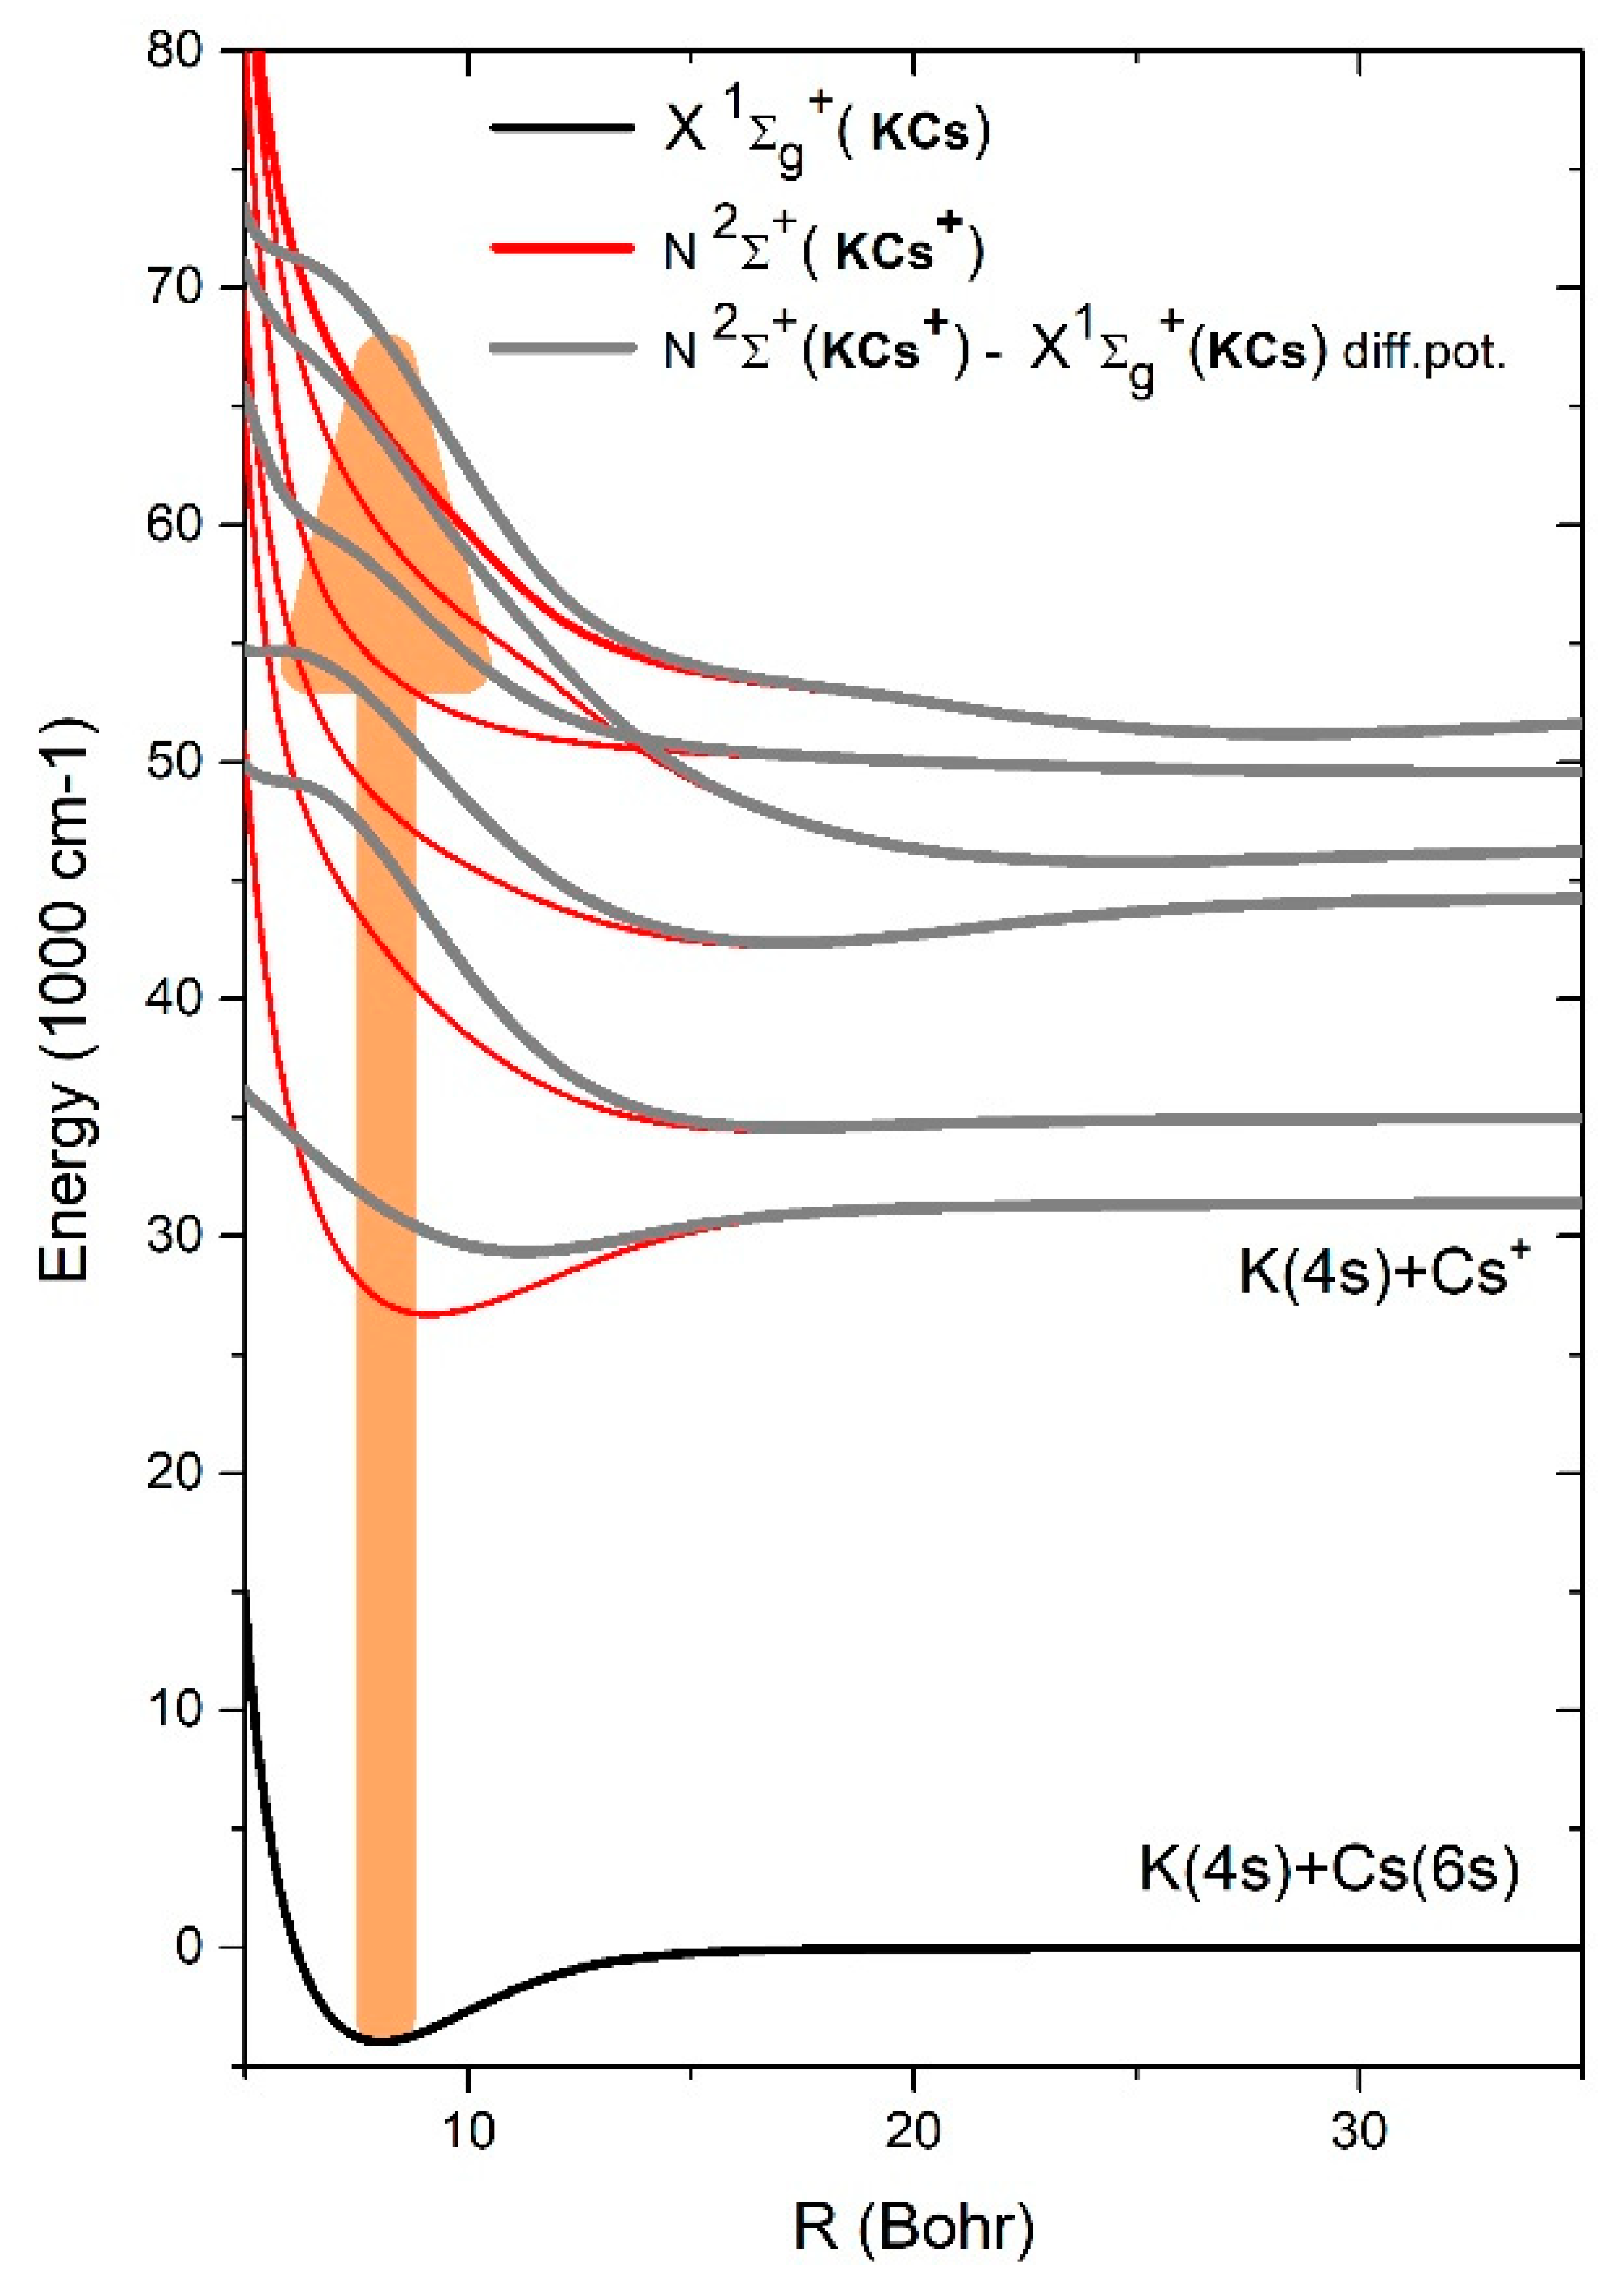
It would be of interest to perform a ZEKE [21] (Zero-Kinetic-Electron-Energy) photoionization experiment which may reveal a possible direct photoionization process. Thus, ZEKE photoionization would reveal peaks in the photoionization experiment which would be correlated with the extrema (mostly minima) in the relevant difference potentials. However, in the present experiment, the amounts of free electron energy given by the excess energy of the absorbed ultraviolet photons will produce certain smearing of the peaks. Besides these minima, the enhancement in the absorption coefficient is caused by the Boltzmann factor at the bottom of X1Σ+(KCs), as shown by the broad vertical arrow in Figure 3. The relevant spectral transitions from the bottom of X1Σ+(KCs) would be at smaller wavelengths than those quoted in Table 2, as may be concluded by inspecting Figure 3.
.
In Table 2, we give the positions and the energies of the minima in the difference potentials that would produce an enhancement in the absorption coefficient if the ejected electron had zero kinetic energy. A comparison of the values of Table 1 and Table 2 provide a less satisfactory agreement for the positions of the photoionization bands. We only want to show that such a comparison should be made for all other symmetries of the excited KCs+ potential curves (e.g., 2Π, etc.).
4.2. Indirect Photoionization
The indirect photoionization has one excitation step before the final ionizations (autoionization). The intermediate step brings the KCs molecule to a doubly excited state (DES) which lies above the first ionization potential. Doubly excited states (DES), KCs**, have asymptotes lying between K(4s) + Cs+ and K(4p) + Cs+ asymptotes, pertinent to the present spectral range. The two-step process may be described by the following equations:
Here, KCs** represents an autoionization state. If it were an atom, instead of a molecule, that transition would be characterized by the Fano profile [14]. However, since we deal with a molecule that rotates and vibrates, the Fano profile will be drastically modified.
It might be worth mentioning that some of the doubly excited molecular states are asymptotically forbidden in a dipole approximation. However, at smaller internuclear separations, those transitions to doubly excited molecular states may be induced by collisions. The KCs** DES are immersed in the ionization continuum of the KCs molecule and are, therefore, subjected to autoionization. All specific spectral transitions will have a certain lifetime connected with the width of the corresponding spectral lines. The value of the autoionization probability of each doubly excited KCs states (KCs**) will, therefore, determine the extent of the smearing of the observed photoionization band shapes. Some of these doubly excited states could be described as stemming from ion-pair states K+ + Cs*− or K*− + Cs+, where the negative ions are in the appropriate excited states so that the total energy of the ion-pair molecule is lying above the first ionization limit of the KCs molecule.
In Figure 4, we present the sketch of one possible transition from the neutral KCs ground state to the doubly excited KCs** state. In this sketch for the KCs** state, we took the KCs+ ground state potential from the K(4s) +Cs+ asymptote and shifted vertically towards the K*(4p) + Cs*(8s) asymptote. This artificial potential can be used to construct the relevant difference potential, which in turn probably has a minimum which would produce an enhancement in the absorption coefficient (usually a satellite band in the quasi-static wing of spectral lines [22]). This enhanced band would be identified as one peak among the observed photoionization band (Table 1).
Doubly excited states of diatomic molecules that lie above the first ionization limit are well known in the case of the H2 molecule [23,24]. However, those states are so high that the homologous transitions to those as discussed in the present paper would lie in the VUV spectral region. As discussed in [25], both the above discussed photoionization processes end up in the same state, KCs+ + Eelectron. This means that we have the interference between these two pathways, and this interference produces a special structure that we observe as a structured continuum that has band peaks, as quoted in Table 1.
5. Materials and Methods
We produced very high densities of potassium-cesium vapor mixture in a specially designed, all-sapphire cell. This enabled the creation of a well-defined column of KCs vapor which allowed the determination of the absorption coefficient in the spectral region between 220 and 300 nm. In this wavelength interval, a few photoionization bands appeared and denoted by the maximum of the profile. Another two all-sapphire cells with pure potassium and pure cesium were used in a similar experimental condition for comparison to extract the photoionization bands of KCs molecule. The interpretation of the observed bands was discussed by the direct and indirect photoionization process. We also mentioned a possible interference of these direct and indirect photoionization transitions as a process behind the formation of the KCs photoionization bands.
6. Conclusions
Experimental observation of the eight photoionization bands of the KCs molecule in the deep ultraviolet spectral region presents a challenge for the future quantum-mechanical calculations. At present, we tried to test the idea that some of the observed photoionization bands can be interpreted as stemming from the direct photoionization transition from the neutral KCs molecule to the ion KCs+ molecule. We did not find more than just a few possible coincidences for such transitions and, therefore, concluded that the KCs photoionization bands stem from the one-photon transitions to doubly excited states of the KCs molecule lying above the first ionization potential. Unfortunately, such doubly excited KCs states have not yet been theoretically treated. However, both direct and indirect photoionization processes may interfere enabling the creation of the observed photoionization bands. This will be the main point in our future investigations.
Author Contributions
G.P. discussed the problem, made the experiment, prepared the figures, wrote the paper; R.B. discussed the problem, wrote the paper; J.K. discussed the problem, D.S. discussed the problem, wrote the paper; N.J. and J.M. made the experiment. All authors have read and agreed to the published version of the manuscript.
Funding
This research received no external funding.
Acknowledgments
The support by General Facility projects GS03/01 and GS01/08 of Kuwait University Research sector is gratefully acknowledged. The theoretical part of the present work was supported by the Croatian Science Foundation (HRZZ) under project number 2753.
Conflicts of Interest
The authors declare no conflict of interest.
References
- Rakić, M.; Beuc, R.; Bouloufa-Maafa, N.; Dulieu, O.; Vexiau, R.; Pichler, G.; Skenderović, H. Satellite bands of the RbCs molecule in the range of highly excited states. J. Chem. Phys. 2016, 144, 204310. [Google Scholar] [CrossRef]
- Szczepkowski, J.; Grochola, A.; Kowalczyk, P.; Jastrzebski, W. Spectroscopic study of the C(3)1Σ+ ← X1Σ+ and c(2)3Σ+ ← X1Σ+ transitions in KCs molecule. J. Quant. Spectrosc. Radiat. Transfer. 2018, 204, 131–137. [Google Scholar] [CrossRef]
- Birzniece, I.; Nikolayeva, O.; Tamanis, M.; Ferber, R. Potential construction of the B(1)1Π state in KCs based on Fourier-Transform spectroscopy. J. Quant. Spectrosc. Radiat. Transfer. 2015, 151, 1–4. [Google Scholar] [CrossRef]
- Busevica, L.; Klincare, I.; Nikolayeva, O.; Tamanis, M.; Ferber, R.; Meshkov, V.; Pazyuk, E.A.; Stolyarov, A.V. Fourier transform spectroscopy and direct potential fit of a shelflike state: Application to E (4) 1Σ+ KCs. J. Chem. Phys. 2011, 134, 104307. [Google Scholar] [CrossRef] [PubMed]
- Klincare, I.; Nikolayeva, O.; Tamanis, M.; Ferber, R.; Pazyuk, E.A.; Stolyarov, A.V. Modeling of the X 1Σ+, a 3Σ+ → E(4) 1Σ+ →X 1Σ+ (v=0,J=0) optical cycle for ultracold KCs molecule production. Phys. Rev. A 2012, 85, 062520. [Google Scholar] [CrossRef]
- Borsalino, D.; Vexiau, R.; Cachan, M.; Luc-Koenig, E.; Dulieu, O.; Bouloufa-Maafa, N. Prospects for the formation of ultracold polar ground state KCs molecules via an optical process. J. Phys. B At. Mol. Opt. Phys. 2016, 49, 055301. [Google Scholar] [CrossRef] [Green Version]
- Creek, D.M.; Marr, G.V. Some ultraviolet cross-section measurements on molecular alkali-metal vapors. J. Quant. Spetrosc. Radiat. Transfer. 1968, 8, 1431. [Google Scholar] [CrossRef]
- Hotop, R.; Niemax, K. Continuum- and bound-state pair absorption in Cs-Cs, Rb-Rb and Cs-Rb systems. J. Phys. B At. Mol. Phys. 1980, 13, L93–L99. [Google Scholar] [CrossRef]
- Hotop, R.; Niemax, K.; Schlüter, D. On pair-absorption in intrinsic vapors. Z. Phys. A Atoms. Nucl. 1982, 304, 185. [Google Scholar] [CrossRef]
- Hotop, R.; Niemax, K.; Richter, J.; Weber, K.-H. Thermionic detection of the ionic fragments of continuum-state pair absorption systems. Opt. Commun. 1981, 36, 35–38. [Google Scholar] [CrossRef]
- Suemitsu, H.; Samson, J.A.R. Relative photoionization cross sections of Cs, Cs2, Rb, and Rb2. Phys. Rev. A 1983, 28, 2752–2758. [Google Scholar] [CrossRef]
- Pichler, G.; Makdisi, Y.; Kokaj, J.; Thomas, N.; Mathew, J. Structured photoionization continuum of superheated cesium vapor. J. Phys. B At. Mol. Opt. Phys. 2015, 48, 165002. [Google Scholar] [CrossRef]
- Rakić, M.; Pichler, G. Photoionization bands of rubidium molecule. J. Quant. Spectrosc. Radiat. Transfer. 2018, 208, 39. [Google Scholar] [CrossRef]
- Fano, U. Effects of Configuration Interaction on Intensities and Phase Shifts. Phys. Rev. 1961, 124, 1866–1878. [Google Scholar] [CrossRef]
- Beuc, R.; Movre, M.; Horvatić, B.; Čopor, M.; Vdović, S.; Nevsesyan, A.; Varzhapetyan, T.; Sarkisyan, D.; Pichler, G. RbCs bands observation and interpretation. Appl. Phys. B 2007, 88, 111–115. [Google Scholar] [CrossRef]
- Allouche, A.-R.; Korek, M.; Fakherddin, K.; Chaalan, A.; Dagher, M.; Taher, F.; Aubert-Frecon, M. Theoretical electronic structure of RbCs revisited. J. Phys. B At. Mol. Opt. Phys. 2000, 33, 2307–2316. [Google Scholar] [CrossRef]
- Korek, M.; Allouche, A.R.; Fakhreddine, K.; Chaalan, A. Theoretical study of the electronic structure of LiCs, NaCs, and KCs molecules. Can. J. Phys. 2000, 78, 977. [Google Scholar] [CrossRef]
- Korek, M.; Allouche, A.R.; Abdul, S.N. Al Potential curves and rovibrational energies for electronic states of the molecular ion KCs+. Can. J. Phys. 2002, 80, 1025–1035. [Google Scholar] [CrossRef]
- Seaton, M.J. A comparison of theory and experiment for photo-ionization cross-sections II. Sodium and the alkali metals. Proc. R. Soc. A 1951, 208, 418. [Google Scholar]
- Cooper, J.W. Photoionization from Outer Atomic Subshells. A Model Study. Phys. Rev. 1962, 128, 681–693. [Google Scholar] [CrossRef]
- Müller-Dethlefs, K.; Schlag, E.W. High-resolution zero kinetic energy (ZEKE) photoelectron spectroscopy of molecular systems. Annu. Rev. Phys. Chem. 1991, 42, 109–136. [Google Scholar] [CrossRef]
- Movre, M.; Pichler, G. Resonance interaction and self-broadening of alkali resonance lines I. Adiabatic potential curves. J. Phys. B At. Mol. Phys. 1977, 10, 2631. [Google Scholar] [CrossRef]
- Sanchez, I.; Martin, F. The doubly excited states of H2 molecule. J. Chem. Phys. 1997, 106, 77. [Google Scholar] [CrossRef]
- Sanchez, I.; Martin, F. Phys Origin of Unidentified Structures in Resonant Dissociative Photoionization of H2. Rev. Lett. 1997, 79, 1654. [Google Scholar] [CrossRef]
- Palacios, A.; Feist, J.; Castrillo, A.G.; Sanz-Vicario, J.L.; Martín, F. Autoionization of Molecular Hydrogen: Where do the Fano Lineshapes Go? ChemPhysChem 2013, 14, 1456–1463. [Google Scholar] [CrossRef] [PubMed]
Figure 1.
Experimental setup.

Figure 2.
KCs absorption spectra for the two highest temperatures in the 200–420 nm spectral range (Figure 2a). Corresponding background light source was from the deuterium lamp. At the bottom right in Figure 2a, we put connected crosses denoting positions of the K and Cs Principal Series spectral lines from 5p to 10p and from 8p to 15p, respectively. An enlarged spectral region, 220–300 nm, is reproduced for 2b) KCs, 2c) K2, and 2d) Cs2 cases. The 2b) KCs case shows the growing photoionization bands as listed in Table 1 from 1 to 8. Tf = 601 °C means the temperature of the finger of the cell.

Figure 3.
Potential curves of the ground state KCs molecule with six potential curves of KCs+ molecule [17,18] of symmetry (red lines) together with the relevant difference potentials (bold gray lines).

Figure 4.
The ground state of the KCs+ molecule (red) and the sketch of an artificially constructed, doubly excited state (DES of KCs** denoted by S) with the asymptote K*(4p) + Cs*(8s), lying above the lowest KCs+ potential curve. The minimum of the relevant difference potential of the transition S(KCs**) -X(KCs) (magenta color) points to the location of the one possible photoionization band.


Table 1.
Positions of the observed photoionization bands.
| Band Number | Wavelength (nm) | Wavenumber (cm−1) |
|---|---|---|
| 1 | 242.7 | 41203 |
| 2 | 248.8 | 40192 |
| 3 | 255.8, 256 [10] | 39093 |
| 4 | 259.1 | 38595 |
| 5 | 266.4 | 37537 |
| 6 | 269.3 | 37133 |
| 7 | 276.3, 277 [10] | 36192 |
| 8 | 280 | 35714 |
Table 2.
Minima in the difference potentials .
| R (bohr) | Difference Energy (cm−1) | Upper State | Wavelength (nm) |
|---|---|---|---|
| 11.34 | 29,338 | 1 2Σ+ | 340.9 |
| 17.13 | 34,536 | 2 2Σ+ | 289.6 |
| 17.16 | 42,399 | 3 2Σ+ | 235.9 |
| 24.90 | 45,785 | 4 2Σ+ | 218.4 |
© 2020 by the authors. Licensee MDPI, Basel, Switzerland. This article is an open access article distributed under the terms and conditions of the Creative Commons Attribution (CC BY) license (http://creativecommons.org/licenses/by/4.0/).
Share and Cite
MDPI and ACS Style
Pichler, G.; Beuc, R.; Kokaj, J.; Sarkisyan, D.; Jose, N.; Mathew, J. Photoionization of KCs Molecule: Origin of the Structured Continuum? Atoms 2020, 8, 24. https://0-doi-org.brum.beds.ac.uk/10.3390/atoms8020024
AMA Style
Pichler G, Beuc R, Kokaj J, Sarkisyan D, Jose N, Mathew J. Photoionization of KCs Molecule: Origin of the Structured Continuum? Atoms. 2020; 8(2):24. https://0-doi-org.brum.beds.ac.uk/10.3390/atoms8020024
Chicago/Turabian StylePichler, Goran, Robert Beuc, Jahja Kokaj, David Sarkisyan, Nimmy Jose, and Joseph Mathew. 2020. "Photoionization of KCs Molecule: Origin of the Structured Continuum?" Atoms 8, no. 2: 24. https://0-doi-org.brum.beds.ac.uk/10.3390/atoms8020024
Note that from the first issue of 2016, this journal uses article numbers instead of page numbers. See further details here.