Simulations of Ion-Guiding Through Insulating Nanocapillaries of Varying Diameter: Interpretation of Experimental Results

Helmholtz-Zentrum Berlin für Materialien und Energie, D-14109 Berlin, Germany
Atoms 2020, 8(3), 48; https://0-doi-org.brum.beds.ac.uk/10.3390/atoms8030048
Submission received: 30 June 2020
/
Revised: 13 August 2020
/
Accepted: 17 August 2020
/
Published: 21 August 2020
(This article belongs to the Special Issue Accelerator-Based Atomic Physics: Fast Ion–Atom and Ion–Molecule Collisions)
Abstract
:The guiding of highly charged ions through a single nanocapillary is simulated in comparison with previous experiments performed with highly insulating polyethylene terephthalate (PET). The simulations are carried out using 3-keV Ne ions injected into capillaries with diameters ranging from 100 nm to 400 nm. In the calculations, non-linear effects are applied to model the charge transport along the capillary surface and into the bulk depleting the deposited charges from the capillary walls. In addition to the surface carrier mobility, the non-linear effects are also implemented into the bulk conductivity. A method is presented to determine the parameters of the surface charge transport and the bulk conductivity by reproducing the oscillatory structure of the mean emission angle. A common set of charge depletion rates are determined with relatively high accuracy providing confidence in the present theoretical analysis. Significant differences in the oscillatory structures, experimentally observed, are explained by the calculations. Experimental and theoretical results of the guiding power for capillaries of different diameters are compared. Finally, dynamic non-linear effects on the surface and bulk relaxation rates are determined from the simulations.
1. Introduction
During the last two decades, the transmission of ions through insulating capillaries has received considerable attention. Capillaries in highly insulating materials like polymers collect incident ions at the wall so that charges remain within the capillary. Significant charge collection produces a repulsive electric field, which causes the deflection of the following ions. This deflection occurs at relatively large distances from the wall so that electron capture into the projectile is inhibited. Thus, the ions are guided along the capillary axis maintaining their incident charge state during their passage even when the capillary axis is tilted with respect to the incident beam direction.
The remarkable property of capillary guiding can be understood in terms of a self-organizing process [1] governing the charge patch formation at the inner wall of the capillaries. When the charge patch increases, more ions are deflected, which, in turn, decreases the ion deposition. Thus, a self-organized balance of the deposited charge patch is achieved. Another remarkable property is that this balanced charge patch is optimal for sending the maximum number of ions to the capillary exit. Thus, significant fractions of ions transmitted through thin and long capillaries have been observed.
Pioneering experiments of the ion-guiding phenomenon have been performed using capillaries in polyethylene terephthalate (PET) with a diameter of the order of 100 nm [1,2]. After these studies the interest in this work arose so that several laboratories conducted experiments using capillaries in PET [3,4,5,6,7,8], polycarbonate (PC) [6,9], SiO [10], AlO [11,12,13,14], and mica [15,16]. Also, electrons were used as projectiles transmitted through capillaries in AlO [17] and PET [18,19]. Moreover, guiding of charged particles have been studied in single-glass capillaries in a tapered geometry [20,21,22,23,24,25,26], a straight geometry [27,28,29,30,31,32], soft curved material [33,34], and between parallel glass plates [35,36]. Further work is discussed in comprehensive articles reviewing the investigations of capillary guiding [37,38].
Theoretical studies revealed additional insights into the guiding mechanisms. In pioneering simulations [39,40,41] a diffusion model was used wherein the deposited charges perform a random walk along the surface and inside the bulk of the capillary. As diffusion is a relatively weak process [42], a different concept was adopted in capillary guiding simulations [43,44,45] involving a non-linear (exponential) charge drift approach, which is based on the model of Frenkel [46]. Moreover, ion-guiding was treated rather accurately by means of solving the continuity equations for the conducted charges [47,48]. The recent work [48] has been focused on the determination of the charge relaxation rates from corresponding surface and bulk conductivities in microcapillaries.
The leading parameter of the guiding experiments is the tilt angle , which is equal to the angle between the capillary axis and the incident beam direction. Under tilting conditions, the fraction of the transmitted ions generally increases with the inserted charge until reaching a constant value denoted equilibrium value. The capability of insulating capillaries to guide ions at equilibrium is referred to as the guiding power. The guiding power can be quantized by means of the characteristic guiding angle using the equation
where is the transmitted ion fraction at equilibrium [2]. The guiding angle is a convenient parameter to specify the guiding power.
The incident ions produce the main charge patch near the capillary entrance region. However, further inside, additional weaker patches are temporarily produced. Experimental studies of temporary charge patches have been conducted in different laboratories [49,50,51,52]. There, oscillatory variations of the ion emission angle have been observed while, at equilibrium, the angular oscillations diminish. The variations of the ion emission angle have also been observed in theoretical studies [39,43,52].
In the simulations using the non-linear drift model [43,44] both surface charge transport and the migration into the bulk have been considered. The surface charge transport is governed by the drift mobility, which was varied by more than an order of magnitude. This study was motivated by previous experiments [4], which showed that the transmitted ion fraction remains practically constant when the incident ion current was changed by orders of magnitude. (It can readily be shown that a varying conductivity and a varying ion beam intensity have identical effects on the ion transmission [43].) The stability of the ion transmission provides evidence [2] that the charge depletion is governed by a non-linear (exponential) conductivity law [46]. Indeed, the simulation confirmed the experimentally observed transmission as a result of the non-linear mechanism of the charge transport.
The theoretical work provided essential progress to the comprehension of the capillary guiding. In this field, however, the theoretical studies are less numerous than those of the experimental work. Many details of the experimental results have not been interpreted in terms of a theoretical analysis. For instance, angular oscillations and guiding powers have experimentally been investigated for capillaries of different diameters [7,51]. Apart from PET capillaries, experiments have been performed using capillaries in PC and blocking effects on the ion transmission have been observed [53]. These observations still need clarifying theoretical effort. Moreover, the role of the surface charge transport and the competing migration into the bulk require further considerations.
In this work, simulations of the ion transmission through insulating capillaries are performed. The calculations are carried out using a code similar to that developed previously [43,44]. Therefore, Refs. [43,44] will be referred to as [I] and [II], respectively. There, various examples for 200 nm capillaries were already presented, however, systematic studies are performed here. The simulations are devoted to the interpretation of experimental work performed with PET nanocapillaries. Emphasis is given to the guiding properties of capillaries with different diameters for which a common set of charge depletion rates for the surface and bulk are found. The simulations provide explanations for the appearance of significant oscillations of the ion emission angle and for other cases for which the oscillations are missing. Finally, the experimental guiding powers for different capillary diameters are discussed.
The present work is structured as follows: in the next Section 2 previous experimental data are presented, in Section 3 the theoretical method is described, the main Section 4 discusses the various results of the simulations in comparison with the previous experimental studies, and in Section 5 conclusions are drawn from the present work.
2. Overview of Previous Experiments
In this section, typical results from previous experiments are shown to provide the motivation for the present simulations. The experimental results are taken from a series of measurements [7,51,53] conducted at the 14 GHz Electron Cyclotron Resonance (ECR) ion source of the ZERNIKE-LEIF facility [54] at the KVI Groningen (Netherlands). The experimental method has been described before [51] so that only a few details are pointed out here. The targets consist of polymer foils of PET and PC containing many capillaries, which have diameters of 100 to 400 nm and a length of μm. The PET capillaries were manufactured from the same foil sample so that the surface and bulk conductivities should be equal for different tube diameters. The targets were placed into a vacuum chamber, wherein they were bombarded by highly charged ions, for which the current was varied in the range of 10–1000 pA. The beam was collimated to a diameter of 1–1.5 mm with a divergence of 0.25° full width at half maximum (FWHM). The ions transmitted through the capillaries were detected using an electrostatic analyzer. In this work, we exclusively consider the transmission of 3-keV Ne ions, for which the incident charge state is preserved during the passage through the capillary.
Generally, the experimental results were measured as a function of the total charge deposited by the ion beam incident on the front surface of the capillary sample. On the other hand, the theoretical results are based on the corresponding charge inserted into a single capillary. The two quantities are related by the expression [7]
where d and D are the diameter of the capillary and the ion beam, respectively. To facilitate the comparison of the different results, the figures from the previous experiments [7,51,53] are changed replacing by .
The charge inserted is an important parameter to analyze the ion guiding. For a constant beam the inserted charge is obtained as , i.e., it is proportional to the time t. Hence, when measuring the incident charge dependence, one can also speak of the time evolution or dynamics of a measured quantity. To study dynamic guiding properties, generally, the intensity of the transmitted ions and the mean angle of the ions ejected from the capillary exit were measured.
Several studies were performed to determine the intensity of the transmitted ions obtained by integrating the corresponding transmission profiles [7,51,53]. In Figure 1 an example is shown for 3-keV Ne ions transmitted through PET capillaries with a diameter of 100 nm [53]. The experimental results were fitted by an expression, which describes the transmitted ion fraction as a function of the inserted charge . After reaching a certain threshold value , the intensity of the transmitted ions starts from zero to an asymptotic equilibrium value given by the exponential charge-up function
for and otherwise [4]. When reaches the characteristic charge , the intensity of 63% of the maximum value is obtained. With increasing charge insertion , the expression (3) predicts a constant fraction in the equilibrium region. In this work, blocking effects [53] on the intensity of the transmitted ions will not be considered.
A notable example for the dynamic properties of the transmission profiles is displayed in Figure 2. The left-hand columns contain a series of profiles for Ne ions emerging from PET capillaries with a diameter of 200 nm [51]. Each graph indicates the charge inserted until the instant when the profile was measured. It is seen that the transmission profiles change significantly in position with increasing charge insertion. Consequently, the mean value of the emission angle varies as shown in the right-hand column of Figure 2. Please note that the labels (a) to (e) in the left-hand column correspond to the same labels in the right-hand column. With increasing charge insertion the oscillations are damped so that the mean emission angles do not change any more. Finally, the mean angle coincides with the tilt angle of 5.
In left-hand graph of Figure 3 the mean angles of the 200 nm capillaries are compared for different tilt angles [51]. The curve for 5, already shown in Figure 2, oscillates within the extremes of to . In the theoretical Section 3 this variation will be used to obtain information about the parameters for the charge migration along the surface and into the bulk. In comparison with , the oscillatory structures for are less pronounced and shifted to lower angles. As expected, the 0° curve is nearly constant. (In fact, it shows tiny oscillations, which suggest that the capillaries are tilted by the small amount of .) The arrows labeled indicate the characteristic charge from Equation (3).
In the right-hand graph of Figure 3 the mean angles for the 400 nm capillaries are plotted for the tilt angles of 3, 5, and 6.5. The oscillations for 400 nm look similar to those for 200 nm although less extremes are visible. The curve for varies within the angular range from 4.2 to 6.3 while the curve for varies much less, i.e., from 2.8 to 3.5. The largest variation is observed for the tilt angle of . The arrows labeled indicate the characteristic charges mentioned before.
Systematic measurements of transmission profiles revealing information about the mean emission angle are not available for PET capillaries with a diameter of 100 nm. Such capillaries were used in the pioneering experiments of capillary guiding [1] where, however, the non-parallelism of the capillaries inhibited a detailed analysis of the emission angle. A decade later, a limited number of measurements were performed for 100 nm concerning the dynamics of the ion transmission through sufficiently parallel capillaries [7] (see in Figure 1 the range up to ∼5 fC).
Figure 4 shows transmission profiles for 3-keV Ne ions acquired after the insertion of indicated in each graph. In Figure 4a the profile, taken with 1.3 fC in the dynamic charge region, is lower in intensity than the other ones (note the multiplication factor of 2). The two other profiles are rather similar as they were taken in the equilibrium period as seen from Figure 1. The peak widths, given in each graph, and the positions of the peak maxima were found to be nearly constant. The latter constancy is rather surprising in view of the varying peak positions shown in previous and following figures.
The figures shown so far exhibit exclusively data measured with PET capillaries. Now, we shall turn to capillaries contained in another material. Figure 5 shows results for the mean emission angle obtained with PC capillaries of 100 nm in diameter [53]. (In the original work the diameter of this PC capillary was given as 95 nm. Here, this value is rounded up to 100 nm as the difference lies well within the uncertainties of the diameter measurement.) It is seen that the qualitative behavior of the data is similar to that for the 200 nm capillaries in PET. As in the left-hand graph of Figure 3, the oscillation amplitude increases with increasing tilt angle. However, for the PC capillaries the oscillatory structures are significantly stretched to larger charge insertion values. It should be pointed out that the inserted charge is rather uncertain due to errors in the measurements of the diameters of the capillaries and the ion beam used in Equation (2). More notably, the significant variation of the emission angle for PC capillary is in contradiction with the constancy observed for PET in Figure 4. This finding will be the subject of further considerations in Section 3.
The oscillations of the profile position can be explained by the formation of charge patches within the capillaries [49,50,51,52]. Each extreme of the mean emission angle, i.e., each minima and maxima, corresponds to a certain charge patch. Altogether, the present results show that the number of extremes decreases with capillary diameter. In Figure 5 the mean emission angle for 100 nm capillaries exhibits four extremes, which are fully visible for the 3 tilt angle. Hence, it appears that the 100 nm capillaries involve four charge patches, which is one and two more than observed for the capillary diameter of 200 nm and 400 nm, respectively (see the left- and right-hand graphs of Figure 3).
In Figure 6 transmitted ion yields at equilibrium are displayed as a function of the tilt angle. The results were obtained for PET capillaries with diameters from 100 to 400 nm [7]. The maximum yield represents ions transmitted through untilted capillaries. Hence, the maximum ion yield is expected to be proportional to the capillary opening area which, in turn, is proportional to the square of the capillary diameter d. Indeed, in first approximation, the values for the tilt angle are proportional to capillary area (see Figure 6). More accurately, for ions incident at zero degree their absorption in the capillary due to the beam divergence must be taken into account as will be done later in Section 3.
Most of the data points in Figure 6 represent experimental results for the ion intensity transmitted through the tilted capillaries. For each capillary diameter, the data were fitted by means of Equation (1), for which the results are plotted as solid lines. The fits yield the characteristic guiding angle as an adjustable parameter, which is found to be rather constant close to 5.5. This value is in good agreement with the scaling laws established previously for the capillary guiding [55].
3. Theoretical Method
3.1. Basics of the Calculations
The theoretical method of the simulations was introduced in [I] and [II] so that only a brief description is given here. The ions are inserted into a circular capillary tilted with the angle relative to the incident beam direction. They start at the capillary entrance opening under random distributions for the initial x and y values, where x and y are, respectively, the horizontal and vertical coordinates perpendicular to the capillary z axis. For a tilted capillary, the ions initially hit the inner capillary wall where they are assumed to deposit their full charge onto the surface. The parameters of the incident ions and the capillaries are summarized in Table 1.
The deposited surface charges produce an electric potential that is evaluated by accumulating the individual Coulomb potentials of the screened point charges. This potential is differentiated analytically with respect to the x, y, and z coordinates yielding the electric field components , , and , respectively. Trajectories of the incident ions are evaluated solving Newton’s equation of motion for an ion moving in the electric field deduced from the potential. The front and back sides of the capillary foils are covered by grounded metal layers, which affect the field within the capillary, i.e., in particular, in the region near the entrance and exit of the capillary. A grounded metal layer is taken into account by adding image charges of the deposited ions, which cause a potential drop to zero at the entrance and exit of the capillary.
The ion insertion and the charge flow are treated sequentially in iterations. After a small number of ions (typically 20 out of several thousands) were inserted into the capillary, the deposited charges are displaced in proportion to the ion insertion time . This time is determined from the incident ion current by
where q is the charge of the projectile. For the 100 nm capillary the incident current is equal to fA obtained from Equation (2) using the total ion beam pA (Table 1). As is proportional to the square of the capillary diameter it follows that 22.4, 5.6, and 1.4 s for 100, 200, and 400 nm, respectively. This part of the simulations is relatively easy to handle as it does not include unknown parameters.
The elaborate part of the calculations is the inclusion of the migration of the deposited charges. This charge flow is necessary to avoid an overcharging of the patches, which would inhibit the ion transmission. As in [I], both charge flows along the surface and into the bulk are taken into account. A non-linear drift model is used to evaluate the charge transport as a function of the electric field. For both surface and bulk discharge, non-linear rules are implemented using the expression by Frenkel [46], which describes the conductivity produced by thermal electron liberation from deep traps enhanced by the lowering of the potential barrier with a high electric field.
In accordance with Frenkel’s model [46] one may express the transition rate of a trapped electron into the conduction band (or equivalently, the trapping of a hole from the valence band) as a function of the electric field E
where is the transition rate for . The characteristic parameter , evaluated from well-known quantities, is the field governing the exponential increase of the transition rate. One obtains V/μm at room temperature as given in Table 2.
The deposition of positively charged ions creates a cluster of holes, which are readily captured at localized surface centers (traps). In a dielectric insulator, holes migrate by performing a series of individual jumps (hoppings) from one trap to the next one [56,57,58]. Each transition requires the trapping of a hole from the valance band, which fills a hole trap and the subsequent de-trapping of the hole into the valence band. The hopping time of the hole is equal to the trapping time of the hole. This hopping time is obtained as with from Equation (5).
First, we consider the charge transport along the surface. Using the Frenkel factor, an effective hole mobility at the surface was introduced by Gil [56]
where is the drift mobility for The mobility is varied from 0.001 to 0.01 nm/V·s as indicated in Table 2. It should be noted that the surface mobility is proportional to the surface conductivity . Thus, changing the parameter is equivalent to changing the corresponding surface conductivity.
Then, within the macroscopic time from Equation (4) one obtains the directed hole transport length along the surface [43]
where is the electric field tangential to the surface. With Equation (7) the distance and direction of the charge displacement is determined with the electric field vector evaluated at the location of the charge under consideration. Thus, the charges are drifted by means of the field component along the capillary wall parallel (longitudinal) to the capillary z axis. When a charge reaches the entrance or exit of the capillary, it is depleted by the metal layers at the sample surfaces. Moreover, the charges are drifted along the capillary wall in a circular (transversal) motion around the axis by means of the field perpendicular to the radial field .
Formula (7) implies two limiting regions: for the charge relaxation follows a linear field dependence (as in Ohm’s law) and for it is governed by an exponential (non-linear) function. The simulations show that a typical field within the capillary entrance region is of the order of 10 V/μm. With V/μm from Table 2 it follows that , which implies that the exponential (non-linear) term is dominant. The non-linear field dependence is an important property for the charge relaxation.
Second, we consider the bulk conductivity, which is modeled as a migration of the deposited charge into the capillary material specified by the rate . The injected charge relaxes by the bulk conductivity, which recombines the holes with electrons that are field driven to the positively charged interface [48]. In the following, this charge relaxation is denoted charge depletion assuming that the bulk is charge free. The charge depletion occurs during the time interval from Equation (4) with the probability
where is the bulk depletion rate increased by the Frenkel factor depending on the radial field , which is perpendicular to the capillary surface. It is noted that Equation (8) was also used in [I] and [II], wherein, however, the Frenkel factor was not implemented. The depletion rate is chosen within the range of 0.1–0.5 mHz (Table 2). With a typical value of 1 mHz it follows that 0.005 which is sufficiently small to avoid instabilities in the calculations.
From Equations (7) and (8) it is important to note that with constant and , the results of the simulations depend on the ratios or, respectively. In this work, the parameters as well as are varied, whereas is kept constant. In view of the ratios or the same results would be obtained by keeping or constant and varying . Hence, in this work, is not varied as it is considered redundant.
3.2. Example from Previous Simulations
Before the main calculations are started, an example for a capillary with a diameter of 200 nm from previous work [II] is shown. The results were obtained with the parameters given in Table 1 and Table 2. In particular, the drift mobility was 0.01 nm/V·s and the bulk depletion rate was 0.4 mHz (however, without using the Frenkel factor). In Figure 7 trajectories and deposited charges for the tilt angle of 3 are displayed. The panels Figure 7b–f show that the ions follow oscillatory trajectories to the end of the capillary where they leave under varying angles. Finally, the ions are emitted essentially parallel to the capillary axis as seen from panel Figure 7f. Also, it is seen that a significant number of ions is transmitted through the capillary.
In the right-hand column of Figure 7 the distributions of deposited charges are shown. In Figure 7a the trajectories are all stopped inside the capillary. The initial charge deposition produces a minor field component that weakly deflects the ions so that they land at a location further inside the capillary. In Figure 7b the charge deposition is sufficiently high to deflect the ions to the capillary exit. The increased deflection of the ions inhibits a deposition of charges further inside the capillary. Thus, the entrance patch shrinks, which is an important part of the self-organizing property of the ion-guiding.
In the right-hand column of Figure 7d,e one can find two charge patches in the upper hemisphere near the center and in the lower hemisphere near the exit of the capillary. Accordingly, the trajectories are further deflected causing oscillatory behavior of the mean emission angle. Altogether, one can identify three charge patches which give rise to three extremes in the oscillatory structures [44]. Finally, at equilibrium, the charge patches lose importance. In Figure 7f, where the ion-guiding achieved equilibrium, the charges are distributed all over the capillary wall.
However, the entrance charge patch reveals a strong migration of the charges perpendicular to the capillary axis. A significant number of charges are visible in the upper half of the capillary, which cannot directly be reached by the incident ions. This migration to the opposite side of the capillary wall is an unexpected effect, which reduces the deflecting field of the entrance patch.
In [I] and [II], the depletion rate 0.4 mHz was kept constant and the mobility was varied from 0.003 to 0.04 nm/V·s using capillaries with a single diameter value of 200 nm. It was found that the fraction of transmitted ions was practically constant as mobility was changed by more than an order of magnitude. This remarkable observation was associated with the non-linear dependence of the charge transport as a function of the electric field. The non-linear behavior is similar to that of a diode, which stabilizes the charge accumulation in the entrance patch.
4. Results of the Simulations
In the following, the trajectories of the transmitted ions and the charge transport are analyzed by means of the simulations performed for capillary diameters of 100, 200, 300, and 400 nm. For 300 nm only a few results are shown as they are similar to those for 200 and 400 nm. Test calculations are performed to adjust the parameters for the charge migration along the surface and the charge transfer into the bulk. This is done by comparison of the simulations with the experimental data. First, the intensity of the transmitted ions is considered to be a function of the drift mobility at the surface. Then, the oscillatory structures of the mean emission angle are considered to determine the depletion rate for the bulk conductivity. The reproduction of the oscillatory structures is found to be a powerful tool for the parameter adjustments.
4.1. Analysis of the Surface Drift Mobility
Calculations of capillaries with a diameter of 100 nm are conducted to provide information about a suitable mobility parameter. Figure 8 shows results for 3-keV Ne ion transmission evaluated with different drift mobilities (i), (ii), and (iii), which are specified in Table 3. The solid lines represent fits by means of Equation (3) where the fitting parameter is given in each graph. The fits compare well with the results of the simulations, which have similarly been found in [I].
The graphs of Figure 8d–f show mean emission angles of the transmitted Ne ions indicating constant values within the numerical fluctuations close to the tilt angle of 5°. The constancy of the emission angle agrees with the experimental results for PET (see Figure 4). Moreover, in Figure 8a–c the transmitted Ne ion fraction indicates an intensity drop by an order of magnitude. This strong drop of transmitted ions is attributed to the increasing migration of entrance charge patch to the opposite capillary wall so that the field becomes too weak to deflect the ions. The migration effect is more important for the capillary of 100 nm than for that of 200 nm because of its larger distance to the opposite wall. As mentioned, the simulations in [II] for the 200 nm capillary revealed a constant ion transmission for a varying mobility.
Here, for the 100 nm capillary, a specific mobility is favored. In Figure 8a the equilibrium fraction 0.18, evaluated with the mobility of 0.001 nm/V·s, is found to be in reasonable agreement with the experimental fraction of 0.21 obtained from the curve in Figure 1. Therefore, the value of 0.001 nm/V·s can be chosen as a suitable mobility parameter. Altogether, the results in Figure 8 show that the simulations for 100 nm capillaries provide a sensitive tool to determine the surface drift mobility. It should be noted, however, that the value 0.001 nm/V·s is a factor of 3 lower than the smallest mobility (0.003 nm/V·s) used in [I] and [II]. Hence, the lowest drift mobility of 0.001 nm/V·s will also be tested in simulations for the capillaries with diameters of 200 and 400 nm. It should be noted that the mobilities used here and previously in [43,45] are rather small in comparison with the values given in the literature [56,57,58], which suggests further studies.
Figure 9 presents results for 400 nm capillaries again using the three mobility values from Table 3. It is seen from the upper graphs that the ion fraction barely changes with varying drift mobility. In fact, the transmitted ion fraction for the lowest mobility in Figure 9a is nearly equal to those in Figure 9b,c. The same constant ion fraction is found for the 200 capillaries (not shown here) in agreement with the results in [II].
The lower graphs of Figure 9 display the results for the mean emission angle of the transmitted Ne ions, which reveal oscillatory structures. It is seen that these structure change in a noticeable manner when the drift mobility is varied. In view of the results in the right-hand graph of Figure 3 it follows that the oscillatory structures from the experiments are best reproduced by the curve in Figure 9e which is associated with the drift velocity (ii). In this case, the simulations reveal oscillations with extremes from 4.1 to 6.7 in good agreement with experimental data. The same reproduction of the experimental data is achieved for the capillary diameter of 200 nm. This shows again that the comparison of the experimental and theoretical results for the angular oscillations can be used as a sensitive tool to obtain information about the conductivity parameters. Thus, the further simulations for the 200 to 400 nm capillaries are conducted with the drift velocity of 0.003 nm/V·s, which has also been applied in [I,II].
4.2. Analysis of the Bulk Depletion Rate
In this subsection, simulations are analyzed to find optimum values for the bulk depletion rates. In Figure 10 the simulations for the 100 nm capillary are carried out with the mobility of 0.001 nm/V·s and the rates of 0.1, 0.2, and 0.3 mHz as indicated in each graph. The upper graphs show transmitted ion fractions, which are rather constant with varying bulk depletion. The data in panel Figure 10b have already been shown in Figure 8a and are found to be favorable in reproducing the experimental data.
This result is confirmed by the mean emission angle plotted in the lower graphs. The experimental profiles from Figure 4 indicate a constant emission angle in agreement with the results in Figure 10e. Similarly, Figure 10f also shows constant emission angles (within numerical fluctuations). In this case of 0.3 the transmitted ions are less intense, but still in reasonable agreement with the experiments. Hence, the simulations involving the rates 0.2 and 0.3 mHz fit the experimental results for 100 nm capillaries in PET. Later we shall choose 0.3 mHz as a favorable parameter for all capillary diameters. Using the expression [59] the value 0.3 mHz yields the bulk conductivity of 10 S/cm, which agrees with the value for PET found in the literature [60].
Surprisingly, in Figure 10d the mean angle indicates significant oscillations within a range larger than . This shows that the emission angle is sensitively dependent on the bulk discharge rate. With the sudden appearance of the oscillatory structures, the question arises for its origin. To search for an answer, we look at the corresponding ion trajectories and charge deposition in Figure 11, where results for different bulk depletion rates are shown. Also, the inserted charges Q are indicated. The calculations are performed with the same parameters as before. The two upper graphs labeled (a) and (ã) in Figure 11 correspond to Figure 10a and the labels b and c are equally associated with Figure 10b,c.
Let us first look at the graphs in Figure 11b,c, which are calculated by means of 0.2 mHz and 0.3 mHz, respectively. The graphs on the right-hand side show, besides a significant entrance charge patch, a rather homogeneous distribution of the deposited charges. There, the inside of the capillary is field free and the ions are moving essentially along the capillary axis. At the exit, they are emitted near 5 in agreement with the corresponding results in Figure 10e,f.
In Figure 11a very different features are observed. After the small charge insertion of Q 1.2 fC, the entrance charge patch is already so strong (due to the weaker charge depletion) that the ions are deflected to the opposite side of the capillary. There, a new charge patch is created, which deflects the ions to the other side producing further charge patches. Finally, in Figure 11a four charge patches are formed including the entrance charge patch. Hence, the ions move along oscillatory trajectories and leave the capillary under varying angles. This is the origin of the oscillatory structures in the emission angle observed in Figure 10d.
The strong oscillatory structures are not consistent with the experimental results for PET capillaries (Figure 4). However, the oscillations are in qualitative agreement with the results for the PC capillaries as can be seen from the 5 curve in Figure 5. (The quantitative agreement is expected to be improved with calculations using a depletion rate between 0.1 and 0.2 mHz. Also, the differences in the inserted ion currents should be taken into account.) The simulations show that the oscillatory structures are strongly dependent on the capillary discharge, Hence, it appears that the differences in the emission angle from PC and PET capillaries can be attributed to different conductivities leading to changes in the capillary discharge. However, the present numbers (0.1 to 0.2 mHz) show that the differences in the discharge rates are relatively small. This is remarkable, since conductivities of highly insulating polymers may differ by orders of magnitude [56,57,58].
As noted from previous work in [I], a significant amount of charge is visible in the upper half of the capillary above the entrance patch (see Figure 7). This migration to the opposite side of the capillary wall is observed to be noticeably smaller in the present cases (Figure 11). This finding originates primarily from the implementation of the Frenkel factor in Equation (8), which selectively enhances the discharge of the entrance charge patch.
Next, we consider the simulations for the capillaries with larger diameters as summarized in Figure 12 for the tilt angle of 5. The results for 200 nm (left-hand figure) and 400 nm (right-hand figure) are shown together, since they reveal similar features. Both figures display transmitted ion fractions in the upper graphs and mean emission angles in the lower ones for the bulk depletion rates 0.2, 0.3, and 0.5 mHz. The transmitted ion fractions are practically constant as can be seen from the values of the equilibrium parameter given in the graphs. As noted above, this constancy is due to the non-linear treatment of the capillary discharge.
On the other hand, the bulk depletion rate influences the mean emission angle as seen in the lower graphs. These exhibit oscillatory structures, for which the amplitudes decrease quasi linearly with the depletion rate. Similar oscillatory structures varying from 4 to 6.5 were observed experimentally as shown in the left-hand part of Figure 3 for 200 nm and in the right-hand part for 400 nm. In Figure 12 these extremes are reproduced by the simulations as seen in both middle panels (e) obtained with 0.3 mHz. Similar results are obtained with simulations for the tilt angle of 3 (not shown here). Hence, the following calculations for all capillaries with diameters from 100 to 400 nm will be carried out with a single depletion rate of 0.3 mHz.
4.3. Dependence on the Tilt Angle
In the following, simulations are performed for different tilt angles. Figure 13 shows ion transmission through 100 nm capillaries (left-hand column) and corresponding mean emission angles (right-hand column) for specific tilt angles. In accordance with the parameter adjustments in the last subsections, the calculations are carried out with the surface drift mobility of 0.001 nm/V·s and the bulk discharge rate of 0.3 mHz. The latter value is chosen to be consistent with the same parameter used for the 200 to 400 nm capillaries.
As expected, the ion fraction at the left-hand side decreases with increasing tilt angle from 0 to 5. In Figure 13a we note the small horizontal curve at 0.53, which refers to the value for 0. The loss in intensity at 0 incidence is due to the divergence of the ion beam as will be discussed in more detail later. For the right-hand side, the emission angle for 5 is constant within the numerical fluctuations. The data have already been shown in Figure 10f and they have been interpreted by means of a homogeneous charge distribution. The mean emission angles for the tilt angles of 2 and 3 exhibit oscillatory structures, which can be explained by the formation of additional charge patches similarly as for the curve in Figure 10d.
The oscillatory structures for the tilt angles of 2 and 3 cannot be compared with experimental results for PET capillaries of 100 nm as they are not available. However, the mean angle curve in Figure 10d can be compared with the corresponding experimental results for PC given in Figure 5. The comparison shows qualitative agreement between the calculated and experimental results similar to those for 5 discussed in the last subsection. However, it is noted that for the tilt angle of 3 the bulk discharge rate is 0.3 mHz whereas for 5 the rate is 0.1 mHz. This shows that the discharge value for PC is not fixed yet and more work is needed to analyze the parameters for PC capillaries.
Next, we turn to the simulations performed for capillaries with diameters of 200 and 400 nm. Figure 14 shows results for both capillary diameters, which are again discussed together as the curves exhibit common features. In both figures the transmitted ion fraction decreases with increasing tilt angle. Please note that the data for 0 tilt angle are given in both panels specified (a). Again, the values are smaller than unity as ions are lost due to the divergence of the incident beam.
For a given tilt angle in Figure 14 the oscillatory structures of the mean emission angle are similar for the 200 and 400 nm capillaries. However, there are characteristic differences: the oscillations for 200 nm capillaries (left-hand figure) reveal more pronounced maxima than those for 400 nm (right-hand figure). Also, corresponding maxima occur at larger charge insertion. Evidently, the oscillatory structures for 400 nm are stretched by about a factor of 4 in comparison with the curves for 200 nm.
A similar stretching factor of ∼4 can be observed for the 200 nm capillaries in comparison with the results for 100 nm in Figure 13. These stretching values are equal to the corresponding ratio of the capillary entrance areas. It appears that the charge patch formation is governed by the density of the incident beam. Also, it is seen that the 100 nm capillaries curves in Figure 13 shows more oscillations than those for 200 and 400 nm.
Moreover, the two panels specified (f) of Figure 14 show that the 7 curve for 200 nm is practically constant, while the corresponding curve for 400 nm reveals strong oscillations. A similar feature is observed when comparing the constant curve for 100 nm in Figure 13f with oscillating curves for 200 and 400 nm in panels (d) of Figure 14. Evidently, for increasing tilt angle, oscillatory structures are favorably produced with capillaries of larger diameter.
The properties of the mean emission angle can also be compared with the experimental results displayed in Figure 3. The 5 curves for both 200 nm and 400 nm in panels (d) of Figure 14 were already found to be in good agreement with the corresponding experimental curves for the tilt angle of 5. Similarly, the calculated 3 curves compare reasonably well with the experimental data. This provides confidence that the experimental results for different capillary diameters and tilt angles can be reproduced with one set of discharge parameters. The only exception is the calculated 7 curve given in Figure 14f for 400 nm, which shows significantly stronger oscillations than the corresponding experimental results in the right-hand graph of Figure 3.
Figure 15 presents calculations of the ion trajectories and deposited charges, which provide information of what happens inside the capillaries. The left-hand figure is obtained with a capillary diameter of 200 nm and the right-hand figure with 400 nm. First, we compare the left-hand figure with the previous simulations in Figure 7. Both sets of data calculated with the diameter of 200 nm and the tilt angle of 3, while the discharge parameters are different. The simulations in Figure 7 and Figure 15 are performed with the drift mobilities of 0.003 and 0.01 nm/V·s and the depletion rates of 0.3 and 0.4 mHz, respectively. As mentioned, the previous results in [I] were calculated without the Frenkel factor. However, the Frenkel factor is implemented in Equation (8) enhancing the present value of 0.3 mHz by about a factor of three so that it is increased to ∼0.9 mHz.
Hence, the present calculations are performed with a lower surface drift mobility and a higher bulk depletion rate. These changes influence the simulations in a characteristic manner. As mentioned from the previous calculations, the migration of the entrance charges patch to the opposite side of the capillary wall is a strong effect reducing the self-organized deflection of the incident ions (see Figure 7). In Figure 15 the smaller drift mobility causes less migration to the upper capillary wall. Moreover, the higher bulk discharge reduces the entrance charge patch. Nevertheless, the mean emission angle shows oscillatory structures in accordance with the previous work in [I]. However, in the present work, the secondary charge patches are less intense and the amplitudes of the oscillations are less pronounced. These features are in better agreement with the experiments, showing that the present discharge parameters are more suitable than those used in [I].
On the right-hand side of Figure 15 the simulations for the diameter of 400 nm are displayed. The entrance charge patch is relatively weak and the migration to the upper capillary wall is negligibly small. The ions are directly deflected to the capillary exit without much touching the upper capillary wall as seen from Figure 15b,c. Hence, the charge patch at the opposite wall is relatively weak and further charge patches are not produced. This is the explanation for the relatively small ion emission at angles smaller than 3 and the limited number of oscillations occurring for the 400 nm capillaries. These results of the simulations confirm the specific features experimentally observed for the capillaries of larger diameter.
In the charge distributions for both 200 and 400 nm capillaries we can observe a striking phenomenon, which is due to a remarkable reduction of the entrance charge patches. From geometrical measures at the beginning of the beam insertion, the entrance charge patches are expected to be produced with the geometric length of (where again d is the capillary diameter and is the tilt angle). This length is about equal to 4 μm and 8 μm inside the 200 and 400 nm capillaries, respectively, as can be seen from both graphs labeled (a) in Figure 15. With increasing beam insertion the entrance charge patch shrinks ending up with a size as small as 1 μm as shown in the graphs labeled (f). This effect is produced by the increasing deflection of the ions which inhibit the deposition of charges further inside the capillary. Surprisingly, this shrinking is less important for larger tilt angles so that the charge patch extension increases with tilt angle in contrast to its initial geometrical size [44].
4.4. Guiding Angle and Guiding Power
To gain more information about the ion-guiding mechanism, specific quantities of the present simulations will be considered. First, guiding angles are determined for the different capillary diameters providing information about the guiding power of these capillaries. In Figure 16 the transmitted Ne ion fractions at equilibrium are displayed as a function of the tilt angle. The data are obtained for different capillary diameters from the values of given in Figure 13 and Figure 14. The results of the simulations are plotted as points and the evaluations from the fit formula (1) are given as solid lines. The simulations agree well with the fit curves, which represent Gaussian functions with two fit parameters, i.e., the ion fraction at zero tilt angle and the guiding angle .
In Figure 17a the fit parameters from the simulations are shown as open data points. These data are found to be noticeably smaller than unity indicating that a significant part of the ions are lost at the capillary wall even when they are incident parallel to the capillary axis. Please note that about 50% of the ions stay within the 100 nm capillary. As mentioned before, this loss is due to the divergence of the incident beam, which is equal to 0.25 FWHM.
The reduced ion fraction at zero-degree tilt angle can accurately be described by an empirical expression given in the appendix of Ref. [38]:
for ≤ 1 and elsewhere. The exponent 1.38 is an empirical value. The relative divergence angle tan/tan is normalized by the aspect ratio tan where d is again the capillary diameter and L its length. The results of the model calculations from Equation (9) are plotted as a solid line in Figure 17a, which are in remarkable agreement with the simulations. Also, experimental values are shown as solid points taken from Figure 6 and Ref. [7]. The zero-degree data are divided by the capillary tube area, to relate them to beam density, and the experimental result for 400 nm capillaries is normalized to the theoretical value of 0.88 (Figure 17). In general, the experimental data exhibit good agreement with the theoretical values (both model and simulations). In some cases, the experimental data show discrepancies which are due to uncertainty of the diameter determination of the PET capillaries.
The important fit parameter from Equation (1) is the guiding angle specifying the guiding power of the capillaries. Figure 17b shows from the fit of the simulations as a function of the capillary diameter. The theoretical results are compared with experimental data obtained from the fit curves in Figure 6. The values for the diameters of 100 and 200 nm agree reasonably well, while for 300 and 400 nm deviations are observed, which lie significantly outside the experimental uncertainties. Hence, the results of the simulations increase more strongly with the capillary diameter than the experimental data. At present, this finding cannot be explained and needs further studies.
4.5. Rates for Surface and Bulk Discharge
Finally, the rates for the depletion of the deposited charges within the capillaries shall be analyzed. This is done to separate the contributions of the charge migration along the surface and into the bulk. So far, we considered the basic parameters responsible for the surface and bulk conductivity, i.e., the surface drift mobility and the bulk discharge rate . These constant quantities, given in Table 4, are enhanced by the Frenkel factor implemented in Equations (6) and (8). The Frenkel factor is a dynamic quantity, since it depends on the electric field in the capillary, which increases with the increasing charge deposition.
To obtain information about the discharges within the capillary interior by the surface and bulk conductivity, it is useful to compare the bulk discharge rate with the corresponding surface rate governed by the surface drift mobility . In particular, the inverse surface rate is approximately equal to the time, which is needed to move the charge from the entrance patch center to the capillary entrance, where it is depleted by the conducting layer. Hence, the quantity is also a dynamic parameter, as it depends on the field driving the charges along the surface as well as on the position of the entrance charge patch.
The dynamic rates and are calculated as side results during the simulations. The value for is obtained as the number of positive charges reaching per unit time the conducting layers at the capillary entrance, divided by the total number of charges accumulated at the capillary wall. Similarly, the value for is obtained as the number of charges depleted in the bulk per unit time, divided by same the number of charges deposited on the capillary wall. The dynamic rates and increase somewhat at the beginning of the charge insertion but they remain constant after equilibrium is reached.
In Table 4 the parameters and are given for the different capillary diameters. The surface value of 0.15 mHz for the 100 nm diameter is relatively small, caused by the smaller drift mobility. Otherwise, the rates increase only slightly with the capillary diameter, which is attributed to an increase of the electric field enhancing the Frenkel factor. On the other hand, the values for the dynamic bulk rate indicate that the Frenkel factor increases the basic bulk rate by factors of about 2–4. From Table 4 the ratio is seen to be constant within the numerical fluctuations. Its value of ∼4 implies that the bulk discharge is definitely more important than the depletion via the surface charge migration.
Information about the total discharge rate can also be obtained in a more direct manner. The time evolution of the charge in the entrance patch can be approximated by
where is the accumulated charge in the entrance patch and is the corresponding charge for [38]. With the assumption that the accumulated charge is proportional to the transmitted ion fraction, and can be replaced by and respectively. Hence, we recover Equation (3) and comparison of the exponent yields
where is the beam reduction factor due to the ion fraction that is lost by the passage through the capillary [59].
For 100 nm capillaries, 10 fA is the incident ion beam from Equation (2), fC is the characteristic charge from Equation (3), and is the transmitted ion fraction. The two latter parameters are obtained from the fit of the simulated data in Figure 8a. Inserting these values into Equation (11), the total discharge value is obtained as 0.88 mHz, which agrees well with the value of 0.83 in Table 4 for 100 nm. It should be added that this method can also be used to obtain from the fit of Equation (3) to measured data, as in Figure 1, so that a direct method exists to determine the discharge parameters from experiments.
5. Discussion and Conclusions
The simulations of the ion trajectories provide several new insights into the ion-guiding mechanisms through highly insulating capillaries. The simulations were carried out for systematic studies to obtain general information about the capillaries of different diameters. Both charge migrations along the surface and into the bulk were implemented to describe the relaxation of the deposited charges in the capillary. The discharge process affects primarily the entrance patch as it contains most deposited charges.
The fundamental mechanism governing the ion-guiding concerns the self-organized formation of the entrance charge patch. At the beginning of the charge patch creation the entrance field weakly deflects the ions, which inhibits the charge deposition further inside the capillary and, thus, limits the length of the charge patch. After additional charge deposition the ions are more deflected hitting the opposite capillary wall where they form a secondary charge patch which, in turn, may create further charge patches inside the capillary. Each charge patch produces an extreme in the ion emission pattern (minima and maxima). It is shown that the number of charge patches increases with decreasing capillary diameter. The 400 nm capillary exhibits 2 charge patches including the entrance patch, while the 200 and 100 nm capillaries contain 3 and 4 charge patches, respectively. Accordingly, the oscillatory structures become richer with decreasing diameter.
The surface charge transport was modeled by means of the drift mobility of holes hopping between traps. The traps are primarily due to impurities in the polymer. Since the mobility is based on a hopping mechanism, it is strongly dependent on the depth of the traps involved. In general, the mobility is determined by experimental methods where free charge carriers in PET are excited by external particle impact (photons [56] or electrons [58]) assuming that the permanent number of charge carriers is negligible. Similar conditions are assumed for the present simulations, for which holes are produced by the incident ions depositing positive charge clusters on a surface. On the other hand, the bulk conductivity was described by a simple model based on a fixed decay rate enhanced by the exponential Frenkel factor. The bulk geometry in the vicinity of a capillary, including conducting layers and neighbor capillaries, is so complex that it is difficult to describe the bulk discharge in greater detail.
The surface drift mobility and bulk relaxation rate, which are responsible for the discharge of the capillary interior, were treated as unknown parameters. These were determined by comparison of the simulations with experimental results. The PET capillaries, used in the experiments, were manufactured from the same foil sample so that the surface and bulk conductivities are expected to be equal for different tube diameters. Hence, to determine the two unknown parameters we need (at least) two independent measurements.
The drift velocity was determined from the calculations with 100 nm capillaries showing a strong mobility dependence of the transmitted ion fraction favoring the lowest mobility value used in the simulations. The chosen value can be considered to be an upper limit so that a smaller mobility could be used. In principle, the present work even allows for the conclusion that the surface charge transport can be neglected in comparison with the bulk conductivity. However, such conclusion would be against the common opinion about the importance of the surface conductivity for nanocapillaries, which can be found in various articles summarized by [37,38]. Simulations with 200 and 400 nm capillaries revealed that the transmitted ion intensity is nearly independent of the drift mobility and, thus, its variation does not provided sufficient information to determine its value. Nevertheless, the simulations showed that for 200 to 400 nm a somewhat higher mobility is favored in comparison with that of 100 nm. This difference is comprehensible as the surface mobility is strongly dependent on contaminations produced by different surface treatments for the samples from the same PET foil.
The insensitivity of the transmitted ion fraction on the drift mobility is a phenomenon which is attributed to the non-linear dependence of the surface charge transport on the driving electric field. This phenomenon has already been observed experimentally and in previous simulations [I]. Thus, to determine the parameter for the bulk discharge a different method was used. This method consists of the analysis of the oscillatory structures observed for the emission angles of the transmitted ions. Thus, we obtained the value of 0.3 mHz which was found to be common to all capillary diameters and tilt angles. The analysis shows that the oscillatory structures change significantly when the bulk relaxation was varied by 0.1 mHz. Hence, we may conclude that the uncertainty of the discharge value is equal to about ±0.05 mHz, which allows for the determination of rather precise rates.
The bulk discharge rate was found to be a factor of ∼4 larger than the surface discharge rate. This is a remarkable result since in the literature it is generally assumed for nanocapillaries that the surface relaxation is dominant [37,38]. Also, the importance of the bulk discharge contrasts with the simulations in [I] where the depletion via the surface charge transport was suggested to be the dominant process. However, in that work the two discharge modes were not analyzed in detail. Also, in [I] the simulation predicted a strong migration of the entrance charge patch to the opposite side of the capillary wall, for which the effect was not sufficiently understood. In the present work, this circular migration perpendicular to the capillary axis is found to be less significant. In particular, the present work reveals that the bulk discharge is more important than the charge depletion via the surface charge drift. This unexpected finding calls for further studies investigating the discharge properties of nanocapillaries.
Funding
This research received no external funding
Acknowledgments
I would like to thank my collaborators participating in the experiments at the ZERNIKE-LEIF ECR facility in Groningen, in particular Béla Sulik, Erwin Bodewits, and Ronnie Hoekstra. I am much indebted to Eric Giglio for exciting discussions about the mechanisms of capillary guiding. Comments on the manuscript by John Tanis are gratefully acknowledged.
Conflicts of Interest
The author declares no conflict of interest.
References
- Stolterfoht, N.; Bremer, J.H.; Hoffmann, V.; Hellhammer, R.; Fink, D.; Petrov, A.; Sulik, B. Transmission of 3 keV Ne7+ ions through nanocapillaries etched in polymer foils: Evidence for capillary guiding. Phys. Rev. Lett. 2002, 88, 133201. [Google Scholar] [CrossRef] [PubMed]
- Stolterfoht, N.; Hellhammer, R.; Pešić, Z.D.; Hoffmann, V.; Bundesmann, J.; Petrov, A.; Fink, D.; Sulik, B. Guided transmission of Ne7+ ions through nanocapillaries in PET: Dependence on the tilt angle. Vacuum 2004, 73, 31–37. [Google Scholar] [CrossRef]
- Víkor, G.; Kumar, R.R.; Pešić, Z.; Stolterfoht, N.; Schuch, R. Guiding of slow highly charged ions by nanocapillaries in PET. Nucl. Instrum. Methods Phys. Res. B 2005, 233, 218–221. [Google Scholar] [CrossRef]
- Stolterfoht, N.; Hellhammer, R.; Bundesmann, J.; Fink, D.; Kanai, Y.; Hoshino, M.; Kambara, T.; Ikeda, T.; Yamazaki, Y. Guiding of slow Ne7+ ions through nanocapillaries in insulating PET polymers: Incident current dependence. Phys. Rev. A 2007, 76, 022712. [Google Scholar] [CrossRef]
- Kanai, Y.; Hoshino, M.; Kambara, T.; Ikeda, T.; Hellhammer, R.; Stolterfoht, N.; Yamazaki, Y. Two-dimensional images of transmitted slow neon ions gudided by nanocapillaries in polymer foils. Nucl. Instrum. Methods Phys. Res. B 2007, 258, 155–158. [Google Scholar] [CrossRef]
- Stolterfoht, N.; Hellhammer, R.; Juhász, Z.; Sulik, B.; Bayer, V.; Trautmann, C.; Bodewits, E.; de Nijs, A.J.; Dang, H.M.; Hoekstra, R. Guided transmission of Ne7+ ions through nanocapillaries in insulating polymers: Scaling laws for projectile energies up to 50 keV. Phys. Rev. A 2009, 79, 042902. [Google Scholar] [CrossRef]
- Stolterfoht, N.; Hellhammer, R.; Juhász, Z.; Sulik, B.; Bodewits, E.; Dang, H.M.; Hoekstra, R. Guided transmission of Ne7+ ions through nanocapillaries in insulating polymers: Dependence on the capillary diameter. Phys. Rev. A 2010, 82, 052902. [Google Scholar] [CrossRef]
- Juhász, Z.; Sulik, B.; Rácz, R.; Biri, S.; Bereczky, R.J.; Tökési, K.; Köver, Á.; Pálinkás, J.; Stolterfoht, N. Ion guiding accompanied by formation of neutrals in polyethylene terephthalate polymer nanocapillaries: Further insight into a self-organizing process. Phys. Rev. A 2010, 82, 062903. [Google Scholar] [CrossRef]
- Li, D.; Wang, Y.; Zhao, Y.; Xiao, G.; Zhao, D.; Xu, Z.; Li, F. The influence of the charged back side on the transmission of highly charged ions through PC nanocapillaries. Nucl. Instrum. Methods Phys. Res. B 2009, 267, 469–473. [Google Scholar] [CrossRef]
- Sahana, M.B.; Skog, P.; Víkor, G.; Rajendra-Kumar, R.T.; Schuch, R. Guiding of highly charged ions by highly-ordered SiO2 nanocapillaries. Phys. Rev. A 2006, 73, 040901(R). [Google Scholar] [CrossRef]
- Mátéfi-Tempfli, S.; Mátéfi-Tempfli, M.; Piraux, L.; Juhász, Z.; Biri, S.; Fekete, É.; Iván, I.; Gáll, F.; Sulik, B.; Víkor, G.; et al. Guided transmission of slow Ne6+ ions through the nanochannels of highly ordered anodic alumina. Nanotechnology 2006, 17, 3915–3920. [Google Scholar] [CrossRef]
- Skog, P.; Soroka, I.L.; Johansson, A.; Schuch, R. Guiding of highly charged ions through Al2O3 nanocapillaries. Nucl. Instrum. Methods Phys. Res. B 2007, 258, 145–149. [Google Scholar] [CrossRef]
- Chen, Y.F.; Chen, X.M.; Lou, F.J.; Zhang, J.Z.; Shao, J.X.; Sun, G.Z.; Wang, J.; Xi, F.Y.; Yin, Y.Z.; Wang, X.A.; et al. Guiding of 60 keV O6+ ions through nanocapillaries in uncoated Al2O3 membrane. Chin. Phys. B 2009, 18, 2739. [Google Scholar]
- Juhász, Z.; Sulik, B.; Biri, S.; Iván, I.; Tökési, K.; Fekete, É.; Mátéfi-Tempfli, S.; Mátéfi-Tempfli, M.; Víkor, G.; Takács, E.; et al. Ion guiding in alumina capillaries: MCP images of the transmitted ions. Nucl. Instrum. Methods Phys. Res. B 2009, 267, 321–325. [Google Scholar] [CrossRef]
- Zhang, H.Q.; Akram, N.; Skog, P.; Soroka, I.; Trautmann, C.; Schuch, R. Tailoring of keV-ion beams by image charge when transmitting through rhombic and rectangular shaped nanocapillaries. Phys. Rev. Lett. 2012, 108, 193202–193205. [Google Scholar] [CrossRef]
- Zhang, H.Q.; Akram, N.; Schuch, R. Transmission of highly charged ions through mica nanocapillaries of rectangular cross-section. Nucl. Instrum. Methods Phys. Res. B 2017, 408, 61–66. [Google Scholar] [CrossRef]
- Milosavljević, A.R.; Víkor, G.; Pešić, Z.D.; Kolarž, P.; Šević, D.; Marinković, B.P.; Mátéfi-Tempfli, S.; Mátéfi-Tempfli, M.; Piraux, L. Guiding of low-energy electrons by highly ordered Al2O3 nanocapillaries. Phys. Rev. A 2007, 75, 030901(R). [Google Scholar] [CrossRef]
- Das, S.; Dassanayake, B.S.; Winkworth, M.; Baran, J.L.; Stolterfoht, N.; Tanis, J.A. Inelastic guiding of electrons in polymer nanocapillaries. Phys. Rev. A 2007, 76, 042716. [Google Scholar] [CrossRef]
- Wickramarachchi, S.J.; Ikeda, T.; Dassanayake, B.S.; Keerthisinghe, D.; Tanis, J. Electron-beam transmission through a micrometer-sized tapered-glass capillary: Dependence on incident energy and angular tilt angle. Phys. Rev. A 2016, 94, 022701. [Google Scholar] [CrossRef]
- Ikeda, T.; Kanai, Y.; Kojima, T.M.; Iwai, Y.; Kambara, T.; Yamazaki, Y.; Hoshino, M.; Nebiki, T.; Narusawa, T. Production of a microbeam of slow highly charged ions with a tapered glass capillary. Appl. Phys. Lett. 2006, 89, 163502. [Google Scholar] [CrossRef] [Green Version]
- Ikeda, T.; Kojima, T.M.; Iwai, Y.; Kanai, Y.; Kambara, T.; Nebiki, T.; Narusawa, T.; Yamazaki, Y. Production of a nm sized slow HCI beam with a guiding effect. J. Phys. Conf. Ser. 2007, 58, 68–72. [Google Scholar] [CrossRef]
- Cassimi, A.; Muranaka, T.; Maunoury, L.; Lebius, H.; Manil, B.; Huber, B.A.; Ikeda, T.; Kanai, Y.; Kojima, T.M.; Iwai, Y.; et al. Multiply-charged ion nanobeams. Int. J. Nanotechnol. 2008, 5, 809–817. [Google Scholar] [CrossRef]
- Cassimi, A.; Ikeda, T.; Maunoury, L.; Zhou, C.L.; Guillous, S.; Mery, A.; Lebius, H.; Benyagoub, A.; Grygiel, C.; Khemliche, H.; et al. Dynamics of charge evolution in glass capillaries for 230-keV Xe23+ ions. Phys. Rev. A 2012, 86, 062902. [Google Scholar] [CrossRef]
- Gruber, E.; Stolterfoht, N.; Allinger, P.; Wampla, S.; Wang, Y.; Simon, M.J.; Aumayr, F. Temperature control of ion guiding through tapered capillaries. Nucl. Instrum. Methods Phys. Res. B 2014, 340, 1–4. [Google Scholar] [CrossRef]
- Giglio, E.; DuBois, R.; Cassimi, A.; Tökési, K. Low energy ion transmission through a conical insulating capillary with macroscopic dimensions. Nucl. Instrum. Methods Phys. Res. B 2015, 354, 82–85. [Google Scholar] [CrossRef]
- DuBois, R.D.; Tökési, K.; Giglio, E. Charge deposition, redistribution, and decay properties of insulating surfaces obtained from guiding of low-energy ions through capillaries. Phys. Rev. A 2019, 99, 062704. [Google Scholar] [CrossRef] [Green Version]
- Bereczky, R.; Kowarik, G.; Aumayr, F.; Tökési, K. Transmission of 4.5 keV Ar9+ ions through a single glass macro-capillary. Nucl. Instrum. Methods Phys. Res. B 2009, 267, 317–320. [Google Scholar] [CrossRef]
- Nakayama, R.; Tona, M.; Nakamura, N.; Watanabe, H.; Yoshiyasu, N.; Yamada, C.; Yamazaki, A.; Ohtani, S.; Sakurai, M. Guiding and blocking of highly charged ions through a single glass capillary. Nucl. Instrum. Methods Phys. Res. B 2009, 267, 2381–2384. [Google Scholar] [CrossRef]
- Gruber, E.; Kowarik, G.; Ladening, F.; Waclawek, J.P.; Aumayr, F.; Bereczky, R.J.; Tökési, K.; Gunacker, P.; Schweigler, T.; Lemell, C.; et al. Temperature control of ion guiding through insulating capillaries. Phys. Rev. A 2012, 86, 062901–062908. [Google Scholar] [CrossRef] [Green Version]
- Nagy, G.U.L.; Giglio, E.; Rajta, I.; Tökési, K. Transmission dynamics of 1 MeV H+ microbeam guided through an insulating macrocapillary. Nucl. Instrum. Methods Phys. Res. B 2019, 460, 216. [Google Scholar] [CrossRef]
- Nagy, G.U.L.; Rajta, I.; Tökési, K. Temporal evolution of the energy spectrum of proton beam guided through an insulating macrocapillary. Nucl. Instrum. Methods Phys. Res. B 2019, 458, 7–11. [Google Scholar] [CrossRef]
- Liu, S.D.; Zhao, Y.T. Simulations of transmission of 1 MeV protons through an insulating macrocapillary. J. Phys. D 2019, 53, 075103. [Google Scholar] [CrossRef]
- Kojima, T.M.; Ikeda, T.; Kanai, Y.; Yamazaki, Y.; Esaulov, V.A. Ion beam guiding with straight and curved teflon tubes. J. Phys. D 2011, 44, 355201. [Google Scholar] [CrossRef]
- Kojima, T.M. Ion guiding in macro-size insulating capillaries: straight, tapered, and curved shapes. J. Phys. B 2018, 51, 1042001. [Google Scholar] [CrossRef]
- Pokhil, G.P.; Cherdyntsev, V.V. Model of the Dynamics of Ion Propagation through Dielectric Capillaries. J. Surf. Investig. X-ray Synchrotron Neutron Tech. 2013, 7, 356–361. [Google Scholar] [CrossRef]
- Vokhmyanina, K.; Sotnikova, V.; Sotnikov, A.; Kaplii, A.; Nikulicheva, T.; Kubankin, A.; Kishin, I. Modeling the process of interaction of 10?keV electrons with a plane dielectric surface. Nucl. Instrum. Methods Phys. Res. B 2018, 422, 91–93. [Google Scholar] [CrossRef]
- Lemell, C.; Burgdörfer, J.; Aumayr, F. Interaction of charged particles with insulating capillary targets—The guiding effect. Progr. Surf. Sci. 2013, 88, 237–278. [Google Scholar] [CrossRef]
- Stolterfoht, N.; Yamazaki, Y. Guiding of charged particles through capillaries in insulating materials. Phys. Rep. 2016, 629, 1–107. [Google Scholar] [CrossRef]
- Schiessl, K.; Palfinger, W.; Lemell, C.; Burgdörfer, J. Simulation of guiding of highly charged projectiles through insulating nanocapillaries. Nucl. Instrum. Methods Phys. Res. B 2005, 232, 228–234. [Google Scholar] [CrossRef] [Green Version]
- Schiessl, K.; Palfinger, W.; Tökési, K.; Nowotny, H.; Lemell, C.; Burgdörfer, J. Simulation of guiding of multiply charged projectiles through insulating capillaries. Phys. Rev. A 2005, 72, 062902. [Google Scholar] [CrossRef] [Green Version]
- Schiessl, K.; Lemell, C.; Tökési, K.; Burgdörfer, J. Energy dependence of ion guiding through nanocapillaries. J. Phys. Conf. Ser. 2009, 163, 012081. [Google Scholar] [CrossRef] [Green Version]
- Pokhil, G.P.; Vokhmyanina, K.A. Drift Model of Ion Beam Guiding Using Capillaries. J. Surf. Investig. X-ray Synchrotron Neutron Tech. 2008, 2, 237–240. [Google Scholar] [CrossRef]
- Stolterfoht, N. Simulation and analysis of ion guiding through a nanocapillary in insulating polymers. Phys. Rev. A 2013, 87, 012902. [Google Scholar] [CrossRef]
- Stolterfoht, N. Simulation and analytic models of ion guiding through a nanocapillary in insulating polymers. Phys. Rev. A 2013, 87, 032901. [Google Scholar] [CrossRef]
- Liu, S.D.; Zhao, Y.T.; Wang, Y.Y. Simulations of guiding of low-energy ions through a single nanocapillary in insulating materials. Chin. Phys. B 2017, 26, 106104. [Google Scholar] [CrossRef]
- Frenkel, J. On pre-breakdown phenomena in insulators and electronic semi-conductors. Phys. Rev. 1938, 54, 647–648. [Google Scholar] [CrossRef]
- Giglio, E.; Tökési, K.; DuBois, R.D. Relaxation dynamics of charge patches formed inside an insulating capillary by ion impact. Nucl. Instrum. Methods Phys. Res. B 2019, 460, 234. [Google Scholar] [CrossRef]
- Giglio, E. Charge relaxation rates in insulating straight capillaries. Phys. Rev. A 2020, 101, 052707. [Google Scholar] [CrossRef]
- Skog, P.; Zhang, H.; Schuch, R. Evidence of sequentially formed charge patches guiding ions through nanocapillaries. Phys. Rev. Lett. 2008, 101, 223202. [Google Scholar] [CrossRef]
- Kanai, Y.; Hoshino, M.; Kambara, T.; Ikeda, T.; Hellhammer, R.; Stolterfoht, N.; Yamazaki, Y. Guiding of slow highly charged ions through nanocapillaries - dynamic aspect. J. Phys. Conf. Ser. 2009, 194, 012068. [Google Scholar] [CrossRef]
- Stolterfoht, N.; Hellhammer, R.; Fink, D.; Sulik, B.; Juhász, Z.; Bodewits, E.; Dang, H.M.; Hoekstra, R. Dynamic properties of ion guiding through nanocapillaries in an insulating polymer. Phys. Rev. A 2009, 79, 022901. [Google Scholar] [CrossRef]
- Zhang, H.; Skog, P.; Schuch, R. Dynamics of guiding highly charged ions through SiO2 nanocapillaries. Phys. Rev. A 2010, 82, 052901. [Google Scholar] [CrossRef]
- Stolterfoht, N.; Hellhammer, R.; Sulik, B.; Juhász, Z.; Bayer, V.; Trautmann, C.; Bodewits, E.; Hoekstra, R. Evidence of blocking effects on 3-keV Ne7+ ions guided through nanocapillaries in polycarbonate. Phys. Rev. A 2011, 83, 062901. [Google Scholar] [CrossRef]
- Unipan, M.; Robin, A.; Winters, D.F.A.; Morgenstern, R.; Hoekstra, R. Probing local spin ordering at surfaces by He2+ ions. Phys. Rev. A 2006, 74, 062901. [Google Scholar] [CrossRef]
- Stolterfoht, N.; Hellhammer, R.; Bundesmann, J.; Fink, D. Scaling laws for guiding of highly charged ios through nanocapillaries in an insulating polymer. Phys. Rev. A 2008, 77, 032905. [Google Scholar] [CrossRef]
- Gill, W.D. Drift mobilities in amorphous charge transfer complexes of trinitrofluorenone and poly-n-vinylcarbazole. J. Appl. Phys. 1972, 43, 5033–5040. [Google Scholar] [CrossRef]
- Davies, D.K. Carrier transport in polyethene. J. Phys. D 1972, 5, 162–168. [Google Scholar] [CrossRef]
- Hayashi, K.; Yoshino, K.; Inuishi, Y. Carrier mobilty in insulating polymers measured by time of flight method. Jpn. J. Appl. Phys. 1975, 14, 39–45. [Google Scholar] [CrossRef]
- Stolterfoht, N. Simulations of ion guiding through a straight macrocapillary: interpretation of an experiment and comparison with nanocapillaries. Phys. Rev. A 2014, 89, 062706. [Google Scholar] [CrossRef]
- Zhang, H.; He, S.; Chen, C.; Zheng, W.; Yan, Q. Electrical Conductivity of Melt Compounded Functionalized Graphene Sheets Filled Polyethyleneterephthalate Composites. In Physics and Applications of Graphene; Mikhailov, S., Ed.; IntechOpen: Rijeka, Croatia, 2011; Chapter 16. [Google Scholar] [CrossRef] [Green Version]
Figure 1.
Fraction of 3-keV Ne ions transmitted through PET capillaries with the diameter of 100 nm. The points are experimental data fitted by Equation (3) where is the equilibrium value and is the characteristic charge. Data taken from Ref. [53].

Figure 2.
Transmission profiles and mean angle for 3 keV Ne ions transmitted through capillaries of 200 nm diameter and 12 μm length. The tilt angle is 5°. In the left-hand column the profiles are shown for increasing charge inserted before the curves were measured. The profiles were fitted by a sum of Gaussian functions given as solid lines. The right-hand column shows the corresponding mean emission angle. The labels (a)–(e) in the left column correspond to those given in the right column. The arrow labeled indicates the incident charge for which ∼63% of the equilibrium intensity of the transmitted ions is reached. Taken from Ref. [51].

Figure 3.
Mean emission angle of the transmitted Ne ions as a function of the inserted charge for capillaries of different diameter d. [Left] 200 nm. The tilt angles are 0, 3, and 5 as indicated in the graphs. [Right] 400 nm. The tilt angles are 3, 5, and 6.5. The arrows labeled specify characteristic charges (see text). Data taken from Ref. [51].

Figure 4.
Transmission profiles of 3-keV Ne ions for capillaries with a diameter of 100 nm. The tilt angle is . The profiles were measured just after the insertion of the charge Q given in each graph. The profiles are fitted by Gaussians drawn as solid lines. Data taken from Ref. [7].
Figure 4.
Transmission profiles of 3-keV Ne ions for capillaries with a diameter of 100 nm. The tilt angle is . The profiles were measured just after the insertion of the charge Q given in each graph. The profiles are fitted by Gaussians drawn as solid lines. Data taken from Ref. [7].

Figure 5.
Mean emission angle of the transmitted 3-keV Ne ions through capillaries in PC for tilt angles of 3 and 5 indicated in the graphs. The capillary diameter is 100 nm and its length is 10 μm. The horizontal dashed lines represent the central angle equal to the tilt angle. Data are extracted from Ref. [53].

Figure 6.
Total yield of Ne ions as a function of the tilt angle . The data were measured for different capillary diameters as indicated on the curves. The solid lines represent Gaussian fit functions from Equation (1). Data are taken from Ref. [7].

Figure 7.
Trajectories of 3 keV Ne ions (left-hand panels) and corresponding distributions for the deposited charges (right-hand panels). The capillary diameter is 200 nm and the tilt angle is 3. The drift mobility is 0.01 nm/V·s and the bulk depletion rate is 0.4 mHz. The inserted charge is indicated in each panel. Taken from Ref. [44].

Figure 8.
Transmission of 3-keV Ne ions through capillaries with a diameter of 100 nm. The bulk depletion rate is 0.2 mHz and the tilt angle is 5. The drift mobilities (i), (ii), and (iii) are specified in Table 3. The upper and lower graphs show the transmitted ion fraction and the mean ion emission angle, respectively. The value of is equal to the equilibrium fraction.

Figure 9.
Transmission of 3-keV Ne ions through capillaries with a diameter of 400 nm. The bulk depletion rate is 0.3 mHz and the tilt angle is 5. The drift mobilities (i), (ii), and (iii) are specified in Table 3. The upper and lower graphs show the transmitted ion fraction and the mean ion emission angle, respectively. The value of is equal to the equilibrium fraction.

Figure 10.
Transmission of 3-keV Ne ions through capillaries with a diameter of 100 nm. The drift mobility is 0.001 nm/V·s and the tilt angle is 5. The bulk depletion rate is specified in each panel. The upper and lower graphs show the transmitted ion fraction and the mean ion emission angle, respectively. The value of is equal to the equilibrium fraction.

Figure 11.
Trajectories of 3 keV Ne (left-hand panels) and corresponding distributions for the deposited charges (right-hand panels). The parameters are the same as those used in Figure 10. The bulk depletion rates and the inserted charge Q are indicated in the graphs.
Figure 11.
Trajectories of 3 keV Ne (left-hand panels) and corresponding distributions for the deposited charges (right-hand panels). The parameters are the same as those used in Figure 10. The bulk depletion rates and the inserted charge Q are indicated in the graphs.

Figure 12.
Transmission of 3-keV Ne ions through capillaries with diameters of 200 nm (left-hand figure) and 400 nm (right-hand figure). The drift mobility is 0.003 nm/V·s and the tilt angle is 5. The bulk depletion rate is specified in each panel. In both figures the upper and lower graphs displays the transmitted ion fraction and the mean ion emission angle, respectively. The values for the equilibrium fraction of are obtained from fits with Equation (3).

Figure 13.
Transmission of 3-keV Ne ions through capillaries with a diameter of 100 nm. The drift mobility is 0.001 nm/V·s and bulk depletion rate 0.3 mHz. The tilt angles are 2 3 and 5 as specified in each panel. The left-hand and right-hand graphs show the transmitted ion fraction and the mean ion emission angle, respectively. The value of is equal to the equilibrium fraction.

Figure 14.
Transmission of 3-keV Ne ions through capillaries with a diameter of 200 nm (left) and 400 nm (right). The drift mobility is 0.003 nm/V·s and bulk depletion rate 0.3 mHz. The tilt angles are 0, 3, 5, and 7 as specified in each panel. The left-hand and right-hand columns in each figure show the transmitted ion fraction and the mean ion emission angle, respectively. The value of is equal to the equilibrium fraction.

Figure 15.
Trajectories of 3 keV Ne and corresponding distributions for the deposited charges. The capillary diameters are 200 nm (left-hand) and 400 nm (right-hand). The tilt angle is 3: The discharge parameters are 0.003 nm/V·s and 0.3 mHz (see text). The inserted charge is indicated in each panel.

Figure 16.
Transmitted Ne ion fraction at equilibrium as a function of the tilt angle . The capillary diameter is indicated at each curve. The results from the simulations are given as points. The solid line represent fit values from Equation (1).
Figure 16.
Transmitted Ne ion fraction at equilibrium as a function of the tilt angle . The capillary diameter is indicated at each curve. The results from the simulations are given as points. The solid line represent fit values from Equation (1).

Figure 17.
In (a) the ion fraction transmitted at is plotted as a function of the capillary diameter. The solid line results from Equation (9). In (b) the guiding angle is shown. The open points refer to the simulations and the solid points represent experimental results.
Figure 17.
In (a) the ion fraction transmitted at is plotted as a function of the capillary diameter. The solid line results from Equation (9). In (b) the guiding angle is shown. The open points refer to the simulations and the solid points represent experimental results.


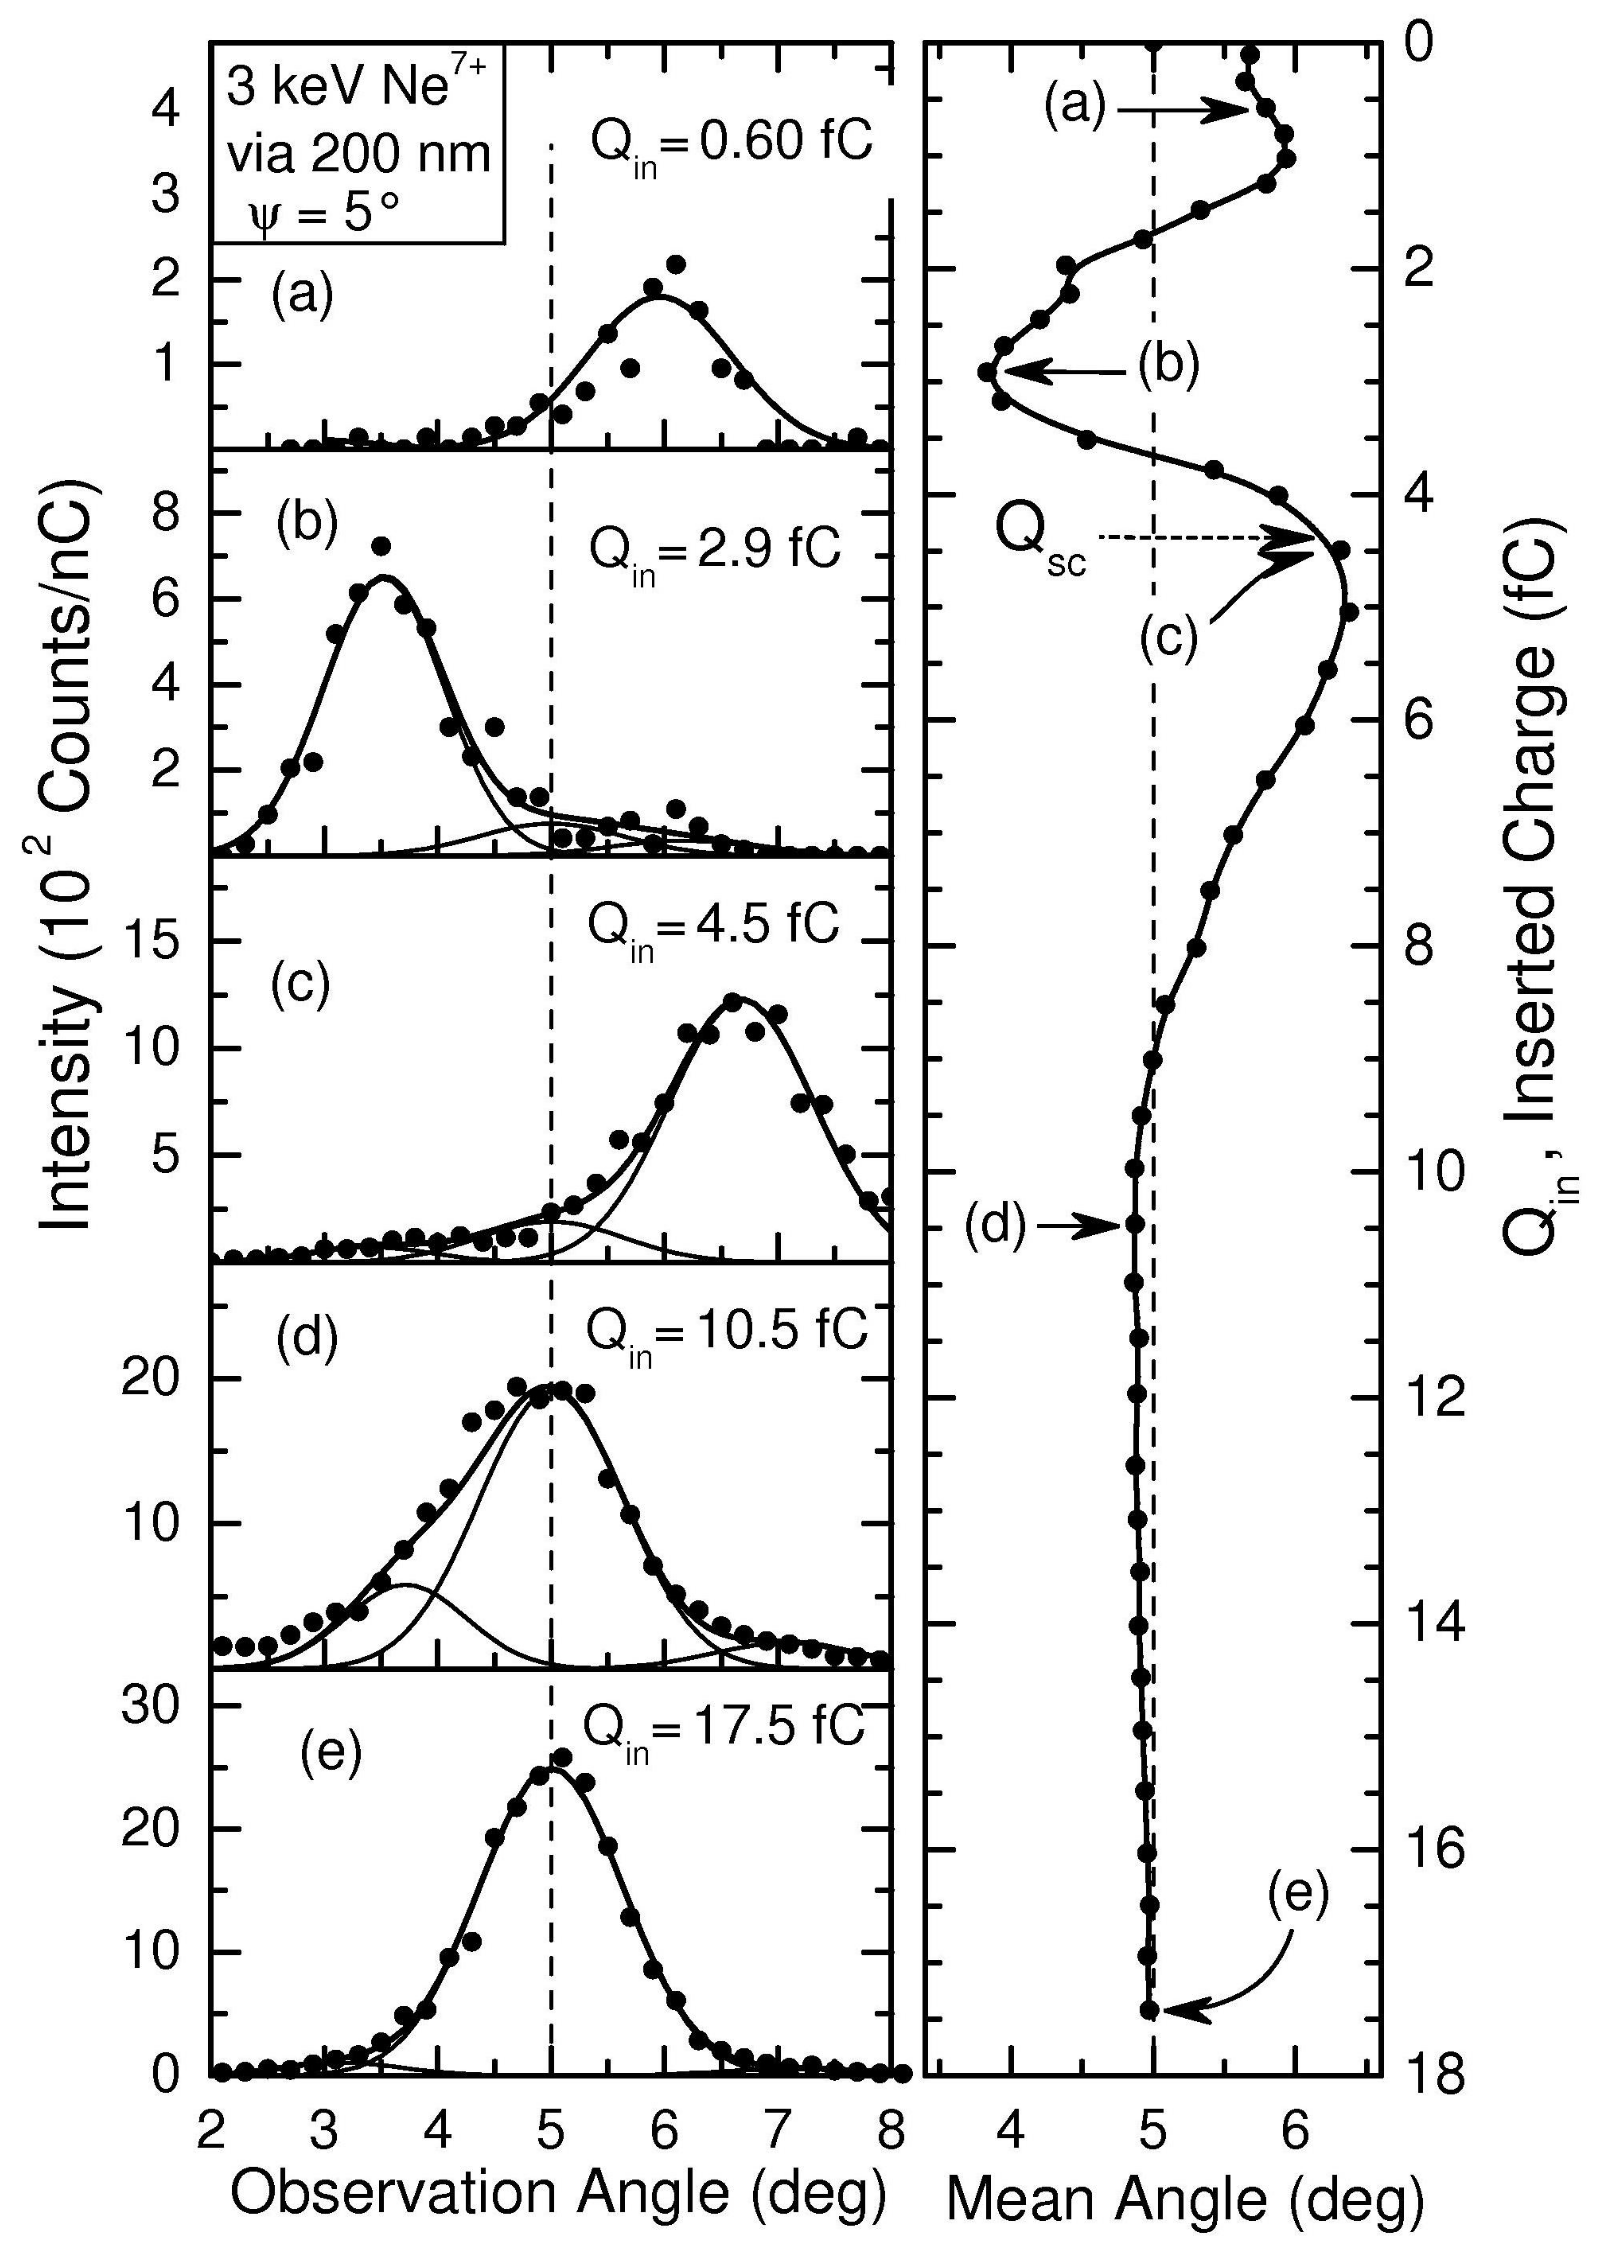
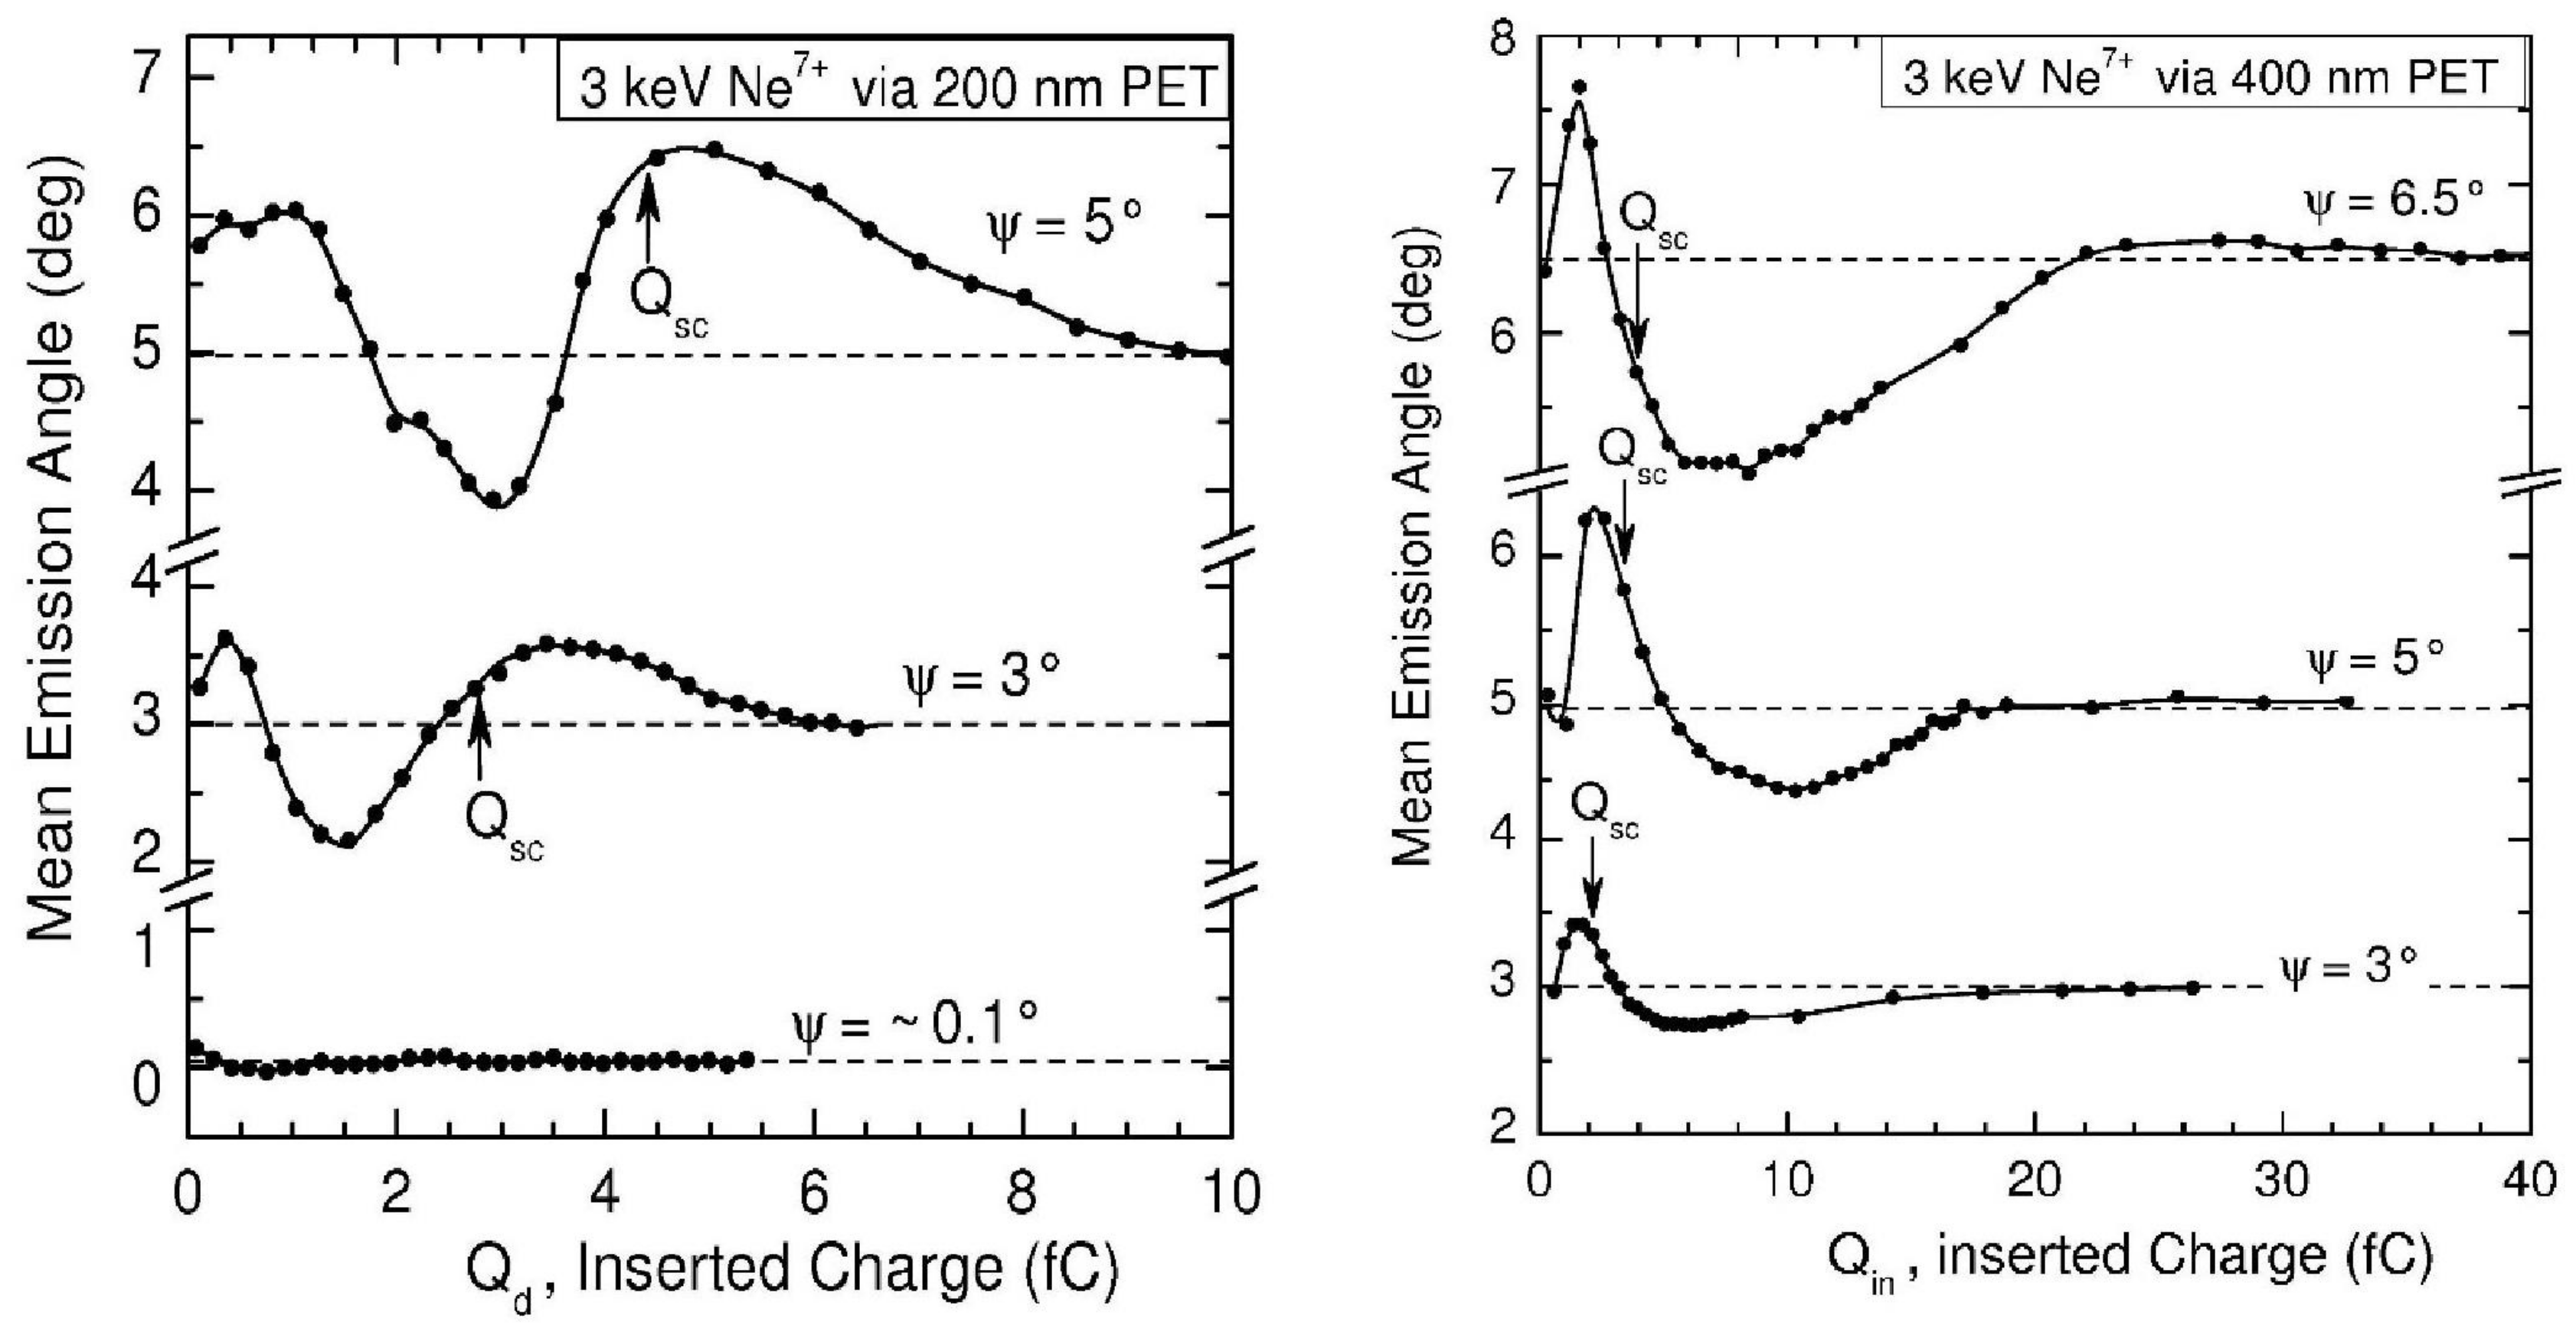
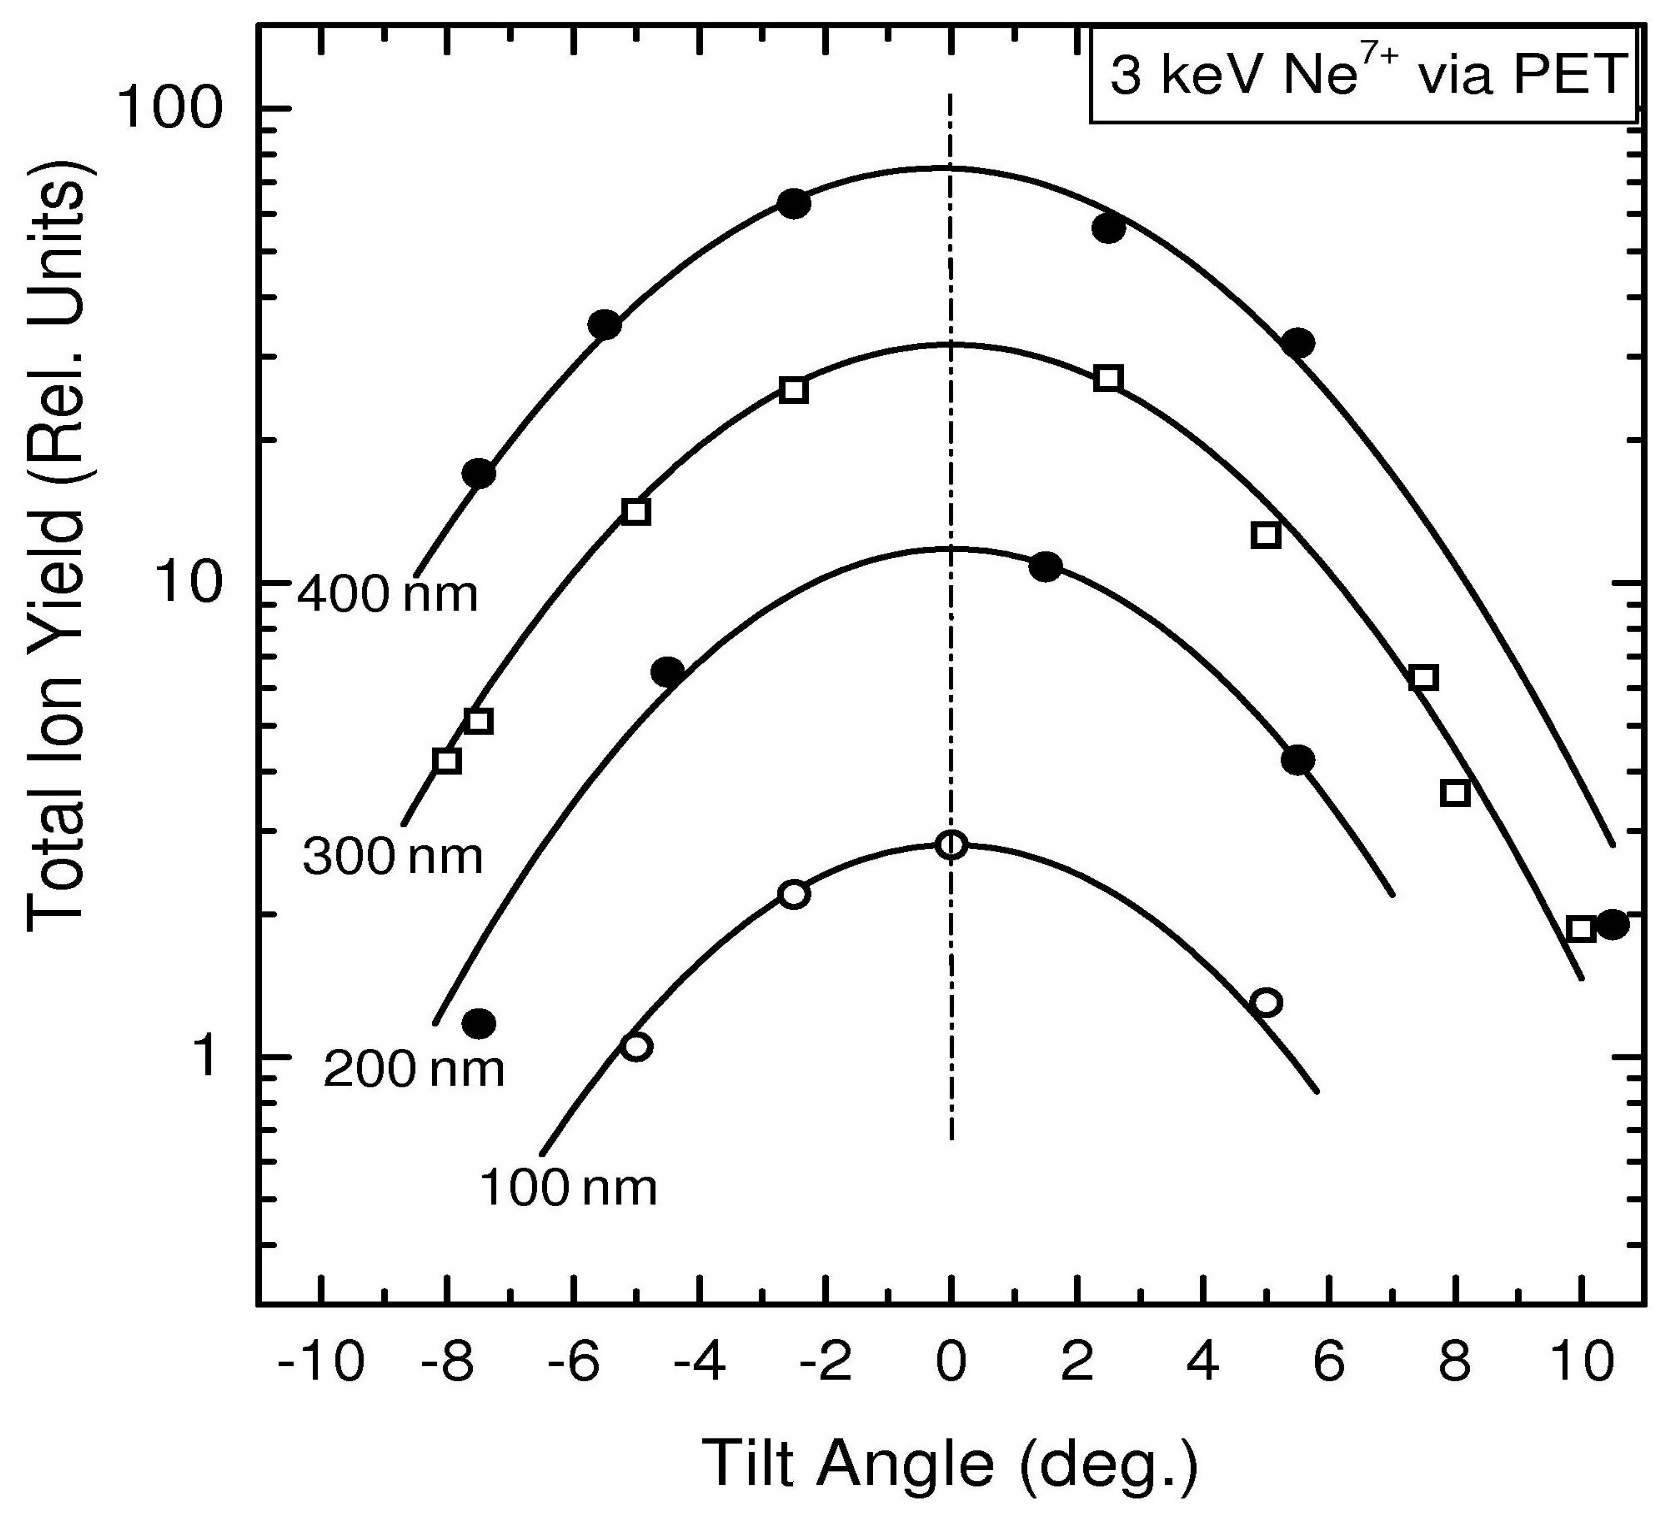
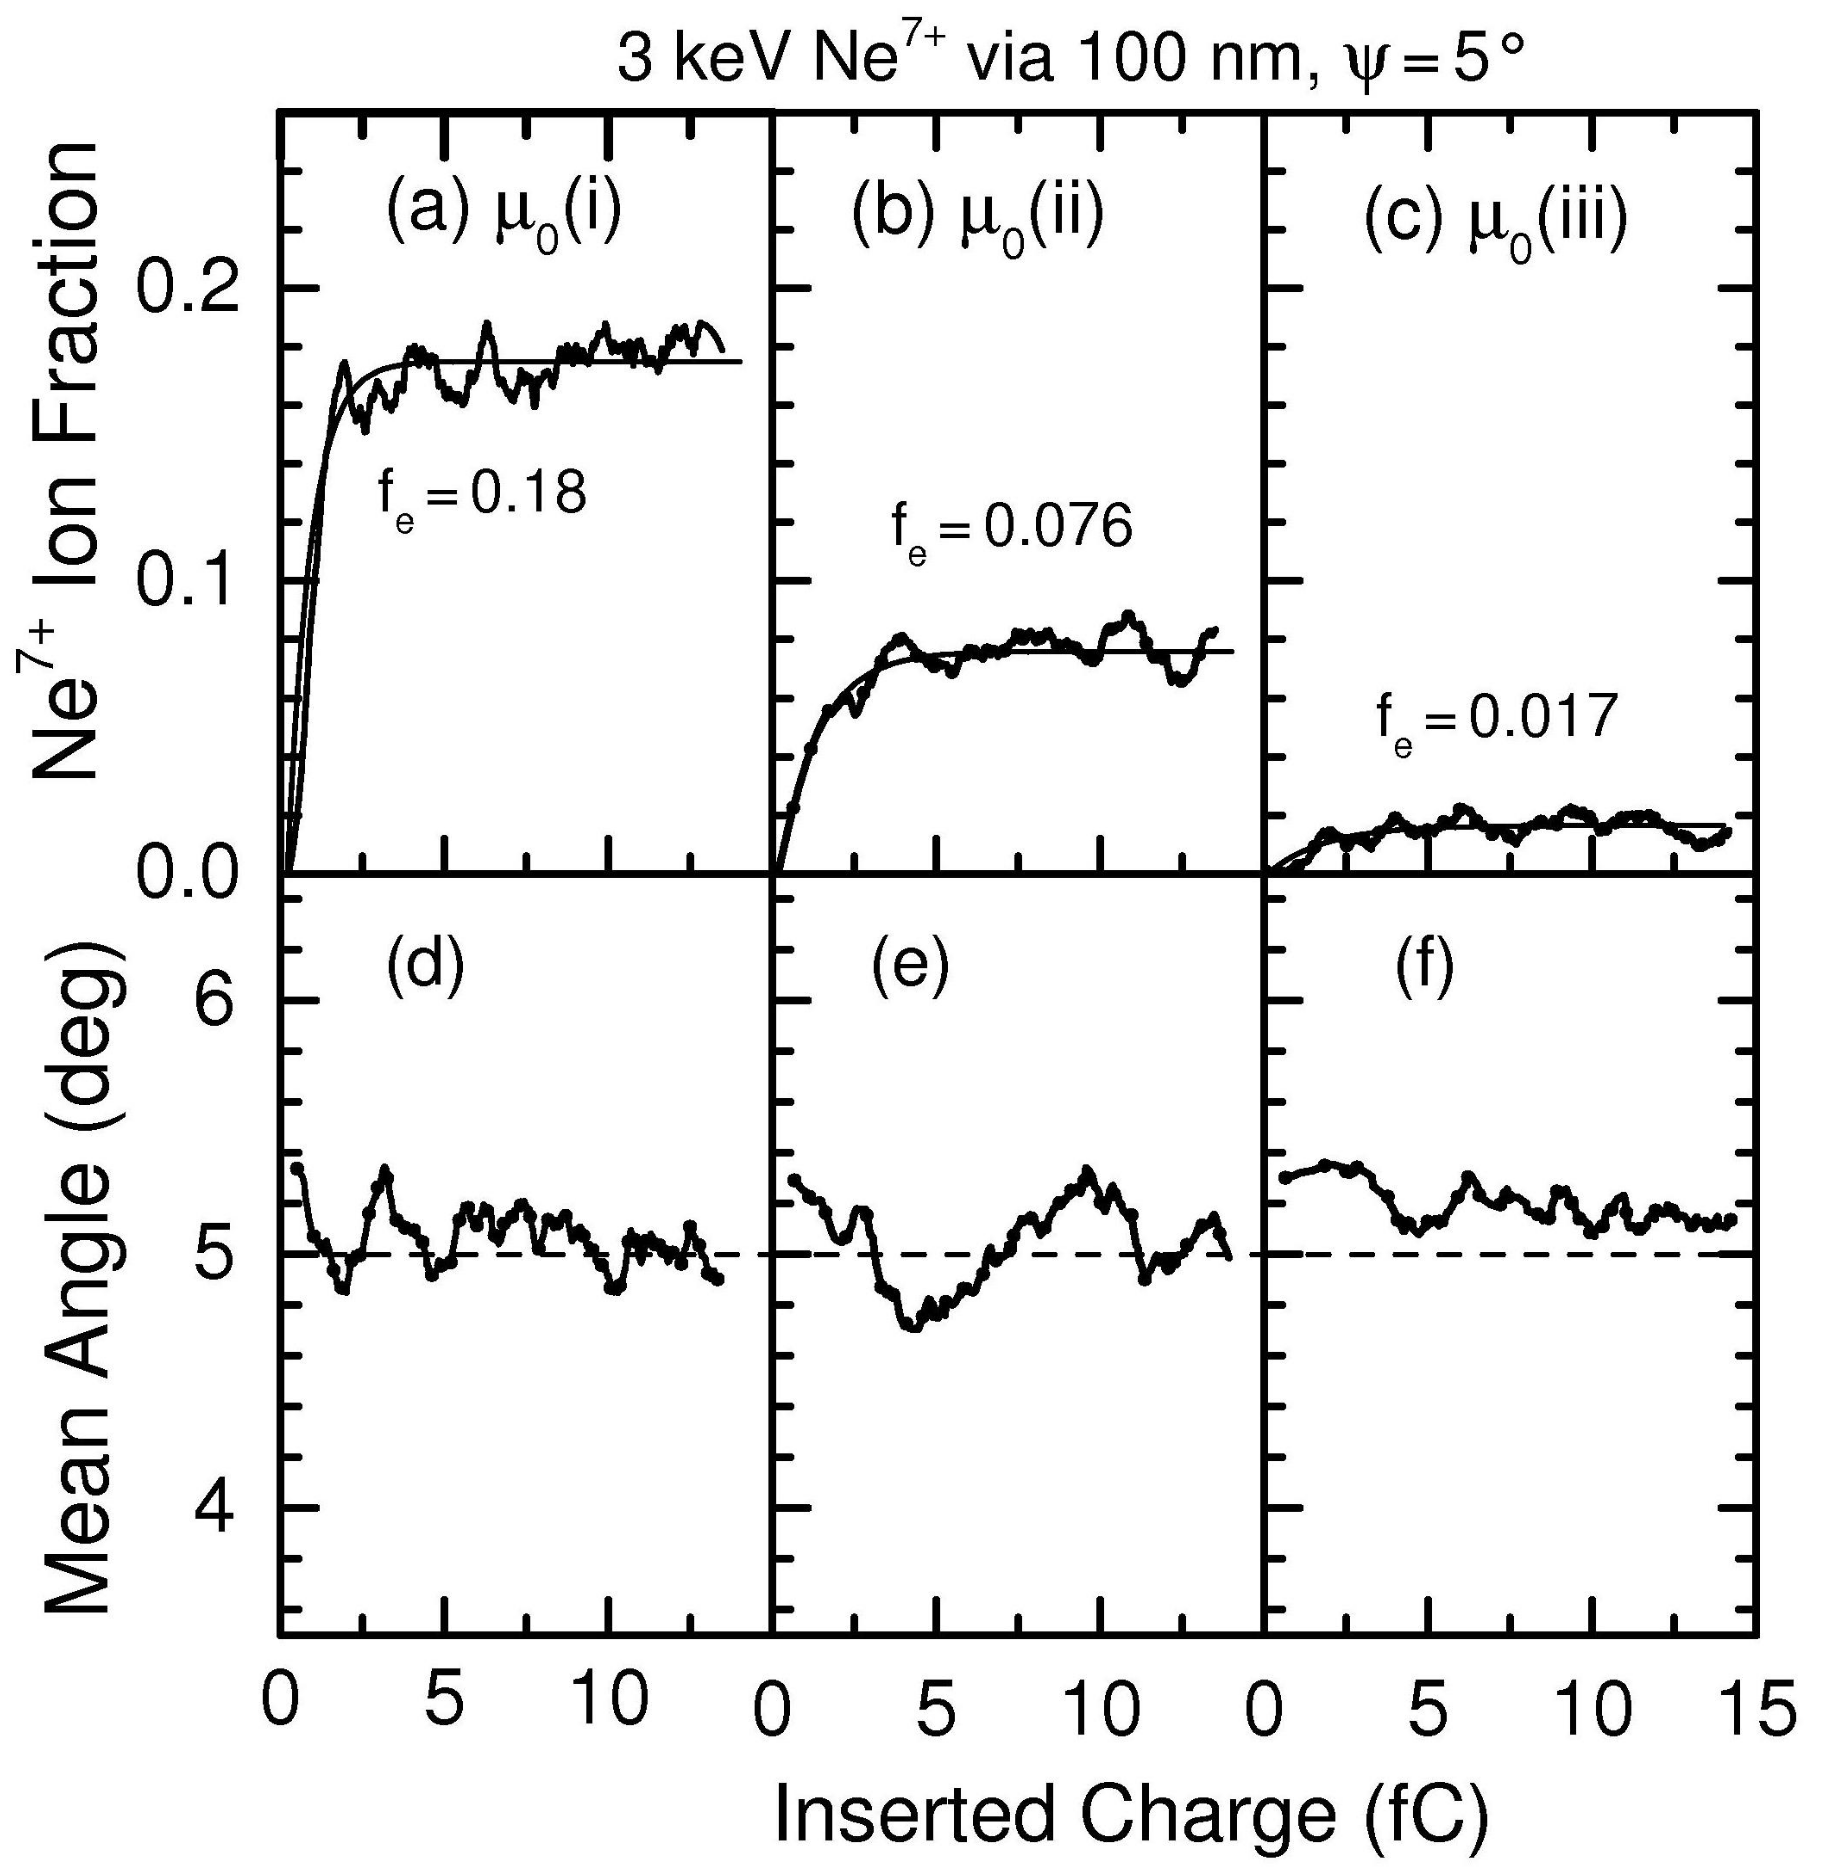
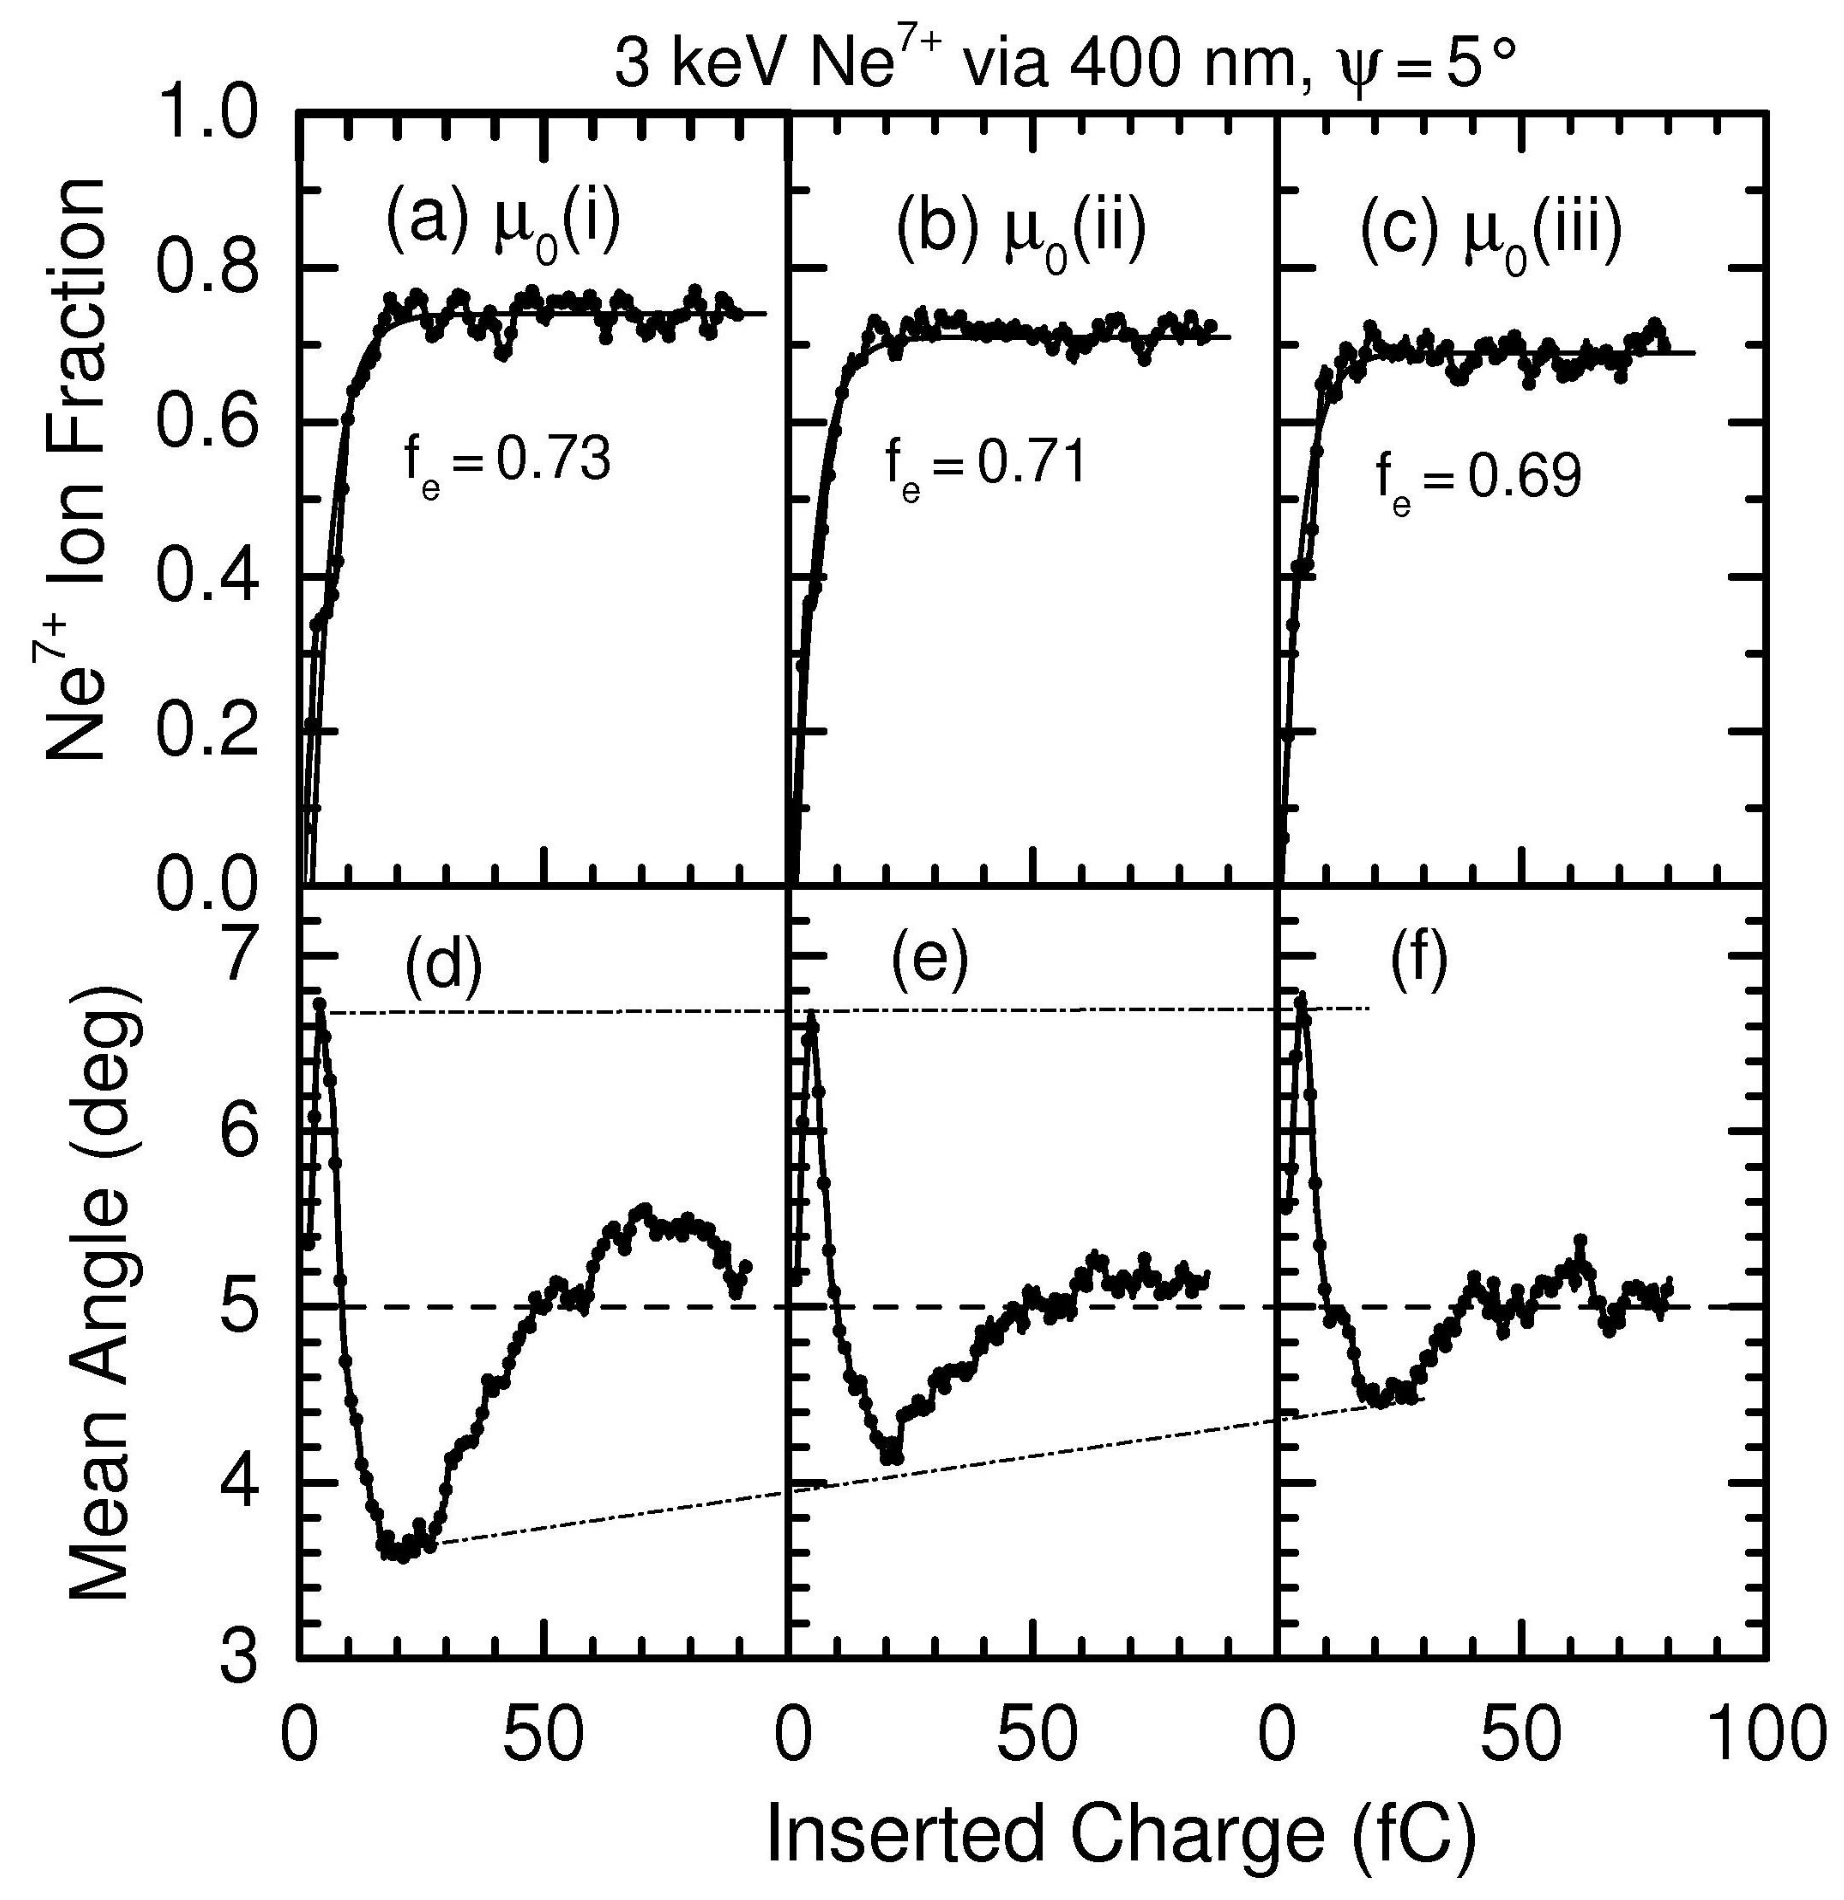
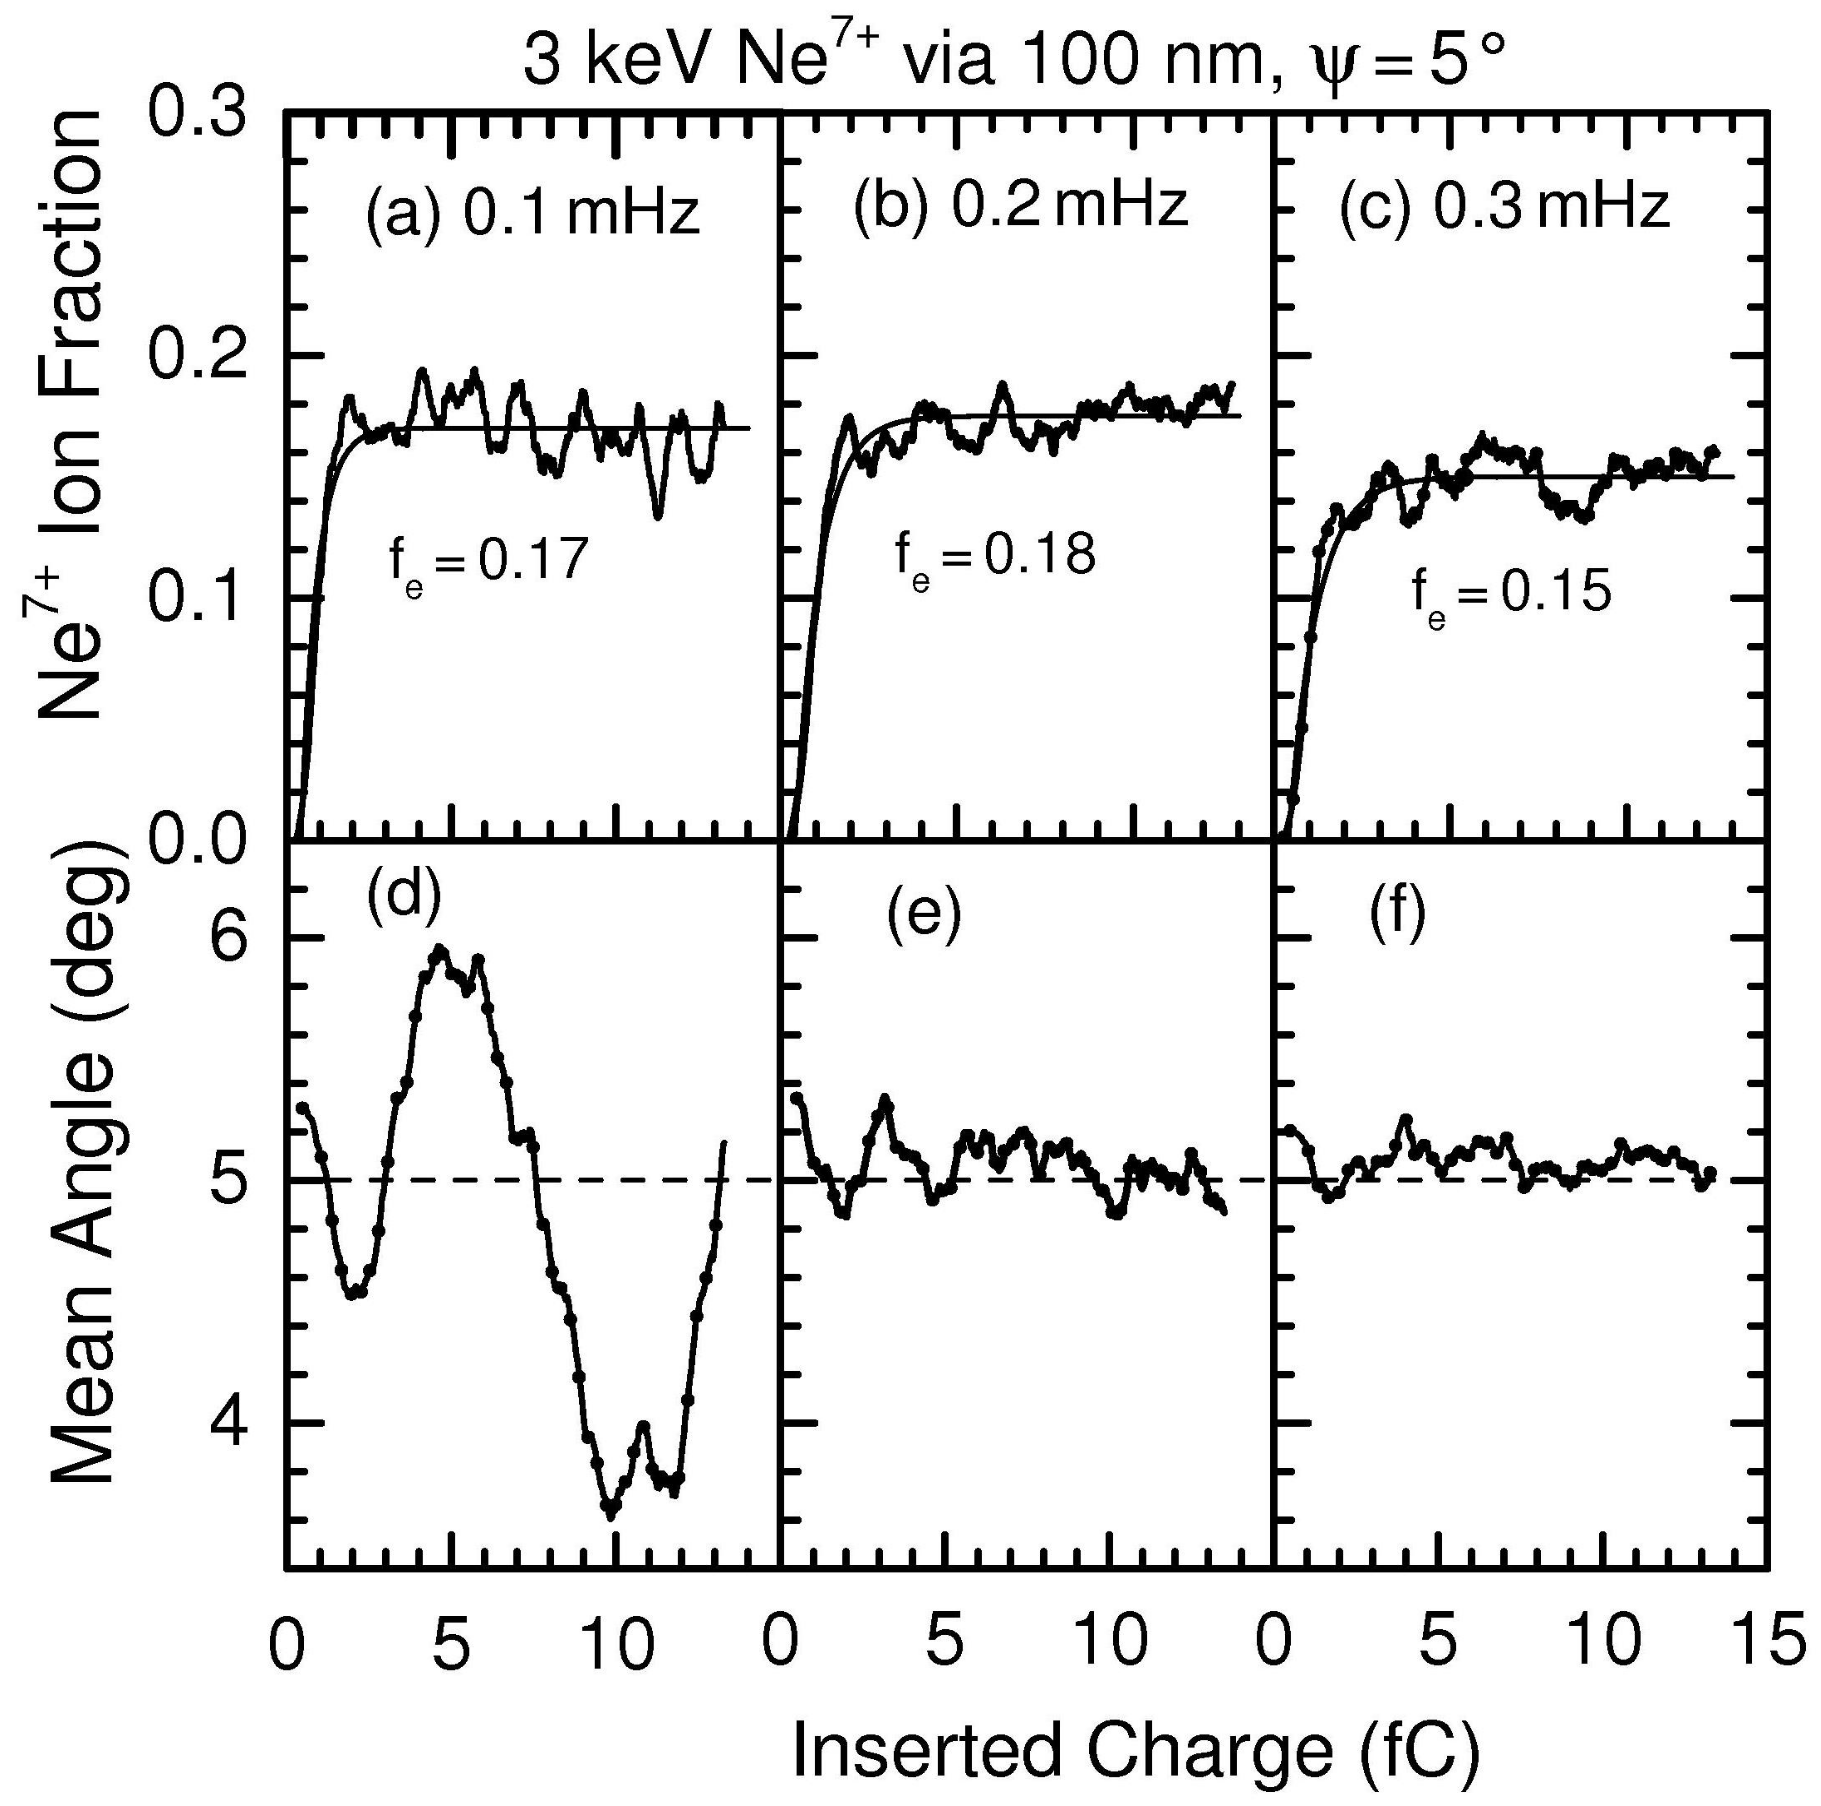
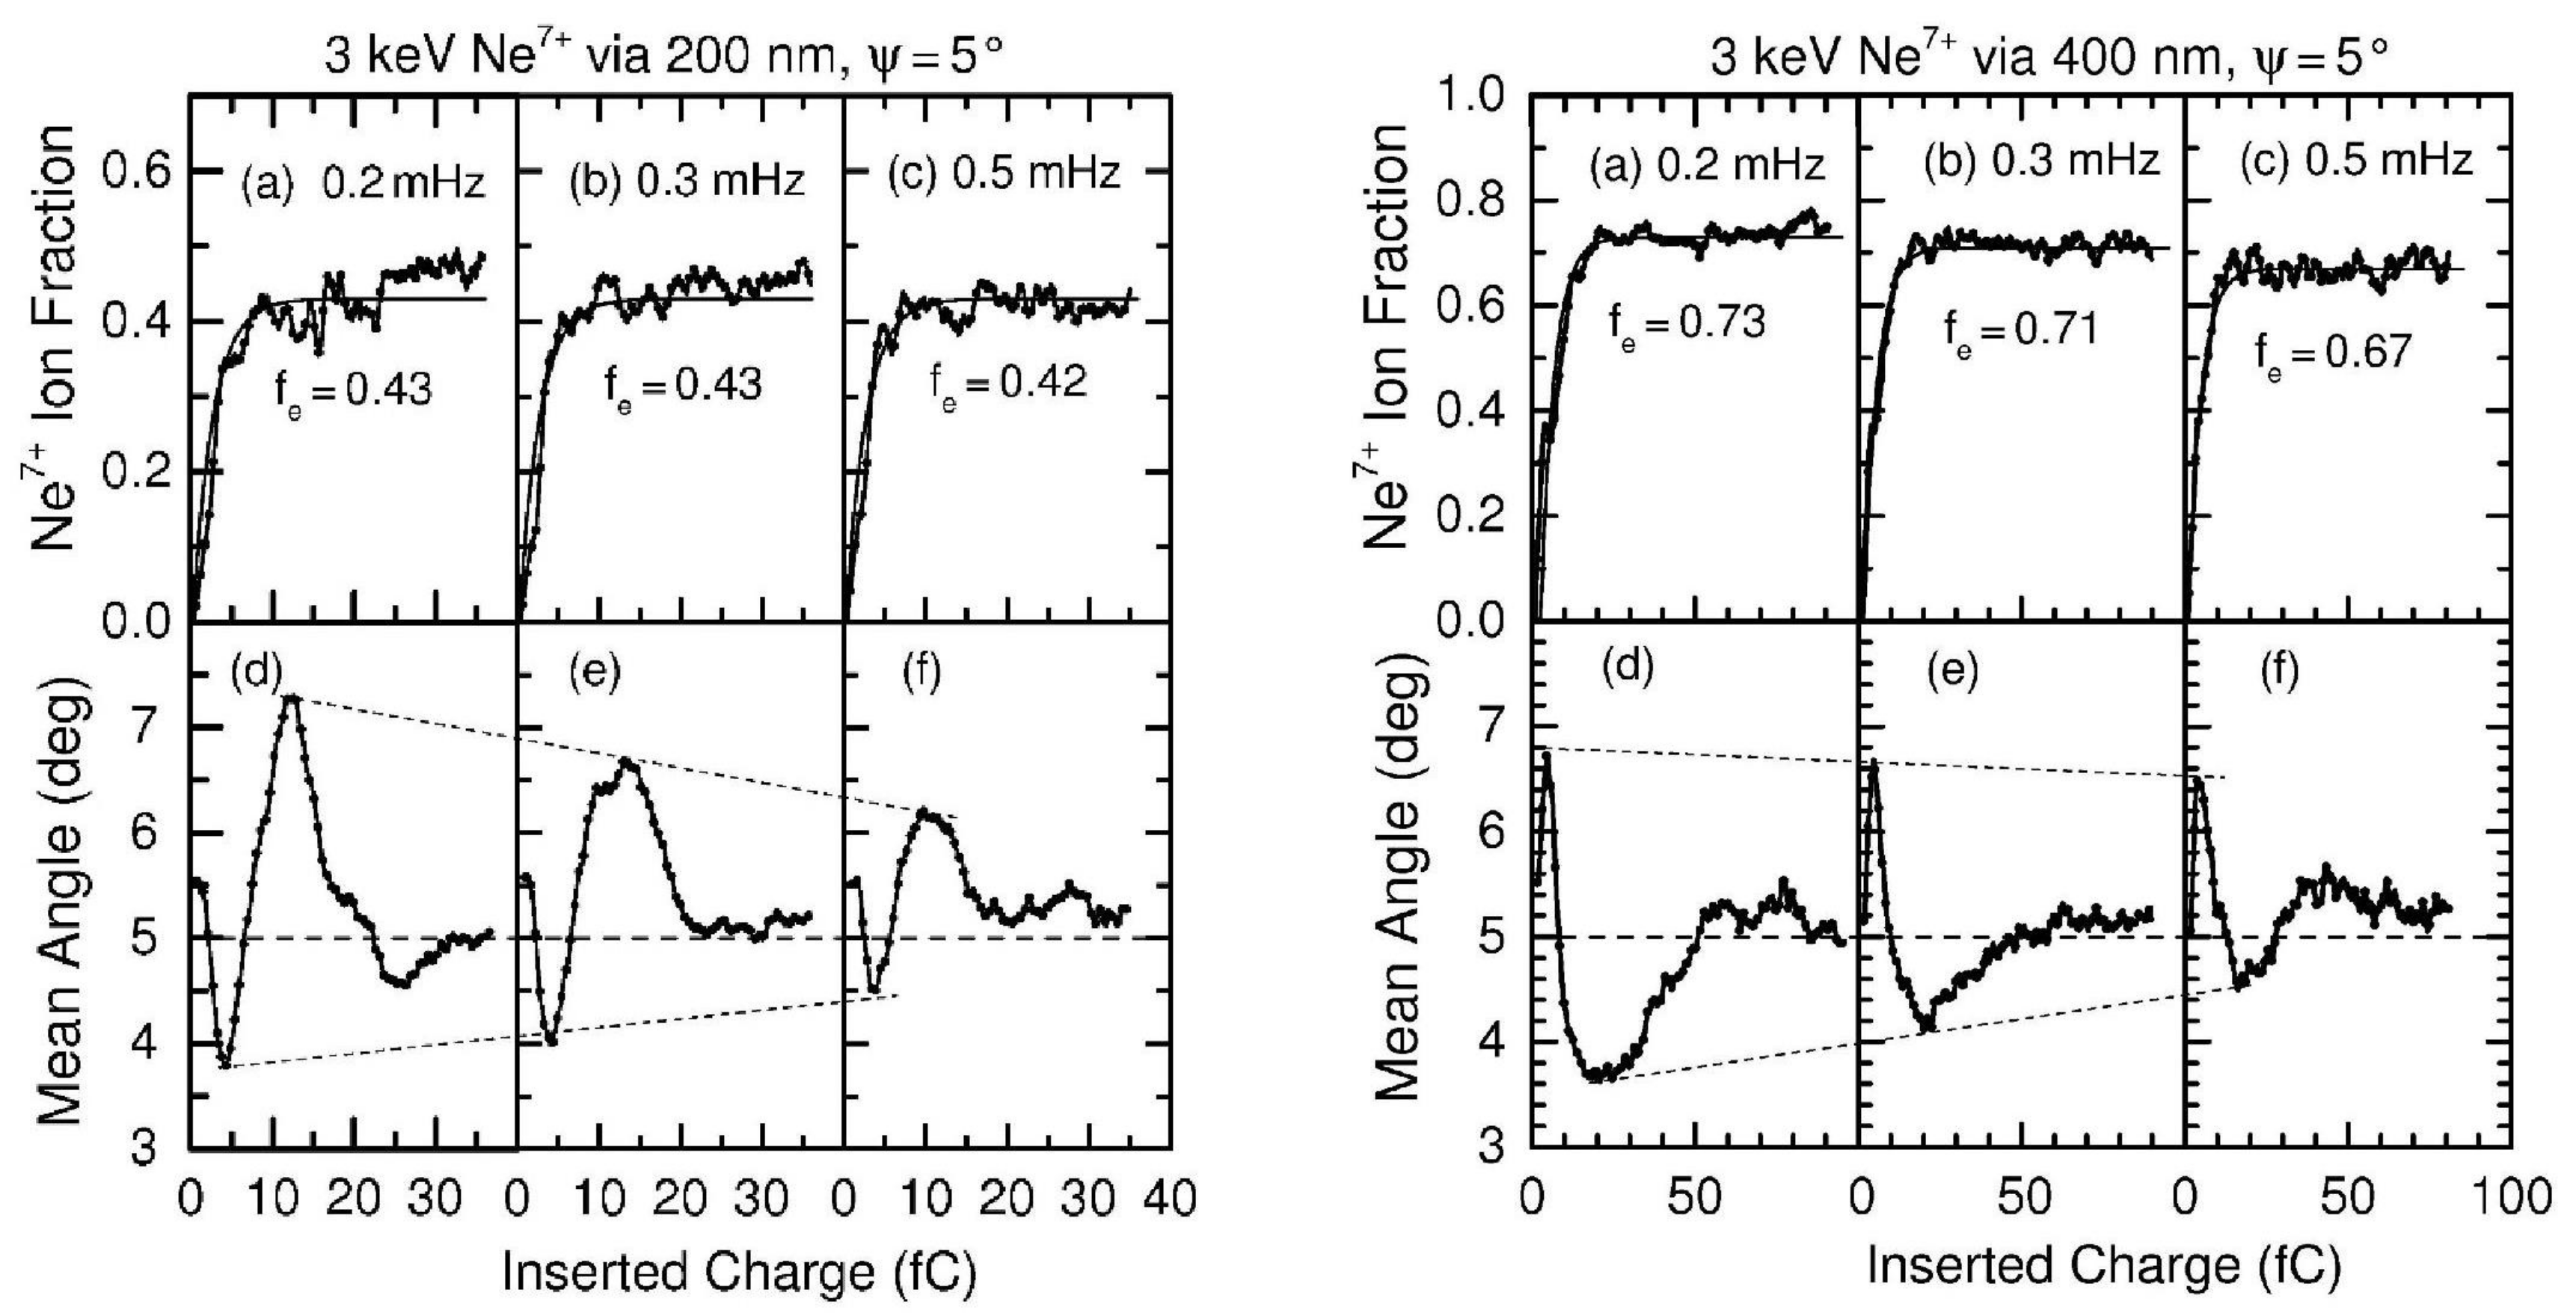
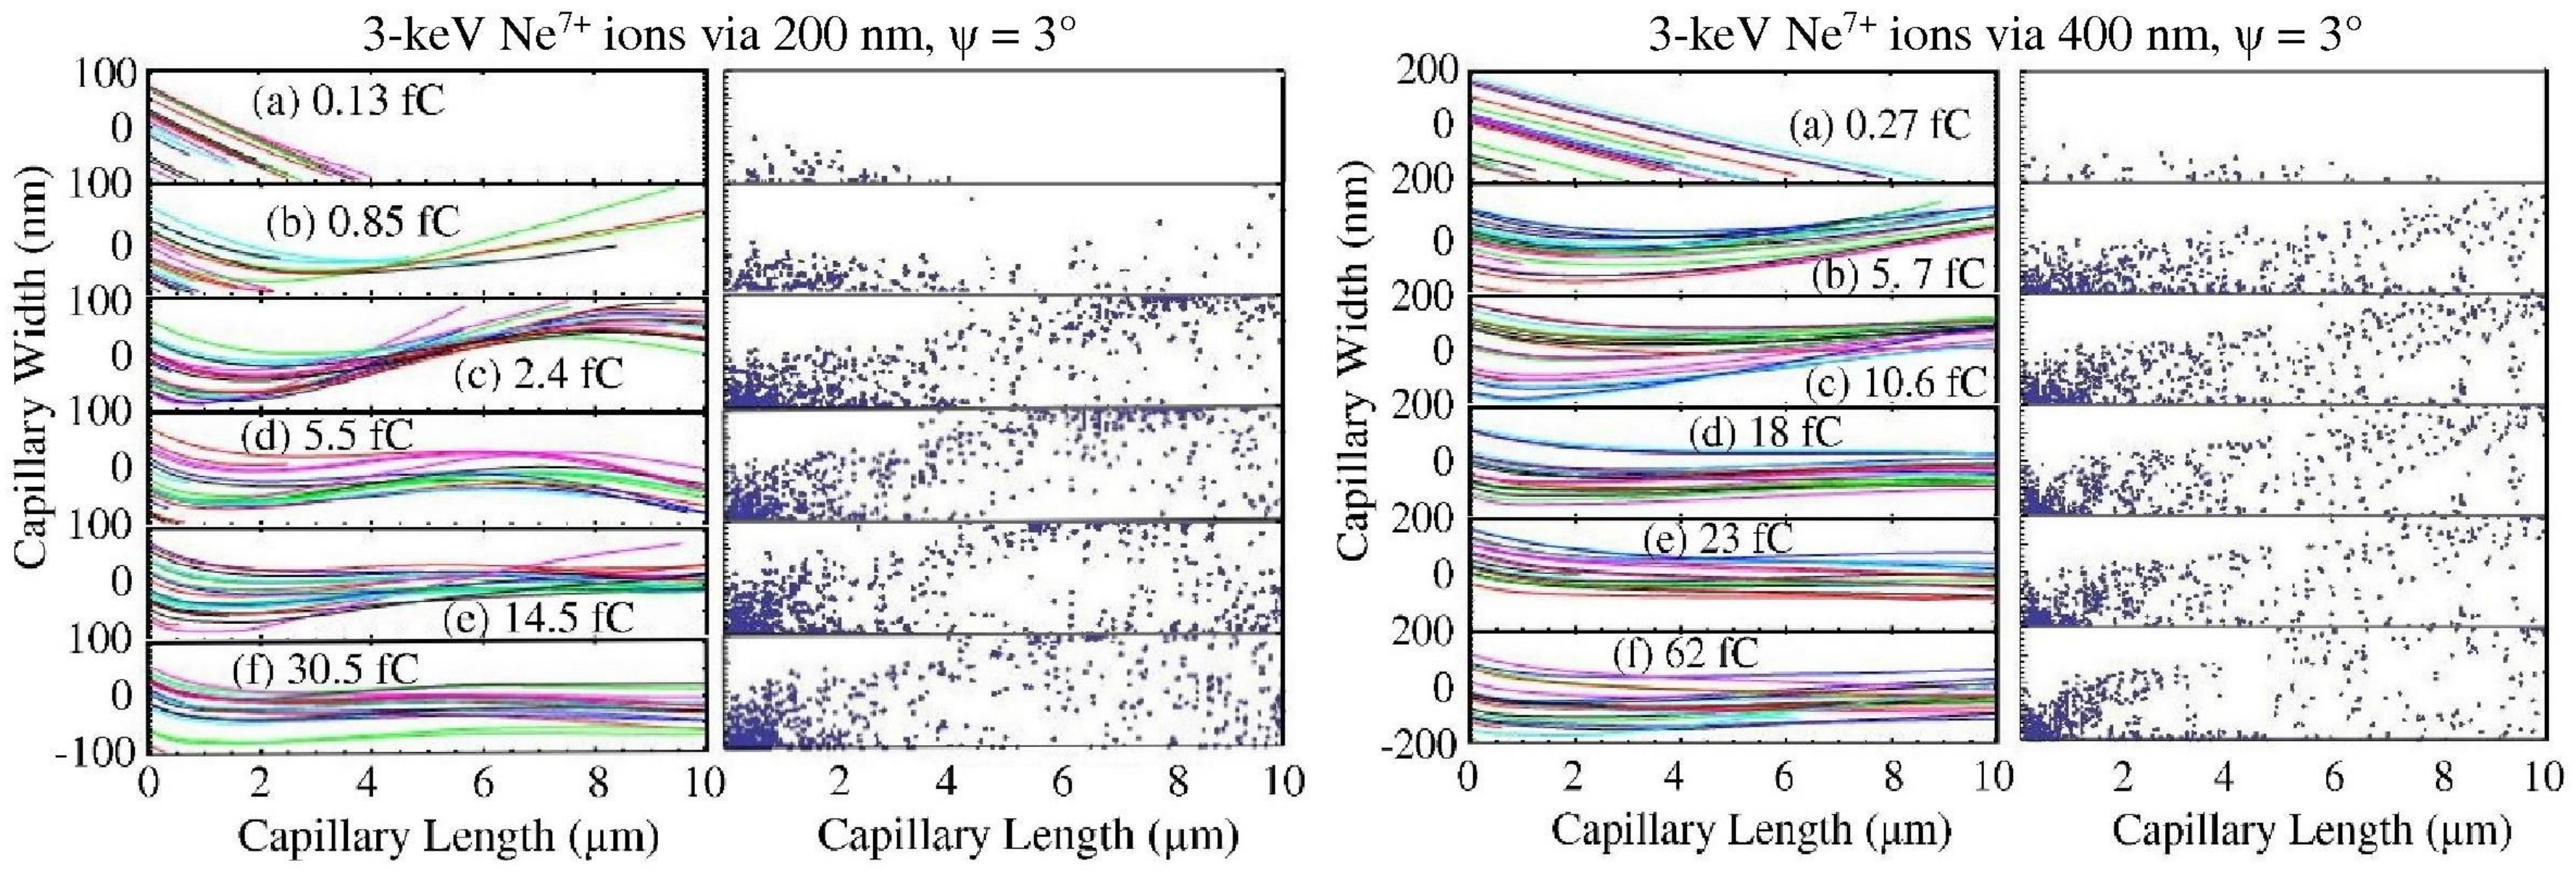
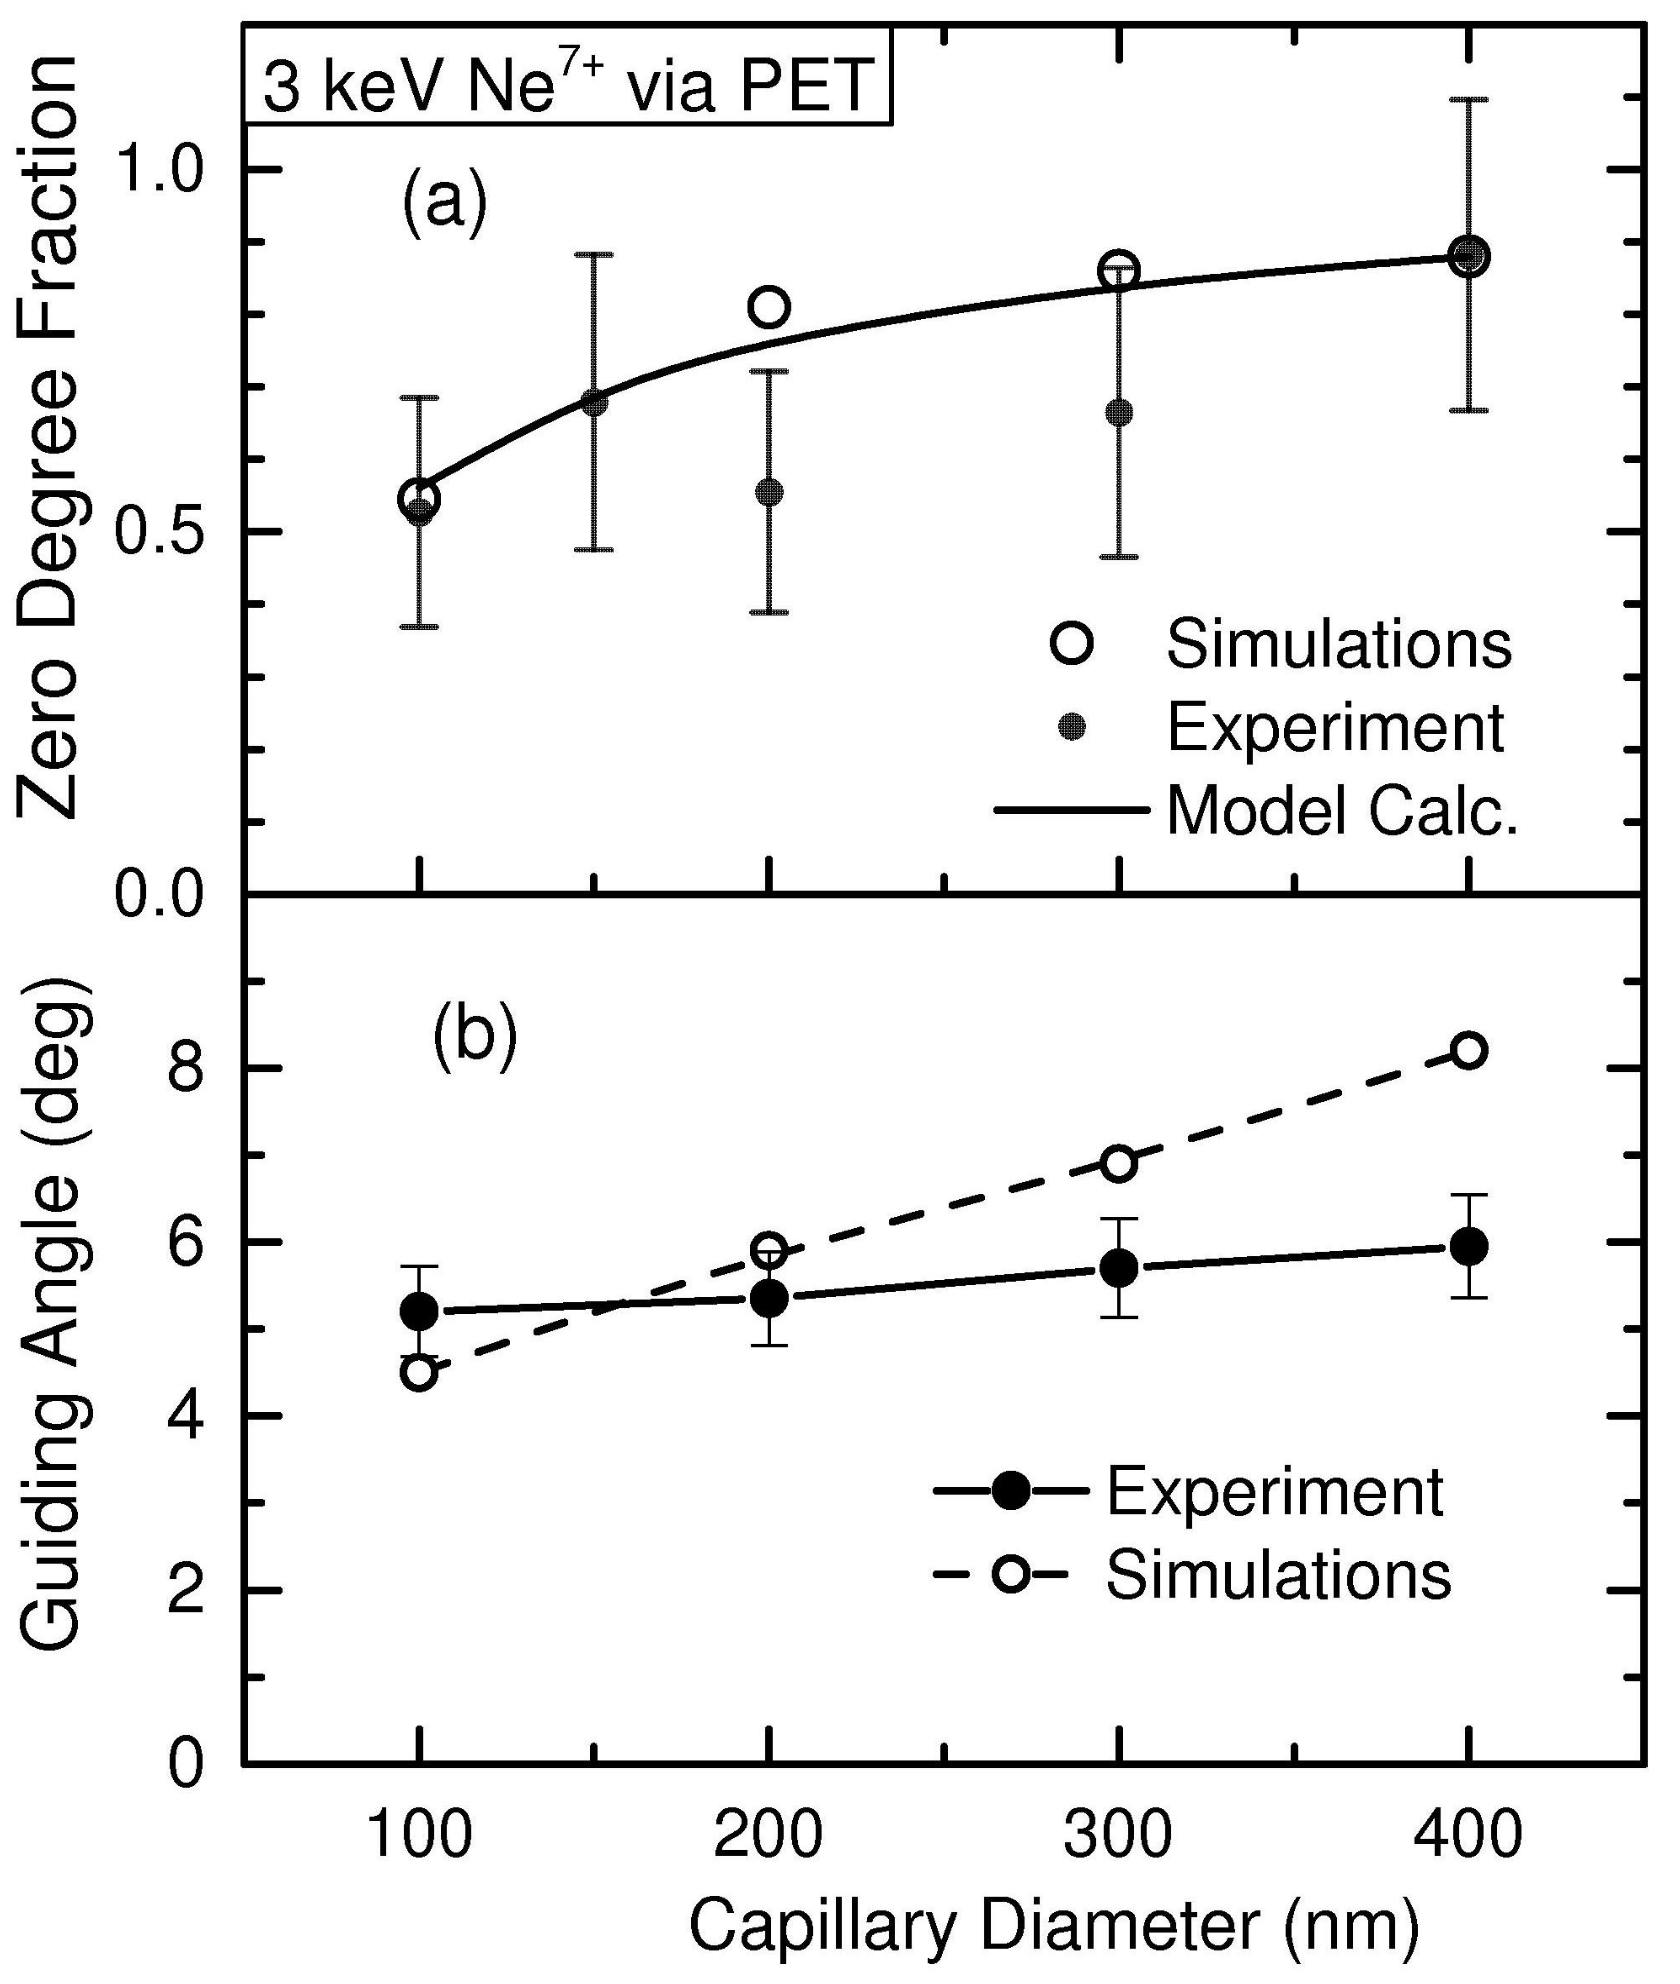
Table 1.
Parameters used for the simulations. The energy, total current, and the collection time of the Ne projectiles are given together with the diameter, length, and tilt angles of the capillary.
Table 1.
Parameters used for the simulations. The energy, total current, and the collection time of the Ne projectiles are given together with the diameter, length, and tilt angles of the capillary.
| Ion Energy, | Tot. Current, | Time, | Diameter | Length, L | Tilt Angle, |
|---|---|---|---|---|---|
| 3 keV | 100 pA | 1.4–22.4 s | 100–400 nm | 10–12 μm | 0°, 3°, 5°, 7° |
Table 2.
Parameters used to evaluate the non-linear charge depletion at the capillary surface (see text).
Table 2.
Parameters used to evaluate the non-linear charge depletion at the capillary surface (see text).
| Field, (V/μm) | 1.33 |
| Mobility, (nm/V·s ) | 0.001–0.01 |
| Rate, (mHz) | 0.1–0.5 |
Table 3.
Parameters for the surface drift mobility used in the simulations (see text).
| Notation | Mobility (nm/V·s) |
|---|---|
| (i) | 0.001 |
| (ii) | 0.003 |
| (iii) | 0.01 |
Table 4.
Values for the capillary diameter d, the surface drift mobility and bulk discharge rate used as basic constants. The corresponding dynamic parameters and , respectively, are calculated by the simulations at equilibrium. Also, the ratio and the sum are given.
Table 4.
Values for the capillary diameter d, the surface drift mobility and bulk discharge rate used as basic constants. The corresponding dynamic parameters and , respectively, are calculated by the simulations at equilibrium. Also, the ratio and the sum are given.
| d (nm) | (nm/V·s) | (mHz) | (mHz) | (mHz) | (mHz) | |
|---|---|---|---|---|---|---|
| 100 | 0.001 | 0.3 | 0.15 | 0.68 | 4.5 | 0.83 |
| 200 | 0.003 | 0.3 | 0.21 | 0.85 | 4.0 | 1.06 |
| 300 | 0.003 | 0.3 | 0.25 | 1.02 | 4.1 | 1.27 |
| 400 | 0.003 | 0.3 | 0.26 | 1.10 | 4.2 | 1.36 |
© 2020 by the author. Licensee MDPI, Basel, Switzerland. This article is an open access article distributed under the terms and conditions of the Creative Commons Attribution (CC BY) license (http://creativecommons.org/licenses/by/4.0/).
Share and Cite
MDPI and ACS Style
Stolterfoht, N. Simulations of Ion-Guiding Through Insulating Nanocapillaries of Varying Diameter: Interpretation of Experimental Results. Atoms 2020, 8, 48. https://0-doi-org.brum.beds.ac.uk/10.3390/atoms8030048
AMA Style
Stolterfoht N. Simulations of Ion-Guiding Through Insulating Nanocapillaries of Varying Diameter: Interpretation of Experimental Results. Atoms. 2020; 8(3):48. https://0-doi-org.brum.beds.ac.uk/10.3390/atoms8030048
Chicago/Turabian StyleStolterfoht, Nikolaus. 2020. "Simulations of Ion-Guiding Through Insulating Nanocapillaries of Varying Diameter: Interpretation of Experimental Results" Atoms 8, no. 3: 48. https://0-doi-org.brum.beds.ac.uk/10.3390/atoms8030048
Note that from the first issue of 2016, this journal uses article numbers instead of page numbers. See further details here.