Article

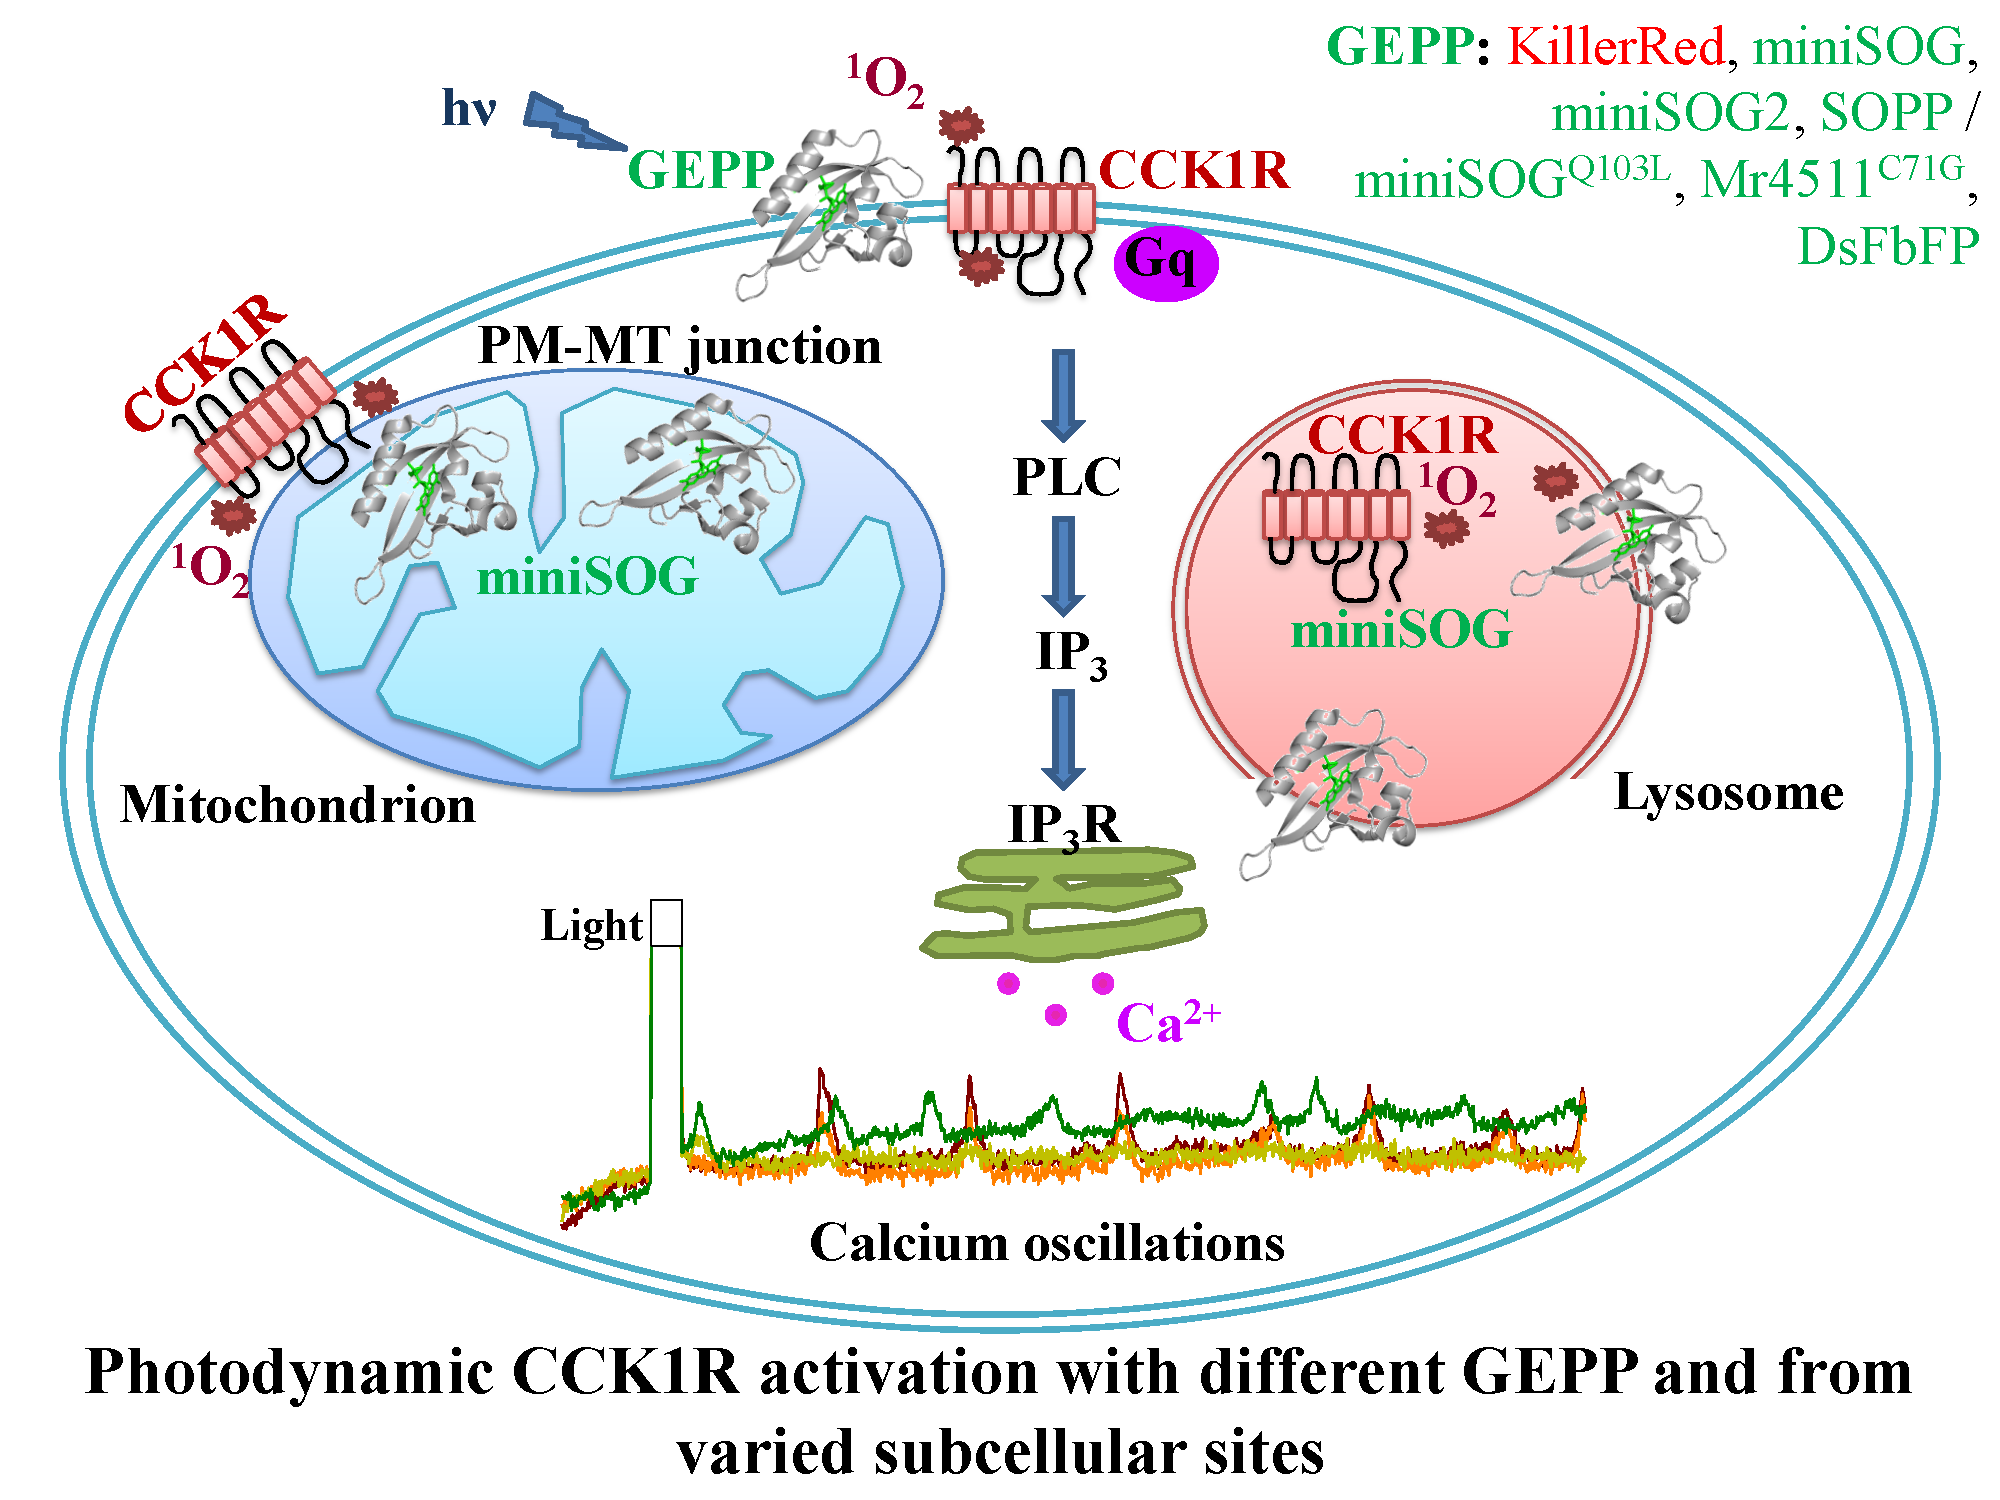
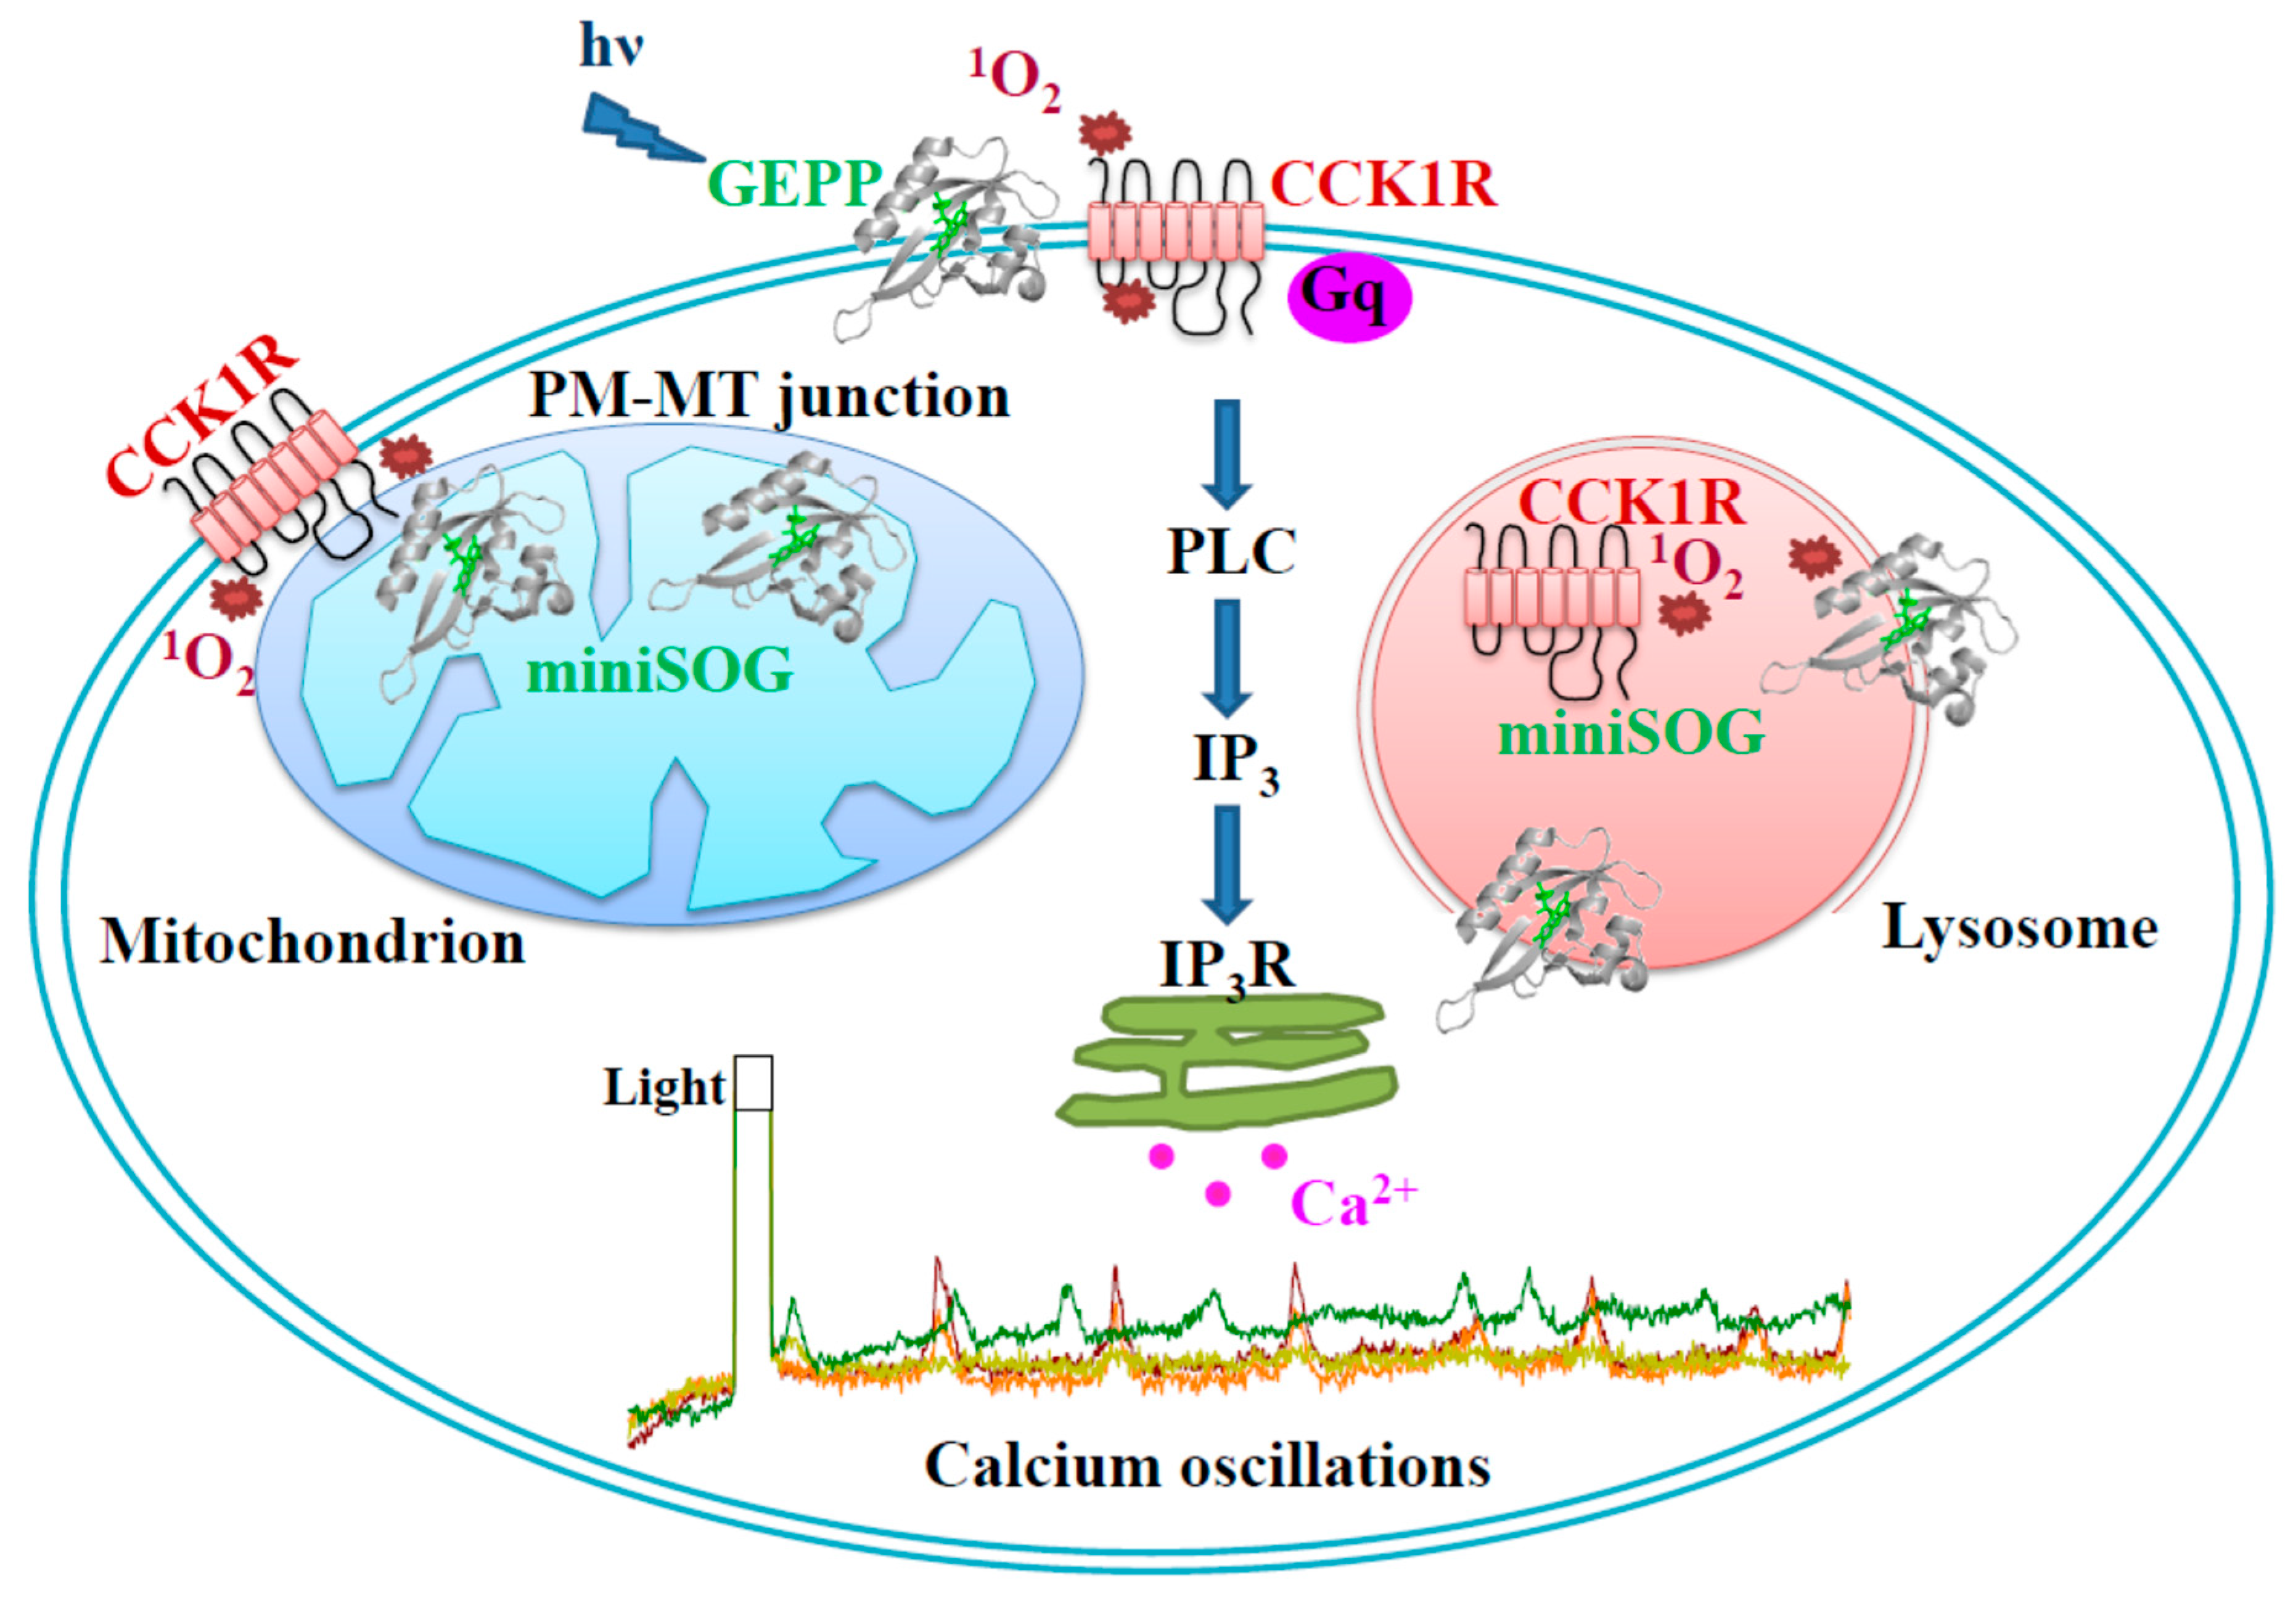
Photodynamic Activation of Cholecystokinin 1 Receptor with Different Genetically Encoded Protein Photosensitizers and from Varied Subcellular Sites

Institute of Cell Biology, Beijing Normal University, Beijing 100875, China
*
Author to whom correspondence should be addressed.
Submission received: 29 August 2020 / Revised: 1 October 2020 / Accepted: 6 October 2020 / Published: 8 October 2020
(This article belongs to the Section Chemical Biology)

Abstract

:
Cholecystokinin 1 receptor (CCK1R) is activated by singlet oxygen (1O2) generated in photodynamic action with sulphonated aluminum phthalocyanine (SALPC) or genetically encoded protein photosensitizer (GEPP) KillerRed or mini singlet oxygen generator (miniSOG). A large number of GEPP with varied 1O2 quantum yields have appeared recently; therefore, in the present work, the efficacy of different GEPP to photodynamically activate CCK1R was examined, as monitored by Fura-2 calcium imaging. KillerRed, miniSOG, miniSOG2, singlet oxygen protein photosensitizer (SOPP), flavin-binding fluorescent protein from Methylobacterium radiotolerans with point mutation C71G (Mr4511C71G), and flavin-binding fluorescent protein from Dinoroseobacter shibae (DsFbFP) were expressed at the plasma membrane (PM) in AR4-2J cells, which express endogenous CCK1R. Light irradiation (KillerRed: white light 85.3 mW‧cm−2, 4’ and all others: LED 450 nm, 85 mW·cm−2, 1.5′) of GEPPPM-expressing AR4-2J was found to all trigger persistent calcium oscillations, a hallmark of permanent photodynamic CCK1R activation; DsFbFP was the least effective, due to poor expression. miniSOG was targeted to PM, mitochondria (MT) or lysosomes (LS) in AR4-2J in parallel experiments; LED light irradiation was found to all induce persistent calcium oscillations. In miniSOGPM-AR4-2J cells, light emitting diode (LED) light irradiation-induced calcium oscillations were readily inhibited by CCK1R antagonist devazepide 2 nM; miniSOGMT-AR4-2J cells were less susceptible, but miniSOGLS-AR4-2J cells were not inhibited. In conclusion, different GEPPPM could all photodynamically activate CCK1R. Intracellular GEPP photodynamic action may prove particularly suited to study intracellular GPCR.

Graphical Abstract

1. Introduction

Cholecystokinin 1 receptor (CCK1R) is expressed prominently in highly restricted brain regions, such as the basal ganglia, hippocampus, thalamus, hypothalamus, medulla oblongata [1,2,3,4,5,6,7,8,9], in the dorsal horn of the spinal cord [7,8], and in the peripheral ganglion and enteric neurons [10,11,12,13,14,15,16]. CCK1R plays important roles in central nervous system (CNS) functions, such as anxiety [17,18], appetite [19], brain development [1,20], and learning and memory [21]. CCK1R in the dorsal horn of the spinal cord [7,8] and in sensory ganglion neurons is essential in the transmission of peripheral satiety signals to the brain stem and higher up [13,22,23]. Activated peripheral CCK1R triggers gallbladder contraction [24] and pancreatic digestive enzyme secretion [24,25] but inhibits gastric acid secretion [26,27] and modulates large intestine motility [28].
CCK1R is unique among A class G protein-coupled receptors (GPCR) in that it is permanently activated ligand-independently by the lowest lying excited state molecular oxygen, the delta singlet oxygen (Δ1O2 or 1O2), usually generated in type II photodynamic action with chemical photosensitizer sulphonated aluminum phthalocyanine (SALPC) after a brief cellular incubation [29,30] in freshly isolated rat pancreatic acini or with genetically encoded protein photosensitizer (GEPP) KillerRed or mini singlet oxygen generator (miniSOG) target-expressed at the plasma membrane (PM) in rat pancreatic acinar tumor cell AR4-2J [31,32].
A typical photodynamic action involves three elements: light, a light-absorbing molecule (photosensitizer), and molecular oxygen. After absorption of a photon of a certain wavelength by a photosensitizer, the excited state photosensitizer molecule eventually undergoes either electron transfer or the energy transfer process. Electron transfer leads to the production of oxygen radicals (type I), such as superoxide anion (O2−.). Energy transfer to ground state molecular oxygen results in the production of 1O2 (type II) [29,30,31]. The absorption spectrum of the photosensitizer molecule determines the most effective wavelength of the irradiation light. The photophysicochemical property of the photosensitizer determines the 1O2 quantum yield (ϕ1O2) in type II photodynamic action. In contrast to chemical photosensitizers such as porphyrins and phthalocyanines, genetic manipulations will ensure that GEPP could be targeted to specified cell types or subcellular organelles with high precision.
KillerRed is the first major GEPP to emerge, initially thought to generate solely superoxide anion (O2−.) [33,34,35] but has since been reported to probably generate 1O2 also [31,36], and later measured to have a 1O2 quantum yield (ϕΔ1O2 0.008) of more than eight-fold higher than O2−. [37]. The miniSOG was originally designed to correlate light and electron microscopy [38,39] but has since been used for many other purposes, such as acute modulation of the neurotransmitter release [40,41], modulation of the HCN2 channel function [42], and for many other delicate cellular and subcellular maneuverings [43].
Different variants of KillerRed and miniSOG have also appeared, either to monomerize the KillerRed dimer (SuperNova and GreenSuperNova) [44,45], to blue-shift the KillerRed excitation peak (GreenSuperNova and KillerOrange) [45,46,47], or for graded increases in miniSOG 1O2 quantum yields (miniSOG2; miniSOGQ103L; or singlet oxygen protein photosensitizer—SOPP, SOPP2, or SOPP3) [38,48,49,50,51,52], for enhanced miniSOG photostability after tethered dimerization with a more stable monomer (phiSOG and phiSOGQ103V) [53]. A red fluorescent protein (TagRFP) for tagging larger proteins has been found to show a noted 1O2 quantum yield [54]. 1O2-generating flavin-binding fluorescent protein (FbFP) photosensitizers originally from other source organisms, such as Pp2FbFP (from Pseudomonas putida), DsFbFp (from Dinoroseobacter shibae), EcFbFP (from Bacillus subtilis), CreiLOV (from Chlamydomonas reinhardtii), Mr4511C71G (from Methylobacterium radiotolerans), and AsLOV2 (from Aveva sativa), have also appeared, all with desirably sufficient 1O2 quantum yields [55,56,57,58,59] (for a list of all GEPP that have appeared in the literature so far, see Table A1).
In view of the above developments, it has become pertinent to examine whether the newly emerged GEPP could also be used for photodynamic CCK1R activation. Further, numerous works have reported that G protein-coupled receptors (GPCR) function not only from PM but, also, from intracellular membranes [60,61]. The role of intracellular miniSOG photodynamic action on CCK1R therefore also needs to be examined. Such works would potentially provide novel platforms upon which to elucidate the in vivo CCK1R function with high temporal and spatial precision.
In the present work, it was found that plasma membrane (PM)-expressed KillerRed, miniSOG, miniSOG2, SOPP, Mr4511C71G, and DsFbFP in AR4-2J cells after light irradiation all photodynamically activated endogenous CCK1R in the rat pancreatic acinar tumor cell AR4-2J, triggering persistent calcium oscillations, with DsFbFP being the least effective. Interestingly, light irradiation of AR4-2J cells with miniSOG expressed at the plasma membrane (PM), mitochondria (MT), or lysosomes (LS) was found to trigger similarly persistent calcium oscillations, which were inhibited by CCK1R antagonist devazepide 2 nM with a graded sensitivity of PM > MT > LS. Therefore, GEPP expressed either at PM or intracellularly are both effective to photodynamically activate CCK1R, suggesting that photodynamic action may be particularly suited for the study of intracellular GPCR without the need for extracellularly added agonists to overcome multiple diffusion barriers.

2. Materials and Methods

2.1. Materials

Sulfated cholecystokinin octapeptide (CCK) and CCK1R antagonist devazepide were from Tocris Cookson (Bristol, UK). Dulbecco’s modified Eagle’s medium (DMEM)/F12 medium was bought from Invitrogen (Shanghai, China). Fura-2 AM was from AAT Bioquest (Sunnyvale, CA, USA). JetPRIME transfection reagent was from PolyPlus-transfection SA (New York, NY, USA). Fetal bovine serum (FBS) was from Thermo Scientific (Shanghai, China). pKillerRedPM vector was bought from Evrogen (Moscow, Russia). Ampicillin and kanamycin were from CWBio (Beijing, China). Endotoxin-free plasmid extraction kit and DH5à competent cells were from TianGen Biochemicals (Beijing, China). MitoTracker™ Red FM was from Invitrogen (Carlsbad, CA, USA). LysoTracker Red was from Beyotime (Shanghai, China).

2.2. Cell Culture (AR4-2J, Escherichia coli)

AR4-2J was bought from The American Type Culture Collection (ATCC, Rockville, MD, USA) and cultured in DMEM/F12 supplemented with 20% fetal bovine serum in a CO2 incubator under humidified atmosphere (5% CO2/95% air) at 37 °C, as reported previously [32,62,63,64].
Solid E. coli medium LB/kana and LB/amp were sterilized and culture plates made. Liquid E. coli medium LB/kana and LB/amp had the same composition but without agar.

2.3. Vector Constructs

Plasmid pKillerRedPM was bought from Evrogen (Moscow, Russia), proliferated in and harvested from competent E. coli. A mammalian codon-optimized miniSOG gene (GenBank accession number JX999997) was synthesized de novo from nucleotides at Genscript (Nanjing, China) with the following full sequence: ATGGAAAAGAGCTTTGTGATTACCGATCCGCGCCTGCCAGACAACCCGATCATTTTCGCGAGCGATGGCTTTCTGGAGTTAACCGAATATTCTCGTGAGGAAATTCTGGGTCGCAATGGCCGTTTCTTGCAGGGTCCGGAAACGGATCAAGCCACCGTGCAGAAAATCCGCGATGCGATTCGTGACCAACGCGAAATCACCGTTCAGCTGATTAACTATACGAAAAGCGGCAAGAAATTTTGGAACTTACTGCATCTGCAACCGATGCGCGATCAGAAAGGCGAATTGCAATATTTCATTGGTGTGCAGCTGGATGGCTAG. This synthesized full miniSOG gene sequence was inserted into plasmid pKillerRedPM (Evrogen, Moscow, Russia) to replace the KillerRed sequence. Competent E. coli were infected with the recombinant plasmid, cultured on solid LB/kana. Bacteria colonies were picked and further cultured in liquid LB/kana with shaking overnight. Proliferated plasmid was extracted with sequence verification. The plasmid so obtained was named pminiSOGPM due to the presence of the PM-localization sequence in the original Evrogen plasmid. After transfection with plasmid pKillerRedPM or pminiSOGPM, positive expressing AR4-2J cells were named KillerRedPM- or miniSOGPM-AR4-2J cells, as reported before [31,32].
For the construction of plasmid pminiSOG2PM, the miniSOG2 [48] gene was synthesized de novo after rat codon optimization. The miniSOG sequence in plasmid pminiSOGPM was replaced with the synthesized miniSOG2 sequence to obtain plasmid pminiSOG2PM (Genscript, Nanjing, China). The miniSOG2 sequence was: ATGGAGAAGAGCTTCGTGATCACCGACCCCCGCCTGCCTGACAACCCAATCATCTTCGCCAGCGACTCCTTCCTGGAGCTGACCGAGTACTCCAGGGAGGAGATCCTGGGAAGGAACCCACGGTTCCTGAGAGGACCTGAGACCGACCAGGCAACCGTGCAGAAGATCCACGACGCCATCCGCGACCAGAGGGAGATCACCGTGCAGCTGATCAACTACACCAAGAGCGGCAAGAAGTTCTGGAACCTGTTCCGGCTGCAGCCAATCAGAGACCAGAAGGGCGAGCTGCAGTACTTCATCGGCGTGCAGCTGGACGGCTAA. AR4-2J cells transfected with plasmid pminiSOG2PM were named miniSOG2PM-AR4-2J cells.
For the construction of plasmid pSOPPPM, the SOPP amino acid sequence [50] was used. The SOPP gene was synthesized de novo after rat codon optimization. The miniSOG sequence in plasmid pminiSOGPM was replaced to obtain plasmid pSOPPPM (Genscript, Nanjing, China), where the SOPP gene sequence was: ATGGAGAAGAGCTTCGTGATCACCGACCCCAGGCTGCCTGACAACCCAATCATCTTCGCCAGCGACGGCTTCCTGGAGCTGACCGAGTACTCCAGGGAGGAGATCCTGGGAAGGAACGGCCGGTTCCTGCAGGGACCCGAGACCGACCAGGCCACCGTGCAGAAGATCAGAGACGCCATCAGAGACCAGCGCGAGATCACCGTGCAGCTGATCAACTACACCAAGTCCGGCAAGAAGTTCTGGAACCTGCTGCACCTGCAGCCCATGCGGGACCAGAAGGGCGAGCTGCAGTACTTCATCGGCGTGCTGCTGGACGGCTAA. AR4-2J cells transfected with plasmid pSOPPPM as verified were named SOPPPM-AR4-2J cells.
For the construction of plasmid pMr5411C71GPM, the Mr5411C71G protein sequence from [57] was used. The Mr5411C71G gene was synthesized de novo with rat codon optimization, which was used to replace the miniSOG sequence in pminiSOGPM (Genscript, Nanjing, China). The Mr5411C71G sequence was ATGGAGACCGGAGGAACCGCCACCAGCCACGTGCCAGACGAGCTGAAGGCAGAGTCCCACAGAGGCGACCCTTTCGCCGCAGCCGTGAGGGCAACCAGGATGCCCATGATCATCACCGACCCTGCCCAGCACGACAACCCAATCGTGTTCGTGAACGACGCCTTCCTGAAGCTGACCGGCTACACCAGGATGGAGGTGGTGGGAAGAAACGGCCGCTTCCTGCAGGGACCAGACACCGAGGCAGCAGCAGTGGACAGACTGAGGGCAGCCATCAGGCGGGAGGAGGACATCAGAGTGGACCTGCTGAACTACCGCAAGGACGGCAGCACCTTCCAGAACGCCCTGTACGTGGGACCCGTGAGGGACGAGGCAGGACGGGTGGTGTACTTCTTCGCCAGCCAGCTGGACGTGTCCGAGCACTACGCCCTGACCGCAGAGATCGAGAGGCTGAAGGCCGCCCTGGCCGAGGCCGAGGCCAAGCTGGCCGCCCGGTAG. AR4-2J cells transfected with plasmid pMr5411C71GPM were named Mr5411C71GPM-AR4-2J cells.
The DsFbFP gene [65] was synthesized de novo after mammalian codon optimization, which was then used to replace miniSOG from plasmid pminiSOGPM (Genscript, Nanjing, China). The DsFbFP gene sequence was ATGAGGCGGCACTACCGCGACCTGATCAGGAACACCCCCATGCCTGACACCCCACAGGACATCGCAGACCTGCGCGCCCTGCTGGACGAGGACGAGGCCGAGATGAGCGTGGTGTTCAGCGACCCATCCCAGCCCGACAACCCTATGATCTACGTGTCCGACGCCTTCCTGGTGCAGACCGGATACACCCTGGAGGAGGTGCTGGGAAGGAACGCAAGATTCCTGCAGGGACCAGACACCAACCCACACGCAGTGGAGGCAATCAGGCAGGGCCTGAAGGCAGAGACCAGATTCACCATCGACATCCTGAACTACAGGAAGGACGGCAGCGCCTTCGTGAACAGACTGCGCATCAGGCCTATCTACGACCCAGAGGGCAACCTGATGTTCTTCGCCGGCGCCCAGAACCCCGTGCTGGAGTAG. Positive AR4-2J cells after transfection with plasmid pDsFbFPPM were named DsFbFPPM-AR4-2J cells.
The plasmid pminiSOGMT was prepared by replacing the PM-localizing sequence ATGCTGTGCTGTATGAGAAGAACCAAACAGGTTGAAAAGAATGATGAGGACCAAAAGATC in pminiSOGPM with the mitochondrial (MT)-targeting sequence (MTS: ATGTCCGTCCTGACGCCGCTGCTGCTGCGGGGCTTGACAGGCTCGGCCCGGCGGCTCCCAGTGCCGCGCGCCAAGATCCATTCGTTGGGGGATCCACCGGTCGCCACC) (Genscript, Nanjing, China). pminiSOGLS was prepared by replacing the PM-localizing ATGCTGTGCTGTATGAGAAGAACCAAACAGGTTGAAAAGAATGATGAGGACCAAAAGATC sequence in pminiSOGPM with the lysosomal (LS) sequence (LTS: ATGAAGGGACAGGGAAGCATGGACGAGGGAACCGCCGACGAGAGGGCCCCCCTGATCCGGACC). Competent E. coli were infected with the plasmid, further cultured on solid LB/kana. Bacteria colonies were picked and cultured in liquid LB/kana with shaking overnight. Propagated plasmids were extracted for sequence verification. The plasmid constructs were designated pminiSOGMT and pminiSOGLS; transformed AR4-2J cells were named miniSOGMT-AR4-2J and miniSOGLS-AR4-2J cells, accordingly.

2.4. Transduction of AR4-2J Cells

AR4-2J cells were cultured in 6-well plates with one round glass cover-slip in each well, and to be transfected, cells were allowed to grow to 50–70% confluence. Plasmid (2 μg/well) and JetPRIME transfection reagent (4 μL/well) in JetPRIME buffer (200 μL) were added; then, AR4-2J cells were cultured for a further 24 h. Positive cellular GEPP expression was verified by confocal imaging of GEPP fluorescence: λex 543 nm for KillerRedPM, and λex 488 nm for miniSOGPM, miniSOG2PM, Mr4511C71GPM, and DsFbFPPM. Mitochondrial or lysosomal expressions of miniSOG (λex 488 nm) were verified by colocalization with MitoTracker Red or LysoTracker Red (λex 543 nm) in confocal imaging (Zeiss LSM510 META), objective × 60 oil.

2.5. RT-PCR to Detect DsFbFP mRNA Expression

RT-PCR (reverse transcription-polymerase chain reaction): HiPure Total RNA Plus Mini Kit (Magen, Guangzhou, China) was used as instructed in the manufacturer’s manual for RNA extraction from AR4-2J and DsFbFPPM-AR4-2J cells. AR4-2J cells cultured in a Petri dish (35 mm) were transfected; twenty-four hours later, cells were washed in PBS before the extraction of RNA. RNA concentration was determined with a Nanodrop2000 nanospectrometer (Thermo Fisher Scientific, Wilmington, DE, USA). mRNA was reverse-transcribed with a GoScript Reverse Transcription Kit A5001 (Promega, Shanghai, China) to obtain cDNA. To a PCR tube was added Oligo (dT) 1 μL, RNA 1 μg, 70 °C denaturation for 5 min, cooled on ice for 5 min, before the addition of the reaction buffer (×5) 5 μL, RNAase inhibitor 1 μL, M-MLV reverse transcriptase 1 μL, dNTP (10 mM) 1.25 μL, topped up with diethyl pyrocarbonate (DEPC)-treated water to 25 μL. Reverse transcription conditions: 40 °C, 60 min and 70 °C, 15 min to obtain cDNA. PCR reaction: 2-μL cDNA template, 15-μL 2×Taq Master Mix (Vazyme, Nanjing, China), primers 1 μL each, topped up to 30 μL. Initial de-naturation 95 °C, 5 min; PCR cycles: 94 °C, 30 s, 60 °C, 30 s, 72 °C, 1.5 min, 30 cycles, and final prolongation 72 °C, 5 min. The RT-PCR product was run on 1% agarose gel with 0.01% GoodView (SaiBaiSheng Inc., Beijing, China) added, 120 V, 40 min before imaging. PCR primers for DsFbFP were: forward 5′-GGCACTACCGCGACCTGATC-3′ and reverse 5′-CTACTCCAGCACGGGGTTCT-3′. Primers for internal reference GAPDH were: forward 5′-GTGGAGTCTACTGGCGTCTT-3′ and reverse 5′-CCAGGATGCCCTTTAGTG-3′.

2.6. Photodynamic Action

KillerRedPM-AR4-2J cells were irradiated with white light (85.3 mW·cm−2, 4 min) from a halogen cold light source (MegaLight 100, Hoya-Schott, Sapporo, Hokkaido, Japan) equipped with a condenser (HLL201). AR4-2J cells expressing PM-localizing miniSOG, miniSOG2, SOPP/miniSOGQ103L, Mr4511C71G, DsFbFP, MT- or LS-localizing miniSOG were irradiated with blue LED (450 nM, 85 mW·cm−2, 1.5 min) (LAMPLIC, Shenzhen, China). Power density was measured at the level of attached cells in the Sykes-Moore perfusion chamber with a power meter (IL1700, International Light Inc., Newburyport, MA, USA). Light-responding transfected AR4-2J cells were identified as GEPP-positive cells.

2.7. Calcium Measurements

Parental control or transfected AR4-2J cells grown on glass cover-slips in 6-well plates were loaded with Fura-2 AM (final concentration 10 μM) for 1 h after assembly in the Sykes-Moore perfusion chamber. Cytosolic calcium was measured in an inverted fluorescent microscope (Nikon TE-2000U) (Shanghai, China) coupled to a Photon Technology International (PTI Inc., now HORIBA, Edison, NJ, USA) calcium measurement system with alternating excitations at 340 nm/380 nm (DeltaRam X); emitted Fura-2 fluorescence (dichroic mirror 400DCLP, emitter 510 ± 40 nm) was detected with a charge-coupled device (CCD) camera (NEO-5.5-CL-3, Andor/Oxford Instruments, Belfast, Northern Ireland, UK). Calcium concentration was expressed as Fura-2 fluorescence ratios F340/F380 and plotted against time with SigmaPlot (Palo Alto, CA, USA), as reported before [29,30,32,62,63,64,66]. In figures shown in Results, original colored calcium tracings were each from individual cells, all from 1 out of N (as indicated in figures, N ≥ 3) identical experiments.

2.8. Data Presentation and Statistical Analysis

All calcium tracings and other graphs were plotted with SigmaPlot. For calculation and comparison of the strength of induced calcium responses, the calcium peak area above the baseline was integrated (usually per 10 min, unless stated otherwise). Statistical data from N (as indicated) independent experiments were presented in bar graphs as mean ± SEM, unless specifically stated otherwise. Student’s t-test was used for statistical analysis against controls, and p < 0.05 was taken as significant and indicated with an asterisk (*).

3. Results

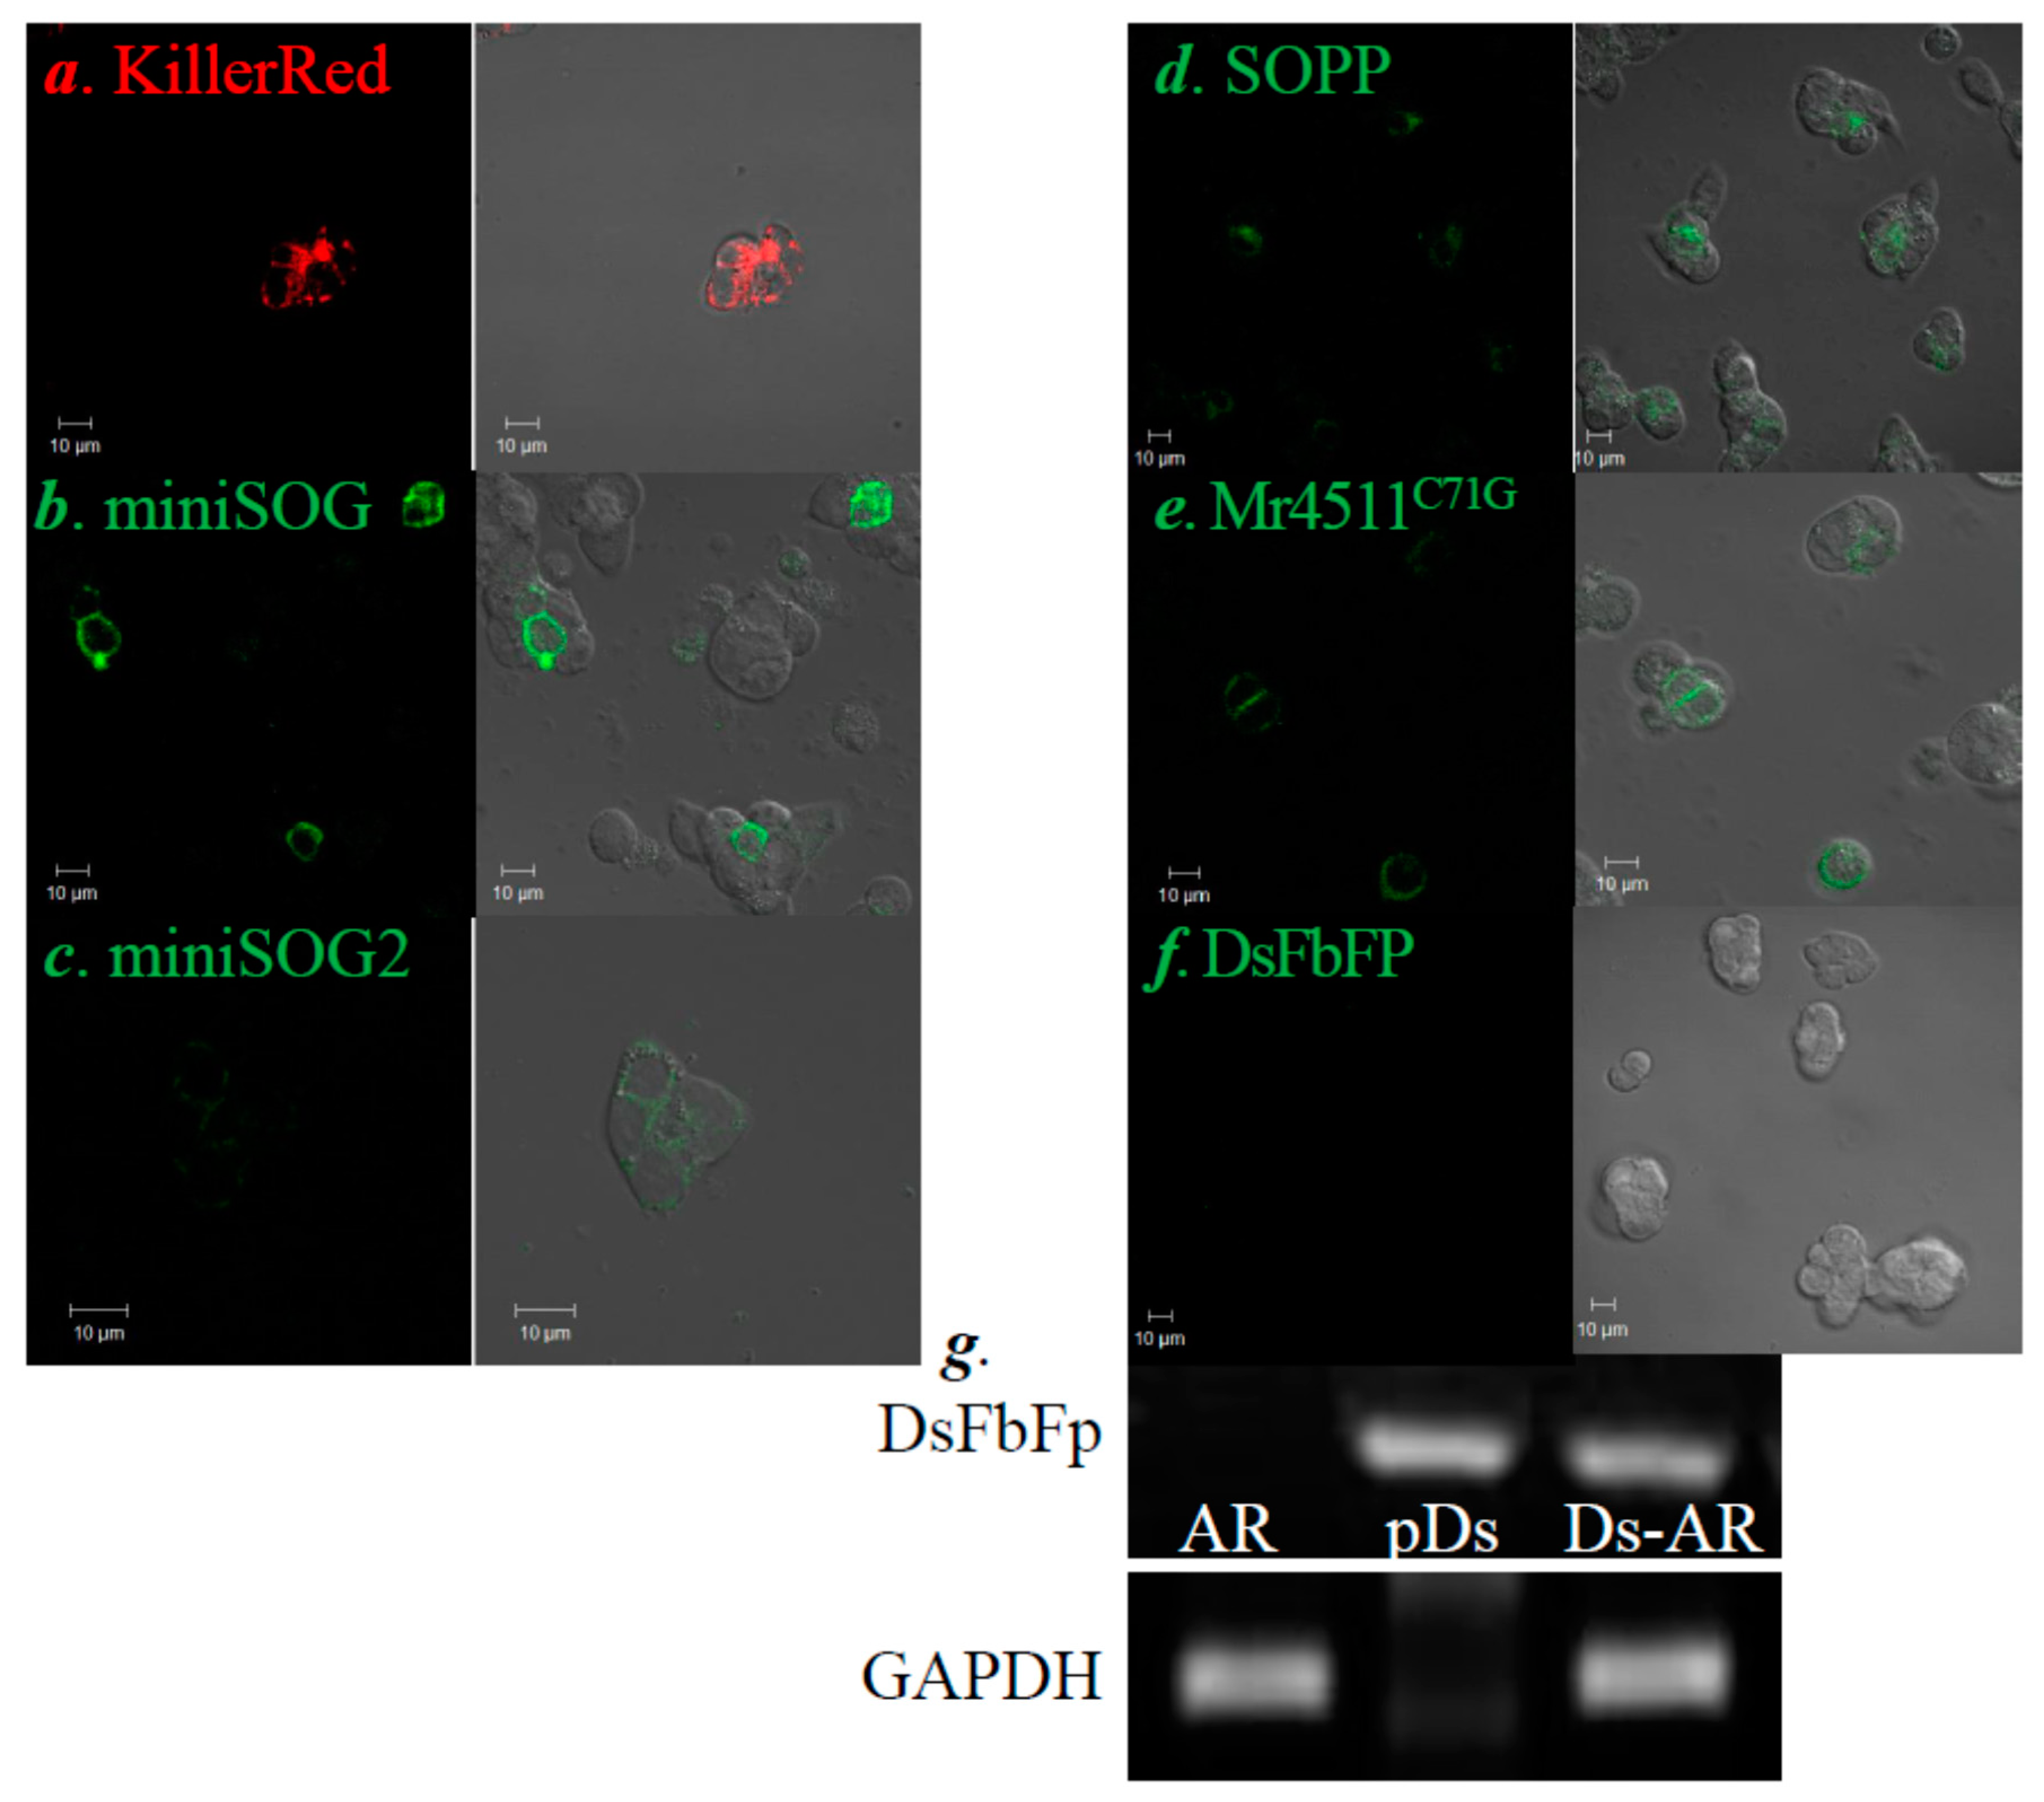
3.1. PM-Delimited Photodynamic CCK1R Activation in AR4-2J Cells with GEPP KillerRed, miniSOG, miniSOG2, SOPP, Mr4511, and DsFbFP

Plasmid pKillerRedPM, pminiSOGPM, pminiSOG2PM, pSOPPPM, pMr4511C71GPM, and pDsFbFP (for the full protein sequence of each of these GEPP, see Table A2) were conducted into AR4-2J cells, and the protein expression was confirmed by GEPP fluorescence imaging (Figure 1a–f). In comparison with the other GEPP (KillerRed, miniSOG, miniSOG2, SOPP and Mr4511C71G), DsFbFP demonstrated markedly dimmer fluorescence, suggesting poorer protein expression, as shown in the confocal images (Figure 1f). RT-PCR experiments revealed that DsFbFP was abundantly expressed at the mRNA level after transfection with plasmid pDsFbFPPM (Figure 1g). The reason for the rather dim DsFbFP fluorescence will be further elaborated below and in Discussion.
The baseline calcium level remained flat after blue LED light irradiation (450 nm, 85 mW‧cm−2, 1.5 min) in parental AR4-2J cells (Figure 2a). Baseline calcium remained flat as well in KillerRedPM-, miniSOGPM-, miniSOG2PM-, SOPPPM-, Mr4511C71GPM-, and DsFbFPPM-AR4-2J cells without light irradiation (not shown). In parallel experiments, white light irradiation (85.3 mW‧cm−2, 4 min) from the halogen light source was found to induce sustained calcium oscillations in KillerRedPM-AR4-2J cells (Figure 2b). Similarly, blue LED light irradiation (450 nm, 85 mW‧cm−2, 1.5 min) elicited persistent calcium oscillations in miniSOGPM- (Figure 2c), miniSOG2PM- (Figure 2d), SOPPPM- (Figure 2e), Mr4511C71GPM- (Figure 2f), and DsFbFPPM-AR4-2J (Figure 2g) cells. Note the very sparse, but distinct, calcium spikes in DsFbFPPM-AR4-2J cells (Figure 2g). This weak calcium response combined with the dim fluorescent imaging shown in Figure 1 would suggest that DsFbFP indeed was conducted into AR4-2J cells, as verified by RT-PCR experiments (Figure 1g). A quantitative analysis of photodynamically-induced calcium spiking in each case found no statistically significant difference in photodynamic CCK1R activation with KillerRed, miniSOG, miniSOG2, SOPP, or Mr4511C71G as the photosensitizer, but the effect was markedly diminished or weaker with DsFbFPPM as the photosensitizer (p < 0.05, Figure 2h).

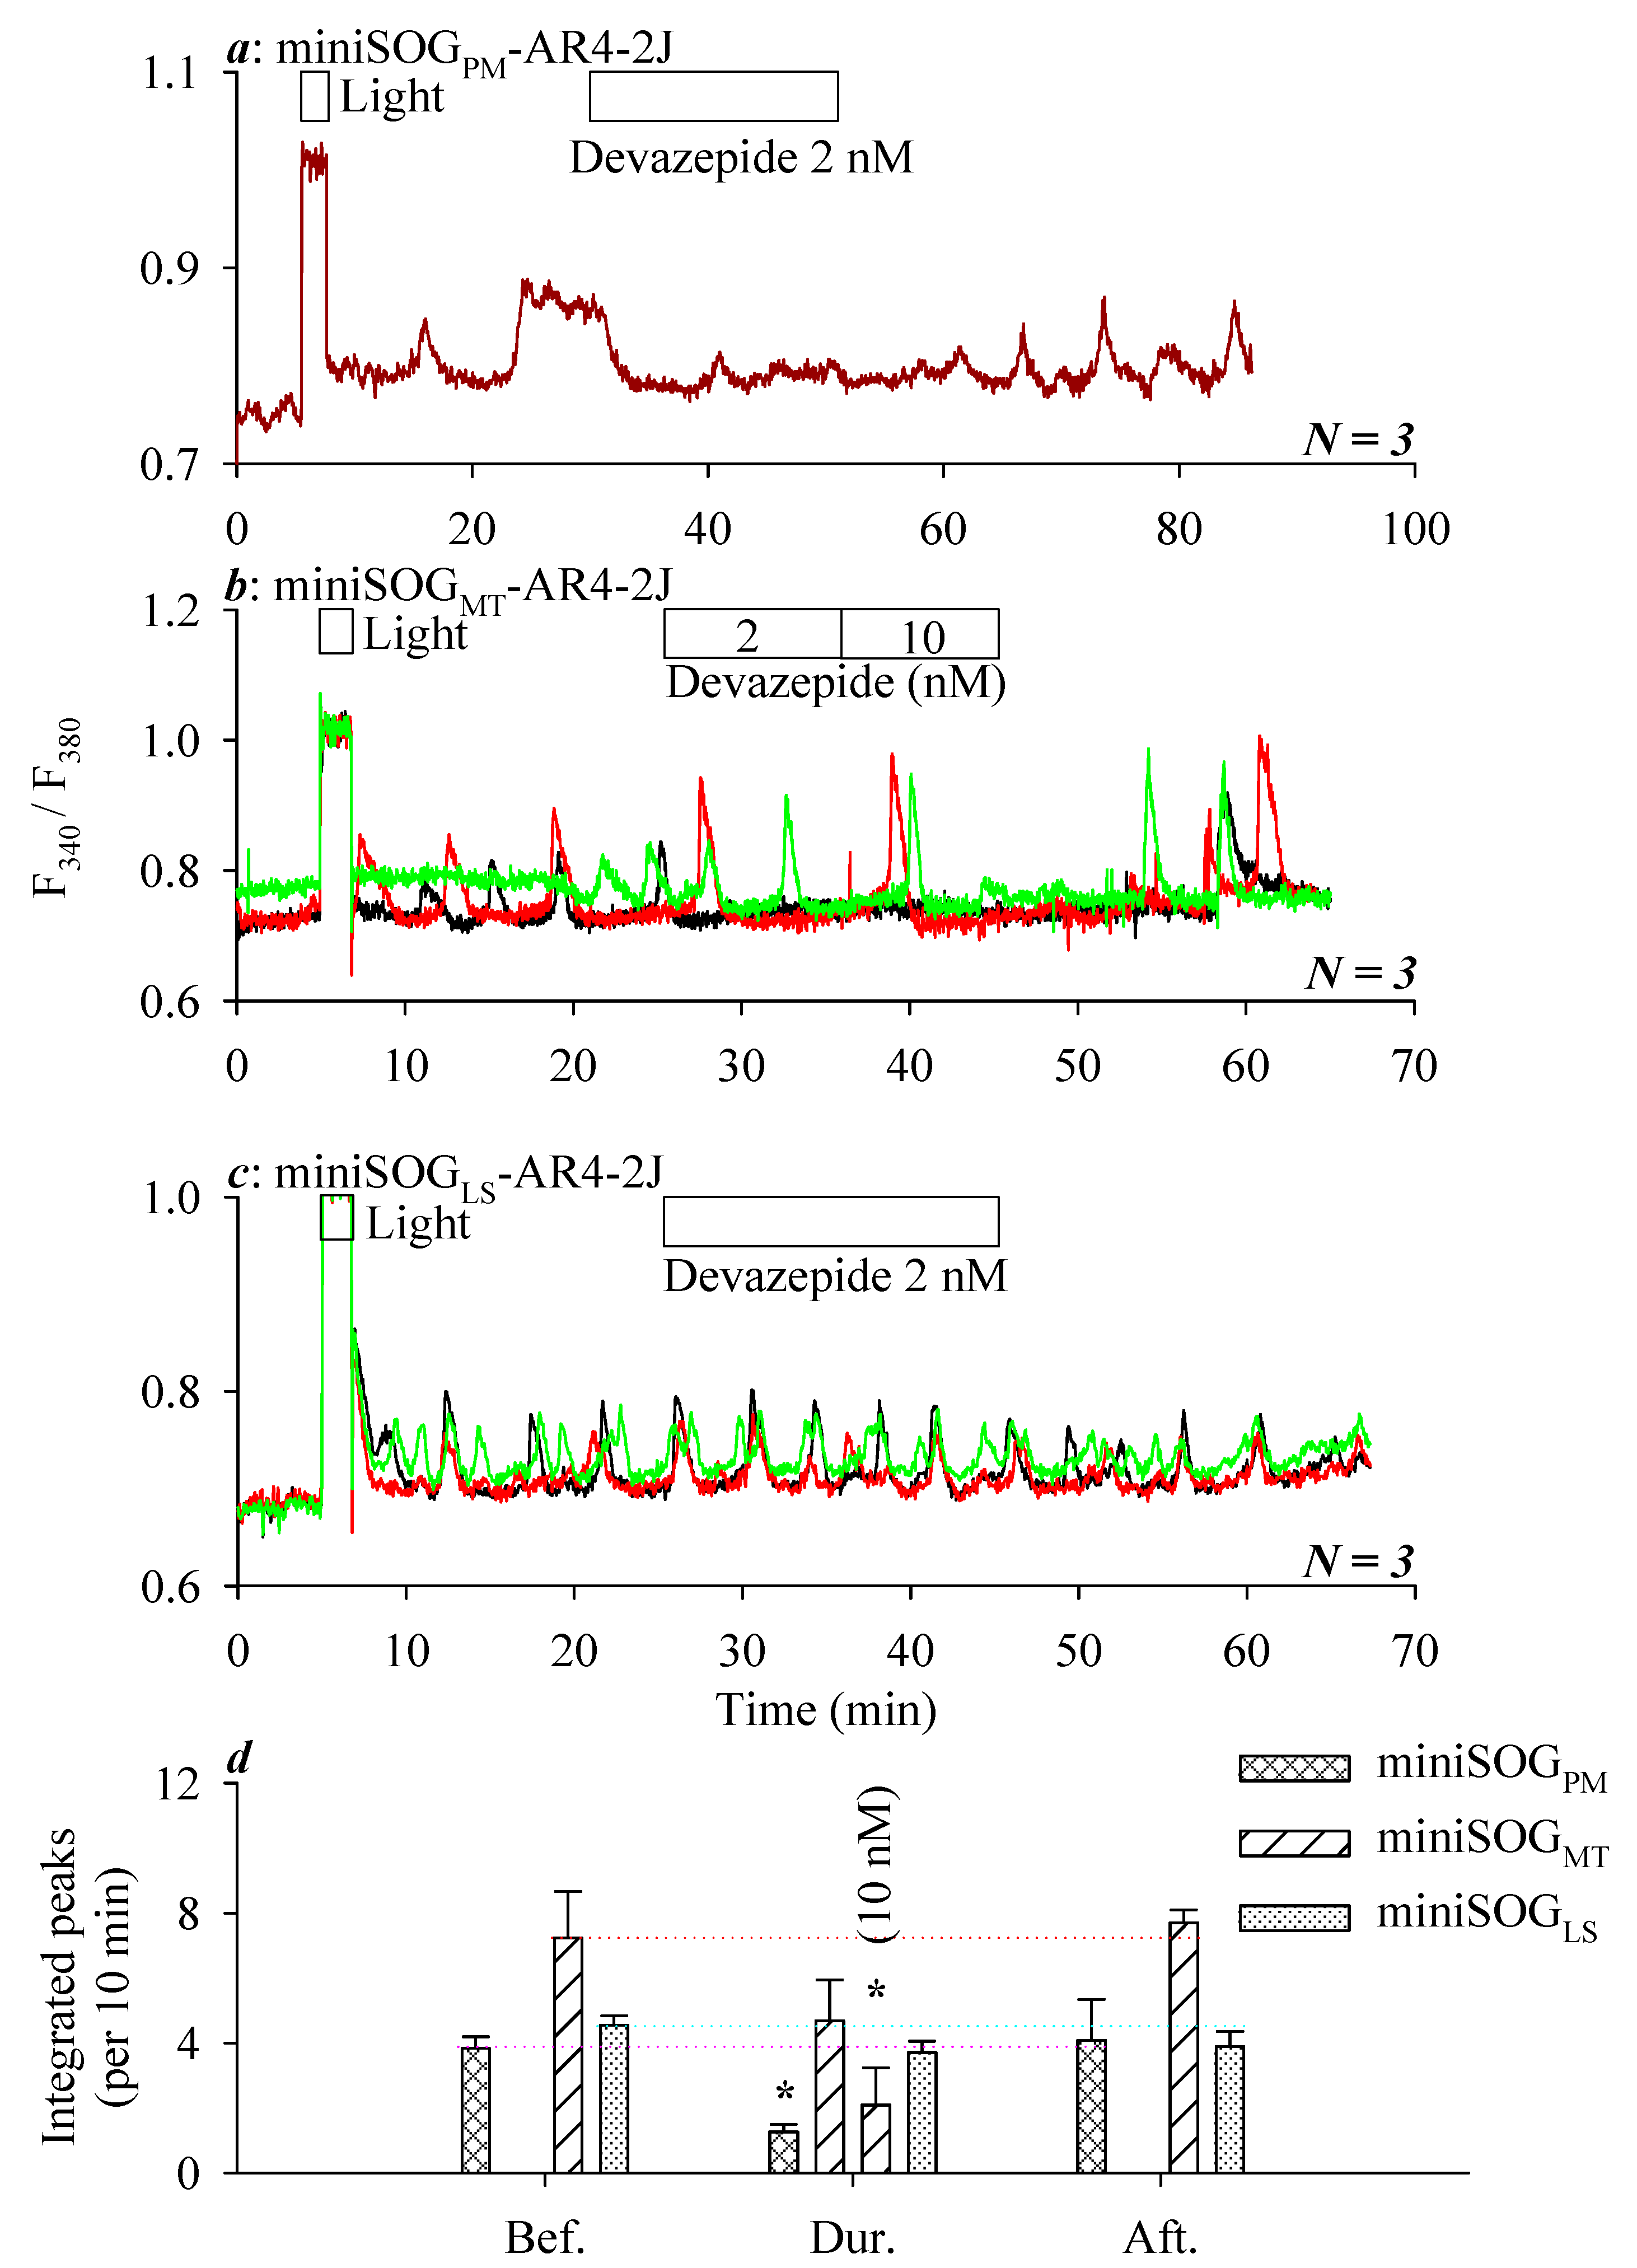
3.2. miniSOG Photodynamic Action in AR4-2J Cells at PM, MT, or LS with Graded Sensivitivity towards Extracellular CCK1R Antagonist

Other than targeting miniSOG to the plasma membrane (PM) like previously reported [31,32], we now examined the miniSOG photodynamic action from the mitochondria (MT) or lysosomes (LS). The miniSOG was targeted to the mitochondria or lysosomes by transfection with vectors pminiSOGMT and pminiSOGLS (Figure 3a), with a mitochondrial localization sequence from human cytochrome C oxidase subunit VIII (MSVLTPLLLRGLTGSARRLPVPRAKIHSLGDPPVAT) [67,68] or with a lysosomal localization sequence from the C-terminal tail sequence of lysosomal-associated membrane protein 1 (LIMP II: KGQGSMDEGTADERAPLIRT) (LTS), respectively [69]. Twenty-four (24) hours after the transfection of AR4-2J cells with plasmid pminiSOGMT or pminiSOGLS, confocal imaging confirmed miniSOG expression in the mitochondria or lysosomes, as judged by their respective co-localization with MitoTracker or LysoTracker (Figure 3b,c).
Blue LED light irradiation (450 nm, 85 mW·cm−2, 1.5 min) was found to have no effect on the baseline calcium level in parental AR4-2J cells, but in these cells, CCK 20 pM induced marked calcium responses (Figure 3d). The baseline calcium remained stable in miniSOGMT-AR4-2J cells kept in the dark (Figure 3e), whereas LED light irradiation (450 nm, 85 mW·cm−2, 1.5 min) induced long-lasting calcium oscillations in miniSOGMT-AR4-2J cells (Figure 3f). The baseline calcium concentration also remained flat in non-irradiated miniSOGLS-AR4-2J cells (Figure 3g), but light irradiation (450 nm, 85 mW·cm−2, 1.5 min) similarly induced long-lasting calcium oscillations in miniSOGLS-AR4-2J cells (Figure 3h).
Quantitative analysis of calcium responses in original tracings, as represented in Figure 3d–h, from N (3–7) identical experiments was calculated and plotted as bar graphs (i). Note the sharp difference in the calcium response after LED light irradiation in parental AR4-2J cells, and dark or light responses in MT or LS miniSOG-transfected AR4-2J cells (i).
In parallel experiments, it was found that calcium oscillations induced by LED light irradiation in miniSOGPM-AR4-2J cells (i.e., miniSOGPM photodynamic action at the plasma membrane) were inhibited nearly completely by the CCK1R antagonist devazepide 2 nM (Figure 4a). LED light irradiation-triggered calcium oscillations were inhibited in miniSOGMT-AR4-2J cells by the CCK1R antagonist devazepide 2 nM but to a lesser extent; a complete blockade was seen with increased devazepide at 10 nM (Figure 4b). LED light irradiation-induced calcium oscillations in miniSOGLS-AR4-2J cells, however, were not inhibited by devazepide 2 nM (Figure 4c).
Quantitative analysis confirmed a significant inhibition by devazepide 2 nM of miniSOGPM photodynamic action (Bef.: 3.84 ± 0.35/100%, Dur.: 1.26 ± 0.23/33%, and Aft.: 4.08 ± 1.26/106%; N = 3) but no effect on miniSOGLS photodynamic action (Bef.: 4.55 ± 0.29/100%, Dur.: 3.72 ± 0.34/82%, and Aft.: 3.89 ± 0.47/85%; N = 3) (Figure 4d). miniSOGMT photodynamic action was inhibited without significance by devazepide 2 nM (Bef.: 6.11 ± 1.05/100%, Dur.: 3.98 ± 0.86/65%, and Aft. 6.33 ± 1.00/103%; N = 3, not shown in bar graph). For the representative experiment shown in Figure 4b, for example, miniSOGMT photodynamic action was inhibited without significance by devazepide 2 nM (from 100% to 65%) but significantly by devazepide 10 nM (from 100% to 29%) (Figure 4d).
Figure 4 suggests that calcium oscillations are triggered by miniSOG photodynamic action not only at the plasma membrane but, also, in mitochondria and lysosomes; a graded inhibition of the triggered calcium oscillations by CCK1R antagonist devazepide 2 nM was found, depending on the subcellular site of the miniSOG photodynamic action: PM > MT > LS.

4. Discussion

In the present work, it was found that PM-expressed KillerRed, miniSOG, miniSOG2, SOPP, Mr4511C71G, and DsFbFP after light irradiation all photodynamically activated CCK1R to induce persistent cytosolic calcium oscillations in AR4-2J cells, but the photodynamic effect of DsFbFP was much reduced in comparison, likely due to poor protein expression. Permanent photodynamic CCK1R activation was achieved in AR4-2J cells by miniSOG expression not only at the plasma membrane (PM) but, also, in mitochondria (MT) and lysosomes (LS). Calcium oscillations induced by miniSOG photodynamic action at intracellular sites showed reduced sensitivity to inhibition by CCK1R antagonist devazepide 2 nM with the order of PM > MT > LS.
CCK1R is unique among A class GPCR in that it is activated permanently by 1O2 generated in type II photodynamic action with SALPC, KillerRed, or miniSOG as the photosensitizer [29,30,31,32]. In the present work, both KillerRed and miniSOG were target-expressed at the plasma membrane in AR4-2J cells (Figure 1); light irradiation (KillerRed with white light 85.3 mW‧cm−2, 4 min and miniSOG with blue LED 450 nm, 85 mW‧cm−2, 1.5 min) triggered long-lasting calcium oscillations in both KillerRedPM-AR4-2J and miniSOGPM-AR4-2J cells (Figure 2). Other than KillerRed and miniSOG, photodynamic CCK1R activation with miniSOG2, SOPP (miniSOGQ103L), Mr4511C71G, and DsFbFP expressed at the plasma membrane (Figure 1) were also found, similarly inducing persistent calcium oscillations in transfected AR4-2J cells (Figure 2). No significant difference in the calculated intensity of calcium oscillations due to photodynamic CCK1R activation was found among KillerRed, miniSOG, miniSOG2, SOPP, or Mr4511C71G, but the photodynamic efficacy of DsFbFP was markedly smaller (Figure 1; Figure 2). These data would suggest that, other than KillerRed and miniSOG, the newly emerged GEPP miniSOG2, SOPP/miniSOGQ103L, Mr4511C71G, and DsFbFP could also be used to permanently activate CCK1R photodynamically.
Although the DsFbFP protein level was low, as shown by the dim DsFbFP fluorescence, DsFbFP mRNA were expressed at sufficient levels in AR4-2J cells, as verified by RT-PCR experiments (Figure 1g). Although the DsFbFP fluorescence quantum yield (ΦFluo = 0.35) [56] is the highest of all GEPP examined in the present work, DsFbFP is also known to be easily photobleached, photobleaching eight times faster than miniSOG (tbl50% miniSOG: 2.85 min and DsFbFP: 0.35 min) [65]. This was borne out by the fact that, although we were able to observe with the naked eye in transfected AR4-2J cells moderate DsFbFp fluorescence under the confocal microscope, photobleaching by the scanning laser light was so fast that it was difficult to capture the fluorescence image. However, the photobleaching of DsFbFP by the excitation light (340, 380 nm) might not be as significant during Fura-2 calcium imaging; therefore, we were able to observe distinct calcium spikes in DsFbFPPM-AR4-2J cells after blue LED irradiation (Figure 2g). DsFbFP (from Dinoroseobacter shibae) has been known to be expressed in CHO-K1 cells as a dimer, which might also affect its fluorescence, unlike the monomeric miniSOG, miniSOG2, or SOPP, all sourced from Arabidopsis thaliana [65,70]. The weak DsFbFP fluorescence in transfected AR4-2J cells is also likely a reflection of poor protein translation from mRNA, since the DsFbFP photodynamic activation of CCK1R was much diminished in comparison with miniSOG (Figure 2). Additional code optimization for mammalian cell expression might improve DsFbFP protein expression. Alternatively, a heterodimeric construct similar to phiSOG [53] might facilitate DsFbFP fluorescence imaging or stabilize its photodynamic efficacy.
miniSOG produces 1O2 after light irradiation in a type II photodynamic action [49,52,71], with an ϕ1O2 of 0.03 (as reviewed in [43]). KillerRed was originally thought to be primarily a type I photosensitizer to generate mainly superoxide anion (O2−.) [43], but more recently, it has been suggested that KillerRed in the cellular milieu almost certainly also generates 1O2 [31,36,43]. Photochemical measurements indeed revealed that KillerRed actually generates eight times more 1O2 than O2−., with an ϕ1O2 of 0.008, whilst monomeric KillerRed SuperNova has an ϕ1O2 of 0.02 [37]. miniSOG2 is reported to be about eight times as efficient as miniSOG to produce reactive oxygen species [48]. The singlet oxygen protein photosensitizer (SOPP or miniSOGQ103L) has a ϕ1O2 of 0.25 [50]. Mr4511C71G sourced from Methylobacterium radiotolerans has a ϕ1O2 of 0.19 [57]. DsFbFP has the highest ϕ1O2 among the lot at 0.33 [56]. Although these protein photosensitizers have varied values of ϕ1O2 from 0.008 to 0.33 (see Table A1), no significant difference in their photodynamic activation of CCK1R (i.e., integrated calcium oscillations) was found except DsFbFP, which has the highest ϕ1O2 value of 0.33 but the weakest photodynamic efficacy (Figure 2). This indicates that photodynamic CCK1R activation could be achieved with GEPP with wide-ranging values of ϕ1O2. However, care must be taken with protein photosensitizers with higher values of ϕ1O2 to avoid photobleaching or possible activation by the ambient light during imaging or calcium measurements.
It has been found by others that blue LED irradiation (450 nm, 0.8 W‧cm−2, 1 min) induced phototoxicity in a small percentage of cells two hours after light irradiation of miniSOG-HEK293, miniSOG2-HEK293, and SOPP-HEK293 cells, but no marked difference was found in HEK293 cells expressing SOPP (9%) with a ϕ1O2 of 0.25 or miniSOG (11%) with a ϕ1O2 of 0.03 [48]. The reason for the satisfactory performance by miniSOG with a ϕ1O2 of only 0.03 to permanently activated photodynamically CCK1R in miniSOGPM-AR4-2J cells in the present work might be related to the progressive photochemical transformation of the fluorophore flavin mononucleotide (FMN) to lumichrome and the photo-oxidization of internal residues in miniSOG to significantly increase its ϕ1O2 up to 10-fold [72]. In this regard, it is interesting to note that with AsLOV2 (not studied in the present work, and its ϕ1O2 is not determined; see Table A1), the LOV2 domain of Avena sativa phototropin 1, light irradiation was found to induce progressive photochemical dissociation or the release of FMN from the AsLOV2 protein moiety, leading to significantly increased ϕ1O2 [59].
Of the GEPP KillerRed, miniSOG, miniSOG2, SOPP, Mr4511C71G, and DsFbFP examined in the present work, KillerRed is excited by the red component (585 nm) of the visible spectrum (full-spectrum white light was used in the present work), whereas all others by blue light (450 nm) (Figure 2) (for the photophysical parameters of GEPP, see Table A2). Although the KillerRed structure is completely different from miniSOG and other flavin-binding protein photosensitizers, the most satisfactory performance by KillerRed reported in the present work (Figure 2) might warrant further photochemical studies to examine possible increases in ϕ1O2 during light irradiation.
For possible future in vivo applications, KillerRed might be better-suited due to its excitation by red light, instead of by blue light for miniSOG, miniSOG2, SOPP, Mr4511C71G, and DsFbFP. It would be ideal if KillerRed could be subjected to further annotations, to shift its maximal excitation peak toward even longer wavelengths (a red shift), possibly by genetic code expansion [73], instead of the blue shifts observed in KillerOrange [46,47] and GreenSuperNova [45]. Although KillerRed is twice the size of miniSOG and larger than MR4511C71G, DsFbFP (see Table A2), KillerRed fusion to CCK1R (CCK1R-KillerRed) were found to still result in, after light irradiation, the effective photodynamic activation of the in-frame CCK1R [31]. In the future, efficient red light-powered KillerRed photodynamic action might be applied to modulate other vital protein machines, such as the membrane molecular architecture of zymogen granules [74].
Other than the plasma membrane expression of miniSOG, mitochondrial (MT) or lysosomal (LS) miniSOG were found to photodynamically trigger persistent calcium oscillations similarly (Figure 3). LED irradiation (450 nm, 85 mW·cm−2, 1.5 min)-induced calcium oscillations were inhibited by CCK1R antagonist devazepide 2 nM significantly in miniSOGPM-CHO-K1 cells, slightly in miniSOGMT-AR4-2J cells, but not at all in miniSOGLS-AR4-2J cells (Figure 4), although LED light irradiation induced-calcium oscillations were significantly inhibited by devazepide 10 nM in miniSOGMT-AR4-2J cells (Figure 4). The calcium oscillations elicited by miniSOG photodynamic action at the plasma membrane and mitochondria were all likely due to CCK1R activation; at lysosomes, it could be due to CCK1R activation, but in lysosomes, activated CCK1R may not be inhibited by an antagonist, possibly due to the partial proteolysis of the receptor protein (Figure 5). We believe that miniSOGMT photodynamic CCK1R activation might be due to 1O2 diffusion from the mitochondria to the plasma membrane at mitochondrion-plasma membrane contact sites, which have been found to be widely present [75,76,77]. Such mitochondrion-plasma membrane contact sites may be tethered by proteins such as Num-1 [75] and are nanometers across in size [78]; therefore, miniSOGMT photodynamically generated 1O2 with a diffusion distance of several tens of nanometers [43] could easily diffuse to the plasma membrane to oxidatively activate CCK1R in miniSOGMT-AR4-2J cells.
The lysosomal accumulation of endocytosized CCK1R and partial CCK1R degradation [62,79,80,81] could possibly account for the miniSOGLS photodynamic CCK1R activation and the little inhibition afforded by CCK1R antagonist devazepide in miniSOGLS-AR4-2J cells. The insensitivity of lysosomal CCK1R to the antagonist devazepide 2 nM might also be due to limited accessibility of lysosomal CCK1R to extracellularly added devazepide 2 nM. Such a reduced sensitivity of intracellular GPCR to ligands was noted before for the nuclear membrane GPCR in cardiomyocytes, for example [82].
Although the emphasis in the present work was the subcellular localization of miniSOG expression and therefore of subcellular 1O2 generation, due to its limited lifetime of 1 µs [83,84,85] the effective diffusion distance of 1O2 in the cellular milieu has been suggested to be in the tens of nanometers or more (20–150 nm) [43,52,83,86,87,88]. Therefore, photodynamically generated 1O2 could diffuse from the plasma membrane (PM), mitochondrial (MT), or lysosomal (LS) membranes as the origin to within a circle with a radius of 20–150 nm.
It may be noted that there is abundant evidence for GPCR expression, localization, and function at nuclear [89], mitochondrial [90,91], or other intracellular membranes, such as melanosomal membranes [92], in addition to GPCR transport from the endoplasmic reticulum (ER) to the Golgi apparatus, transport vesicles, PM, and then from the PM by endocytosis to endosomes/lysosomes [61,93,94]. Cardiomyocytes, for example, are endowed with multiple nuclear-membrane GPCR of the A class, such as α1-, β1-, β3-adrenergic receptors, and AT1R and AT2R angiotensin receptors [95,96,97]. The limited diffusion distance of 1O2 could well help to further investigate GPCR functions at these intracellular sites. Photodynamic GPCR activation/modulation might offer distinct advantages over conventional receptor pharmacology in that no ligand is needed for photodynamic activation after GEPP (KillerRed, miniSOG, miniSOG2, SOPP, Mr4511C71G, and DsFbFP) expression at defined intracellular sites. Only light irradiation is required to permanently activate the intracellular GPCR. The limited diffusion distance of photodynamically generated 1O2 (20–150 nm) may ensure spatial precision and specificity.
In the present work, all GEPP examined were found to elicit persistent calcium oscillations (i.e., permanent CCK1R activation) photodynamically, either from the PM, MT, or LS. We have previously found that the SALPC photodynamic activation of CCK1R in rat pancreatic acini involved the near quantitative transformation of the CCK1R protein dimer to the monomer [98]. In addition, CCK-induced CCK1R monomerization in purified membrane proteins under sub-threshold SALPC photodynamic action closely followed the CCK dose response curve for amylase secretion in intact rat pancreatic acini, especially in the low, physiological range of CCK concentrations [98]. It would be interesting to see whether GEPP photodynamic CCK1R activation would also involve receptor monomerization. Future works should help to identify the essential structural motif(s) for the permanent 1O2 activation of CCK1R.

5. Conclusions

In conclusion, representative GEPP (KillerRed, miniSOG, miniSOG2, SOPP, Mr4511C71G, and DsFbFP) reported in the literature were found to photodynamically activate the endogenous CCK1R in AR4-2J cells after plasma membrane expression. The miniSOG expression at intracellular sites was also found to induce persistent calcium oscillations or CCK1R activation (Figure 5). The present work provides an effective means to activate CCK1R photodynamically, with the potential for in vivo applications in peripheral physiology and in central nervous system functional studies. Photodynamic activation might also prove suitable for the study of intracellular GPCR, which will involve no ligand additions in the extracellular fluid, therefore overcoming the diffusion barrier imposed by the plasma membrane and without the need for long-distance ligand diffusion through the cytosol. The present work might imply that it is now possible to examine the functional status of the CCK1R protein at different maturation and proteolysis stages in the protein trafficking (ER → Golgi apparatus → transport vesicles → PM) and degradation (endosomes, lysosomes, and proteosomes) pathways.

Author Contributions

Conceptualization, Z.J.C.; methodology, Z.J.C.; formal analysis, Y.L. and Z.J.C.; investigation, Y.L.; resources, Z.J.C.; data curation, Y.L.; writing—original draft preparation, Y.L.; writing—review and editing, Z.J.C.; visualization, Y.L.; supervision, Z.J.C.; and funding acquisition, Z.J.C. Both authors (Y.L. and Z.J.C.) have read and agreed to the published version of the manuscript.

Funding

This research was funded by The Natural Science Foundation of China (NSFC), grants No. 31670856 and 31971170. The APC was funded by The Natural Science Foundation of China (NSFC).

Conflicts of Interest

The authors declare no conflict of interest.

Appendix A

Table A1. Genetically encoded protein photosensitizers (GEPP).
PhotosensitizerNo. AAChromophoreλex (nm)λem (nm)ϕ1O2ϕfluo
KillerRed239QYG5856100.0080.25
SuperNova
GreenSuperNova
239
239
QYG
QWG
579
440
610
510
0.022
ND
0.30
0.23
KillerOrange239QWG512550ND0.42
TagRFP237MYG5555840.0040.48
miniSOG106FMN4485000.030.45
AsLOV2175FMN448492NDND
miniSOG2106FMN430503NDND
Mr4511C71S/G
Pp2FbFPL30M
DsFbFP
EcFbFP
CreiLOV
164
148
138
135
119
FMN
FMN
FMN
FMN
FMN
450
449
449
448
449
495
495
498
496
497
0.17/0.19
0.09
0.33
0.07
0.04
ND
0.25
0.35
0.44
0.32
miniSOGQ103L/V106FMN4404870.25/0.390.43
SOPP2/3
phiSOG
phiSOGQ103V
106
218
218
FMN
FMN
FMN
440
449
444
487
498
497
0.51/0.61
0.02
0.15
0.41/0.39
0.36
0.35
Note: No. AA: number of amino acid residues; λex: maximal excitation wavelength; λem: maximal emission wavelength; ϕ1O2: quantum yield of 1O2 generation; ϕfluo: fluorescence quantum yield; (−): generate only O2−.; and ND: not determined. SOPP = miniSOGQ103L.
Table A2. Peptide sequence of KillerRed, miniSOG, miniSOG2, SOPP, Mr4511C71G, and DsFbFP.
Plasmid NameBackboneInsert/Replacement
pKillerRedPMpKillerRedPMKillerRed
MLCCMRRTKQVEKNDEDQKIMGSEGGPALFQSDMTFKIFIDGEVNGQKFTIVADGSSKFPHGDFNVHAVCETGKLPMSWKPICHLIQYGEPFFARYPDGISHFAQECFPEGLSIDRTVRFENDGTMTSHHTYELDDTCVVSRITVNCDGFQPDGPIMRDQLVDILPNETHMFPHGPNAVRQLAFIGFTTADGGLMMGHFDSKMTFNGSRAIEIPGPHFVTIITKQMRDTSDKRDHVCQREVAYAHSVPRITSAIGSDED
pminiSOGPMpKillerRedPMminiSOG
MLCCMRRTKQVEKNDEDQKIMEKSFVITDPRLPDNPIIFASDGFLELTEYSREEILGRNGRFLQGPETDQATVQKIRDAIRDQREITVQLINYTKSGKKFWNLLHLQPMRDQKGELQYFIGVQLDG
pminiSOGMTpminiSOGMTMT localization sequence
MSVLTPLLLRGLTGSARRLPVPRAKIHSLGDPPVATMEKSFVITDPRLPDNPIIFASDGFLELTEYSREEILGRNGRFLQGPETDQATVQKIRDAIRDQREITVQLINYTKSGKKFWNLLHLQPMRDQKGELQYFIGVQLDG
pminiSOGLSpminiSOGLSLS localization sequence
KGQGSMDEGTADERAPLIRTMEKSFVITDPRLPDNPIIFASDGFLELTEYSREEILGRNGRFLQGPETDQATVQKIRDAIRDQREITVQLINYTKSGKKFWNLLHLQPMRDQKGELQYFIGVQLDG
pminiSOG2PMpminiSOGPMminiSOG2
MLCCMRRTKQVEKNDEDQKIMEKSFVITDPRLPDNPIIFASDSFLELTEYSREEILGRNPRFLRGPETDQATVQKIHDAIRDQREITVQLINYTKSGKKFWNLFRLQPIRDQKGELQYFIGVQLDG
pSOPPPMpminiSOGPMSOPP
MLCCMRRTKQVEKNDEDQKIMEKSFVITDPRLPDNPIIFASDGFLELTEYSREEILGRNGRFLQGPETDQATVQKIRDAIRDQREITVQLINYTKSGKKFWNLLHLQPMRDQKGELQYFIGVLLDG
pMr4511C71GPMpminiSOGPMMr4511C71G
MLCCMRRTKQVEKNDEDQKIMETGGTATSHVPDELKAESHRGDPFAAAVRATRMPMIITDPAQHDNPIVFVNDAFLKLTGYTRMEVVGRNGRFLQGPDTEAAAVDRLRAAIRREEDIRVDLLNYRKDGSTFQNALYVGPVRDEAGRVVYFFASQLDVSEHYALTAEIERLKAALAEAEAKLAAR
pDsFbFPPMpminiSOGPMDsFbFP
MLCCMRRTKQVEKNDEDQKIMRRHYRDLIRNTPMPDTPQDIADLRALLDEDEAEMSVVFSDPSQPDNPMIYVSDAFLVQTGYTLEEVLGRNARFLQGPDTNPHAVEAIRQGLKAETRFTIDILNYRKDGSAFVNRLRIRPIYDPEGNLMFFAGAQNPVLE
The color code corresponds to the translated sequences of: the plasma membrane localization sequence, KillerRed, miniSOG, miniSOG2, SOPP/miniSOGQ103L, Mr4511C71G, DsFbFP, and the mitochondrial/lysosomal localization sequence. Note that the Evrogen pKillerRed plasmid does not encode the initial two residues MG.

References

  1. Nishimura, S.; Bilgüvar, K.; Ishigame, K.; Sestan, N.; Günel, M.; Louvi, A. Functional synergy between cholecystokinin receptors CCKAR and CCKBR in mammalian brain development. PLoS ONE 2015, 10, e0124295. [Google Scholar] [CrossRef] [PubMed] [Green Version]
  2. Mohammad, S.; Ozaki, T.; Takeuchi, K.; Unno, K.; Yamoto, K.; Morioka, E.; Takiguchi, S.; Ikeda, M. Functional compensation between cholecystokinin-1 and -2 receptors in murine paraventricular nucleus neurons. J. Biol. Chem. 2012, 287, 39391–39401. [Google Scholar] [CrossRef] [PubMed] [Green Version]
  3. Ozaki, T.; Mohammad, S.; Morioka, E.; Takiguchi, S.; Ikeda, M. Infant satiety depends on transient expression of cholecystokinin-1 receptors on ependymal cells lining the third ventricle in mice. J. Physiol. 2013, 591, 1295–1312. [Google Scholar] [CrossRef] [PubMed]
  4. Honda, T.; Wada, E.; Battey, J.F.; Wank, S.A. Differential gene-expression of CCKA and CCKB receptors in the rat brain. Mol. Cell Neurosci. 1993, 4, 143–154. [Google Scholar] [CrossRef]
  5. Hill, D.R.; Shaw, T.M.; Graham, W.; Woodruff, G.N. Autoradiographical detection of cholecystokinin-A receptors in primate brain using 125I-Bolton Hunter CCK-8 and 3H-MK-329. J. Neurosci. 1990, 10, 1070–1081. [Google Scholar] [CrossRef] [Green Version]
  6. Morton, M.F.; Pyati, J.; Dai, H.; Li, L.; Moreno, V.; Shankley, N.P. Molecular cloning, expression and pharmacological characterization of the canine cholecystokinin 1 receptor. Br. J. Pharmacol. 2005, 145, 374–384. [Google Scholar] [CrossRef] [Green Version]
  7. Mercer, L.D.; Beart, P.M. Histochemistry in rat brain and spinal cord with an antibody directed at the cholecystokininA receptor. Neurosci. Lett. 1997, 225, 97–100. [Google Scholar] [CrossRef]
  8. Mercer, L.D.; Beart, P.M. Immunolocalization of CCK1R in rat brain using a new anti-peptide antibody. Neurosci. Lett. 2004, 359, 109–113. [Google Scholar] [CrossRef]
  9. Yoshimichi, G.; Lo, C.C.; Tamashiro, K.L.; Ma, L.; Lee, D.M.; Begg, D.P.; Liu, M.; Sakai, R.R.; Woods, S.C.; Yoshimatsu, H.; et al. Effect of peripheral administration of cholecystokinin on food intake in apolipoprotein AIV knockout mice. Am. J. Physiol. Gastrointest. Liver Physiol. 2012, 302, 1336–1342. [Google Scholar] [CrossRef] [Green Version]
  10. Broberger, C.; Holmberg, K.; Shi, T.J.; Dockray, G.; Hökfelt, T. Expression and regulation of cholecystokinin and cholecystokinin receptors in rat nodose and dorsal root ganglia. Brain Res. 2001, 903, 128–140. [Google Scholar] [CrossRef]
  11. Bucinskaite, V.; Kurosawa, M.; Lundeberg, T. Exogenous cholecystokinin-8 reduces vagal efferent nerve activity in rats through CCKA receptors. Br. J. Pharm. 2000, 129, 1649–1654. [Google Scholar] [CrossRef] [Green Version]
  12. Glatzle, J.; Wang, Y.; Adelson, D.W.; Kalogeris, T.J.; Zittel, T.T.; Tso, P.; Wei, J.Y.; Raybould, H.E. Chylomicron components activate duodenal vagal afferents via a cholecystokinin A receptor-mediated pathway to inhibit gastric motor function in the rat. J. Physiol. 2003, 550, 657–664. [Google Scholar] [CrossRef] [PubMed]
  13. Li, Y.; Wu, X.; Zhou, S.; Owyang, C. Low-affinity CCK-A receptors are coexpressed with leptin receptors in rat nodose ganglia: Implications for leptin as a regulator of short-term satiety. Am. J. Physiol. Gastrointest. Liver Physiol. 2011, 300, G217–G227. [Google Scholar] [CrossRef] [PubMed] [Green Version]
  14. Mussa, B.M.; Sartor, D.M.; Verberne, A.J. Activation of cholecystokinin (CCK 1) and serotonin (5-HT 3) receptors increases the discharge of pancreatic vagal afferents. Eur J. Pharm. 2008, 601, 198–206. [Google Scholar] [CrossRef] [PubMed]
  15. Patterson, L.M.; Zheng, H.; Ward, S.M.; Berthoud, H.R. Immunohistochemical identification of cholecystokinin A receptors on interstitial cells of Cajal, smooth muscle, and enteric neurons in rat pylorus. Cell Tissue Res. 2001, 305, 11–23. [Google Scholar] [CrossRef] [PubMed]
  16. Patterson, L.M.; Zheng, H.; Berthoud, H.R. Vagal afferents innervating the gastrointestinal tract and CCKA-receptor immunoreactivity. Anat. Rec. 2002, 266, 10–20. [Google Scholar] [CrossRef] [PubMed]
  17. Yamamoto, Y.; Akiyoshi, J.; Kiyota, A.; Katsuragi, S.; Tsutsumi, T.; Isogawa, K.; Nagayama, H. Increased anxiety behavior in OLETF rats without cholecystokinin-A receptor. Brain Res. Bull. 2000, 53, 789–792. [Google Scholar] [CrossRef]
  18. Wen, D.; Sun, D.; Zang, G.; Hao, L.; Liu, X.; Yu, F.; Ma, C.; Cong, B. Cholecystokinin octapeptide induces endogenous opioid-dependent anxiolytic effects in morphine-withdrawal rats. Neuroscience 2014, 277, 14–25. [Google Scholar] [CrossRef]
  19. Zhu, G.; Yan, J.; Smith, W.W.; Moran, T.H.; Bi, S. Roles of dorsomedial hypothalamic cholecystokinin signaling in the controls of meal patterns and glucose homeostasis. Physiol. Behav. 2012, 105, 234–241. [Google Scholar] [CrossRef] [Green Version]
  20. Sui, Y.; Vermeulen, R.; Hokfelt, T.; Horne, M.K.; Stanic, D. Female mice lacking cholecystokinin 1 receptors have compromised neurogenesis, and fewer dopaminergic cells in the olfactory bulb. Front. Cell Neurosci. 2013, 7, 1. [Google Scholar] [CrossRef] [Green Version]
  21. Matsushita, H.; Akiyoshi, J.; Kai, K.; Ishii, N.; Kodama, K.; Tsutsumi, T.; Isogawa, K.; Nagayama, H. Spatial memory impairment in OLETF rats without cholecystokinin-A receptor. Neuropeptides 2003, 37, 271–276. [Google Scholar] [CrossRef]
  22. Lo, C.C.; Davidson, W.S.; Hibbard, S.K.; Georgievsky, M.; Lee, A.; Tso, P.; Woods, S.C. Intraperitoneal CCK and fourth-intraventricular Apo AIV require both peripheral and NTS CCK1R to reduce food intake in male rats. Endocrinology 2014, 155, 1700–1707. [Google Scholar] [CrossRef] [PubMed] [Green Version]
  23. Dunn, I.C.; Meddle, S.L.; Wilson, P.W.; Wardle, C.A.; Law, A.S.; Bishop, V.R.; Hindar, C.; Robertson, G.W.; Burt, D.W.; Ellison, S.J.; et al. Decreased expression of the satiety signal receptor CCKAR is responsible for increased growth and body weight during the domestication of chickens. Am. J. Physiol. Endocrinol. Metab. 2013, 304, E909–E921. [Google Scholar] [CrossRef] [PubMed] [Green Version]
  24. Suzuki, S.; Takiguchi, S.; Sato, N.; Kanai, S.; Kawanami, T.; Yoshida, Y.; Miyasaka, K.; Takata, Y.; Funakoshi, A.; Noda, T. Importance of CCK-A receptor for gallbladder contraction and pancreatic secretion: A study in CCK-A receptor knockout mice. JPN J. Physiol. 2001, 51, 585–590. [Google Scholar] [CrossRef] [PubMed] [Green Version]
  25. Takiguchi, S.; Suzuki, S.; Sato, Y.; Kanai, S.; Miyasaka, K.; Jimi, A.; Shinozaki, H.; Takata, Y.; Funakoshi, A.; Kono, A.; et al. Role of CCK-A receptor for pancreatic function in mice: A study in CCK-A receptor knockout mice. Pancreas 2002, 24, 276–283. [Google Scholar] [CrossRef]
  26. Schmidt, W.E.; Schenk, S.; Nustede, R.; Holst, J.J.; Fölsch, U.R.; Creutzfeldt, W. Cholecystokinin is a negative regulator of gastric acid secretion and postprandial release of gastrin in humans. Gastroenterology 1994, 107, 1610–1620. [Google Scholar] [CrossRef]
  27. Whited, K.L.; Thao, D.; Lloyd, K.C.; Kopin, A.S.; Raybould, H.E. Targeted disruption of the murine CCK1 receptor gene reduces intestinal lipid-induced feedback inhibition of gastric function. Am. J. Physiol. Gastrointest. Liver Physiol. 2006, 291, G156–G162. [Google Scholar] [CrossRef] [Green Version]
  28. Varga, G.; Bálint, A.; Burghardt, B.; D'Amato, M. Involvement of endogenous CCK and CCK1 receptors in colonic motor function. Br. J. Pharm. 2004, 141, 1275–1284. [Google Scholar] [CrossRef] [Green Version]
  29. Cui, Z.J.; Kanno, T. Photodynamic triggering of calcium oscillation in the isolated rat pancreatic acini. J. Physiol. 1997, 504, 47–55. [Google Scholar] [CrossRef] [Green Version]
  30. An, Y.P.; Xiao, R.; Cui, H.; Cui, Z.J. Selective activation by photodynamic action of cholecystokinin receptor in the freshly isolated rat pancreatic acini. Br. J. Pharm. 2003, 139, 872–880. [Google Scholar] [CrossRef] [Green Version]
  31. Jiang, H.N.; Li, Y.; Cui, Z.J. Cholecystokinin 1 receptor-a unique G protein-coupled receptor activated by singlet oxygen (GPCR-ABSO). Front. Physiol. 2018, 9, 497. [Google Scholar] [CrossRef] [PubMed] [Green Version]
  32. Li, Y.; Cui, Z.J. NanoLuc bioluminescence-driven photodynamic activation of cholecystokinin 1 receptor with genetically encoded protein photosensitizer miniSOG. Int. J. Mol. Sci. 2020, 21, 3763. [Google Scholar] [CrossRef] [PubMed]
  33. Bulina, M.E.; Lukyanov, K.A.; Britanova, O.V.; Onichtchouk, D.; Lukyanov, S.; Chudakov, D.M. Chromophore-assisted light inactivation (CALI) using the phototoxic fluorescent protein KillerRed. Nat. Protoc. 2006, 1, 947–953. [Google Scholar] [CrossRef] [PubMed]
  34. Pletnev, N.V.; Lukyanov, K.A.; Chudakov, D.M.; Martynov, V.I.; Popov, V.O.; Kovalchuk, M.V.; Wlodawer, A.; Dauter, Z.; Pletnev, V. Structural basis for phototoxicity of the genetically encoded photosensitizer KillerRed. J. Biol. Chem. 2009, 284, 32028–32039. [Google Scholar] [CrossRef] [Green Version]
  35. Vegh, R.B.; Solntsev, K.M.; Kuimova, M.K.; Cho, S.; Liang, Y.; Loo BLTolbert, L.M.; Bommarius, A.S. Reactive oxygen species in photochemistry of the red fluorescent protein “Killer Red”. Chem. Commun. 2011, 47, 4887–4889. [Google Scholar] [CrossRef]
  36. Petrova, N.V.; Luzhin, A.V.; Serebrovskaya, E.O.; Ryumina, A.P.; Velichko, A.K.; Razin, S.V.; Kantidze, O.L. Inducing cellular senescence in vitro by using genetically encoded photosensitizers. Aging Us 2016, 8, 2449. [Google Scholar] [CrossRef] [Green Version]
  37. Onukwufor, J.O.; Trewin, A.J.; Baran, T.M.; Almast, A.; Foster, T.H.; Wojtovich, A.P. Quantification of reactive oxygen species production by the red fluorescent proteins KillerRed, SuperNova and mCherry. Free Radic. Biol. Med. 2019, 147, 1–7. [Google Scholar] [CrossRef]
  38. Shu, X.; Lev-Ram, V.; Deerinck, T.J.; Qi, Y.; Ramko, E.B.; Davidson, M.W.; Jin, Y.; Ellisman, M.H.; Tsien, R.Y. A genetically encoded tag for correlated light and electron microscopy of intact cells, tissues, and organisms. PLoS Biol. 2011, 9, e1001041. [Google Scholar] [CrossRef] [Green Version]
  39. Rodríguez-Pulido, A.; Cortajarena, A.L.; Torra, J.; Ruiz-González, R.; Nonell, S.; Flors, C. Assessing the potential of photosensitizing flavoproteins as tags for correlative microscopy. Chem. Commun. (CAMB) 2016, 52, 8405–8408. [Google Scholar] [CrossRef] [Green Version]
  40. Lin, J.Y.; Sann, S.B.; Zhou, K.; Nabavi, S.; Proulx, C.D.; Malinow, R.; Jin, Y.; Tsien, R.Y. Optogenetic inhibition of synaptic release with chromophore-assisted light inactivation (CALI). Neuron 2013, 79, 241–253. [Google Scholar] [CrossRef] [Green Version]
  41. Zhou, K.; Stawicki, T.M.; Goncharov, A.; Jin, Y. Position of UNC-13 in the active zone regulates synaptic vesicle release probability and release kinetics. Elife 2013, 2, e01180. [Google Scholar] [CrossRef] [PubMed]
  42. Gao, W.; Su, Z.; Liu, Q.; Zhou, L. State-dependent and site-directed photodynamic transformation of HCN2 channel by singlet oxygen. J. Gen. Physiol. 2014, 143, 633–644. [Google Scholar] [CrossRef] [PubMed] [Green Version]
  43. Jiang, H.N.; Li, Y.; Cui, Z.J. Photodynamic physiology—Photonanomanipulations in cellular physiology with protein photosensitisers. Front. Physiol. 2017, 8, 191. [Google Scholar] [CrossRef] [PubMed] [Green Version]
  44. Takemoto, K.; Matsuda, T.; Sakai, N.; Fu, D.; Noda, M.; Uchiyama, S.; Kotera, I.; Arai, Y.; Horiuchi, M.; Fukui, K. SuperNova, a monomeric photosensitizing fluorescent protein for chromophore-assisted light inactivation. Sci. Rep. 2013, 3, 2629. [Google Scholar] [CrossRef] [Green Version]
  45. Riani, Y.D.; Matsuda, T.; Takemoto, K.; Nagai, T. Green monomeric photosensitizing fluorescent protein for photo-inducible protein inactivation and cell ablation. BMC Biol. 2018, 16, 50. [Google Scholar] [CrossRef] [Green Version]
  46. Pletneva, N.V.; Pletnev, V.Z.; Sarkisyan, K.S.; Gorbachev, D.A.; Egorov, E.S.; Mishin, A.S.; Lukyanov, K.A.; Dauter, Z.; Pletnev, S. Crystal structure of phototoxic orange fluorescent proteins with a tryptophan-based chromophore. PLoS ONE 2015, 10, e0145740. [Google Scholar] [CrossRef]
  47. Sarkisyan, K.S.; Zlobovskaya, O.A.; Gorbachev, D.A.; Bozhanova, N.G.; Sharonov, G.V.; Staroverov, D.B.; Egorov, E.S.; Ryabova, A.V.; Solntsev, K.M.; Mishin, A.S.; et al. KillerOrange, a genetically encoded photosensitizer activated by blue and green light. PLoS ONE 2015, 10, e0145287. [Google Scholar] [CrossRef]
  48. Makhijani, K.; To, T.L.; Ruiz-González, R.; Lafaye, C.; Royant, A.; Shu, X. Precision optogenetic tool for selective single- and multiple-cell ablation in a live animal model system. Cell Chem. Biol. 2017, 24, 110–119. [Google Scholar] [CrossRef] [Green Version]
  49. Ruiz-González, R.; Cortajarena, A.L.; Mejias, S.H.; Agut, M.; Nonell, S.; Flors, C. Singlet oxygen generation by the genetically encoded tag miniSOG. J. Am. Chem. Soc. 2013, 135, 9564–9567. [Google Scholar] [CrossRef]
  50. Westberg, M.; Holmegaard, L.; Pimenta, F.M.; Etzerodt, M.; Ogilby, P.R. Rational design of an efficient, genetically encodable, protein encased singlet oxygen photosensitizer. J. Am. Chem. Soc. 2015, 137, 1632–1642. [Google Scholar] [CrossRef]
  51. Westberg, M.; Bregnhøj, M.; Etzerodt, M.; Ogilby, P.R. No photon wasted: An efficient and selective singlet oxygen photosensitizing protein. J. Phys. Chem. B 2017, 121, 9366–9371. [Google Scholar] [CrossRef] [PubMed]
  52. Westberg, M.; Etzerodt, M.; Ogilby, P.R. Rational design of genetically encoded singlet oxygen photosensitizing proteins. Curr. Opin. Struct. Biol. 2019, 57, 56–62. [Google Scholar] [CrossRef] [PubMed]
  53. Rodriguez-Pulido, A.; Torra, J.; Mejias, S.H.; Cortajarena, A.L.; Ruiz-Gonzalez, R.; Nonell, S.; Flors, C. Fluorescent flavoprotein heterodimers: Combining photostability with singlet oxygen generation. ChemPhotoChem 2018, 2, 571–574. [Google Scholar] [CrossRef] [Green Version]
  54. Ruiz-González, R.; White, J.H.; Agut, M.; Nonell, S.; Flors, C. A genetically-encoded photosensitiser demonstrates killing of bacteria by purely endogenous singlet oxygen. Photochem Photobiol Science 2012, 11, 1411–1413. [Google Scholar] [CrossRef] [PubMed]
  55. Torra, J.; Burgos-Caminal, A.; Endres, S.; Wingen, M.; Drepper, T.; Gensch, T.; Ruiz-González, R.; Nonell, S. Singlet oxygen photosensitisation by the fluorescent protein Pp2FbFP L30M, a novel derivative of Pseudomonas putida flavin-binding Pp2FbFP. Photochem. Photobiol. Sci. 2015, 14, 280–287. [Google Scholar] [CrossRef]
  56. Endres, S.; Wingen, M.; Torra, J.; Ruiz-Gonzalez, R.; Polen, T.; Bosio, G.; Bitzenhofer, N.L.; Hilgers, F.; Gensch, T.; Nonell, S.; et al. An optogenetic toolbox of LOV-based photosensitizers for light-driven killing of bacteria. Sci. Rep. 2018, 8, 15021. [Google Scholar] [CrossRef] [Green Version]
  57. Consiglieri, E.; Xu, Q.Z.; Bregnhoj, M.; Westberg, M.; Ogilby, P.R.; Losi, A. Single mutation in a novel bacterial LOV protein yields a singlet oxygen generator. Photochem. Photobiol. Sci. 2019, 18, 2657–2660. [Google Scholar] [CrossRef]
  58. Lu, H.X.; Mazumder, M.; Jaikaran, A.S.I.; Kumar, A.; Leis, E.K.; Xu, X.L.; Altmann, M.; Cochrane, A.; Woolley, G.A. A yeast system for discovering optogenetic inhibitors of eukaryotic translation initiation. ACS Synth. Biol. 2019, 8, 744–757. [Google Scholar] [CrossRef]
  59. Petrencakova, M.; Filandr, F.; Hovan, A.; Yassaghi, G.; Man, P.; Kozar, T.; Schwer, M.-S.; Jancura, D.; Pluckthun, A.; Novak, P.; et al. Photoinduced damage of AsLOV2 domain is accompanied by increased singlet oxygen production due to flavin dissociation. Sci. Rep. 2020, 10, 4119. [Google Scholar] [CrossRef] [Green Version]
  60. Stäubert, C.; Schöneberg, T. GPCR signaling from intracellular membranesA novel concept. Bioessays 2017, 39, 1700200. [Google Scholar] [CrossRef]
  61. Hill, S.J.; Watson, S.P. Fluorescence approaches unravel spatial and temporal aspects of GPCR organisation, location, and intracellular signalling. Trends Pharm. Sci. 2018, 39, 91–92. [Google Scholar] [CrossRef] [PubMed] [Green Version]
  62. Duan, Y.J.; Liang, H.Y.; Jin, W.J.; Cui, Z.J. Substance P conjugated to CdTe quantum dots triggers cytosolic calcium oscillations and induces quantum dots internalization in the pancreatic carcinoma cell line AR4-2J. Anal. Bioanal. Chem. 2011, 400, 2995–3003. [Google Scholar] [CrossRef] [PubMed]
  63. Guo, H.Y.; Cui, Z.J. Extracellular histones activate plasma membrane Toll-like receptor 9 to trigger calcium oscillations in rat pancreatic acinar tumor cell AR4-2J. Cells 2019, 8, 3. [Google Scholar] [CrossRef] [PubMed] [Green Version]
  64. Liu, J.S.; Cui, Z.J. Pancreatic stellate cells serve as a brake mechanism on pancreatic acinar cell calcium signaling modulated by methionine sulfoxide reductase expression. Cells 2019, 8, 109. [Google Scholar] [CrossRef] [Green Version]
  65. Wingen, M.; Potzkei, J.; Endres, S.; Casini, G.; Rupprecht, C.; Fahlke, C.; Krauss, U.; Jaeger, K.E.; Drepper, T.; Gensch, T. The photophysics of LOV-based fluorescent proteins--new tools for cell biology. Photochem. Photobiol. Sci. 2014, 13, 875–883. [Google Scholar] [CrossRef] [PubMed] [Green Version]
  66. Tang, W.Z.; Cui, Z.J. Permanent photodynamic activation of the cholecystokinin 2 receptor. Biomolecules 2020, 10, 236. [Google Scholar] [CrossRef] [Green Version]
  67. Shibuya, T.; Tsujimoto, Y. Deleterious effects of mitochondrial ROS generated by KillerRed photodynamic action in human cell lines and C. elegans. J. Photochem. Photobiol. B Biol. 2012, 117, 1–12. [Google Scholar] [CrossRef]
  68. Yang, J.Y.; Yang, W.Y. Spatiotemporally controlled initiation of Parkin-mediated mitophagy within single cells. Autophagy 2011, 7, 1230–1238. [Google Scholar] [CrossRef] [Green Version]
  69. Tabuchi, N.; Akasaki, K.; Tsuji, H. Two acidic amino acid residues, Asp(470) and Glu(471), contained in the carboxyl cytoplasmic tail of a major lysosomal membrane protein, LGP85/LIMP II, are important for its accumulation in secondary lysosomes. Biochem. Biophys. Res. Commun. 2000, 270, 557–563. [Google Scholar] [CrossRef]
  70. Drepper, T.; Eggert, T.; Circolone, F.; Heck, A.; Krauss, U.; Guterl, J.K.; Wendorff, M.; Losi, A.; Gärtner, W.; Jaeger, K.E. Reporter proteins for in vivo fluorescence without oxygen. Nat. Biotechnol. 2007, 25, 443–445. [Google Scholar] [CrossRef]
  71. Pimenta, F.M.; Jensen, R.L.; Breitenbach, T.; Etzerodt, M.; Ogilby, P.R. Oxygen-dependent photochemistry and photophysics of “miniSOG,” a protein-encased flavin. Photochem. Photobiol. 2013, 89, 1116–1126. [Google Scholar] [CrossRef] [PubMed]
  72. Torra, J.; Lafaye, C.; Signor, L.; Aumonier, S.; Flors, C.; Shu, X.; Nonell, S.; Gotthard, G.; Royant, A. Tailing miniSOG: Structural bases of the complex photophysics of a flavin-binding singlet oxygen photosensitizing protein. Sci. Rep. 2019, 9, 2428. [Google Scholar] [CrossRef] [PubMed]
  73. Wang, L.; Chen, X.; Guo, X.; Li, J.; Liu, Q.; Kang, F.; Wang, X.; Hu, C.; Liu, H.; Gong, W.; et al. Significant expansion and red-shifting of fluorescent protein chromophore determined through computational design and genetic code expansion. Biophys. Rep. 2018, 4, 273–285. [Google Scholar] [CrossRef] [PubMed]
  74. Lee, J.S.; Caruso, J.A.; Hubbs, G.; Schnepp, P.; Woods, J.; Fang, J.; Li, C.; Zhang, K.; Stemmer, P.M.; Jena, B.P.; et al. Molecular architecture of mouse and human pancreatic zymogen granules: Protein components and their copy numbers. Biophys. Rep. 2018, 4, 94–103. [Google Scholar] [CrossRef] [Green Version]
  75. Westermann, B. The mitochondria-plasma membrane contact site. Curr. Opin. Cell Biol. 2015, 35, 1–6. [Google Scholar] [CrossRef]
  76. Szymański, J.; Janikiewicz, J.; Michalska, B.; Patalas-Krawczyk, P.; Perrone, M.; Ziółkowski, W.; Duszyński, J.; Pinton, P.; Dobrzyń, A.; Więckowski, M.R. Interaction of mitochondria with the endoplasmic reticulum and plasma membrane in calcium homeostasis, lipid trafficking and mitochondrial structure. Int. J. Mol. Sci. 2017, 18, 1576. [Google Scholar] [CrossRef]
  77. Eisenberg-Bord, M.; Schuldiner, M. Mitochatting—If only we could be a fly on the cell wall. Biochim. Biophys. Acta Mol. Cell Res. 2017, 1864, 1469–1480. [Google Scholar] [CrossRef]
  78. Gatta, A.T.; Levine, T.P. Piecing together the patchwork of contact sites. Trends Cell Biol. 2017, 27, 214–229. [Google Scholar] [CrossRef]
  79. Tarasova, N.I.; Stauber, R.H.; Choi, J.K.; Hudson, E.A.; Czerwinski, G.; Miller, J.L.; Pavlakis, G.N.; Michejda, C.J.; Wank, S.A. Visualization of G protein-coupled receptor trafficking with the aid of the green fluorescent protein. Endocytosis and recycling of cholecystokinin receptor type A. J. Biol. Chem. 1997, 272, 14817–14824. [Google Scholar] [CrossRef] [Green Version]
  80. Roettger, B.F.; Rentsch, R.U.; Pinon, D.; Holicky, E.; Hadac, E.; Larkin, J.M.; Miller, L.J. Dual pathways of internalization of the cholecystokinin receptor. J. Cell Biol. 1995, 128, 1029–1041. [Google Scholar] [CrossRef] [Green Version]
  81. Cawston, E.E.; Harikumar, K.G.; Miller, L.J. Ligand-induced internalization of the type 1 cholecystokinin receptor independent of recognized signaling activity. Am. J. Physiol. Cell Physiol. 2012, 302, C615–C627. [Google Scholar] [CrossRef] [PubMed] [Green Version]
  82. Tadevosyan, A.; Vaniotis, G.; Allen, B.G.; Hébert, T.E.; Nattel, S. G protein-coupled receptor signalling in the cardiac nuclear membrane: Evidence and possible roles in physiological and pathophysiological function. J. Physiol. 2012, 590, 1313–1330. [Google Scholar] [CrossRef] [PubMed]
  83. Cui, Z.J.; Matthews, E.K. Photodynamic modulation of cellular function. Acta Pharm. Sin. 1998, 19, 297–303. [Google Scholar]
  84. Bovis, M.J.; Woodhams, J.H.; Loizidou, M.; Scheglmann, D.; Bown, S.G.; MacRobert, A.J. Improved in vivo delivery of m-THPC via pegylated liposomes for use in photodynamic therapy. J. Control. Release 2012, 157, 196–205. [Google Scholar] [CrossRef]
  85. Kim, S.; Tachikawa, T.; Fujitsuka, M.; Majima, T. Far-red fluorescence probe for monitoring singlet oxygen during photodynamic therapy. J. Am. Chem. Soc. 2014, 136, 11707–11715. [Google Scholar] [CrossRef]
  86. Moan, J.; Berg, K. The photodegradation of porphyrins in cells can be used to estimate the lifetime of singlet oxygen. Photochem. Photobiol. 1991, 53, 549–553. [Google Scholar] [CrossRef]
  87. Dougherty, T.J.; Gomer, C.J.; Henderson, B.W.; Jori, G.; Kessel, D.; Korbelik, M.; Moan, J.; Peng, Q. Photodynamic therapy. J. Natl. Cancer Inst. 1998, 90, 889–905. [Google Scholar] [CrossRef] [Green Version]
  88. Nowis, D.; Makowski, M.; Stoklosa, T.; Legat, M.; Issat, T.; Golab, J. Direct tumor damage mechanisms of photodynamic therapy. Acta Biochim. Pol. 2005, 52, 339–352. [Google Scholar] [CrossRef] [Green Version]
  89. Re, M.; Pampillo, M.; Savard, M.; Dubuc, C.; McArdle, C.A.; Millar, R.P.; Conn, P.M.; Gobeil, F., Jr.; Bhattacharya, M.; Babwah, A.V. The human gonadotropin releasing hormone type I receptor is a functional intracellular GPCR expressed on the nuclear membrane. PLoS ONE 2002, 5, e11489. [Google Scholar] [CrossRef]
  90. Hebert-Chatelain, E.; Desprez, T.; Serrat, R.; Bellocchio, L.; Soria-Gomez, E.; Busquets-Garcia, A.; Pagano Zottola, A.C.; Delamarre, A.; Cannich, A.; Vincent, P.; et al. A cannabinoid link between mitochondria and memory. Nature 2016, 539, 555–559. [Google Scholar] [CrossRef]
  91. Djeungoue-Petga, M.-A.; Hebert-Chatelain, E. Linking mitochondria and synaptic transmission: The CB1 receptor. BioEssays 2017, 39, 1700126. [Google Scholar] [CrossRef] [PubMed]
  92. Young, A.; Powelson, E.B.; Whitney, I.E.; Raven, M.A.; Nusinowitz, S.; Jiang, M.; Birnbaumer, L.; Reese, B.E.; Farber, D.B. Involvement of OA1, an intracellular GPCR, and G alpha i3, its binding protein, in melanosomal biogenesis and optic pathway formation. Invest. Ophthalmol. Vis. Sci. 2008, 49, 3245–3252. [Google Scholar] [CrossRef] [PubMed]
  93. Irannejad, R.; von Zastrow, M. GPCR signaling along the endocytic pathway. Curr. Opin. Cell Biol. 2014, 27, 109–116. [Google Scholar] [CrossRef] [PubMed] [Green Version]
  94. Dores, M.R.; Trejo, J. Endo-lysosomal sorting of G-protein-coupled receptors by ubiquitin: Diverse pathways for G-protein-coupled receptor destruction and beyond. Traffic 2019, 20, 101–109. [Google Scholar] [CrossRef] [PubMed] [Green Version]
  95. Wright, C.D.; Wu, S.C.; Dahl, E.F.; Sazama, A.J.; O'Connell, T.D. Nuclear localization drives α1-adrenergic receptor oligomerization and signaling in cardiac myocytes. Cell Signal. 2012, 24, 794–802. [Google Scholar] [CrossRef] [Green Version]
  96. Vaniotis, G.; Allen, B.G.; Hébert, T.E. Nuclear GPCRs in cardiomyocytes: An insider's view of β-adrenergic receptor signaling. Am. J. Physiol. Heart Circ. Physiol. 2011, 301, H1754–H1764. [Google Scholar] [CrossRef] [Green Version]
  97. Gwathmey, T.M.; Alzayadneh, E.M.; Pendergrass, K.D.; Chappell, M.C. Novel roles of nuclear angiotensin receptors and signaling mechanisms. Am. J. Physiol. Regul. Integr. Comp. Physiol. 2012, 302, R518–R530. [Google Scholar] [CrossRef] [Green Version]
  98. Jiang, W.Y.; Li, Y.; Li, Z.Y.; Cui, Z.J. Permanent photodynamic cholecystokinin 1 receptor activation—Dimer-to-monomer conversion. Cell Mol. Neurobiol. 2018, 38, 1283–1292. [Google Scholar] [CrossRef]
Figure 1. Plasma membrane (PM) expression of genetically encoded protein photosensitizers KillerRed, miniSOG, miniSOG2, SOPP, Mr4511C71G, and DsFbFP. (af) AR4-2J cells were transfected with plasmids pKillerRedPM, pminiSOGPM, pminiSOG2PM, pSOPPPM, pMr4511C71GPM, and pDsFbFPPM, respectively; twenty-four hours later, KillerRed (a, λex 543 nm), miniSOG, miniSOG2, SOPP, Mr4511C71G, and DsFbFP (b–f, λex 488 nm) fluorescence was confocal imaged (fluorescence and bright field-merged images shown). Scale bars: 10 μm. (g) Reverse transcript (RT)-PCR: AR, parental AR4-2J cells; Ds-AR, DsFbFPPM-AR4-2J cells; and pDs, plasmid pDsFbFPPM as the positive control. GAPDH was used as the internal reference.
Biomolecules 10 01423 g001
Figure 2. Photodynamic CCK1R activation with genetically encoded protein photosensitizers KillerRed, miniSOG, miniSOG2, SOPP, Mr4511, and DsFbFP. Fura-2 AM-loaded AR4-2J (a), KillerRedPM-AR4-2J (b), miniSOGPM-AR4-2J (c), miniSOG2PM-AR4-2J (d), SOPPPM-AR4-2J (e), Mr4511C71GPM (f), and DsFbFP-AR4-2J cells (g) were perfused, and LED light (a, cg, 450 nm, 85 mW·cm−2, 1.5 min) or white light (b, 85.3 mW‧cm−2, 4 min) was applied, as indicated by the horizontal bars. LED light (450 nm, 85 mW·cm−2, 1.5 min) irradiation of AR4-2J cells (a, N = 4). White light irradiation (85.3 mW‧cm−2, 4 min) of KillerRedPM-AR4-2J cells (b, N = 4). LED light (450 nm, 85 mW·cm−2, 1.5 min) irradiation of miniSOGPM-AR4-2J (c, N = 3), miniSOG2PM-AR4-2J (d, N = 4), SOPPPM-AR4-2J (e, N = 3), Mr4511C71GPM-AR4-2J (f, N = 3), or DsFbFP-AR4-2J (g, N = 3) cells. The colored calcium tracings in (ag) were each from individual cells from one of N (as indicated) identical experiments, ordinate being the fluorescence ratios in F340/F380 and abscissa being time in min, as indicated. Integrated calcium peaks (per 10 min) in calcium tracings as represented in (ag) from N experiments were calculated and plotted as a bar graph (h). The thin, pink, dashed horizontal line in (h) indicates the level of miniSOG photodynamic effect. No statistical difference was found between miniSOG and KillerRed (KR) or miniSOG2, SOPP, Mr4511C71G, but the DsFbFP photodynamic effect was significantly less compared with miniSOG (p < 0.05), as indicated by an asterisk (*). CT: control—parental AR4-2J cells not transfected with any genetically encoded protein photosensitizer (GEPP).
Biomolecules 10 01423 g002
Figure 3. Targeted mitochondrial or lysosomal miniSOG photodynamic action induced persistent calcium oscillations in AR4-2J cells. (a) Plasmid pminiSOGMT or pminiSOGLS targeting mitochondria (MT) or lysosomes (LS). miniSOGMT (b) or miniSOGLS -AR4-2J cells (c) were confocal-imaged 24 h after transfection. miniSOG (λex 488 nm) colocalization with MitoTrackerTM Red (b, λex 543 nm) or LysoTracker Red (c, λex 543 nm) were verified, as seen in the merged images. MT Red: MitoTracker Red and LT Red: LysoTracker Red. Scale bars: 10 μm. Fura-2 AM-loaded AR4-2J (d), miniSOGMT-AR4-2J (e,f), or miniSOGLS-AR4-2J cells (g,h) were perfused; CCK 20 pM or LED illumination (450 nm, 85 mW·cm−2, 1.5 min) were applied, as indicated by the horizontal bars. The colored calcium tracings each were from individual cells measured simultaneously from one of N (as indicated) identical experiments, ordinate being fluorescence ratios in F340/F380 and abscissa being time in min, as indicated. LED light irradiation had no effect on baseline calcium in parental AR4-2J cells (d). Note that, in the absence of LED light, the baseline calcium concentration remained stable in (e,g), but LED light induced persistent calcium oscillations both in miniSOGMT-AR4-2J (f) and miniSOGLS-AR4-2J cells (h). (i) Integrated calcium peaks (per 10 min) in calcium tracings as represented in (dh) were calculated from N experiments. AR: AR4-2J cells as shown in (d). MT: miniSOGMT -AR4-2J cells without (e) or with (f) light. LS: miniSOGLS-AR4-2J cells without (g) or with (h) LED light irradiation.
Biomolecules 10 01423 g003
Figure 4. Calcium oscillations induced by miniSOG photodynamic action at the plasma membrane (PM), mitochondria (MT), or lysosomes (LS) in AR4-2J cells showed graded sensitivity to inhibition by the CCK1R antagonist devazepide at 2 nM: PM > MT > LS. Fura-2 AM-loaded miniSOGPM-AR4-2J (a), miniSOGMT-AR4-2J (b), or miniSOGLS-AR4-2J cells (c) were perfused; devazepide (2, 10 nM) and LED light (450 nm, 85 mW·cm−2, 1.5 min) were applied as indicated by the horizontal bars. The calcium tracings are each from individual cells measured simultaneously in one out of N (as indicated) identical experiments, the ordinate being fluorescence ratios in F340/F380 and the abscissa being time in min, as indicated. Integrated calcium peaks (per 10 min) from N experiments were plotted, and statistically significant differences between before (Bef.) and during (Dur.) or after (Aft.) devazepide application were indicated by an asterisk (*) at p < 0.05 (d), for the devazepide inhibition of miniSOG photodynamically induced calcium oscillations with miniSOGPM or miniSOGLS. Note the thin pink (PM), cyan (MT), and red (LS) dotted horizontal lines (3) at the level before the devazepide application in miniSOGPM-AR4-2J, miniSOGMT-AR4-2J, and miniSOGLS-AR4-2J cells, respectively (d). In miniSOGMT-AR4-2J cells before devazepide 2 nM, the calcium response was 100%, during devazepide 2 nM, 65%, during devazepide 10 nM, 29%, and after devazepide, 106%. For better consistence, for miniSOGMT-AR4-2J cells, the statistical data in (d) were from all individual cells in one out of three identical experiments shown in (b).
Biomolecules 10 01423 g004
Figure 5. Plasma membrane (PM), mitochondrial (MT), and lysosomal (LS) miniSOG photodynamic actions induced calcium oscillations in AR4-2J cells. Plasma membrane (PM)-, mitochondria (MT)-, or lysosome (LS)-localized miniSOG upon blue LED light (hν) irradiation generates 1O2, which then activates CCK1R to trigger cytosolic calcium oscillations. In PM, miniSOG-generated 1O2 directly oxidizes CCK1R. In MT, miniSOG-generated 1O2 may diffuse to the PM via MT-PM contact sites, leading to the oxidative activation of PM CCK1R. In LS, miniSOG-generated 1O2 may oxidize CCK1R trafficked to LS via the endocytosis pathway, but a partial degradation of CCK1R by LS proteases might hinder the antagonist effect. GEPP: genetically-encoded protein photosensitizers; CCK1R: cholecystokinin 1 receptors; PLC: phospholipase C; IP3: inositol-1,4,5-trisphosphate; IP3R: inositol-1,4,5-trisphosphate receptors; PM: plasma membrane; MT: mitochondria; and LS: lysosomes.
Biomolecules 10 01423 g005

