Recognition of Potential COVID-19 Drug Treatments through the Study of Existing Protein–Drug and Protein–Protein Structures: An Analysis of Kinetically Active Residues

Abstract
:1. Introduction
2. Methods and Materials
- Step 1:
- Calculate the number of fast modes that correspond to the top 10% of the eigenvalues range.
- Step 2:
- Calculate the weighted sum (Equation (1)) and spread the influence of hot residues to sequential and spatial neighbors.
- Step 3a:
- If the overall percent of predictions is larger than a previously set value (for example, if the percent of predictions is larger than 30% of the total number of residues), the SAGNM procedure reduces the number of fast modes by one and goes to Step 2.
- Step 3b:
- If the percent of predictions is too small (e.g., less than 15% of all residues), the SAGNM procedure increases the number of fast modes by one and goes to Step 2.
3. Results
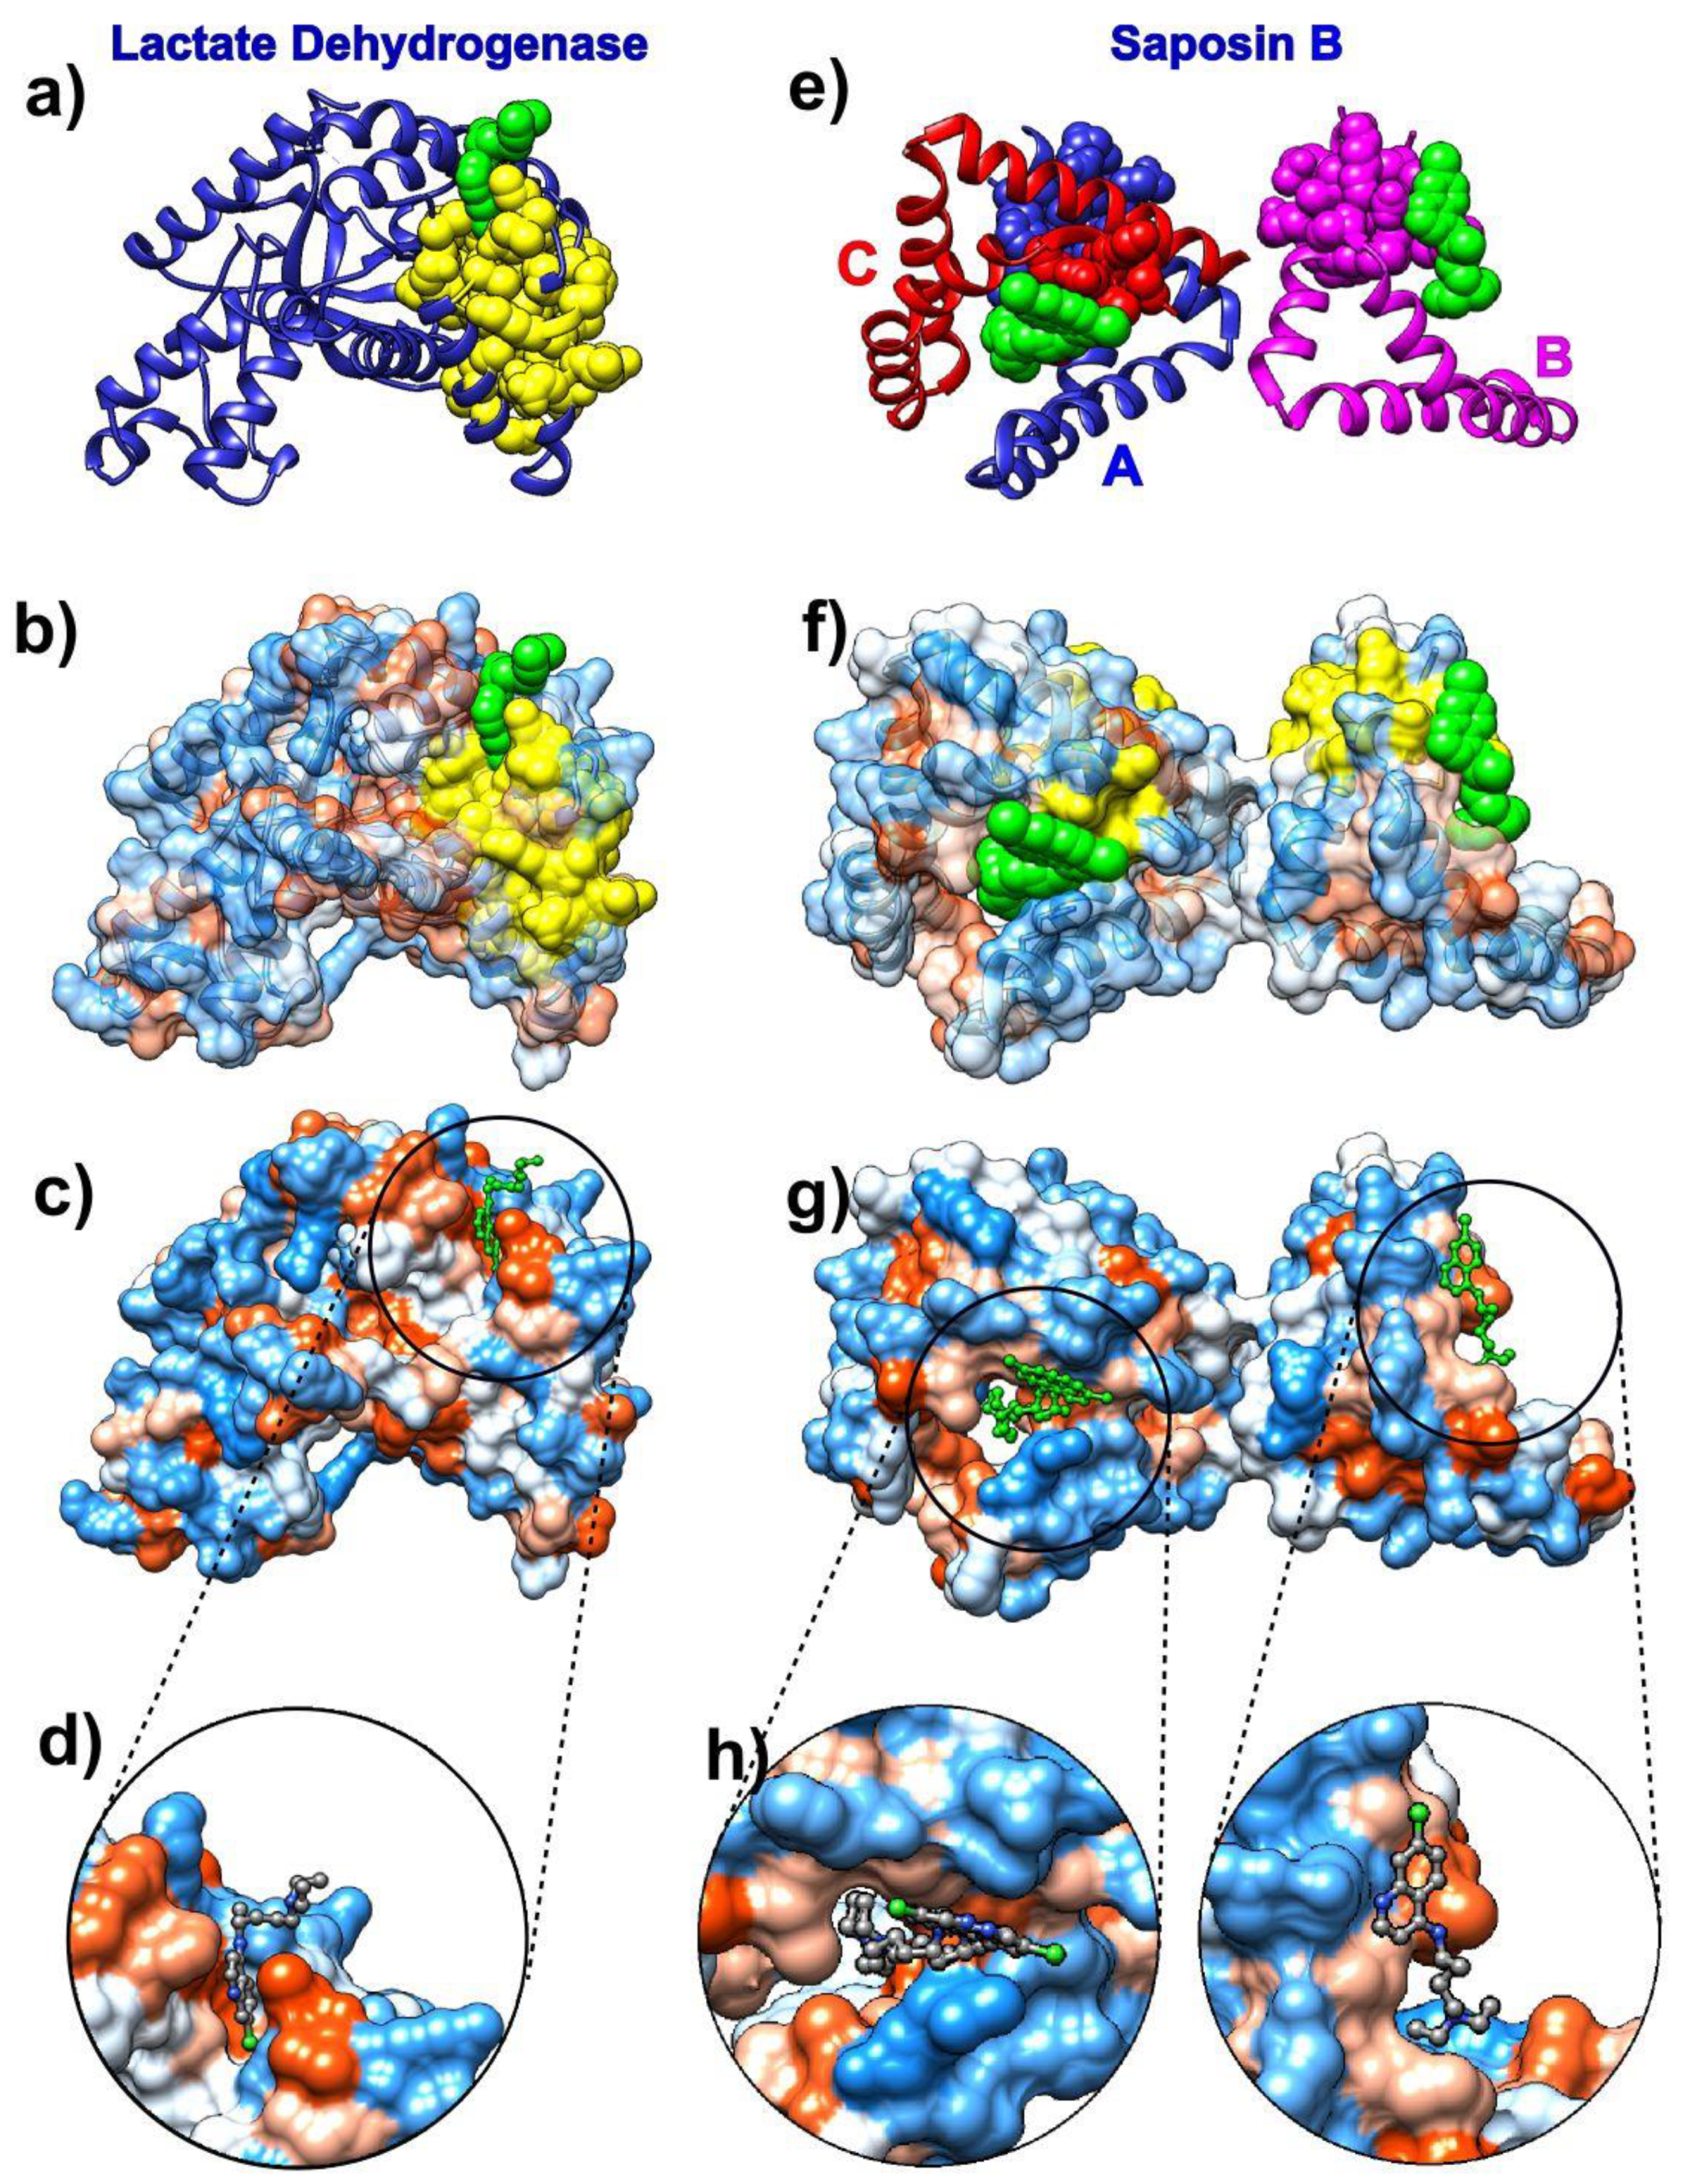
3.1. Chloroquine
3.2. Ivermectin
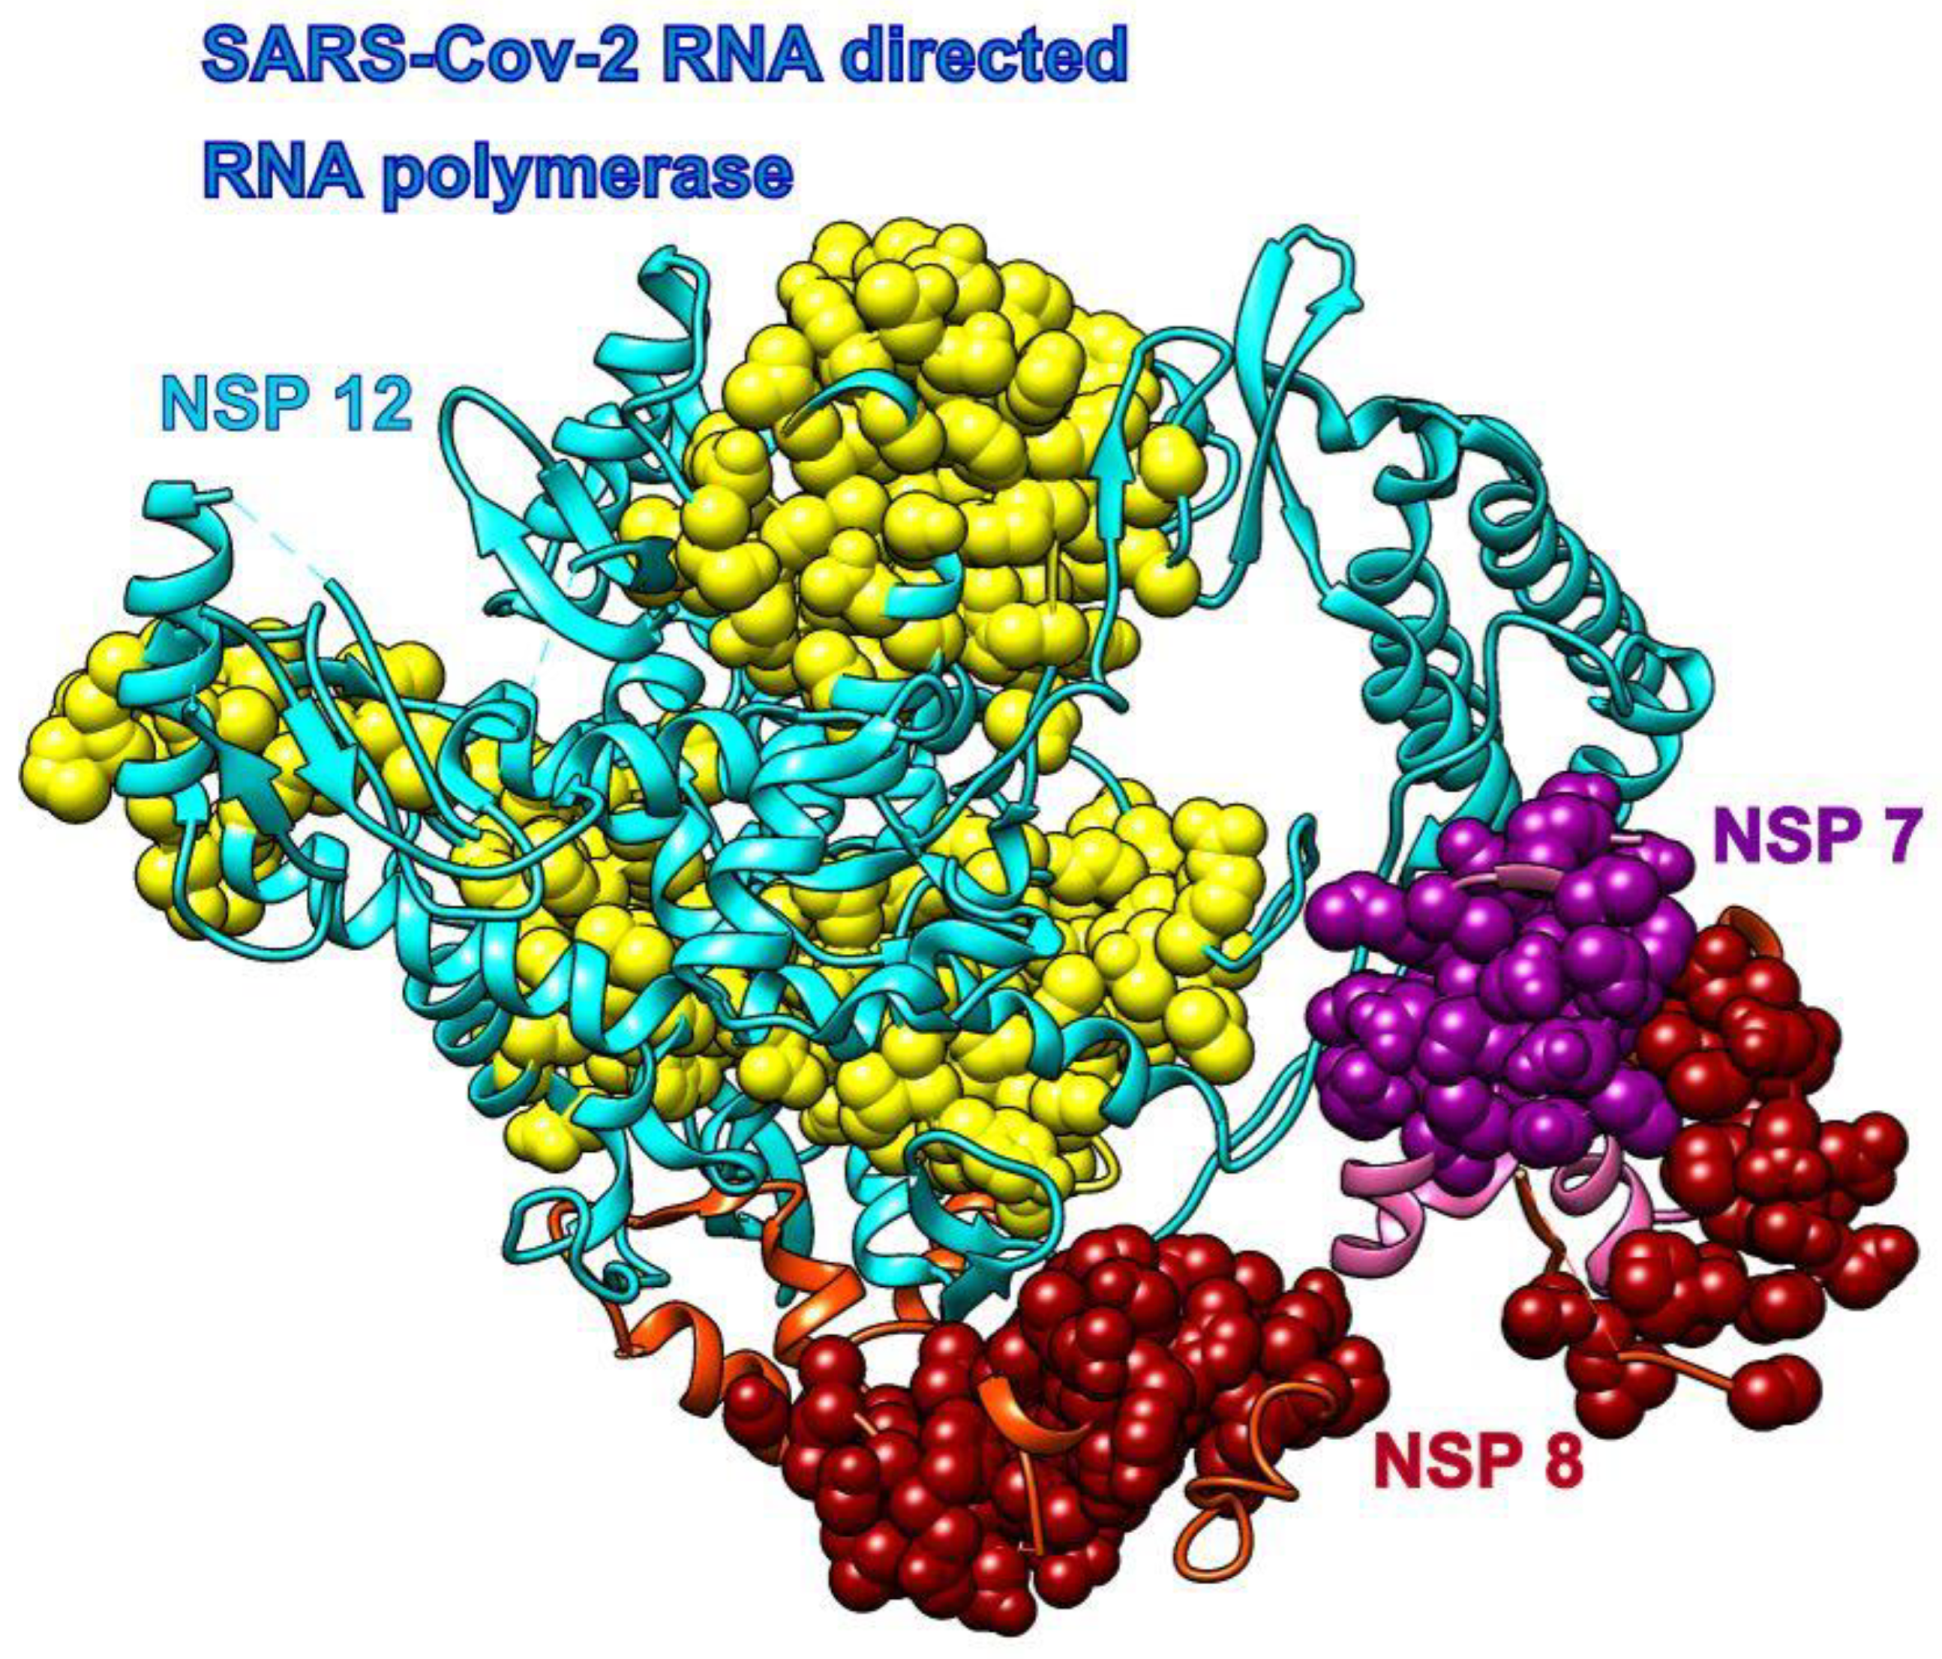
3.3. Remdesivir
3.4. Sofosbuvir
3.5. Boceprevir
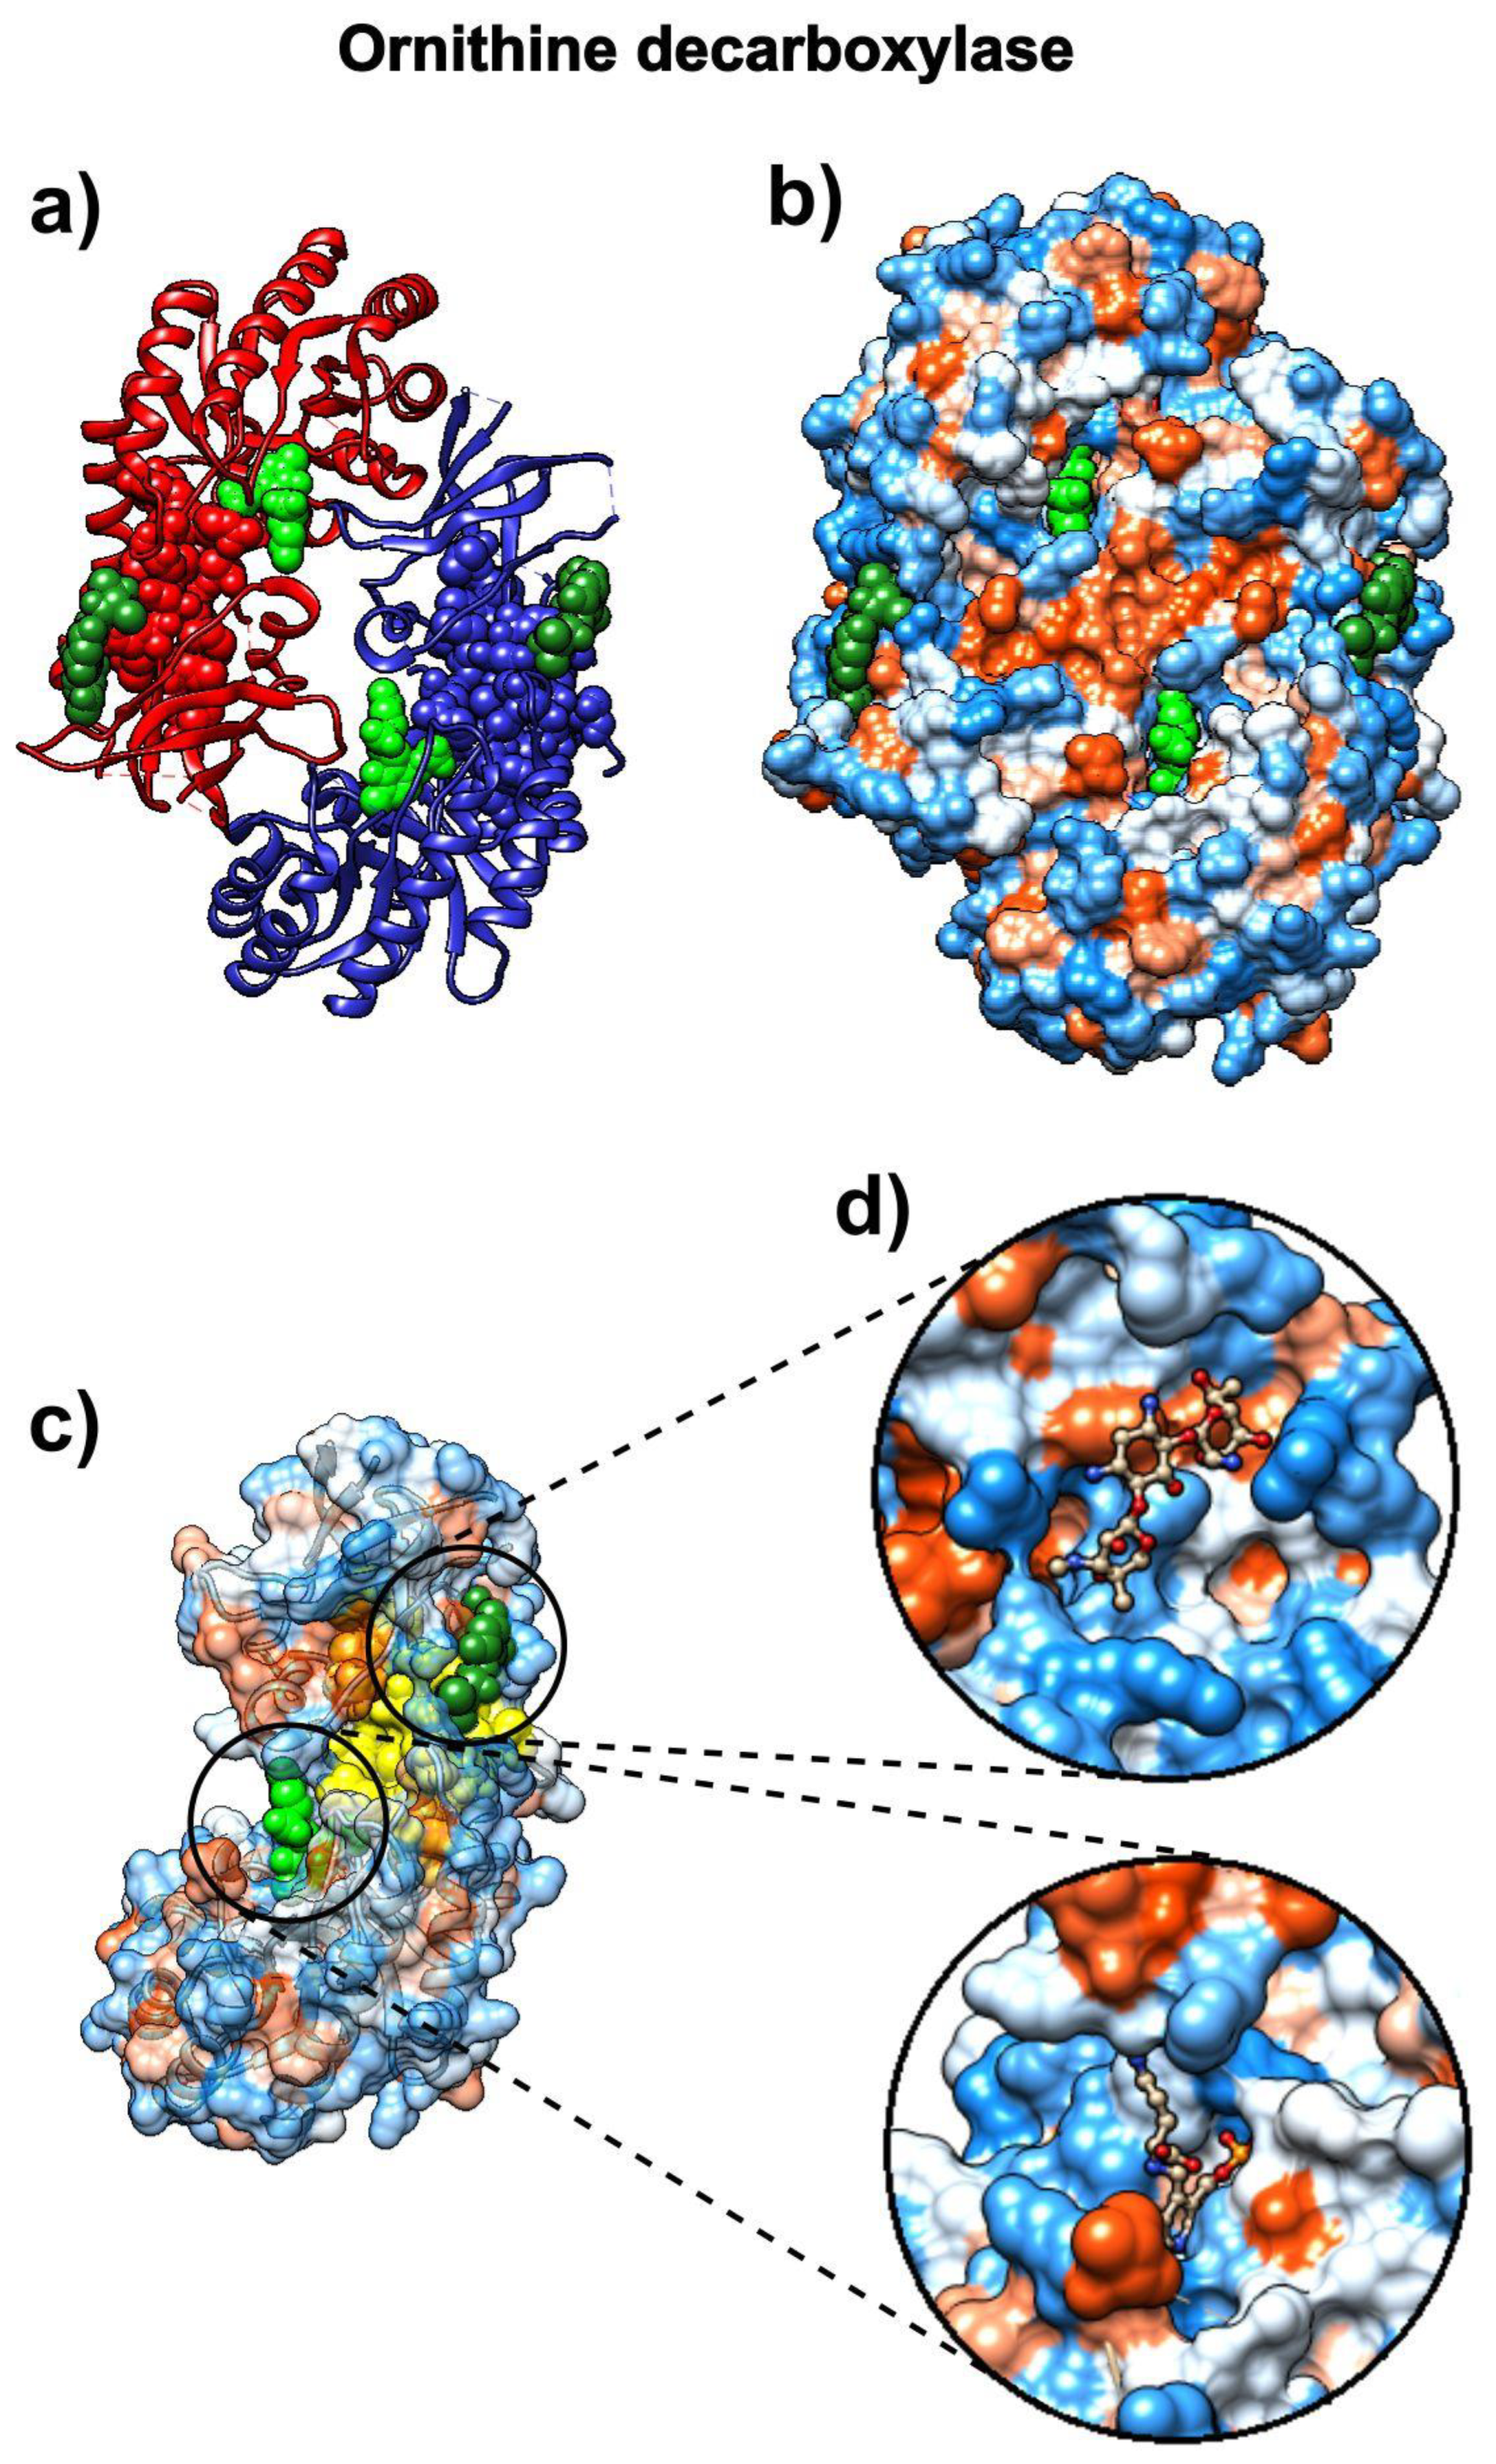
3.6. Eflornithine
3.7. Spike Glycoproteins and Their Interactions
3.7.1. ACE2 Binding Patterns to SARS and COVID-19 Spike Glycoproteins
3.7.2. SARS-CoV Spike Glycoprotein and Glycans
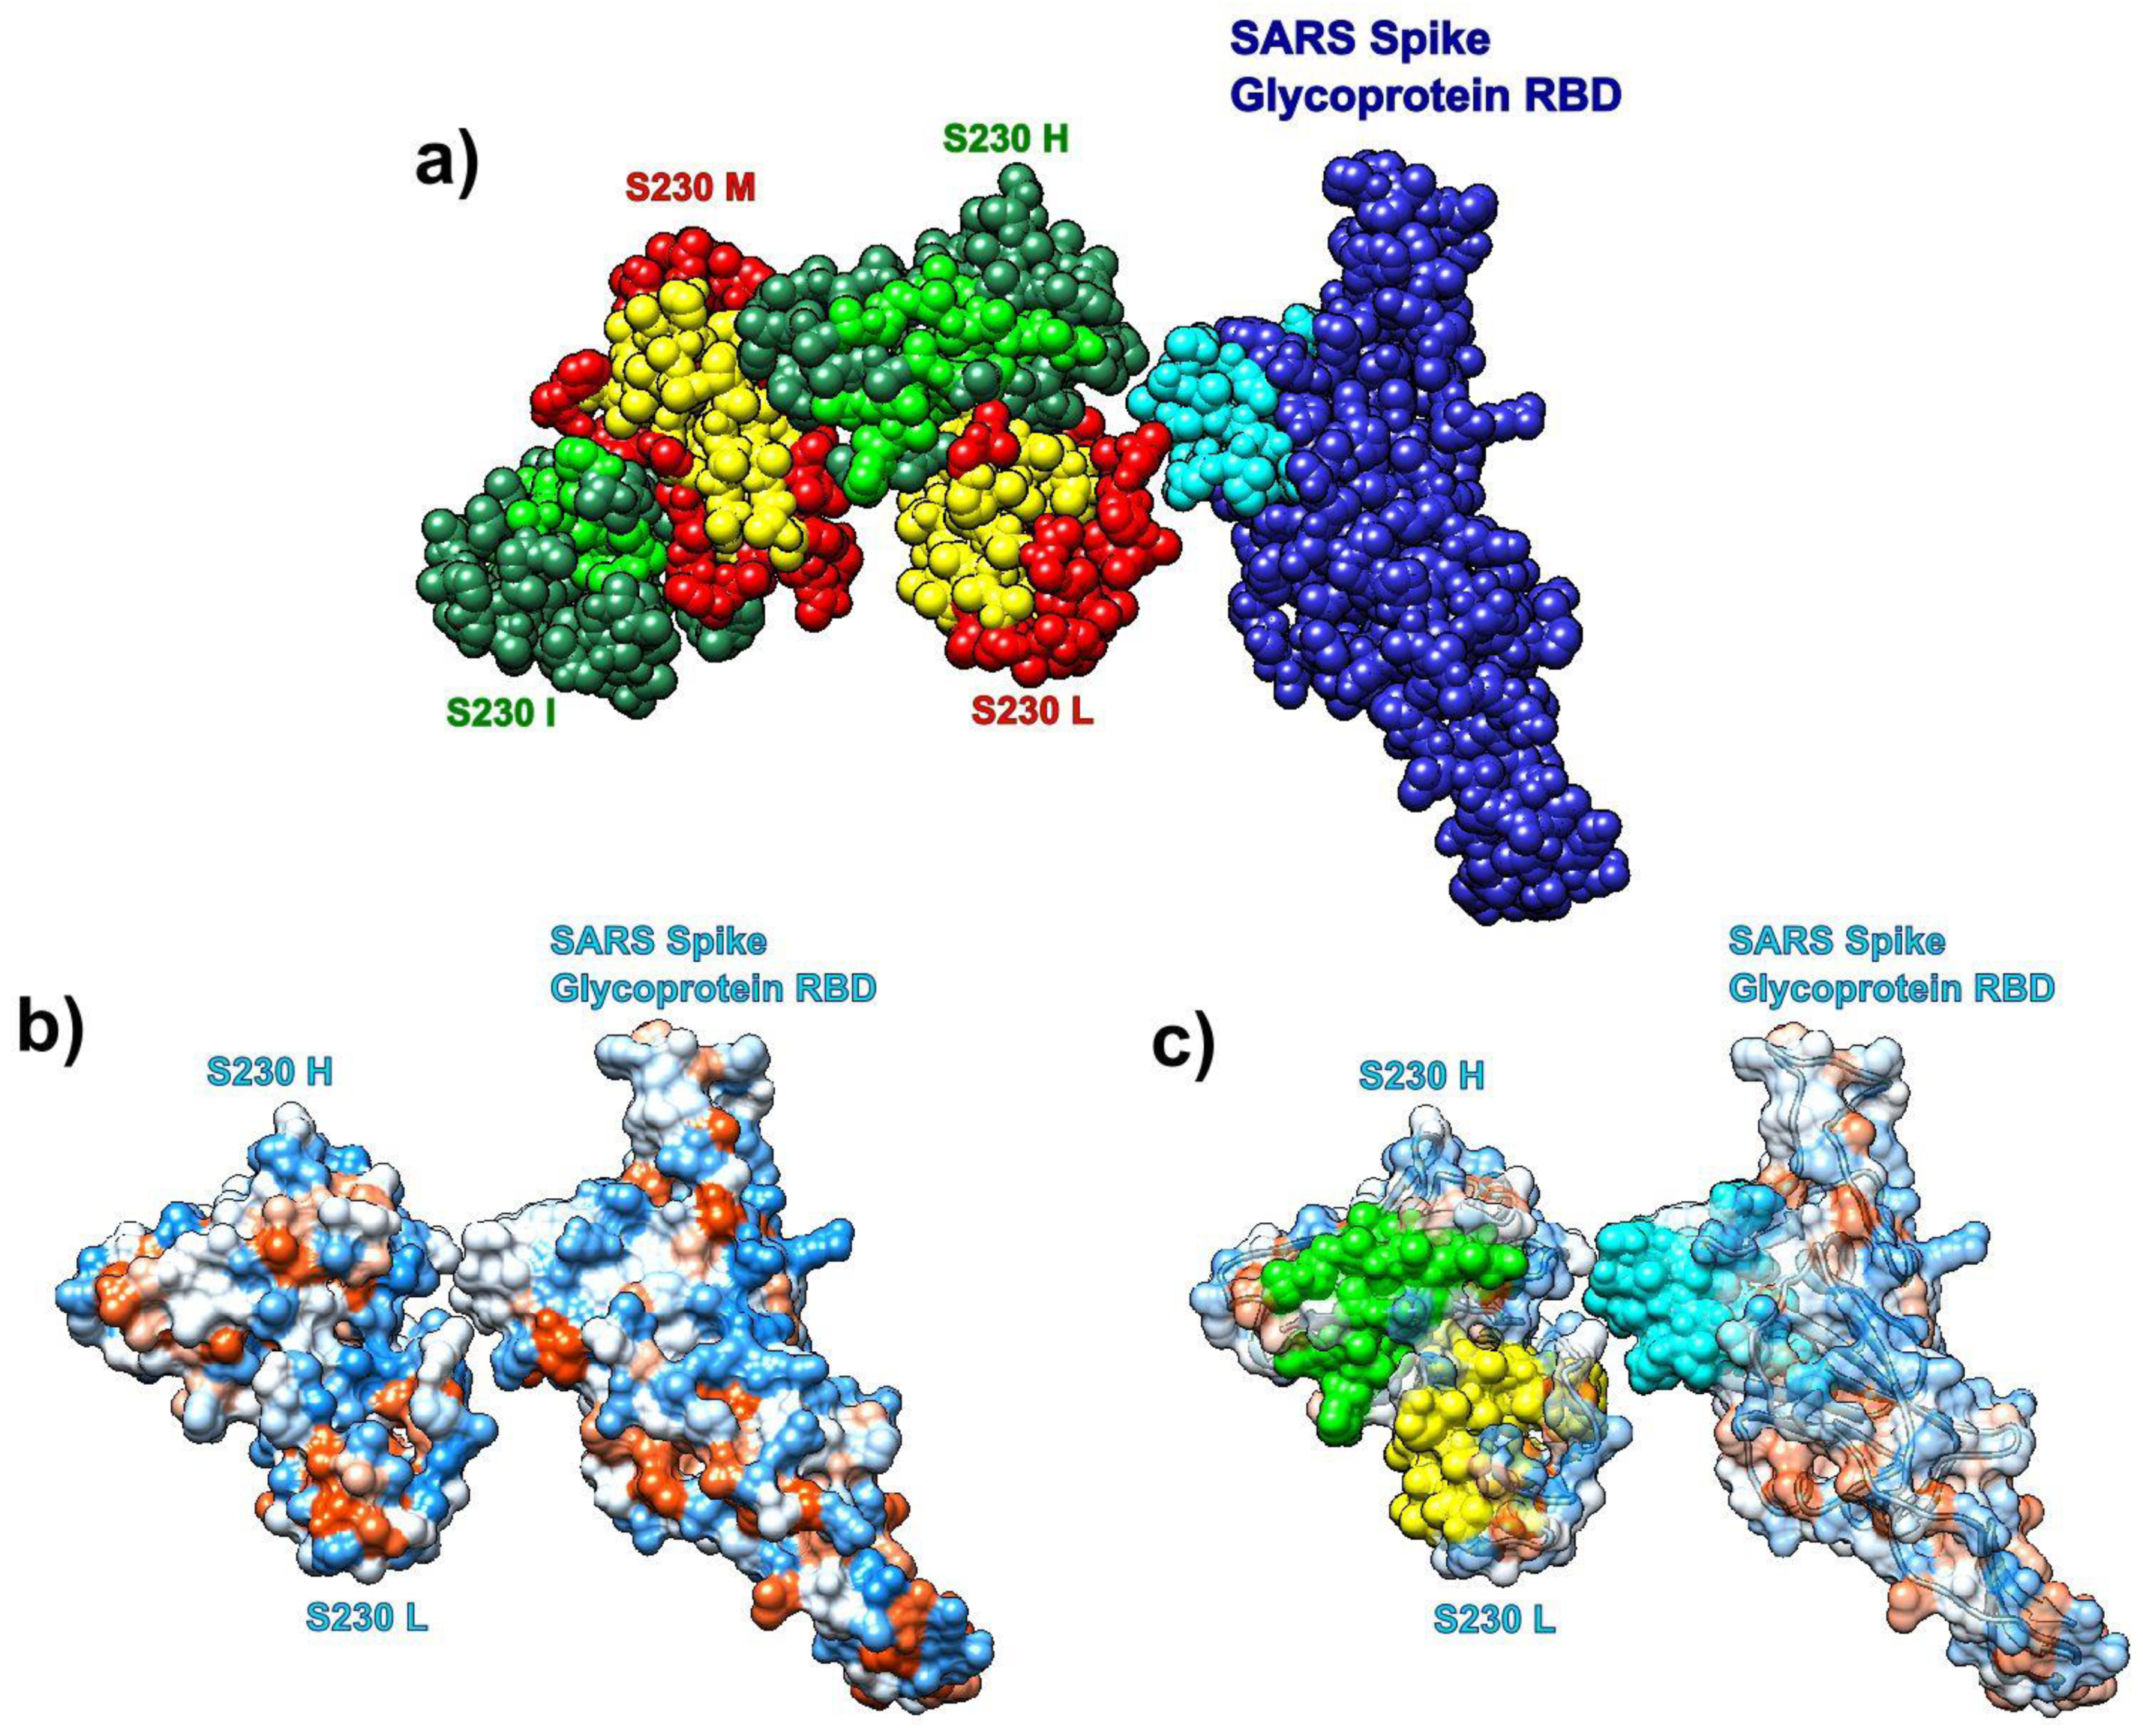
3.7.3. SARS Spike Glycoprotein RBD and Human Antibody Fragment
4. Discussion and Conclusions
Supplementary Materials
Funding
Acknowledgments
Conflicts of Interest
References
- Guan, W.-J.; Ni, Z.-Y.; Hu, Y.; Liang, W.-H.; Ou, C.-Q.; He, J.-X.; Liu, L.; Shan, H.; Lei, C.-L.; Hui, D.S.C.; et al. Clinical Characteristics of Coronavirus Disease 2019 in China. N. Engl. J. Med. 2020, 382, 1708–1720. [Google Scholar] [CrossRef] [PubMed]
- Liu, C.; Zhou, Q.; Li, Y.; Garner, L.V.; Watkins, S.P.; Carter, L.J.; Smoot, J.; Gregg, A.C.; Daniels, A.D.; Jervey, S.; et al. Research and development on therapeutic agents and vaccines for covid-19 and related human coronavirus diseases. ACS Cent. Sci. 2020, 6, 315–331. [Google Scholar] [CrossRef] [PubMed]
- Palmieri, L.; Andrianou, X.; Barbariol, P.; Bella, A.; Bellino, S.; Benelli, E.; Bertinato, L.; Boros, S.; Brambilla, G.; Calcagnini, G. Characteristics of COVID-19 Patients Dying in Italy Report Based on Available Data on September 7th, 2020. (Report); Istituto Superiore di Sanità: Roma, Italy, 2020. [Google Scholar]
- Yan, C.H.; Faraji, F.; Prajapati, D.P.; Boone, C.E.; DeConde, A.S. Association of chemosensory dysfunction and covid-19 in patients presenting with influenza-like symptoms. Int. Forum Allergy Rhinol. 2020, 10, 806–813. [Google Scholar] [CrossRef] [Green Version]
- Yan, R.; Zhang, Y.; Li, Y.; Xia, L.; Guo, Y.; Zhou, Q. Structural basis for the recognition of SARS-CoV-2 by full-length human ACE2. Science 2020, 367, 1444–1448. [Google Scholar] [CrossRef] [PubMed] [Green Version]
- Wrapp, D.; Wang, N.; Corbett, K.S.; Goldsmith, J.A.; Hsieh, C.-L.; Abiona, O.; Graham, B.S.; McLellan, J.S. Cryo-EM structure of the 2019-nCoV spike in the prefusion conformation. Science 2020, 367, 1260–1263. [Google Scholar] [CrossRef] [Green Version]
- Lan, J.; Ge, J.; Yu, J.; Shan, S.; Zhou, H.; Fan, S.; Zhang, Q.; Shi, X.; Wang, Q.; Zhang, L.; et al. Structure of the SARS-CoV-2 spike receptor-binding domain bound to the ACE2 receptor. Nature 2020, 581, 215–220. [Google Scholar] [CrossRef] [Green Version]
- Shang, J.; Ye, G.; Shi, K.; Wan, Y.; Luo, C.; Aihara, H.; Geng, Q.; Auerbach, A.; Li, F. Structural basis of receptor recognition by SARS-CoV-2. Nature 2020, 581, 221–224. [Google Scholar] [CrossRef] [Green Version]
- Sheahan, T.P.; Sims, A.C.; Leist, S.R.; Schäfer, A.; Won, J.; Brown, A.J.; Montgomery, S.A.; Hogg, A.; Babusis, D.; Clarke, M.O.; et al. Comparative therapeutic efficacy of Remdesivir and combination Lopinavir, Ritonavir, and Interferon beta against MERS-CoV. Nat. Commun. 2020, 11, 1–14. [Google Scholar] [CrossRef] [Green Version]
- Prussia, A.; Thepchatri, P.; Snyder, J.P.; Plemper, R.K. Systematic Approaches towards the Development of Host-Directed Antiviral Therapeutics. Int. J. Mol. Sci. 2011, 12, 4027–4052. [Google Scholar] [CrossRef] [Green Version]
- Gordon, D.E.; Jang, G.M.; Bouhaddou, M.; Xu, J.; Obernier, K.; White, K.M.; O’Meara, M.J.; Rezelj, V.V.; Guo, J.Z.; Swaney, D.L.; et al. A SARS-CoV-2 protein interaction map reveals targets for drug repurposing. Nature 2020, 583, 459–468. [Google Scholar] [CrossRef]
- Wanchao, W.; Mao, C.; Luan, X.; Shen, D.-D.; Shen, Q.; Su, H.; Wang, X.; Zhou, F.; Zhao, W.; Gao, M.; et al. Structural basis for inhibition of the RNA-dependent RNA polymerase from SARS-CoV-2 by Remdesivir. Science 2020, 368, 1499–1504. [Google Scholar]
- Calligari, P.; Bobone, S.; Ricci, G.; Bocedi, A. Molecular Investigation of SARS-CoV-2 Proteins and Their Interactions with Antiviral Drugs. Viruses 2020, 12, 445. [Google Scholar] [CrossRef] [PubMed] [Green Version]
- Elfiky, A.A. SARS-CoV-2 RNA dependent RNA polymerase (RdRp) targeting: An in silico perspective. J. Biomol. Struct. Dyn. 2020. [Google Scholar] [CrossRef] [PubMed]
- Yu, R.; Chen, L.; Lan, R.; Shen, R.; Li, P. Computational screening of antagonists against the SARS-CoV-2 (COVID-19) coronavirus by molecular docking. Int. J. Antimicrob. Agents 2020, 56, 106012. [Google Scholar] [CrossRef]
- De Oliveira, O.V.; Rocha, G.B.; Paluch, A.S.; Costa, L.T. Repurposing approved drugs as inhibitors of SARS-CoV-2 S-protein from molecular modeling and virtual screening. J. Biomol. Struct. Dyn. 2020. [Google Scholar] [CrossRef]
- Santos-Filho, O.A. Identification of Potential Inhibitors of Severe Acute Respiratory Syndrome-Related Coronavirus 2 (SARS-CoV-2) Main Protease from Non-Natural and Natural Sources: A Molecular Docking Study. J. Braz. Chem. Soc. 2020, 1–6. [Google Scholar] [CrossRef]
- Pachetti, M.; Marini, B.; Benedetti, F.; Giudici, F.; Mauro, E.; Storici, P.; Masciovecchio, C.; Angeletti, S.; Ciccozzi, M.; Gallo, R.C.; et al. Emerging SARS-CoV-2 mutation hot spots include a novel RNA-dependent-RNA polymerase variant. J. Transl. Med. 2020, 18, 179. [Google Scholar] [CrossRef] [Green Version]
- Beck, B.R.; Shin, B.; Choi, Y.; Park, S.; Kang, K. Predicting commercially available antiviral drugs that may act on the novel coronavirus (SARS-CoV-2) through a drug-target interaction deep learning model. Comput. Struct. Biotechnol. J. 2020, 18, 784–790. [Google Scholar] [CrossRef]
- U.S. National Library of Medicine. Chloroquine. Available online: https://druginfo.nlm.nih.gov/drugportal/name/chloroquine (accessed on 9 September 2020).
- U.S. National Library of Medicine. Hydroxychloroquine. Available online: https://druginfo.nlm.nih.gov/drugportal/name/hydroxychloroquine (accessed on 9 September 2020).
- U.S. National Library of Medicine. Chloroquine Trials. Available online: https://clinicaltrials.gov/search/intervention=CHLOROQUINE+ (accessed on 9 September 2020).
- U.S. National Library of Medicine. Hydroxychloroquine Trials. Available online: https://clinicaltrials.gov/search/intervention=hydroxychloroquine (accessed on 9 September 2020).
- Wang, M.; Cao, R.; Zhang, L.; Yang, X.; Liu, J.; Xu, M.; Shi, Z.; Hu, Z.; Zhong, W.; Xiao, G. Remdesivir and chloroquine effectively inhibit the recently emerged novel coronavirus (2019-nCoV) in vitro. Cell Res. 2020, 30, 269–271. [Google Scholar] [CrossRef]
- National Center for Biotechnology Information (NCBI). ACE2 Angiotensin I Converting Enzyme 2 [Homo Sapiens (Human)]. Available online: https://0-www-ncbi-nlm-nih-gov.brum.beds.ac.uk/gene/59272 (accessed on 9 September 2020).
- Vincent, M.J.; Bergeron, E.; Benjannet, S.; Erickson, B.R.; Rollin, P.E.; Ksiazek, T.G.; Seidah, N.G.; Nichol, S.T. Chloroquine is a potent inhibitor of SARS coronavirus infection and spread. Virol. J. 2005, 2, 69. [Google Scholar] [CrossRef] [Green Version]
- Devaux, C.A.; Rolain, J.-M.; Colson, P.; Raoult, D. New insights on the antiviral effects of chloroquine against coronavirus: What to expect for COVID-19? Int. J. Antim. Agents 2020, 55, 105938. [Google Scholar] [CrossRef] [PubMed]
- Ducharme, J.; Farinotti, R. Clinical Pharmacokinetics and Metabolism of Chloroquine. Clin. Pharmacokinet. 1996, 31, 257–274. [Google Scholar] [CrossRef] [PubMed]
- U.S. National Library of Medicine. Ivermectin. Available online: https://druginfo.nlm.nih.gov/drugportal/name/ivermectin (accessed on 9 September 2020).
- Hibbs, R.E.; Gouaux, E. Principles of activation and permeation in an anion-selective Cys-loop receptor. Nature 2011, 474, 54. [Google Scholar] [CrossRef] [Green Version]
- Wang, K.; Xie, S.; Sun, B. Viral proteins function as ion channels. Biochim. Biophys. Acta (BBA) Biomembr. 2011, 1808, 510–515. [Google Scholar] [CrossRef]
- Igloi, Z.; Mohl, B.-P.; Lippiat, J.D.; Harris, M.; Mankouri, J. Requirement for chloride channel function during the hepatitis c virus life cycle. J. Virol. 2015, 89, 4023–4029. [Google Scholar] [CrossRef] [Green Version]
- Caly, L.; Druce, J.D.; Catton, M.G.; Jans, D.A.; Wagstaff, K.M. The FDA-approved Drug Ivermectin inhibits the replication of SARS-CoV-2 in vitro. Antivir. Res. 2020, 178, 104787. [Google Scholar] [CrossRef] [PubMed]
- MedinCell has Launched a COVID-19 Research Initiative Based on its Experience to Formulate Long-Acting Injectable Ivermectin. 2020. Available online: https://www.medincell.com/wp-content/uploads/2020/04/PR_MedinCell-Covid19-EN.pdf (accessed on 9 September 2020).
- U.S. National Library of Medicine. Remdesivir. Available online: https://druginfo.nlm.nih.gov/drugportal/name/remdesivir (accessed on 9 September 2020).
- U.S. National Library of Medicine. Remdesivir Trials. Available online: https://clinicaltrials.gov/search/intervention=GS-5734 (accessed on 9 September 2020).
- Medscape. Sofosbuvir. Available online: https://reference.medscape.com/drug/sovaldi-sofosbuvir-999890 (accessed on 9 September 2020).
- Sadeghi, A. SOFOSBUVIR and Daclatasvir as a Potential Candidate for Moderate or Severe COVID-19 Treatment, Results from a Randomised Controlled Trial. Available online: https://cattendee.abstractsonline.com/meeting/9307/presentation/3933 (accessed on 9 September 2020).
- U.S. National Library of Medicine. Boceprevir. Available online: https://druginfo.nlm.nih.gov/drugportal/name/Boceprevir (accessed on 9 September 2020).
- Ma, C.; Sacco, M.D.; Hurst, B.; Townsend, J.A.; Hu, Y.; Szeto, T.; Zhang, X.; Tarbet, B.; Marty, M.T.; Chen, Y.; et al. Boceprevir, GC-376, and calpain inhibitors II, XII inhibit SARS-CoV-2 viral replication by targeting the viral main protease. Cell Res. 2020, 30, 678–692. [Google Scholar] [CrossRef] [PubMed]
- U.S. National Library of Medicine. Eflornithine. Available online: https://druginfo.nlm.nih.gov/drugportal/rn/70052-12-9 (accessed on 9 September 2020).
- U.S. National Library of Medicine. Nifurtimox. Available online: https://druginfo.nlm.nih.gov/drugportal/name/nifurtimox (accessed on 9 September 2020).
- Perišić, O. Heterodimer binding scaffolds recognition via the analysis of kinetically hot residues. Pharmaceuticals 2018, 11, 29. [Google Scholar] [CrossRef] [Green Version]
- Haliloglu, T.; Bahar, I.; Erman, B. Gaussian Dynamics of Folded Proteins. PRL 1997, 79, 3090–3093. [Google Scholar] [CrossRef]
- Bahar, I.; Atilgan, A.R.; Erman, B. Direct evaluation of thermal fluctuations in proteins using a single-parameter harmonic potential. Fold. Des. 1997, 2, 173–181. [Google Scholar] [CrossRef] [Green Version]
- Bahar, I.; Atilgan, A.R.; Demirel, M.C.; Erman, B. Vibrational Dynamics of Folded Proteins. PRL 1998, 80, 2733–2736. [Google Scholar] [CrossRef] [Green Version]
- Demirel, M.C.; Atiligan, A.R.; Jernigan, R.L.; Erman, B.; Bahar, I. Identification of kinetically hot residues in proteins. Protein Sci. 1998, 7, 2522–2532. [Google Scholar] [CrossRef] [Green Version]
- Bahar, I.; Erman, B.; Jernigan, R.L.; Atilgan, A.R.; Covell, D.G. Collective motions in HIV-1 reverse transcriptase: Examination of flexibility and enzyme function. J. Mol. Biol. 1999, 285, 1023–1037. [Google Scholar] [CrossRef] [Green Version]
- Yang, L.; Eyal, E.; Chennubhotla, C.; Jee, J.; Gronenborn, A.M.; Bahar, I. Insights into Equilibrium Dynamics of Proteins from Comparison of NMR and X-Ray Data with Computational Predictions. Structure 2007, 15, 741–749. [Google Scholar] [CrossRef] [PubMed] [Green Version]
- Haliloglu, T.; Keskin, O.; Ma, B.; Nussinov, R. How Similar Are Protein Folding and Protein Binding Nuclei? Examination of Vibrational Motions of Energy Hot Spots and Conserved Residues. Biophys. J. 2005, 88, 1552–1559. [Google Scholar] [CrossRef] [PubMed] [Green Version]
- Bogan, A.A.; Thorn, K.S. Anatomy of hot spots in protein interfaces. J. Mol. Biol. 1998, 280, 1–9. [Google Scholar] [CrossRef] [Green Version]
- Moreira, I.S.; Fernandes, P.A.; Ramos, M.J. Hot spots-A review of the protein-protein interface determinant amino-acid residues. Proteins Struct. Funct. Bioinform. 2007, 68, 803–812. [Google Scholar] [CrossRef]
- Tuncbag, N.; Gursoy, A.; Keskin, O. Identification of computational hot spots in protein interfaces: Combining solvent accessibility and inter-residue potentials improves the accuracy. Bioinformatics 2009, 25, 1513–1520. [Google Scholar] [CrossRef] [Green Version]
- Lise, S.; Archambeau, C.; Pontil, M.; Jones, D.T. Prediction of hot spot residues at protein-protein interfaces by combining machine learning and energy-based methods. BMC Bioinform. 2009, 10, 365. [Google Scholar] [CrossRef] [PubMed] [Green Version]
- Lise, S.; Buchan, D.; Pontil, M.; Jones, D.T. Predictions of Hot Spot Residues at Protein-Protein Interfaces Using Support Vector Machines. PLoS ONE 2011, 6, e16774. [Google Scholar] [CrossRef] [PubMed]
- Kozakov, D.; Hall, D.R.; Chuang, G.; Cencic, R.; Brenke, R.; Grove, L.E.; Beglov, D.; Pelletier, J.; Whitty, A.; Vajda, S. Structural conservation of druggable hot spots in protein-protein interfaces. Proc. Natl. Acad. Sci. USA 2011, 108, 13528–13533. [Google Scholar] [CrossRef] [PubMed] [Green Version]
- Tuncbag, N.; Gursoy, A.; Nussinov, R.; Keskin, O. Predicting protein-protein interactions on a proteome scale by matching evolutionary and structural similarities at interfaces using PRISM. Nat. Protoc. 2011, 6, 1341–1354. [Google Scholar] [CrossRef]
- Pettersen, E.F.; Goddard, T.D.; Huang, C.C.; Couch, G.S.; Greenblatt, D.M.; Meng, E.C.; Ferrin, T.E. UCSF Chimera—A visualization system for exploratory research and analysis. J. Comput. Chem. 2004, 25, 1605–1612. [Google Scholar] [CrossRef] [Green Version]
- Humphrey, W.; Dalke, A.A.; Schulten, K. VMD: Visual molecular dynamics. J. Mol. Graph. 1996, 14, 33–38. [Google Scholar] [CrossRef]
- Press, W.H.; Teukolsky, S.A.; Vetterling, W.T.; Flannery, B.P. Numerical Recipes in C++; Cambridge University Press: Cambridge, UK, 2002. [Google Scholar]
- Gunasekaran, K.; Nussinov, R. How different are structurally flexible and rigid binding sites? Sequence and structural features discriminating proteins that do and do not undergo conformational change upon ligand binding. J. Mol. Biol. 2007, 365, 257–273. [Google Scholar] [CrossRef] [PubMed]
- Weisstein, E.W. Singular Value Decomposition. Available online: http://mathworld.wolfram.com/SingularValueDecomposition.html (accessed on 9 September 2020).
- Read, J.A.; Wilkinson, K.W.; Tranter, R.; Sessions, R.B.; Brady, R.L. Chloroquine Binds in the Cofactor Binding Site of Plasmodium falciparum Lactate Dehydrogenase. J. Biol. Chem. 1999, 274, 10213–10218. [Google Scholar] [CrossRef] [Green Version]
- Huta, B.P.; Mehlenbacher, M.R.; Nie, Y.; Lai, X.; Zubieta, C.; Bou-Abdallah, F.; Doyle, R.P. The Lysosomal Protein Saposin-B Binds Chloroquine. ChemMedChem 2016, 11, 277–282. [Google Scholar] [CrossRef] [Green Version]
- Henry, B.M.; Aggarwal, G.; Wong, J.; Benoit, S.; Vikse, J.; Plebani, M.; Lippi, G. Lactate dehydrogenase levels predict coronavirus disease 2019 (COVID-19) severity and mortality: A pooled analysis. Am. J. Emerg. Med. 2020, 38, 1722–1726. [Google Scholar] [CrossRef]
- Huang, X.; Chen, H.; Shaffer, P.L. Crystal Structures of Human GlyR_alpha3 Bound to Ivermectin. Structure 2017, 25, 945–950.e2. [Google Scholar] [CrossRef] [Green Version]
- Appleby, T.C.; Perry, J.K.; Murakami, E.; Barauskas, O.; Feng, J.; Cho, A.; Fox, D.; Wetmore, D.R.; McGrath, M.E.; Ray, A.S.; et al. Structural basis for RNA replication by the hepatitis C virus polymerase. Science 2015, 347, 771–775. [Google Scholar] [CrossRef]
- Gao, Y.; Yan, L.; Huang, Y.; Liu, F.; Zhao, Y.; Cao, L.; Wang, T.; Sun, Q.; Ming, Z.; Zhang, L.; et al. Structure of the RNA-dependent RNA polymerase from COVID-19 virus. Science 2020, 368, 779–782. [Google Scholar] [CrossRef] [PubMed] [Green Version]
- Jackson, L.K.; Goldsmith, E.J.; Phillips, M.A. X-ray Structure Determination of Trypanosoma brucei Ornithine Decarboxylase Bound to d-Ornithine and to G418. J. Biol. Chem. 2003, 278, 22037–22043. [Google Scholar] [CrossRef] [PubMed] [Green Version]
- Kirchdoerfer, R.N.; Wang, N.; Pallesen, J.; Wrapp, D.; Turner, H.L.; Cottrell, C.A.; Corbett, K.S.; Graham, B.S.; McLellan, J.S.; Ward, A.B. Stabilized coronavirus spikes are resistant to conformational changes induced by receptor recognition or proteolysis. Sci. Rep. 2018, 8, 15701. [Google Scholar] [CrossRef] [Green Version]
- Walls, A.C.; Xiong, X.; Park, Y.-J.; Tortorici, M.A.; Snijder, J.; Quispe, J.; Cameroni, E.; Gopal, R.; Dai, M.; Lanzavecchia, A.; et al. Unexpected Receptor Functional Mimicry Elucidates Activation of Coronavirus Fusion. Cell 2019, 176, 1026–1039.e15. [Google Scholar] [CrossRef] [Green Version]
- Xiong, X.; Tortorici, M.A.; Snijder, J.; Yoshioka, C.; Walls, A.C.; Li, W.; McGuire, A.T.; Rey, F.A.; Bosch, B.-J.; Veesler, D. Glycan shield and fusion activation of a deltacoronavirus spike glycoprotein fine-tuned for enteric infections. J. Virol. 2018, 92. [Google Scholar] [CrossRef] [PubMed] [Green Version]
- Perišić, O.; Lu, H. Efficient free-energy-profile reconstruction using adaptive stochastic perturbation protocols. Phys. Rev. E 2011, 84, 056705. [Google Scholar] [CrossRef] [Green Version]
- Perišić, O. Pulling-spring modulation as a method for improving the potential-of-mean-force reconstruction in single-molecule manipulation experiments. Phys. Rev. E 2013, 87, 013303. [Google Scholar] [CrossRef]
- Perišić, O.; Lu, H. On the improvement of free-energy calculation from steered molecular dynamics simulations using adaptive stochastic perturbation protocols. PLoS ONE 2014, 9, e101810. [Google Scholar] [CrossRef] [Green Version]
- Noh, S.Y.; Notman, R. Comparison of umbrella sampling and steered molecular dynamics methods for computing free energy profiles of aromatic substrates through phospholipid bilayers. J. Chem. Phys. 2020, 153, 034115. [Google Scholar] [CrossRef]
- Moscona, A. Global transmission of oseltamivir-resistant influenza. N. Engl. J. Med. 2009, 360, 953–956. [Google Scholar] [CrossRef] [Green Version]
- Kitchen, D.B.; Decornez, H.; Furr, J.R.; Bajorath, J. Docking and scoring in virtual screening for drug discovery: Methods and applications. Nat. Rev. Drug Discov. 2004, 3, 935–949. [Google Scholar] [CrossRef] [PubMed]
- Davis, I.W.; Baker, D. RosettaLigand Docking with Full Ligand and Receptor Flexibility. J. Mol. Biol. 2009, 385, 381–392. [Google Scholar] [CrossRef] [PubMed]
- Raveh, B.B.; London, N.; Zimmerman, L.; Schueler-Furman, O. Rosetta FlexPepDock ab-initio: Simultaneous Folding, Docking and Refinement of Peptides onto Their Receptors. PLoS ONE 2011, 6, e18934. [Google Scholar] [CrossRef] [PubMed] [Green Version]
- Flavio, B. Protein-Ligand Docking in Drug Design: Performance Assessment and Binding-Pose Selection. In Methods in Molecular Biology; Springer: New York, NY, USA, 2018; pp. 67–88. [Google Scholar]
- Senior, A.W.; Evans, R.; Jumper, J.; Kirkpatrick, J.; Sifre, L.; Green, T.; Qin, C.; Židek, A.; Nelson, A.W.R.; Bridgland, A.; et al. Improved protein structure prediction using potentials from deep learning. Nature 2020, 577, 706–710. [Google Scholar] [CrossRef] [PubMed]
- Lu, H.; Skolnick, J. Development of Unified Statistical Potentials Describing Protein-Protein Interactions. Biophys. J. 2003, 84, 1895–1901. [Google Scholar] [CrossRef] [Green Version]
- Eswar, N.; Marti-Renom, M.A.; Webb, B.; Madhusudhan, M.S.; Eramian, D.; Shen, M.; Pieper, U.; Sali, A. Comparative Protein Structure Modeling With MODELLER. Curr. Protoc. Bioinform. 2006, 15, 1–30. [Google Scholar] [CrossRef] [Green Version]
- Brendel, W.; Bethge, M. Approximating CNNs with Bag-of-local-Features models works surprisingly well on ImageNet. arXiv 2019, arXiv:1904.00760. [Google Scholar]
- O’Hara, S.; Draper, B.A. Introduction to the Bag of Features Paradigm for Image Classification and Retrieval. arXiv 2011, arXiv:1101.3354. [Google Scholar]
- Geirhos, R.; Temme, C.R.M.; Rauber, J.; Schütt, H.H.; Bethge, M.; Wichmann, F.A. Generalisation in Humans and Deep Neural Networks. In Proceedings of the 32nd International Conference on Neural Information Processing Systems, Montréal, QC, Canada, 3–8 December 2018; NIPS-18. Curran Associates Inc.: Red Hook, NY, USA, 2018; pp. 7549–7561. [Google Scholar]


| Drug | Indication | Dosage in Individuals Aged ≥ 12 Years | Effectiveness | Side Effects | Precautions in Patients with Complications | |||
|---|---|---|---|---|---|---|---|---|
| Cardio-Pulmonary | Renal | Hepatic | Retinal[M1] | |||||
| Chloroquine | Treatment Prevention | 500–600 mg weekly | Malaria, Amebiasis, Porphyria Cutanea Tarda | Serious | Yes | Yes | Yes | Yes |
| Ivermectin | Treatment Prevention | 3–15 mg once | Parasitic infestations | Mild/Serious | No | Yes | Yes | No |
| Remdesivir | Treatment | 100–200 mg daily | Ebola, Marburg virus diseases | Mild | No | Yes | No | No |
| Sofosbuvir | Treatment | 400 mg daily | Hepatitis-C, HIV | Mild/Moderate | Yes | Yes | Yes | Yes |
| Boceprevir | Treatment | 200 mg daily | Hepatitis-C | Mild/Serious | Yes | No | Yes | Yes |
| α-Difluoromethylornithine | Treatment | 300–400 mg/kg/day, cream | Trypanosomiasis, reduction of facial hair in women | Mild/Serious | No | No | Yes | No |
© 2020 by the author. Licensee MDPI, Basel, Switzerland. This article is an open access article distributed under the terms and conditions of the Creative Commons Attribution (CC BY) license (http://creativecommons.org/licenses/by/4.0/).
Share and Cite
Perišić, O. Recognition of Potential COVID-19 Drug Treatments through the Study of Existing Protein–Drug and Protein–Protein Structures: An Analysis of Kinetically Active Residues. Biomolecules 2020, 10, 1346. https://0-doi-org.brum.beds.ac.uk/10.3390/biom10091346
Perišić O. Recognition of Potential COVID-19 Drug Treatments through the Study of Existing Protein–Drug and Protein–Protein Structures: An Analysis of Kinetically Active Residues. Biomolecules. 2020; 10(9):1346. https://0-doi-org.brum.beds.ac.uk/10.3390/biom10091346
Chicago/Turabian StylePerišić, Ognjen. 2020. "Recognition of Potential COVID-19 Drug Treatments through the Study of Existing Protein–Drug and Protein–Protein Structures: An Analysis of Kinetically Active Residues" Biomolecules 10, no. 9: 1346. https://0-doi-org.brum.beds.ac.uk/10.3390/biom10091346