
Immunometabolic Markers in a Small Patient Cohort Undergoing Immunotherapy

 , , and
Abstract
:1. Introduction
2. Materials and Methods
2.1. Patients
2.2. Clinical Blood Parameters, Blood Metabolites and Hormones
2.3. Flow Cytometry
3. Results
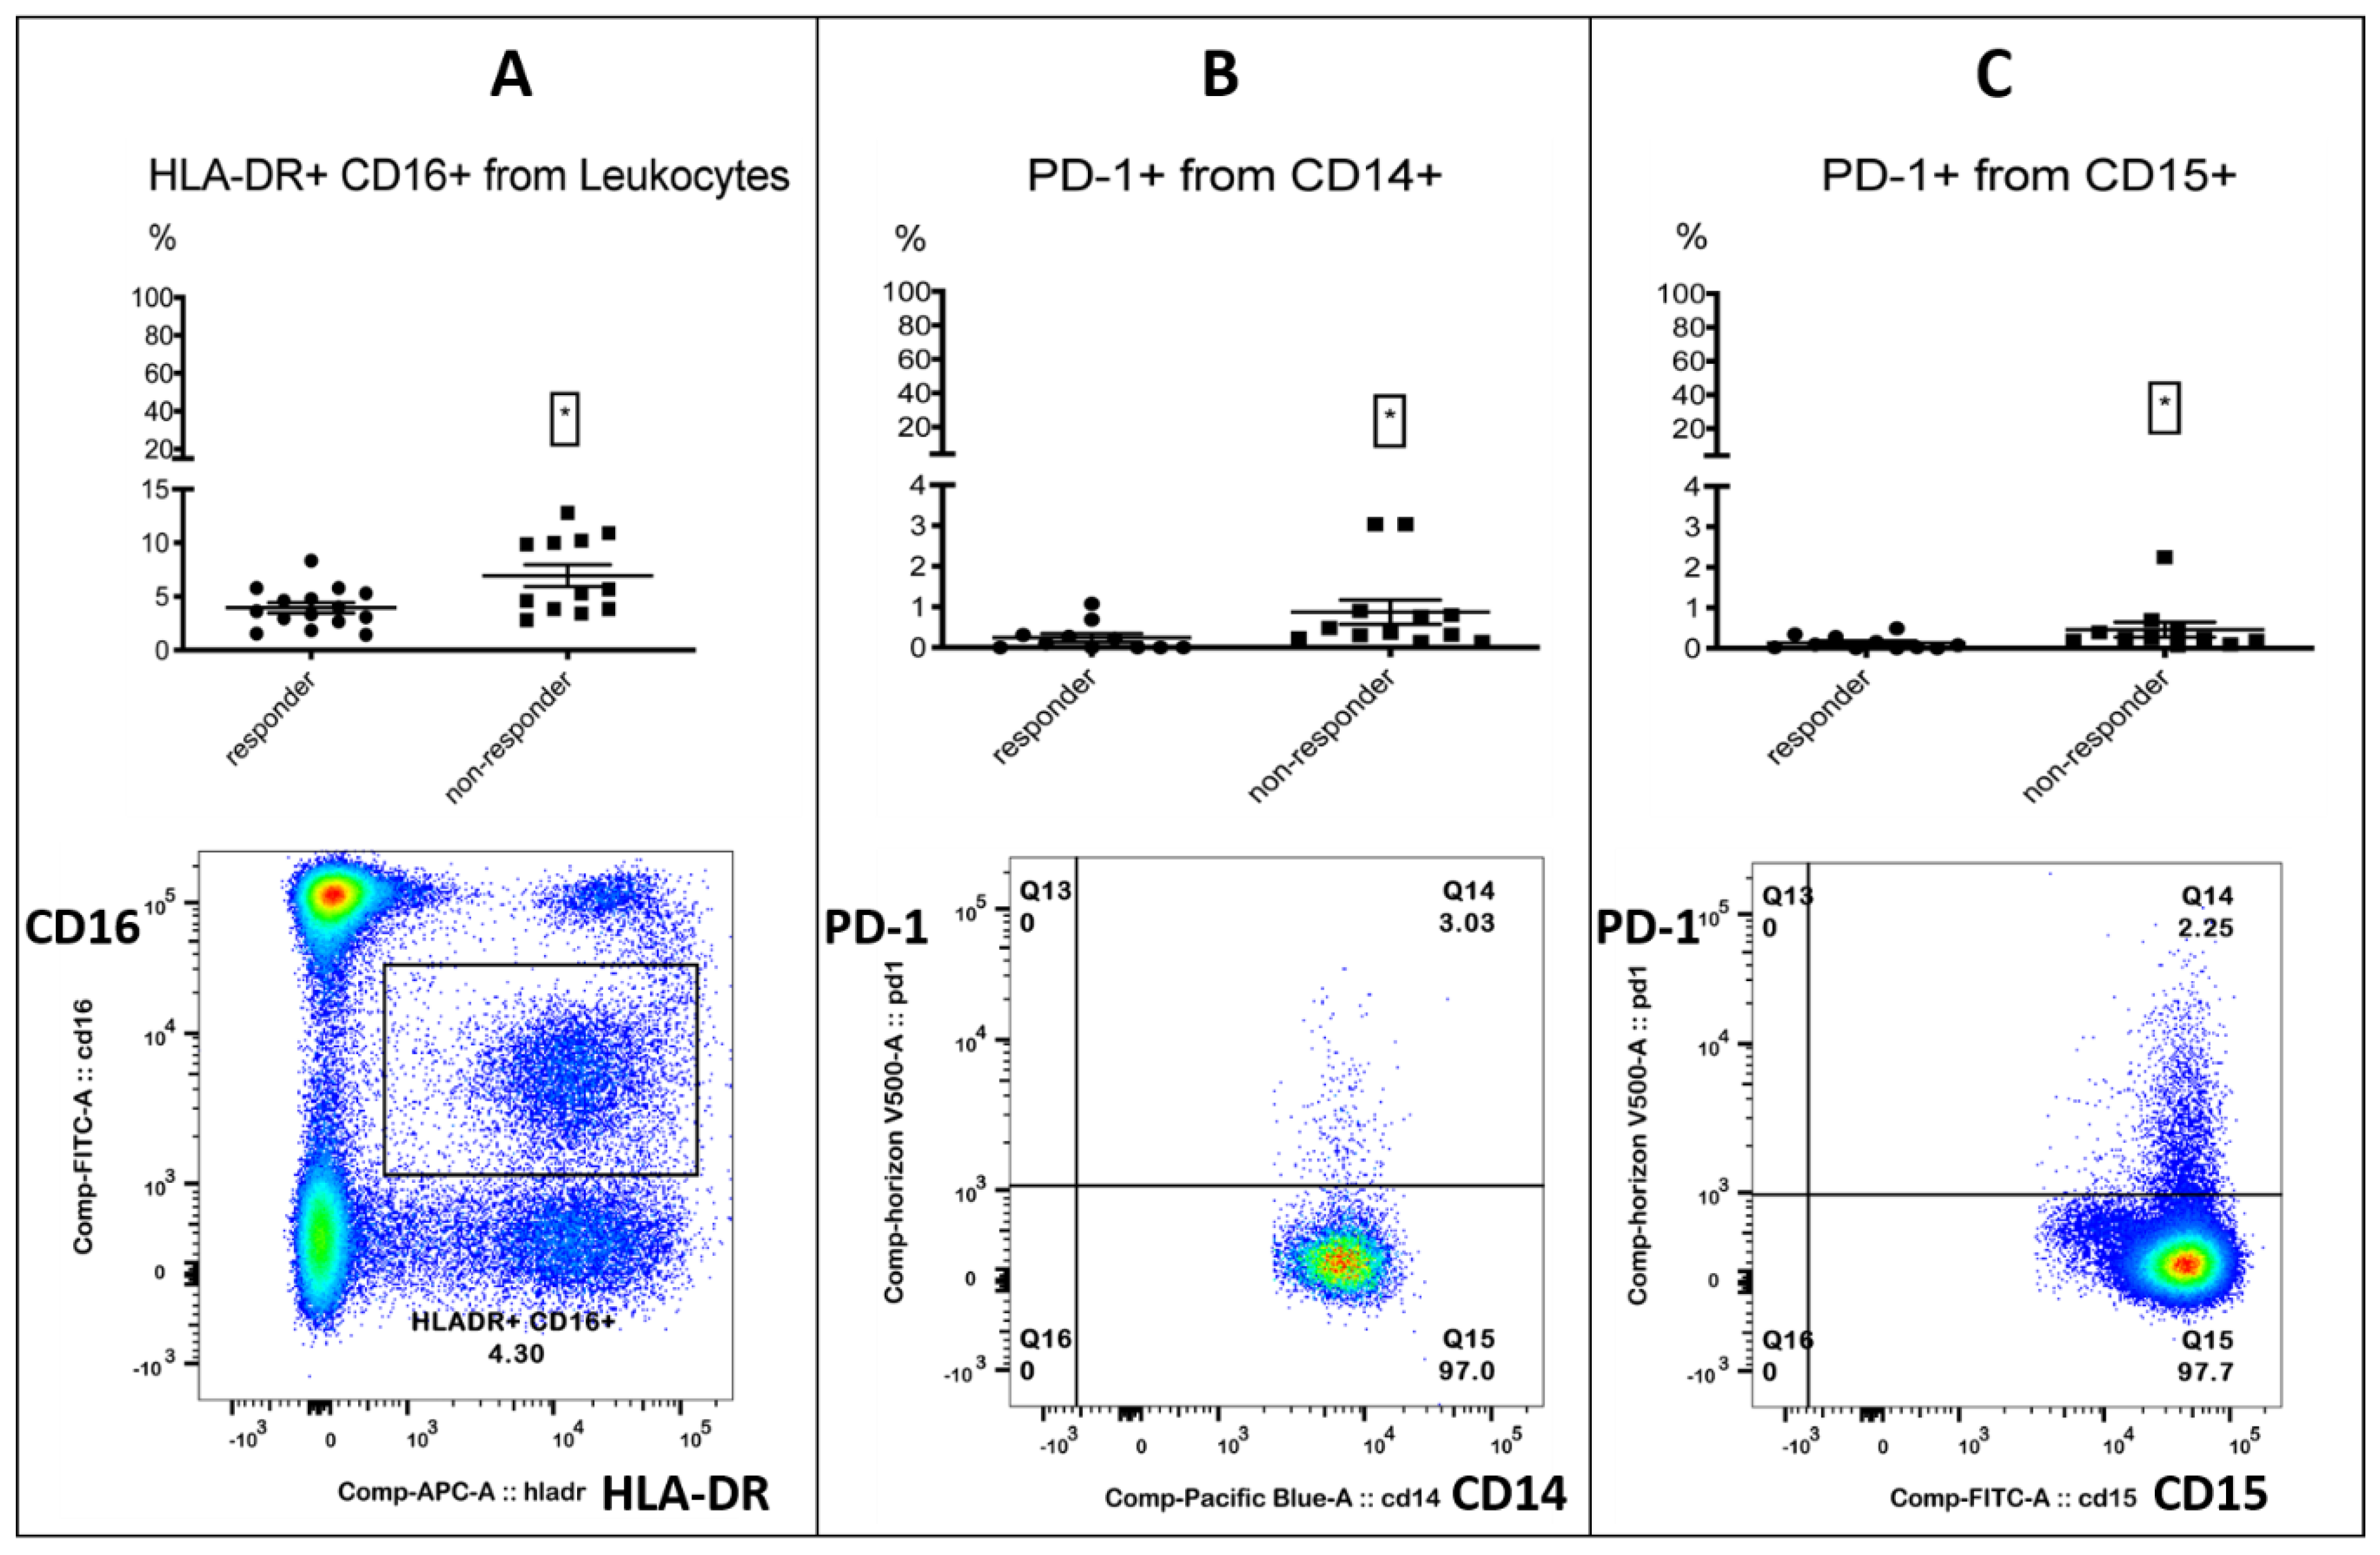
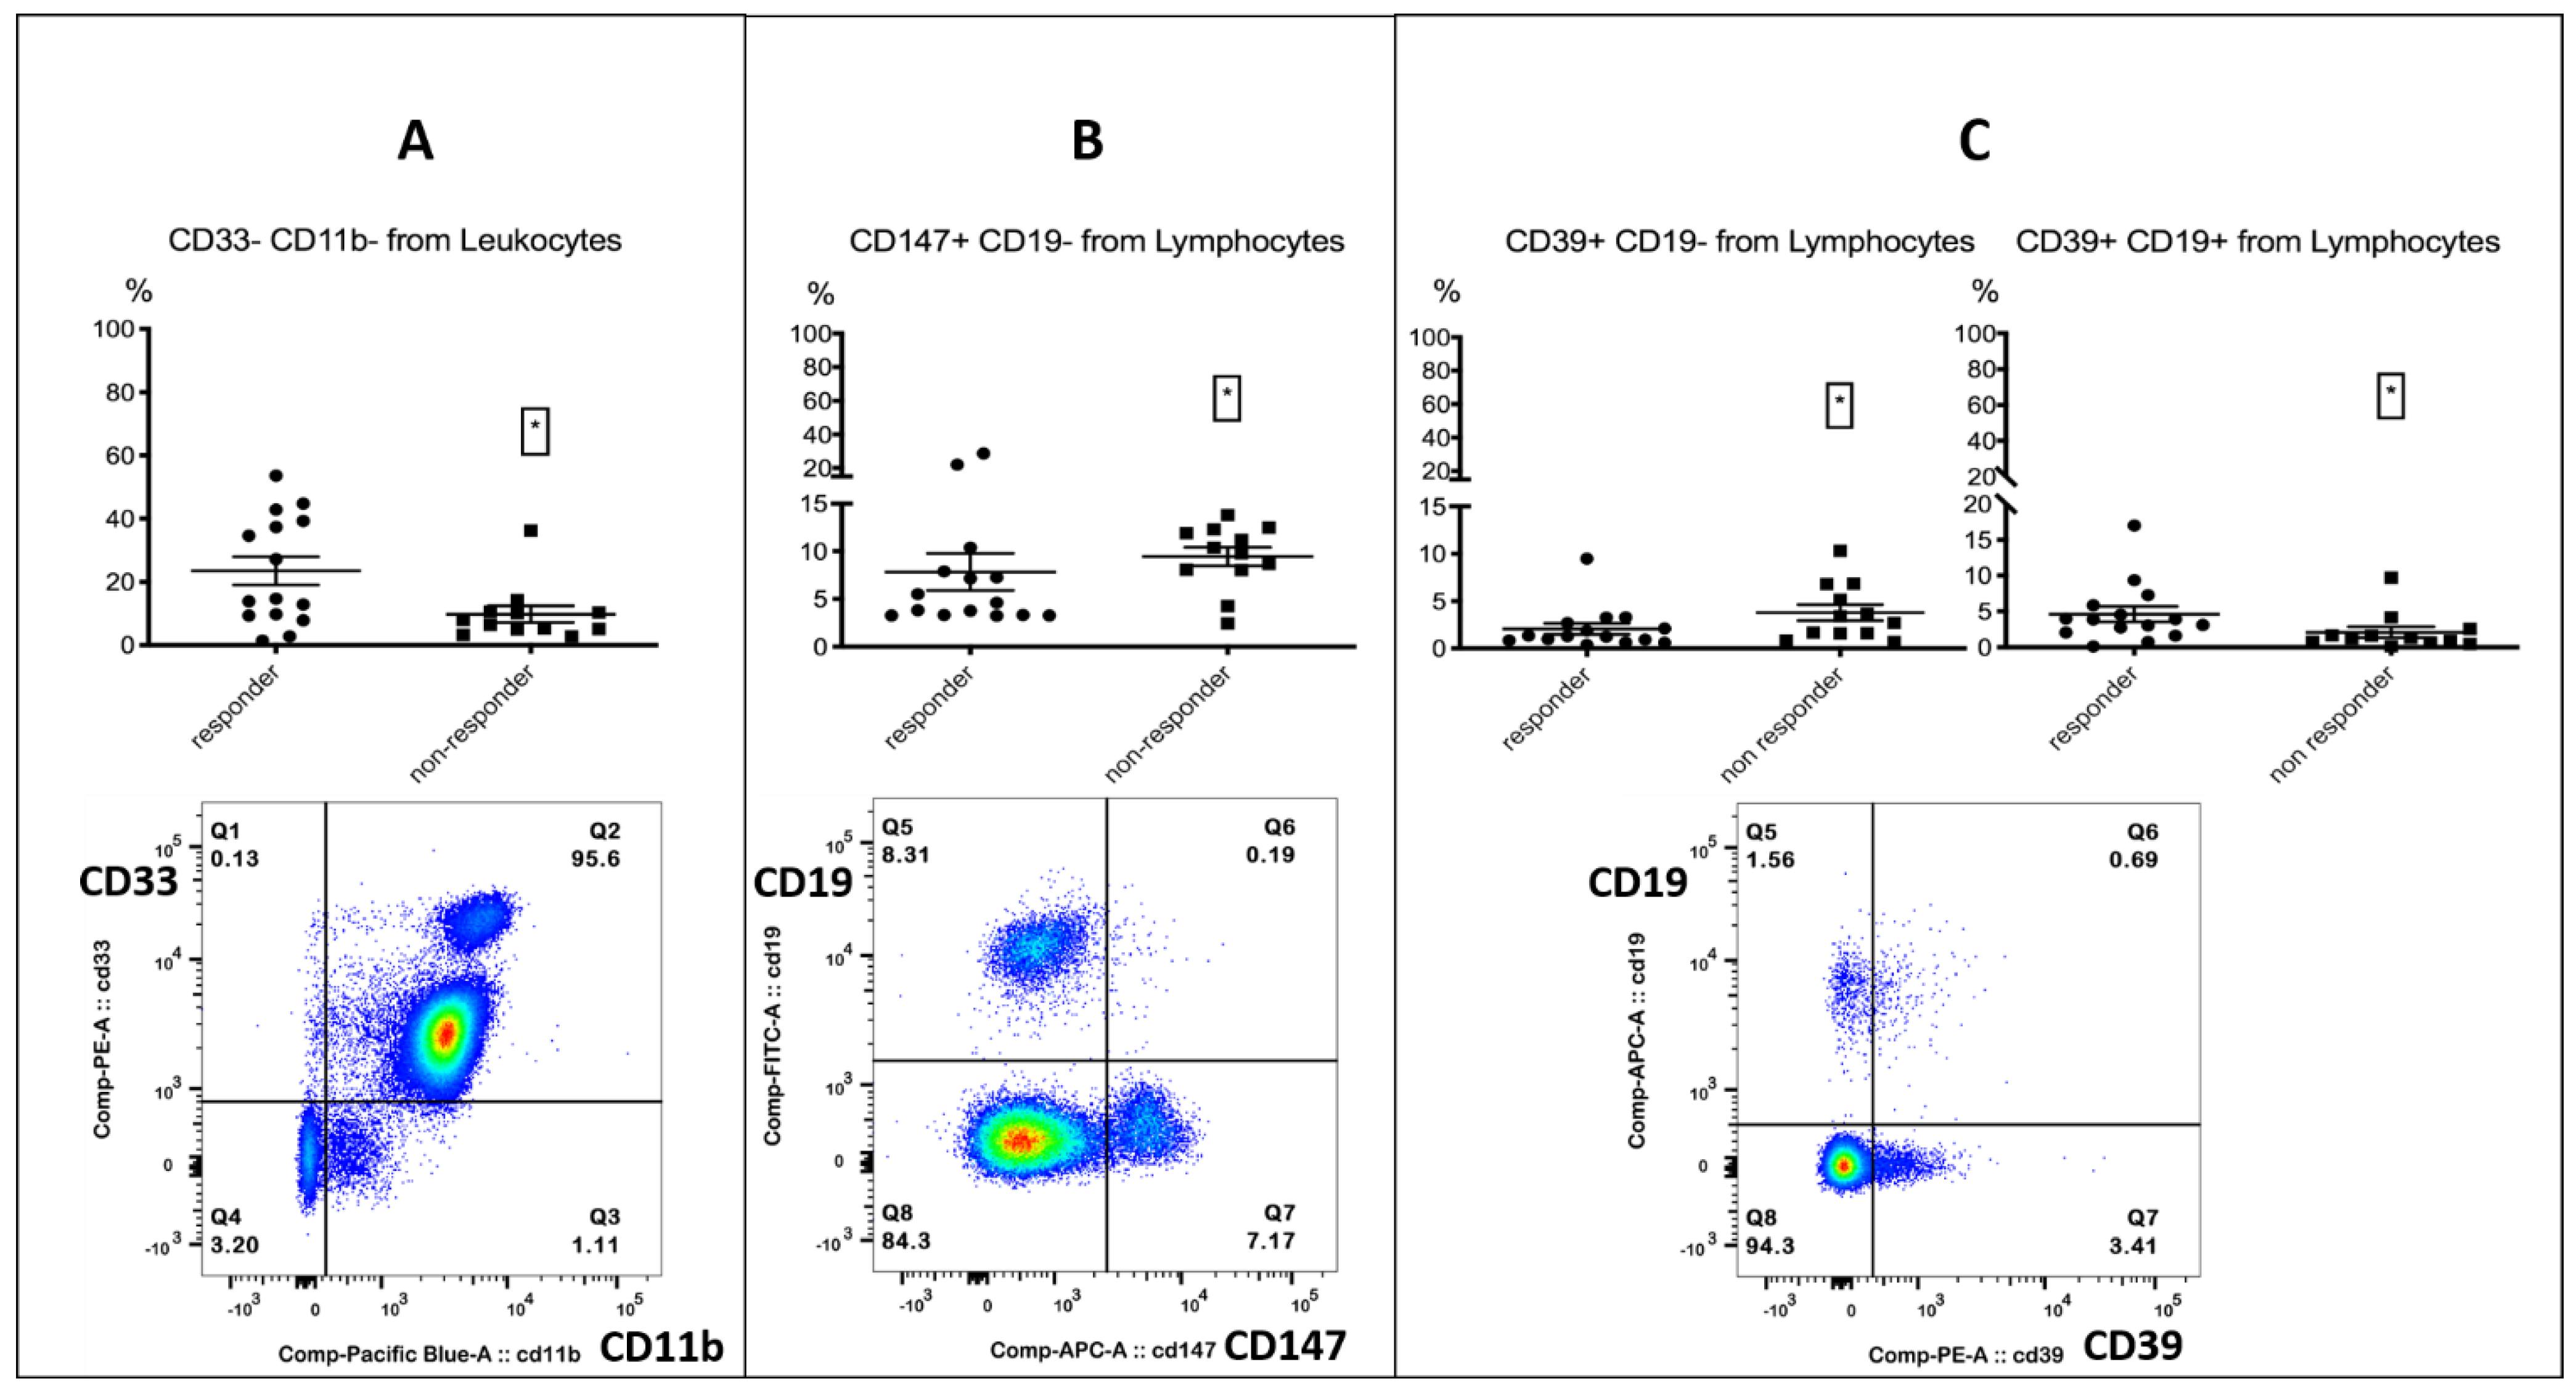
3.1. Identification of Target Analytes in Responders and Non-Responders
3.2. Correlation with PFS-Introduced PD-1+ Monocytes and the Free Androgen Index as Potentially Novel Markers in Immunotherapy
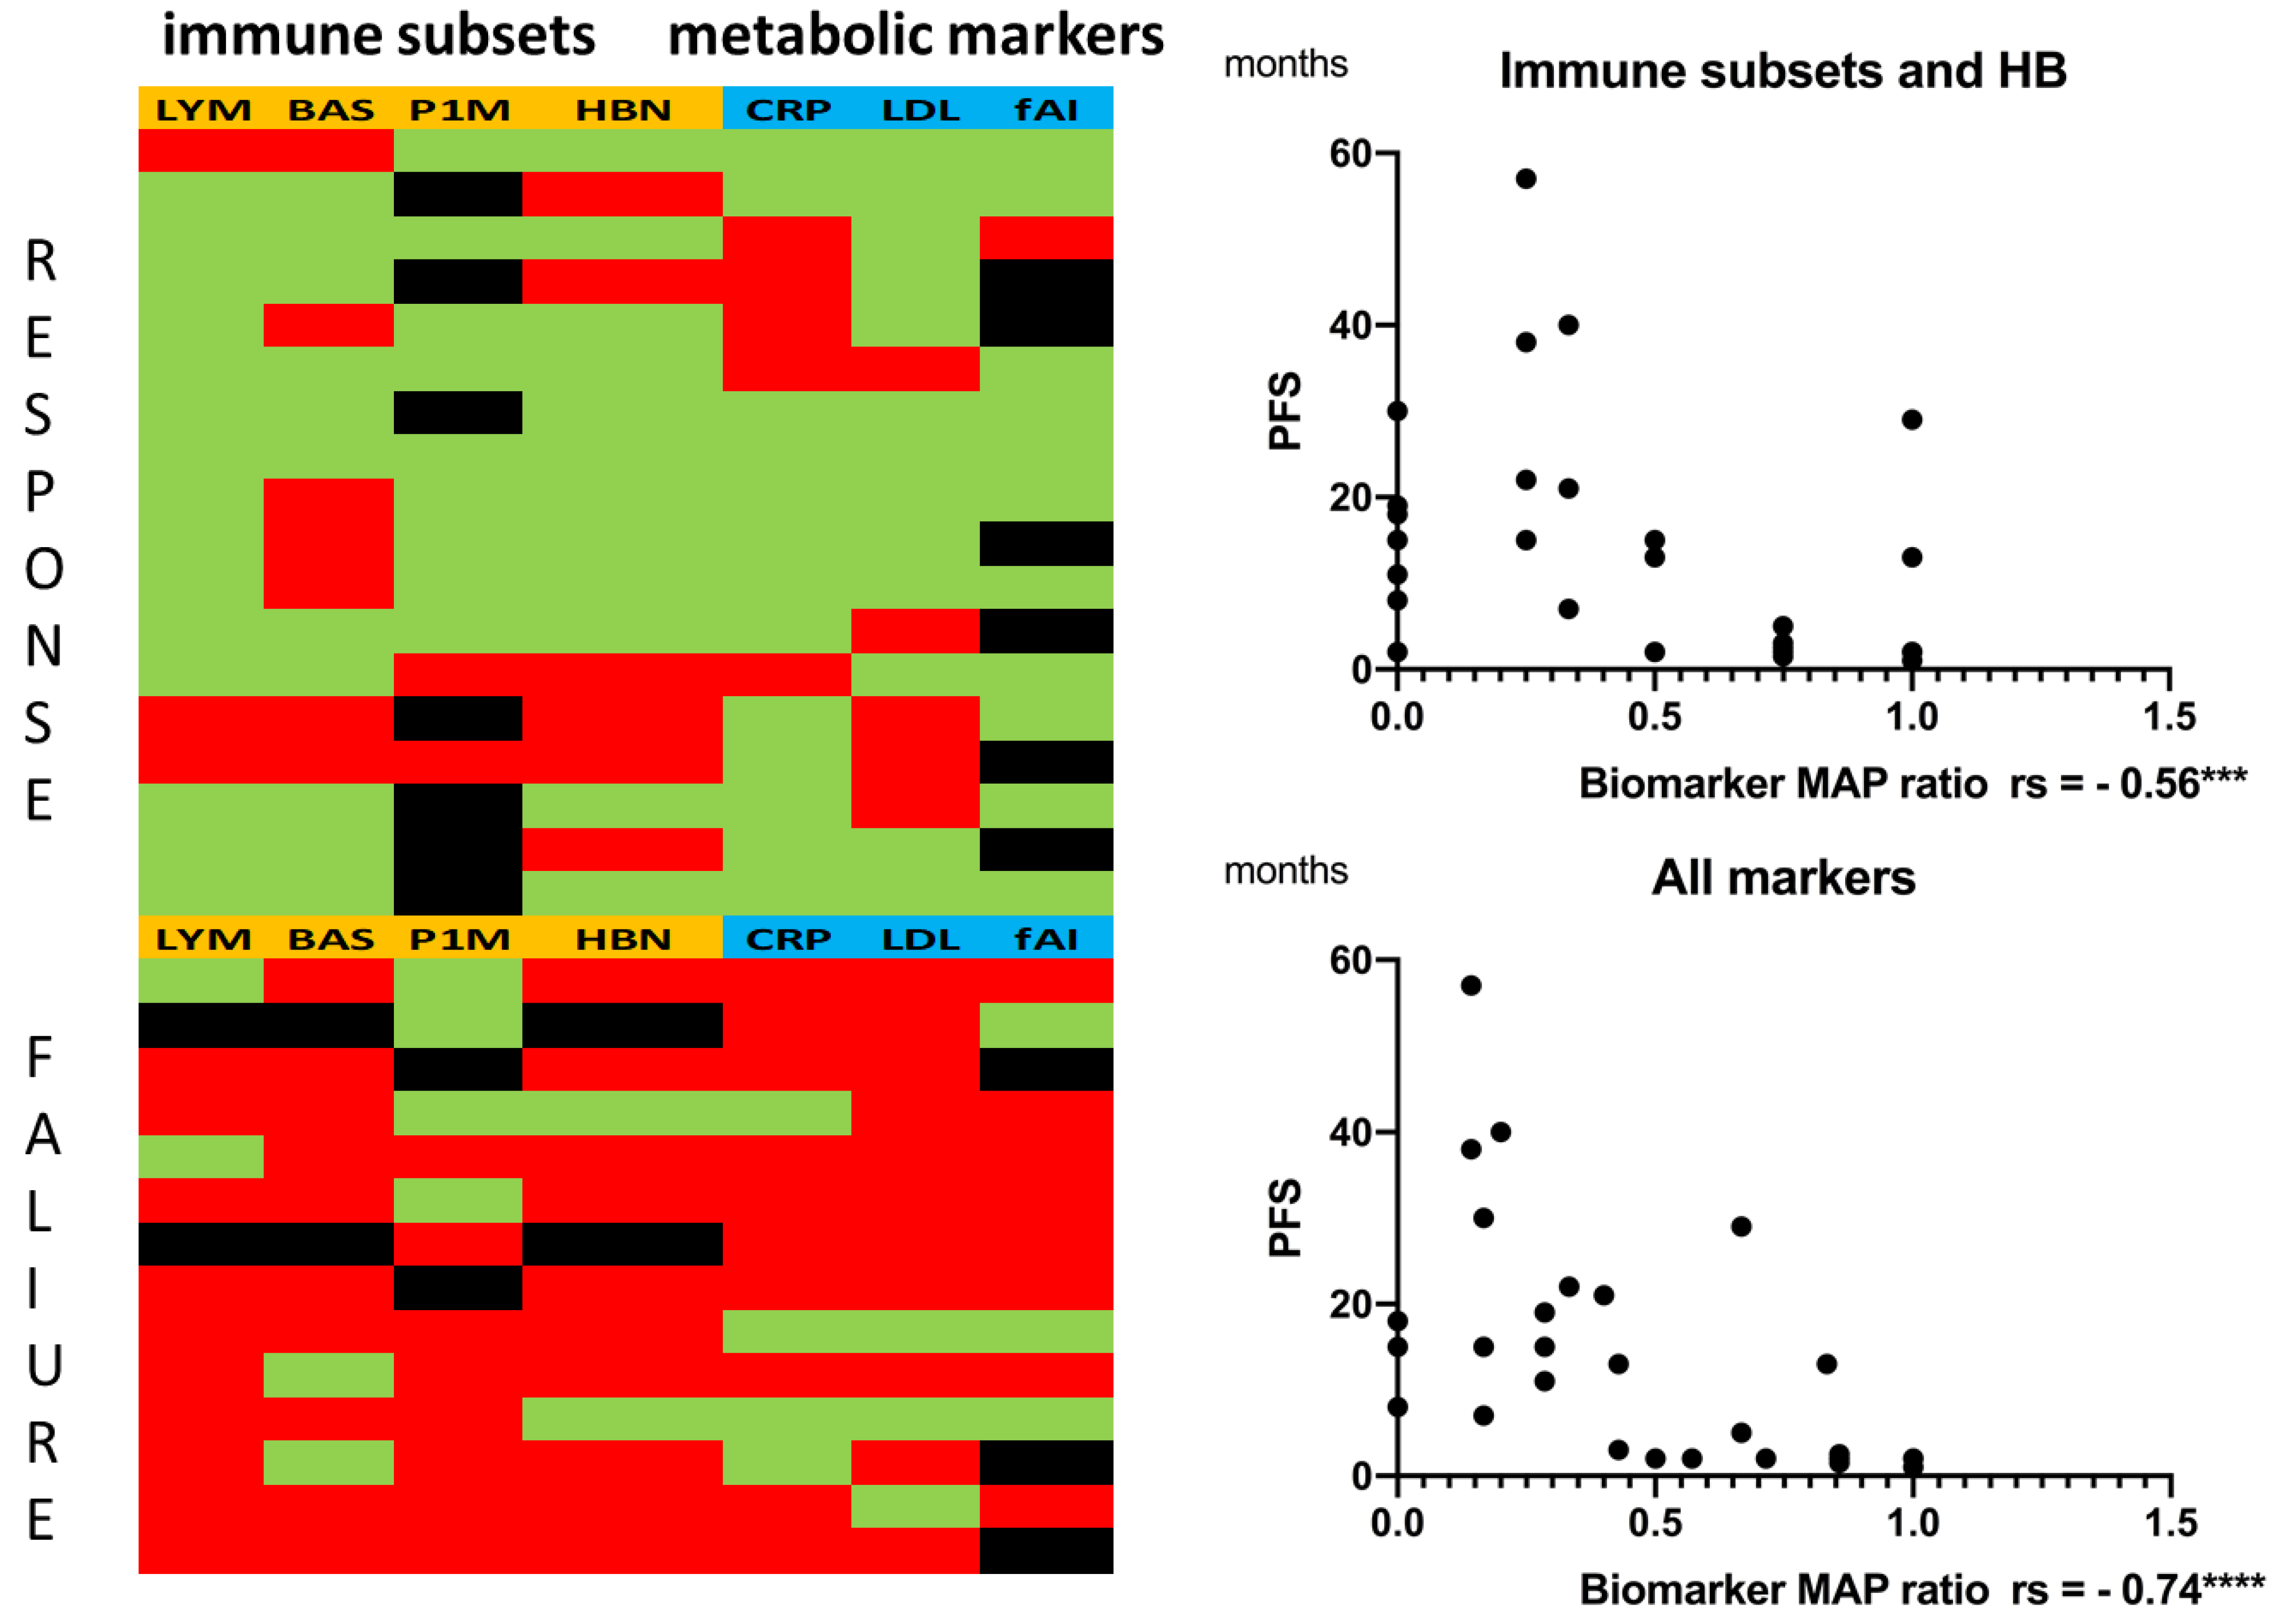
3.3. Combining Immune Subset Markers with Metabolic Markers Enhanced Correlation with PFS
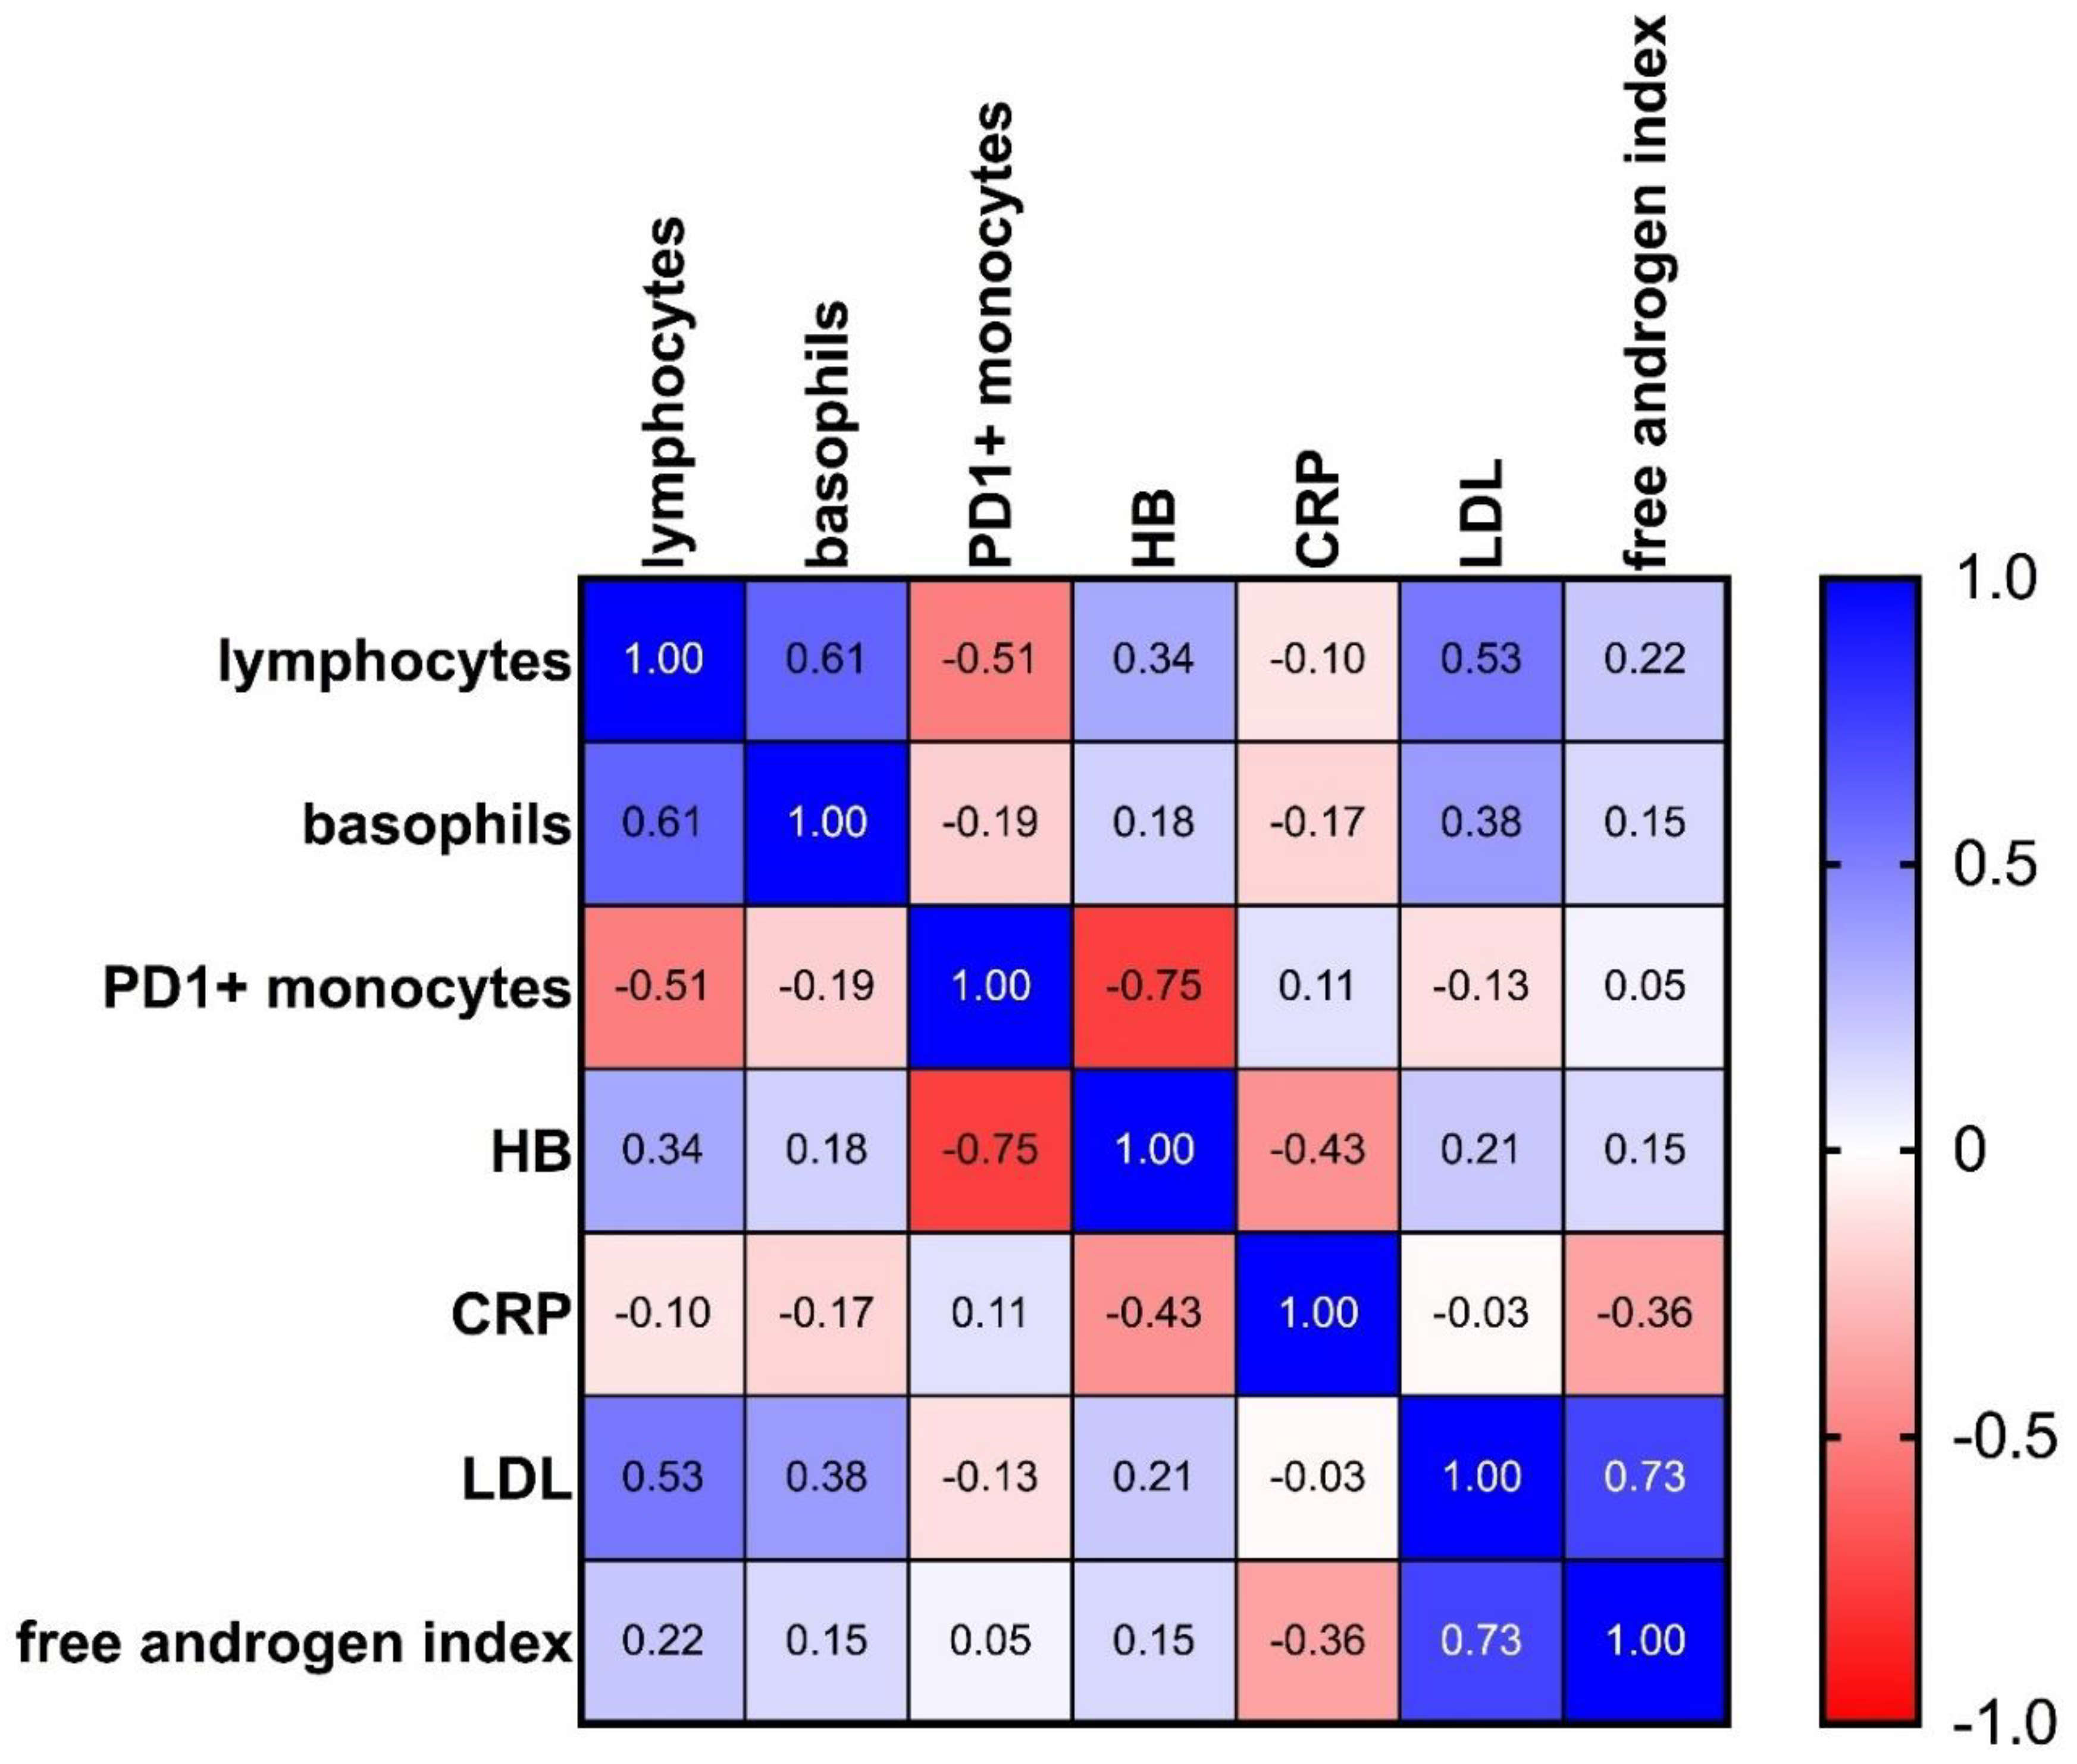
3.4. Multiple Correlation Analysis Revealed a Strong Inverse Correlation between PD-1+ Monocytes and Hemoglobin
4. Discussion
5. Conclusions
Supplementary Materials
Author Contributions
Funding
Institutional Review Board Statement
Informed Consent Statement
Data Availability Statement
Acknowledgments
Conflicts of Interest
References
- Zang, X. 2018 Nobel Prize in medicine awarded to cancer immunotherapy: Immune checkpoint blockade—A personal account. Genes Dis. 2018, 5, 302–303. [Google Scholar] [CrossRef] [PubMed]
- Lei, Q.; Wang, D.; Sun, K.; Wang, L.; Zhang, Y. Resistance Mechanisms of Anti-PD1/PDL1 Therapy in Solid Tumors. Front. Cell Dev. Biol. 2020, 8, 672. [Google Scholar] [CrossRef] [PubMed]
- Kok, V.C. Current Understanding of the Mechanisms Underlying Immune Evasion From PD-1/PD-L1 Immune Checkpoint Blockade in Head and Neck Cancer. Front. Oncol. 2020, 10, 268. [Google Scholar] [CrossRef] [Green Version]
- Kambayashi, Y.; Fujimura, T.; Hidaka, T.; Aiba, S. Biomarkers for Predicting Efficacies of Anti-PD1 Antibodies. Front. Med. 2019, 6, 174. [Google Scholar] [CrossRef] [Green Version]
- Riedl, J.M.; Barth, D.A.; Brueckl, W.M.; Zeitler, G.; Foris, V.; Mollnar, S.; Stotz, M.; Rossmann, C.H.; Terbuch, A.; Balic, M.; et al. C-Reactive Protein (CRP) Levels in Immune Checkpoint Inhibitor Response and Progression in Advanced Non-Small Cell Lung Cancer: A Bi-Center Study. Cancers 2020, 12, 2319. [Google Scholar] [CrossRef]
- Zhang, Z.; Zhang, F.; Yuan, F.; Li, Y.; Ma, J.; Ou, Q.; Liu, Z.; Yang, B.; Wang, L.; Tao, H.; et al. Pretreatment hemoglobin level as a predictor to evaluate the efficacy of immune checkpoint inhibitors in patients with advanced non-small cell lung cancer. Ther. Adv. Med. Oncol. 2020, 12, 1758835920970049. [Google Scholar] [CrossRef]
- Krieg, C.; Nowicka, M.; Guglietta, S.; Schindler, S.; Hartmann, F.J.; Weber, L.M.; Dummer, R.; Robinson, M.D.; Levesque, M.P.; Becher, B. High-dimensional single-cell analysis predicts response to anti-PD-1 immunotherapy. Nat. Med. 2018, 24, 144–153. [Google Scholar] [CrossRef]
- Mengos, A.E.; Gastineau, D.A.; Gustafson, M.P. The CD14+HLA-DRlo/neg Monocyte: An Immunosuppressive Phenotype That Restrains Responses to Cancer Immunotherapy. Front. Immunol. 2019, 10, 1147. [Google Scholar] [CrossRef] [Green Version]
- Peranzoni, E.; Ingangi, V.; Masetto, E.; Pinton, L.; Marigo, I. Myeloid Cells as Clinical Biomarkers for Immune Checkpoint Blockade. Front. Immunol. 2020, 11, 1590. [Google Scholar] [CrossRef]
- Perrone, F.; Minari, R.; Bersanelli, M.; Bordi, P.; Tiseo, M.; Favari, E.; Sabato, R.; Buti, S. The Prognostic Role of High Blood Cholesterol in Advanced Cancer Patients Treated With Immune Checkpoint Inhibitors. J. Immunother. 2020, 43, 196–203. [Google Scholar] [CrossRef]
- Ichihara, E.; Harada, D.; Inoue, K.; Sato, K.; Hosokawa, S.; Kishino, D.; Watanabe, K.; Ochi, N.; Oda, N.; Hara, N.; et al. The impact of body mass index on the efficacy of anti-PD-1/PD-L1 antibodies in patients with non-small cell lung cancer. Lung Cancer 2020, 139, 140–145. [Google Scholar] [CrossRef] [PubMed]
- Cortellini, A.; Bersanelli, M.; Buti, S.; Cannita, K.; Santini, D.; Perrone, F.; Giusti, R.; Tiseo, M.; Michiara, M.; Di Marino, P.; et al. A Multicenter Study of Body Mass Index in Cancer Patients Treated with Anti-PD-1/PD-L1 Immune Checkpoint Inhibitors: When Overweight Becomes Favorable. Available online: https://0-jitc-biomedcentral-com.brum.beds.ac.uk/articles/10.1186/s40425-019-0527-y (accessed on 26 March 2021).
- Renner, K.; Bruss, C.; Schnell, A.; Koehl, G.; Becker, H.M.; Fante, M.; Menevse, A.-N.; Kauer, N.; Blazquez, R.; Hacker, L.; et al. Restricting Glycolysis Preserves T Cell Effector Functions and Augments Checkpoint Therapy. Cell Rep. 2019, 29, 135–150.e9. [Google Scholar] [CrossRef] [PubMed] [Green Version]
- Irelli, A.; Sirufo, M.M.; D’Ugo, C.; Ginaldi, L.; de Martinis, M. Sex and Gender Influences on Cancer Immunotherapy Response. Biomedicines 2020, 8, 232. [Google Scholar] [CrossRef] [PubMed]
- Fornarini, G.; Rebuzzi, S.E.; Banna, G.L.; Calabrò, F.; Scandurra, G.; de Giorgi, U.; Masini, C.; Baldessari, C.; Naglieri, E.; Caserta, C.; et al. Immune-inflammatory biomarkers as prognostic factors for immunotherapy in pretreated advanced urinary tract cancer patients: An analysis of the Italian SAUL cohort. ESMO Open 2021, 6, 100118. [Google Scholar] [CrossRef]
- Imai, H.; Kishikawa, T.; Minemura, H.; Yamada, Y.; Ibe, T.; Yamaguchi, O.; Mouri, A.; Hamamoto, Y.; Kanazawa, K.; Kasai, T.; et al. Pretreatment Glasgow prognostic score predicts survival among patients with high PD-L1 expression administered first-line pembrolizumab monotherapy for non-small cell lung cancer. Cancer Med. 2021, 10, 6971–6984. [Google Scholar] [CrossRef]
- Banna, G.L.; Signorelli, D.; Metro, G.; Galetta, D.; de Toma, A.; Cantale, O.; Banini, M.; Friedlaender, A.; Pizzutillo, P.; Garassino, M.C.; et al. Neutrophil-to-lymphocyte ratio in combination with PD-L1 or lactate dehydrogenase as biomarkers for high PD-L1 non-small cell lung cancer treated with first-line pembrolizumab. Transl. Lung Cancer Res. 2020, 9, 1533–1542. [Google Scholar] [CrossRef]
- Banna, G.L.; Tiseo, M.; Cortinovis, D.L.; Facchinetti, F.; Aerts, J.G.J.V.; Baldessari, C.; Giusti, R.; Bria, E.; Grossi, F.; Berardi, R.; et al. Host immune-inflammatory markers to unravel the heterogeneous outcome and assessment of patients with PD-L1 ≥ 50% metastatic non-small cell lung cancer and poor performance status receiving first-line immunotherapy. Thorac. Cancer 2022, 13, 483–488. [Google Scholar] [CrossRef]
- Benzekry, S.; Grangeon, M.; Karlsen, M.; Alexa, M.; Bicalho-Frazeto, I.; Chaleat, S.; Tomasini, P.; Barbolosi, D.; Barlesi, F.; Greillier, L. Machine Learning for Prediction of Immunotherapy Efficacy in Non-Small Cell Lung Cancer from Simple Clinical and Biological Data. Cancers 2021, 13, 6210. [Google Scholar] [CrossRef]
- Hatae, R.; Chamoto, K.; Kim, Y.H.; Sonomura, K.; Taneishi, K.; Kawaguchi, S.; Yoshida, H.; Ozasa, H.; Sakamori, Y.; Akrami, M.; et al. Combination of host immune metabolic biomarkers for the PD-1 blockade cancer immunotherapy. JCI Insight 2020, 5, e133501. [Google Scholar] [CrossRef] [Green Version]
- Hurkmans, D.P.; Kuipers, M.E.; Smit, J.; van Marion, R.; Mathijssen, R.H.J.; Postmus, P.E.; Hiemstra, P.S.; Aerts, J.G.J.V.; von der Thüsen, J.H.; van der Burg, S.H. Tumor mutational load, CD8+ T cells, expression of PD-L1 and HLA class I to guide immunotherapy decisions in NSCLC patients. Cancer Immunol. Immunother. 2020, 69, 771–777. [Google Scholar] [CrossRef] [Green Version]
- Benjamini, Y.; Hochberg, Y. Controlling the False Discovery Rate: A Practical and Powerful Approach to Multiple Testing. J. R. Stat. Soc. Ser. B 1995, 57, 289–300. Available online: https://www.bibsonomy.org/bibtex/b38b0e6655978ad8c7d8455b175c2cbf (accessed on 3 April 2022). [CrossRef]
- Tanizaki, J.; Haratani, K.; Hayashi, H.; Chiba, Y.; Nakamura, Y.; Yonesaka, K.; Kudo, K.; Kaneda, H.; Hasegawa, Y.; Tanaka, K.; et al. Peripheral Blood Biomarkers Associated with Clinical Outcome in Non-Small Cell Lung Cancer Patients Treated with Nivolumab. J. Thorac. Oncol. 2018, 13, 97–105. [Google Scholar] [CrossRef] [PubMed] [Green Version]
- Weide, B.; Martens, A.; Hassel, J.C.; Berking, C.; Postow, M.A.; Bisschop, K.; Simeone, E.; Mangana, J.; Schilling, B.; Di Giacomo, A.M.; et al. Baseline Biomarkers for Outcome of Melanoma Patients Treated with Pembrolizumab. Clin. Cancer Res. 2016, 22, 5487–5496. [Google Scholar] [CrossRef] [PubMed] [Green Version]
- Rosner, S.; Kwong, E.; Shoushtari, A.N.; Friedman, C.F.; Betof, A.S.; Brady, M.S.; Coit, D.G.; Callahan, M.K.; Wolchok, J.D.; Chapman, P.B.; et al. Peripheral blood clinical laboratory variables associated with outcomes following combination nivolumab and ipilimumab immunotherapy in melanoma. Cancer Med. 2018, 7, 690–697. [Google Scholar] [CrossRef] [PubMed]
- Galli, G.; Corsetto, P.; Ferrara, R.; Prelaj, A.; Proto, C.; Signorelli, D.; Zilembo, N.; de Toma, A.; Pagani, F.; Randon, G.; et al. Impact of cholesterolemia and body mass index on outcome of metastatic non small cell lung cancer treated with immunotherapy. J. Clin. Oncol. 2019, 37, e20691. [Google Scholar] [CrossRef]
- Zhang, H.; Zhao, W.; Li, X.; He, Y. Cholesterol Metabolism as a Potential Therapeutic Target and a Prognostic Biomarker for Cancer Immunotherapy. OncoTargets Ther. 2021, 14, 3803–3812. [Google Scholar] [CrossRef]
- Tong, J.; Mao, Y.; Yang, Z.; Xu, Q.; Zheng, Z.; Zhang, H.; Wang, J.; Zhang, S.; Rong, W.; Zheng, L. Baseline Serum Cholesterol Levels Predict the Response of Patients with Advanced Non-Small Cell Lung Cancer to Immune Checkpoint Inhibitor-Based Treatment. Cancer Manag. Res. 2021, 13, 4041–4053. [Google Scholar] [CrossRef]
- Brustugun, O.T.; Sprauten, M.; Helland, A. C-reactive protein (CRP) as a predictive marker for immunotherapy in lung cancer. JCO 2016, 34, e20623. [Google Scholar] [CrossRef]
- Oya, Y.; Yoshida, T.; Kuroda, H.; Mikubo, M.; Kondo, C.; Shimizu, J.; Horio, Y.; Sakao, Y.; Hida, T.; Yatabe, Y. Predictive clinical parameters for the response of nivolumab in pretreated advanced non-small-cell lung cancer. Oncotarget 2017, 8, 103117–103128. [Google Scholar] [CrossRef] [Green Version]
- Iivanainen, S.; Ahvonen, J.; Knuuttila, A.; Tiainen, S.; Koivunen, J.P. Elevated CRP levels indicate poor progression-free and overall survival on cancer patients treated with PD-1 inhibitors. ESMO Open 2019, 4, e000531. [Google Scholar] [CrossRef] [Green Version]
- Laino, A.S.; Woods, D.; Vassallo, M.; Qian, X.; Tang, H.; Wind-Rotolo, M.; Weber, J. Serum interleukin-6 and C-reactive protein are associated with survival in melanoma patients receiving immune checkpoint inhibition. J. Immunother. Cancer 2020, 8, e000842. [Google Scholar] [CrossRef] [PubMed]
- Lechner, M.G.; Megiel, C.; Russell, S.M.; Bingham, B.; Arger, N.; Woo, T.; Epstein, A.L. Functional characterization of human Cd33+ and Cd11b+ myeloid-derived suppressor cell subsets induced from peripheral blood mononuclear cells co-cultured with a diverse set of human tumor cell lines. J. Transl. Med. 2011, 9, 90. [Google Scholar] [CrossRef] [PubMed] [Green Version]
- Weber, J.; Gibney, G.; Kudchadkar, R.; Yu, B.; Cheng, P.; Martinez, A.J.; Kroeger, J.; Richards, A.; McCormick, L.; Moberg, V.; et al. Phase I/II Study of Metastatic Melanoma Patients Treated with Nivolumab Who Had Progressed after Ipilimumab. Cancer Immunol. Res. 2016, 4, 345–353. [Google Scholar] [CrossRef] [PubMed] [Green Version]
- Strauss, L.; Mahmoud, M.A.A.; Weaver, J.D.; Tijaro-Ovalle, N.M.; Christofides, A.; Wang, Q.; Pal, R.; Yuan, M.; Asara, J.; Patsoukis, N.; et al. Targeted deletion of PD-1 in myeloid cells induces antitumor immunity. Sci. Immunol. 2020, 5, eaay1863. [Google Scholar] [CrossRef]
- Columbus, G. PD-1 Expression on Monocytes Potential Immunotherapy Biomarker in RCC. OncLive [Online], 13 May 2016. Available online: https://www.onclive.com/view/pd-1-expression-on-monocytes-potential-immunotherapy-biomarker-in-rcc (accessed on 12 March 2022).
- Bai, R.; Lv, Z.; Xu, D.; Cui, J. Predictive biomarkers for cancer immunotherapy with immune checkpoint inhibitors. Biomark. Res. 2020, 8, 34. [Google Scholar] [CrossRef]
- Koh, J.; Lee, K.Y.; Kim, B.; Kim, M.S.; Cho, H.J.; Sun, J.-M.; Ahn, J.S.; Park, K.; Ahn, M.-J. Abstract A138: CD39 increase on cytotoxic T-cell induced by myeloid-derived suppressor cell correlated with poor prognosis in patients with non-small cell lung cancer. In Maintenance of Immune Balance: Effects of Targeted and Immune Therapies, Proceedings of the Abstracts: Fourth CRI-CIMT-EATI-AACR International Cancer Immunotherapy Conference: Translating Science into Survival, New York, NY, USA, 30 September–3 October 2018; American Association for Cancer Research: Philadelphia, PA, USA; p. A138.
- Li, X.-Y.; Moesta, A.K.; Xiao, C.; Nakamura, K.; Casey, M.; Zhang, H.; Madore, J.; Lepletier, A.; Aguilera, A.R.; Sundarrajan, A.; et al. Targeting CD39 in Cancer Reveals an Extracellular ATP- and Inflammasome-Driven Tumor Immunity. Cancer Discov. 2019, 9, 1754–1773. [Google Scholar] [CrossRef] [Green Version]
- Guo, H.; Xun, L.; Zhang, R.; Gou, X. Ratio of CD147high/CD147low in CD4+CD25+ T cells: A potential biomarker for early diagnosis and prediction of response to therapy for autoimmune diseases. Med. Hypotheses 2018, 115, 1–4. [Google Scholar] [CrossRef]
- Landras, A.; Reger de Moura, C.; Jouenne, F.; Lebbe, C.; Menashi, S.; Mourah, S. CD147 Is a Promising Target of Tumor Progression and a Prognostic Biomarker. Cancers 2019, 11, 1803. [Google Scholar] [CrossRef] [Green Version]
- Solstad, T.; Bains, S.J.; Landskron, J.; Aandahl, E.M.; Thiede, B.; Taskén, K.; Torgersen, K.M. CD147 (Basigin/Emmprin) identifies FoxP3+CD45RO+CTLA4+-activated human regulatory T cells. Blood 2011, 118, 5141–5151. [Google Scholar] [CrossRef] [Green Version]
- Chen, Y.; Xu, J.; Wu, X.; Yao, H.; Yan, Z.; Guo, T.; Wang, W.; Wang, P.; Li, Y.; Yang, X.; et al. CD147 regulates antitumor CD8+ T-cell responses to facilitate tumor-immune escape. Cell. Mol. Immunol. 2020, 18, 1995–2009. [Google Scholar] [CrossRef]
- Gomes, A.L.; Carvalho, T.; Serpa, J.; Torre, C.; Dias, S. Hypercholesterolemia promotes bone marrow cell mobilization by perturbing the SDF-1:CXCR4 axis. Blood 2010, 115, 3886–3894. [Google Scholar] [CrossRef] [PubMed] [Green Version]
- Oda, E. Longitudinal associations between lymphocyte count and LDL cholesterol in a health screening population. J. Clin. Transl. Endocrinol. 2014, 1, 49–53. [Google Scholar] [CrossRef] [PubMed] [Green Version]
- Eacker, S.M.; Agrawal, N.; Qian, K.; Dichek, H.L.; Gong, E.-Y.; Lee, K.; Braun, R.E. Hormonal regulation of testicular steroid and cholesterol homeostasis. Mol. Endocrinol. 2008, 22, 623–635. [Google Scholar] [CrossRef] [PubMed] [Green Version]
- Buitenwerf, E.; Dullaart, R.P.F.; Muller Kobold, A.C.; Links, T.P.; Sluiter, W.J.; Connelly, M.A.; Kerstens, M.N. Cholesterol delivery to the adrenal glands estimated by adrenal venous sampling: An in vivo model to determine the contribution of circulating lipoproteins to steroidogenesis in humans. J. Clin. Lipidol. 2017, 11, 733–738. [Google Scholar] [CrossRef]
- Blom, D.J.; Djedjos, C.S.; Monsalvo, M.L.; Bridges, I.; Wasserman, S.M.; Scott, R.; Roth, E. Effects of Evolocumab on Vitamin E and Steroid Hormone Levels: Results From the 52-Week, Phase 3, Double-Blind, Randomized, Placebo-Controlled DESCARTES Study. Circ. Res. 2015, 117, 731–741. [Google Scholar] [CrossRef]
- Dev, R.; Del Fabbro, E.; Dalal, S. Endocrinopathies and cancer cachexia. Curr. Opin. Support. Palliat. Care 2019, 13, 286–291. [Google Scholar] [CrossRef]
- Rounis, K.; Makrakis, D.; Tsigkas, A.-P.; Georgiou, A.; Galanakis, N.; Papadaki, C.; Monastirioti, A.; Vamvakas, L.; Kalbakis, K.; Vardakis, N.; et al. Cancer cachexia syndrome and clinical outcome in patients with metastatic non-small cell lung cancer treated with PD-1/PD-L1 inhibitors: Results from a prospective, observational study. Transl. Lung Cancer Res. 2021, 10, 3538–3549. [Google Scholar] [CrossRef]
- Fernández-Pombo, A.; Rodríguez-Carnero, G.; Castro, A.I.; Cantón-Blanco, A.; Seoane, L.M.; Casanueva, F.F.; Crujeiras, A.B.; Martínez-Olmos, M.A. Relevance of nutritional assessment and treatment to counteract cardiac cachexia and sarcopenia in chronic heart failure. Clin. Nutr. (Edinb. Scotl.) 2021, 40, 5141–5155. [Google Scholar] [CrossRef]
- Cai, Z.; Xi, H.; Pan, Y.; Jiang, X.; Chen, L.; Cai, Y.; Zhu, K.; Chen, C.; Xu, X.; Chen, M. Effect of testosterone deficiency on cholesterol metabolism in pigs fed a high-fat and high-cholesterol diet. Lipids Health Dis. 2015, 14, 18. [Google Scholar] [CrossRef] [Green Version]
- Kenny, A.M.; Prestwood, K.M.; Gruman, C.A.; Fabregas, G.; Biskup, B.; Mansoor, G. Effects of transdermal testosterone on lipids and vascular reactivity in older men with low bioavailable testosterone levels. J. Gerontology. Ser. A Biol. Sci. Med. Sci. 2002, 57, M460–M465. [Google Scholar] [CrossRef] [Green Version]
- Salam, R.; Kshetrimayum, A.S.; Keisam, R. Testosterone and metabolic syndrome: The link. Indian J. Endocrinol. Metab. 2012, 16 (Suppl. S1), S12–S19. [Google Scholar] [CrossRef] [PubMed]
- Bersanelli, M.; Cortellini, A.; Buti, S. The interplay between cholesterol (and other metabolic conditions) and immune-checkpoint immunotherapy: Shifting the concept from the “inflamed tumor” to the “inflamed patient”. Hum. Vaccines Immunother. 2021, 17, 1930–1934. [Google Scholar] [CrossRef] [PubMed]
- Khojandi, N.; Kuehm, L.M.; Piening, A.; Donlin, M.J.; Hsueh, E.C.; Schwartz, T.L.; Farrell, K.; Richart, J.M.; Geerling, E.; Pinto, A.K.; et al. Oxidized Lipoproteins Promote Resistance to Cancer Immunotherapy Independent of Patient Obesity. Cancer Immunol. Res. 2021, 9, 214–226. [Google Scholar] [CrossRef] [PubMed]
- Guan, X.; Polesso, F.; Wang, C.; Sehrawat, A.; Hawkins, R.M.; Murray, S.E.; Thomas, G.V.; Caruso, B.; Thompson, R.F.; Wood, M.A.; et al. Androgen receptor activity in T cells limits checkpoint blockade efficacy. Nature 2022, 603, 587–598. [Google Scholar] [CrossRef]
- Kwon, H.; Schafer, J.M.; Song, N.-J.; Kaneko, S.; Li, A.; Xiao, T.; Ma, A.; Allen, C.; Das, K.; Zhou, L.; et al. Androgen conspires with the CD8+ T cell exhaustion program and contributes to sex bias in cancer. Sci. Immunol. 2022. [Google Scholar] [CrossRef]
- Ma, X.; Bi, E.; Lu, Y.; Su, P.; Huang, C.; Liu, L.; Wang, Q.; Yang, M.; Kalady, M.F.; Qian, J.; et al. Cholesterol Induces CD8+ T Cell Exhaustion in the Tumor Microenvironment. Cell Metab. 2019, 30, 143–156. [Google Scholar] [CrossRef]
- Markman, J.L.; Porritt, R.A.; Wakita, D.; Lane, M.E.; Martinon, D.; Noval Rivas, M.; Luu, M.; Posadas, E.M.; Crother, T.R.; Arditi, M. Loss of testosterone impairs anti-tumor neutrophil function. Nat. Commun. 2020, 11, 1613. [Google Scholar] [CrossRef]
- Tulchiner, G.; Pichler, R.; Ulmer, H.; Staudacher, N.; Lindner, A.K.; Brunner, A.; Zelger, B.; Steinkohl, F.; Aigner, F.; Horninger, W.; et al. Sex-specific hormone changes during immunotherapy and its influence on survival in metastatic renal cell carcinoma. Cancer Immunol. Immunother. 2021, 70, 2805–2817. [Google Scholar] [CrossRef]
- Haupt, S.; Caramia, F.; Klein, S.L.; Rubin, J.B.; Haupt, Y. Sex disparities matter in cancer development and therapy. Nat. Rev. Cancer 2021, 21, 393–407. [Google Scholar] [CrossRef]
- Fang, F.; Qin, Y.; Hao, F.; Li, Q.; Zhang, W.; Zhao, C.; Chen, S.; Zhao, L.; Wang, L.; Cai, J. CD147 modulates androgen receptor activity through the Akt/Gsk-3β/β-catenin/AR pathway in prostate cancer cells. Oncol. Lett. 2016, 12, 1124–1128. [Google Scholar] [CrossRef] [Green Version]
- Li, X.; Yu, X.; Dai, D.; Song, X.; Xu, W. The altered glucose metabolism in tumor and a tumor acidic microenvironment associated with extracellular matrix metalloproteinase inducer and monocarboxylate transporters. Oncotarget 2016, 7, 23141–23155. [Google Scholar] [CrossRef] [PubMed] [Green Version]
- Grass, G.D.; Toole, B.P. How, with whom and when: An overview of CD147-mediated regulatory networks influencing matrix metalloproteinase activity. Biosci. Rep. 2015, 36, e00283. [Google Scholar] [CrossRef] [PubMed] [Green Version]
- Wang, C.; Jin, R.; Zhu, X.; Yan, J.; Li, G. Function of CD147 in atherosclerosis and atherothrombosis. J. Cardiovasc. Transl. Res. 2015, 8, 59–66. [Google Scholar] [CrossRef] [PubMed] [Green Version]
- Landskron, J.; Taskén, K. CD147 in regulatory T cells. Cell. Immunol. 2013, 282, 17–20. [Google Scholar] [CrossRef]
- Haschka, D.; Petzer, V.; Kocher, F.; Tschurtschenthaler, C.; Schaefer, B.; Seifert, M.; Sopper, S.; Sonnweber, T.; Feistritzer, C.; Arvedson, T.L.; et al. Classical and intermediate monocytes scavenge non-transferrin-bound iron and damaged erythrocytes. JCI Insight 2019, 4, e98867. [Google Scholar] [CrossRef]
- Tymoszuk, P.; Nairz, M.; Brigo, N.; Petzer, V.; Heeke, S.; Kircher, B.; Hermann-Kleiter, N.; Klepsch, V.; Theurl, I.; Weiss, G.; et al. Iron Supplementation Interferes With Immune Therapy of Murine Mammary Carcinoma by Inhibiting Anti-Tumor T Cell Function. Front. Oncol. 2020, 10, 584477. [Google Scholar] [CrossRef]
- Yan, Z.; Xu, G. A Novel Choice to Correct Inflammation-Induced Anemia in CKD: Oral Hypoxia-Inducible Factor Prolyl Hydroxylase Inhibitor Roxadustat. Front. Med. 2020, 7, 393. [Google Scholar] [CrossRef]
- Stansfield, B.K.; Ingram, D.A. Clinical significance of monocyte heterogeneity. Clin. Transl. Med. 2015, 4, 5. [Google Scholar] [CrossRef]
- Skrzeczyńska-Moncznik, J.; Bzowska, M.; Loseke, S.; Grage-Griebenow, E.; Zembala, M.; Pryjma, J. Peripheral blood CD14high CD16+ monocytes are main producers of IL-10. Scand. J. Immunol. 2008, 67, 152–159. [Google Scholar] [CrossRef]
- Prat, M.; Le Naour, A.; Coulson, K.; Lemée, F.; Leray, H.; Jacquemin, G.; Rahabi, M.C.; Lemaitre, L.; Authier, H.; Ferron, G.; et al. Circulating CD14high CD16low intermediate blood monocytes as a biomarker of ascites immune status and ovarian cancer progression. J. Immunother. Cancer 2020, 8, e000472. [Google Scholar] [CrossRef]
- Ando, K.; Hamada, K.; Shida, M.; Ohkuma, R.; Kubota, Y.; Horiike, A.; Matsui, H.; Ishiguro, T.; Hirasawa, Y.; Ariizumi, H.; et al. A high number of PD-L1+ CD14+ monocytes in peripheral blood is correlated with shorter survival in patients receiving immune checkpoint inhibitors. Cancer Immunol. Immunother. 2021, 70, 337–348. [Google Scholar] [CrossRef] [PubMed]
- Gubbels Bupp, M.R.; Jorgensen, T.N. Androgen-Induced Immunosuppression. Front. Immunol. 2018, 9, 794. [Google Scholar] [CrossRef] [PubMed]


| Variables | Patients (32 = 100%) | Responders (18 = 56.25%) | Non-Responders (14 = 43.75%) |
|---|---|---|---|
| Female | 8 (25%) | 6 (18.75%) | 2 (6.25%) |
| Male | 24 (75%) | 12 (37.5%) | 12 (37.5%) |
| Age (years) | 64.78 (34–85) | 67.94 (46–85) | 60.71 (34–82) |
| Body mass index (kg/m2) | 24.19 (17.6–35.35) | 25.35 (18.8–35.35) | 22.86 (17.6–28.10) |
| Statin | 7 (21.88%) | 3 (9.38%) | 4 (12.5%) |
| Prednisolone ≤ 20 mg | 7 (21.88%) | 5 (15.63%) | 2 (6.25%) |
| NSAID | 18 (56.25%) | 8 (25%) | 10 (31.25%) |
| Primary tumor | |||
| NSCLC | 12 (37.5%) | 5 (15.63%) | 7 (21.88%) |
| Melanoma | 8 (25%) | 8 (25%) | 0 (0%) |
| HNSCC | 6 (18.75%) | 2 (6.25%) | 4 (12.5%) |
| Others | 6 (18.75%) | 3 (9.38%) | 3 (9.38%) |
| Previous treatments | |||
| <1 | 8 (25%) | 7 (21.88%) | 1 (3.13%) |
| ≥1 | 24 (75%) | 11 (34.38%) | 13 (40.63%) |
| Pembrolizumab | 10 (31.25%) | 9 (28.13%) | 1 (3.13%) |
| Nivolumab | 22 (68.75%) | 9 (28.13%) | 13 (40.63%) |
| Adverse events | 16 (50%) | 13 (40.63%) | 3 (9.38%) |
| Immune Subset | Standard Value or % Population | Responders | Non-Responders | Significance (p) |
|---|---|---|---|---|
| Absolute lymphocyte counts | (1.18–3.74/nL) | 1.49/nL (±0.66) | 0.74/nL (±0.26) | 0.0002 *** |
| Absolute basophil counts | (0.01–0.08/nL) | 0.03/nL (0.02/0.05) | 0.02/nL (0.01/0.02) | 0.0071 ** |
| LDL | (<100 mg/dL) | 131.5 mg/dL (108.75/165.5) | 95 mg/dL (75.75/116) | 0.0009 *** |
| HDL | (40–60 mg/dL) | 50 mg/dL (40/67.50) | 39.5 mg/dL (31/51.50) | 0.0253 * |
| HB | (11.2–15.7 g/dL) | 12.94 g/dL (±1.48) | 11.29 g/dL (±1.83) | 0.0109 * |
| CRP | (<5 mg/L) | 5.25 mg/L (2.9/13.58) | 11.25 mg/L (7/35.5) | 0.0162 * |
| CD33high CD11b+ monocytes | % of leukocytes | 1.89% (1.61/4.02) | 4.94% (2.74/7.0) | 0.0238 * |
| Myeloid Subsets | % from Population | Responders | Non-Responders | Significance (p) |
|---|---|---|---|---|
| PD-1+ granulocytes | % CD15+ granulocytes | 0.08% (0/0.28) | 0.24% (0.19/0.44) | 0.0266 * |
| PD-1+ monocytes | % CD14+ monocytes | 0.1% (0/0.31) | 0.43% (0.25/0.88) | 0.0119 * |
| HLA-DR+CD16+ | % leukocytes | 3.62% (2.68/5.31) | 5.49% (3.84/10.15) | 0.0291 * |
| Lymphocyte Subsets | % from Population | Responders | Non-Responders | Significance (p) |
|---|---|---|---|---|
| CD147+ CD19- | % from lymphocytes | 4.61% (3.32/7.9) | 10.1% (8.04/12.2) | 0.0376 * |
| CD39+ CD19- | % from lymphocytes | 1.3% (0.85/2.69) | 3.07% (1.62/6.39) | 0.0481 * |
| CD39+ CD19+ | % from lymphocytes | 3.88% (2.06/5.85) | 1.3% (0.71/2.36) | 0.0246 * |
| CD33- CD11b- | % from leukocytes | 14.7% (9.34/39.3) | 7.25% (5.1/10.55) | 0.0321 * |
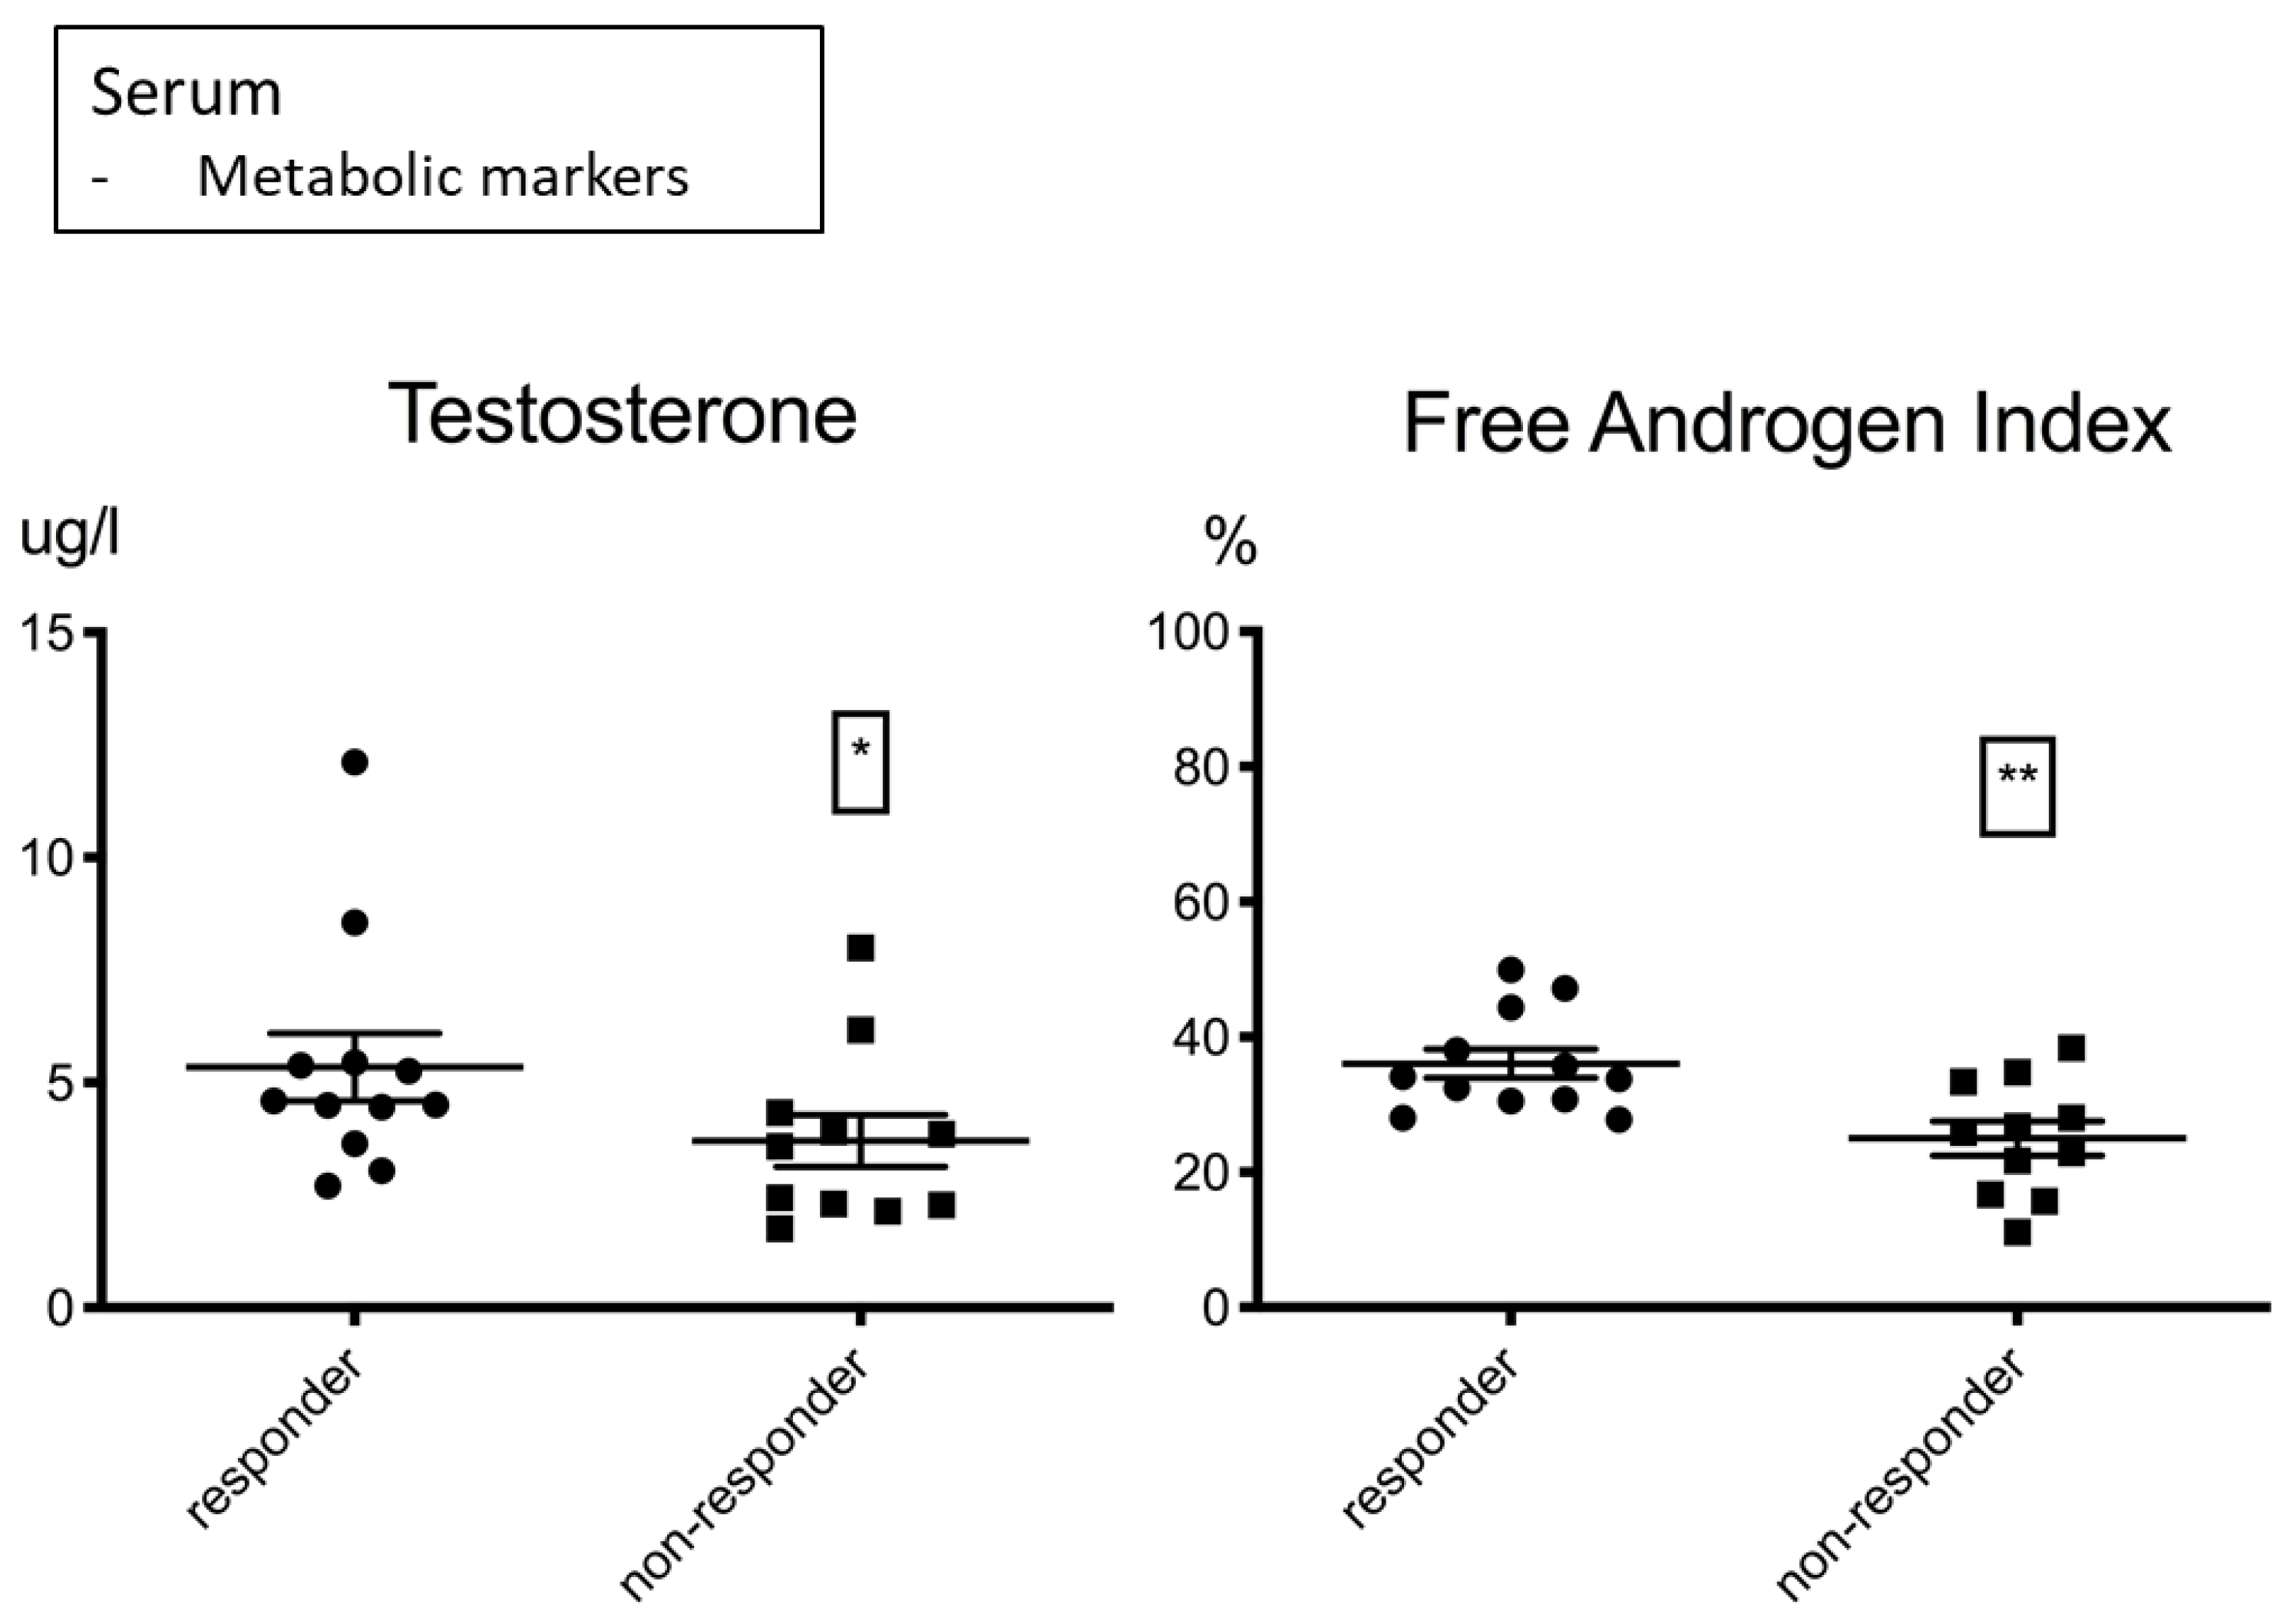
| Hormonal Metabolites | Responders | Non-Responders | Significance (p) |
|---|---|---|---|
| Testosterone | 4.55 µg/L (3.84/5.43) | 3.58 µg/L (2.28/4.33) | 0.0317 * |
| Free androgen index | 36.08% (+/−7.4) | 25.02 % (+/−8.48) | 0.0031 ** |
| Target Analyte | Spearman rs | Significance (p) | Corrected p |
|---|---|---|---|
| Lymphocytes | 0.51 | 0.0039 ** | 0.0224 * |
| Basophils | 0.43 | 0.0175 * | 0.04 * |
| CD33 high+ CD11b+ | −0.28 | 0.1648 | 0.1758 |
| CD33- CD11b- | 0.31 | 0.1168 | 0.1335 |
| HLADR+ CD16+ | −0.43 | 0.0244 * | 0.0471 (*) |
| PD-1+ granulocytes | −0.40 | 0.0662 | 0.0883 |
| PD-1+ monocytes | −0.49 | 0.0166 * | 0.04 * |
| Hemoglobin | 0.44 | 0.0148 * | 0.04 * |
| CD147+ CD19- | −0.36 | 0.0652 | 0.0883 |
| CD39+ CD19- | −0.19 | 0.3369 | 0.3369 |
| CD39+ CD19+ | 0.33 | 0.0918 | 0.1130 |
| CRP | −0.46 | 0.0088 ** | 0.0352 * |
| LDL | 0.53 | 0.0021 ** | 0.0224 * |
| HDL | 0.39 | 0.0265 * | 0.0471 (*) |
| Testosterone | 0.45 | 0.0317 * | 0.0507 |
| Free androgen index | 0.57 | 0.0042 ** | 0.0224 * |
Publisher’s Note: MDPI stays neutral with regard to jurisdictional claims in published maps and institutional affiliations. |
© 2022 by the authors. Licensee MDPI, Basel, Switzerland. This article is an open access article distributed under the terms and conditions of the Creative Commons Attribution (CC BY) license (https://creativecommons.org/licenses/by/4.0/).
Share and Cite
Hofbauer, J.; Hauck, A.; Matos, C.; Babl, N.; Decking, S.-M.; Rechenmacher, M.; Schulz, C.; Regotta, S.; Mickler, M.; Haferkamp, S.; et al. Immunometabolic Markers in a Small Patient Cohort Undergoing Immunotherapy. Biomolecules 2022, 12, 716. https://0-doi-org.brum.beds.ac.uk/10.3390/biom12050716
Hofbauer J, Hauck A, Matos C, Babl N, Decking S-M, Rechenmacher M, Schulz C, Regotta S, Mickler M, Haferkamp S, et al. Immunometabolic Markers in a Small Patient Cohort Undergoing Immunotherapy. Biomolecules. 2022; 12(5):716. https://0-doi-org.brum.beds.ac.uk/10.3390/biom12050716
Chicago/Turabian StyleHofbauer, Joshua, Andreas Hauck, Carina Matos, Nathalie Babl, Sonja-Maria Decking, Michael Rechenmacher, Christian Schulz, Sabine Regotta, Marion Mickler, Sebastian Haferkamp, and et al. 2022. "Immunometabolic Markers in a Small Patient Cohort Undergoing Immunotherapy" Biomolecules 12, no. 5: 716. https://0-doi-org.brum.beds.ac.uk/10.3390/biom12050716