Article

Curcuma raktakanda Induces Apoptosis and Suppresses Migration in Cancer Cells: Role of Reactive Oxygen Species

1
Laboratory for Translational Cancer Research, Department of Biochemistry, Institute of Science, Banaras Hindu University, Varanasi-221 005, India
2
CSIR-National Institute for Interdisciplinary Science and Technology, Chemical Science and Technology Division, Organic Chemistry Section, Trivandrum-695019, India
*
Author to whom correspondence should be addressed.
Submission received: 20 March 2019 / Revised: 8 April 2019 / Accepted: 12 April 2019 / Published: 23 April 2019
(This article belongs to the Special Issue Antitumor Agents from Natural Sources)

Abstract

:
Although over 100 species of Curcuma are reported, only Curcuma longa is extensively studied. Curcuma raktakanda, a poorly studied species, is most commonly distributed in the Kerala state of India. For the first time, we examined the efficacy of different fractions (acetone, hexane, and ethyl acetate) of C. raktakanda against glioma, cervical, and breast cancer cell lines. As determined by mitochondrial reductase activity assay, the viability of cancer cells was decreased in a concentration-dependent manner by the three fractions. The half maximal inhibitory concentration (IC-50) values after the treatment of C-6 glioma cells for 48 h was found to be 32.97 µg/mL (acetone extract), 40.63 µg/mL (hexane extract), and 51.65 µg/mL (ethyl acetate extract). Of the three fractions, the acetone fraction was more effective. The long-term colony formation of cancer cells was significantly suppressed by the acetone fraction. Analyses using DAPI (4′,6-diamidino-2-phenylindole) staining, AO/PI (acridine orange/propidium iodide) staining, DNA laddering, and sub-G1 population revealed that the acetone extract induced apoptosis in glioma cells. The extract induced reactive oxygen species generation and suppressed the expression of cell survival proteins. The migration of cancer cells was also suppressed by the acetone extract. The gas chromatography-mass spectrometry (GC-MS) analysis indicated that tetracontane, dotriacontane, hexatriacontane, pentacosane, hexacosane, and eicosane are the major components in the acetone extract. Collectively, the extract from C. raktakanda exhibited anti-carcinogenic activities in cancer cells. We are exploring whether the phytoconstituents, individually, or collectively contribute to the anti-cancer activities of C. raktakanda.

1. Introduction

Glioblastoma multiforme (GBM, glioblastoma or grade IV glioma) is the most aggressive, invasive, and most common tumor of the central nervous system [1]. These tumors arise from astrocytes of the human brain and show high resistance to currently available therapy. Despite the significant advances in surgery, radiation therapy, and chemotherapy, the prognosis remains poor for glioblastoma with a median survival of 15.4 months after diagnosis [2]. Because of the poor penetration of the blood brain barrier and development of drug resistance, the chemotherapy options for glioblastoma are limited [3,4]. Although some drugs such as temozolomide have been approved, glioblastoma remains highly incurable [5]. The implication of these reports necessitates the development of novel therapy that can be used either as a single agent or as an adjuvant for glioblastoma therapy.
The natural products have been used for the treatment of several illnesses including cancer since ancient times. Globally, 80% of the human population are estimated to rely on plant-derived medicines for their health care needs [6]. Further, 49% of the small molecules approved for cancer therapy between 1940 and 2014 had originated from nature [6,7]. Plant derived medicines have played a pivotal role in the healthcare of both ancient and modern society [8,9,10,11]. Paclitaxel (taxol), is one of the success stories for the use of agents derived from natural sources in cancer therapy. Originally isolated from the bark of the Pacific yew tree in 1971, this antimitotic agent has been reported to be effective against several cancer types including breast, ovarian, pancreatic, and non-small cell lung cancer [12,13,14]. Because of multitargeting, low cost, safety, and ease of availability, interest in natural products for cancer therapy continues to grow.
The genus Curcuma (family Zingiberaceae) is one of the widely studied medicinal plants, the extract and constituents of which have demonstrated anti-cancer activities. Although as many as 133 species have been identified from this genus, only Curcuma longa, the golden spice turmeric, is being extensively studied. Curcumin, a minor but the most active component of turmeric, is reported to exhibit activities both in animal models and in humans [15,16,17,18]. Recent studies suggest that some species of curcuma are as active or even more active than C. longa. For example, the rhizomes of C. phaeocaulis is reported to exhibit better anti-inflammatory activity compared to C. longa [19].
However, studies on the anti-cancer activities of species other than C. longa are very few. Curcuma raktakanda is one such poorly studied species, which is widely distributed in the Kerala state of India [20]. One study examined the effects of C. raktakanda extracts (leaves and tuber) on the early fourth instar larvae of four mosquito species (Aedes aegypti, Anopheles stephensi, Culex quinquefasciatus, and Culex sitiens). The petroleum ether extract (leaves and tuber) induced toxicity in all the tested mosquito species [20]. However, the active constituent from the extract responsible for the larvicidal activities was not examined. Whether the extract and the constituents from C. raktakanda exhibit anti-cancer activity has not been reported previously. However, non-cancer drugs such as antibiotics, antiepileptics, anesthetics, and cardioprotectives have been successfully explored for anti-cancer activities [21].
Because glioblastoma, like other cancer types, is a multigenic disease, the current paradigm for the therapy is either to combine multiple mono-targeted agents or to design a molecule that can target multiple pathways. Since, the extract is a mixture of several components, we sought to investigate the efficacy of C. raktakanda extract against glioblastoma. Additionally, we examined the efficacy of the extract against breast cancer and cervical cancer. The results to be discussed suggest that the C. raktakanda extract suppresses the viability of wide variety of cancer cells. Furthermore, the extract induces apoptosis and suppresses the migration of cancer cells.

2. Material and Methods

2.1. Plant Extract

The three extracts (hexane, ethyl acetate, and acetone) were obtained from the rhizome of C. raktakanda. The extraction was done in collaboration with Dr. Maiti from NIIST (CSIR) Trivandrum, India. Curcuma raktakanda rhizomes were collected from the Jawaharlal Nehru Tropical Botanical Garden and Research Institute (JNTBGRI) and the Medicinal Plant Garden Thiruvananthapuram in February 2014. In brief, the rhizomes were thoroughly cleaned, dried at 40 °C for three days, powdered, and approximately 500 g was weighed out for further processing. The extraction was carried out from the powdered material in a successive manner using hexane (1.5 L), ethyl acetate (1.5 L), and acetone (1.5 L). The extraction was performed three times with each solvent at room temperature. Finally, Buchi rotary evaporator (Mumbai, Maharashtra, India)was used to concentrate the extract under reduced pressure. The total yield was found to be around 30g (hexane extract), 25g (ethyl acetate extract), and 25g (acetone extract).

2.2. Reagents

Dulbecco’s modified eagle medium (DMEM), Roswell Park Memorial Institute 1640 (RPMI-1640), penicillin, streptomycin, and trypsin-EDTA (ethylenediaminetetraacetic acid) were procured from Himedia (Mumbai, Maharashtra, India). Crystal violet, dimethyl sulfoxide (DMSO), and 3-[4,5-dimethylthiazol-2-yl]-2,5-diphenyl tetrazolium bromide (MTT) were obtained from SRL Diagnostics (Mumbai, Maharashtra, India). The 2′,7′-dichlorodihydrofluorescein diacetate (H2DCFDA), 4′,6-diamidino-2-phenylindole (DAPI), 5,5′,6,6′-Tetrachloro-1,1′,3,3′-tetraethyl benzimidazolyl carbocyanineiodide (JC-1), acridine orange, agarose, alexa fluor 488, ethidium bromide, fetal bovine serum (FBS), and propidium iodide were obtained from Invitrogen (Carlsbad, CA, USA). Bcl-xL antibody was obtained from Santa Cruz Biotechnology (Santa Cruz, CA, USA) while GAPDH (glyceraldehyde-3-phosphate dehydrogenase) was obtained from Abgenex (Bhubaneswar, Odisha, India).

2.3. Cell Lines

The human breast (MDA-MB-231, MCF-7), cervical (HeLa), and rat glioma (C-6) cell lines were obtained from the National Centre for Cell Science (NCCS), Pune, India. MDA-MB-231, MCF-7, and HeLa cells were cultured in high glucose DMEM, while RPMI-1640 was used for C-6 cells. The FBS (10%), penicillin (100 units/mL), and streptomycin (100 µg/mL) were used to supplement the media.

2.4. Assay for Cell Viability

The mitochondrial reductase activity was measured to determine the effect of extracts on the viability of cancer cells using MTT as a substrate [22]. The cytotoxic potential of chemotherapeutic agents was also examined using the same assay. The cells were seeded in different wells of 96 well plate (10,000/well) and treated with different concentrations of extract for 48 h. The formation of purple formazan was measured for examining the cell viability.

2.5. Assay for Colony Formation

The ability of a single cell to grow into a colony was examined by clonogenic assay, which is an in vitro cell survival assay. We used a method described previously with minor modifications [23]. For this, approximately 1000 cells were seeded per well and treated with different concentrations of the acetone extract for 6 h. The cells were washed, and the colony formation was measured after 6–7 days. Finally, the colonies were stained with 0.1% crystal violet and counted manually.

2.6. Assay for DNA Laddering

DNA laddering is a distinctive feature during the late stages of apoptosis. The assay was performed using a method described earlier [24]. The cells were treated with acetone extract (25–50 µg/mL) for 24 h followed by washing and lysis in a buffer containing 5 mM EDTA, 5M NaCl, 100 mM Tris-HCl (pH 8.5), and 10% sodium dodecyl sulfate (SDS). The deproteinization was then carried out with proteinase K (20 mg/mL) at 55 °C for 2 h. The deproteinized lysate was mixed with an equal volume of chloroform and centrifuged at 12,000 rpm for 15 min at 4 °C. Subsequently, an equal volume of isopropanol was added, and the DNA was pelleted at 12,000 rpm for 20 min. The DNA was then washed with 70% ethanol, air dried, dissolved in tris-EDTA buffer, and electrophoresed on 1.2% agarose gel containing ethidium bromide. Finally, the electrophoresed DNA was visualized and photographed in a gel documentation system (BioRad Gel Doc XR+, Hercules, CA, USA).

2.7. Assay for Nuclear Morphology

To examine the effects of the extracts on the nuclear morphology, DAPI staining was performed [22]. C-6 glioma cells were treated with the acetone extract (1–50 µg/mL) for 24 h. The cells were then washed with PBS, fixed with paraformaldehyde (4%), permeabilized with methanol, and stained with DAPI. The morphology of the nucleus was examined under the fluorescence microscope and the images were captured.

2.8. Assay for Cell Viability by Staining with Acridine Orange/Propidium Iodide

In order to examine cell viability accurately, we performed AO/PI staining. C-6 cells were treated with the acetone extract (1–50 µg/mL). After 24 h, the cells were washed with PBS, stained with AO/PI, and visualized under the fluorescence microscope.

2.9. Assay for Sub-G1 Population

We stained the cells with propidium iodide (PI) to examine the effects of the acetone extract on the sub-G1 population by flow cytometry [25]. The C-6 glioma cells were treated with acetone extract for 24 h. After washing with PBS, the cells were fixed with 70% chilled methanol, treated with RNaseA, and stained with PI. The FACScan was used to determine the sub-G1 population and the analysis was performed by Cell Quest software (Becton Dickinson, San Jose, CA, USA).

2.10. Assay for Mitochondrial Membrane Potential (ΔΨ)

To examine the effects of acetone extract on the mitochondrial membrane potential, we used a fluorochrome JC-1 as reported earlier [26]. Briefly, the control and treated cells were stained with JC-1 (10 μg/mL), washed, and imaged first under red filter and then under green filter. While the green fluorescence indicated the cells with depolarized mitochondria, red fluorescence indicated cells with intact mitochondria.

2.11. Assay for Protein Expression

Whether the acetone extract affects the expression of cell survival proteins was examined by western blot analysis [27]. The whole cell lysate, from normal and treated cells, were electrophoresed on SDS-PAGE (sodium dodecyl sulfate–polyacrylamide gel electrophoresis) and transferred onto polyvinylidene difluoride (PVDF) membrane. The membrane containing the transferred proteins were first probed with the primary antibody, then with the horseradish peroxidase (HRP) conjugated secondary antibody, and finally detected using enhanced chemiluminescence (ECL) reagent.

2.12. Assay for Cell Migration

To examine the effects of the acetone extract on cell migration, we used a wound healing assay. In brief, C-6 glioma cells were seeded into a culture dish and allowed to grow to 70% confluency. A wound was introduced into the monolayers using a sterile tip and washed to remove the cell debris. The cells were then allowed to grow in the culture media with or without the acetone extract. After 0, 12, and 24 h of treatment with acetone extract, the wound area was examined under the phase contrast microscope.

2.13. Assay for Reactive Oxygen Species Generation

Whether the acetone extract has the potential to generate reactive oxygen species (ROS) in the C-6 glioma cells was examined by flow cytometry [28]. Cells were treated with acetone extract (1–30 µg/mL) for 1 h. After the termination of the treatment time, cells were washed and stained with 10 µM 2′,7′-dichlorofluorescin diacetate (H2DCFDA) for 15 min in the dark. The stained cells were examined under fluorescence microscope and also by flow cytometry using FACScan. The analysis of flow cytometry data was carried out using Cell Quest software (Becton Dickinson, San Jose, CA, USA).

2.14. Gas Chromatography-Mass Spectrometry

Shimadzu Make GC-MS-TQ-8030 instrument (Tokyo, Japan) was used for the gas chromatography-mass spectrometry (GC-MS) analyses of different fractions of Curcuma raktaknda (hexane extract, ethyl acetate extract, and acetone extract). The compounds were separated using nonpolar Rxi 5 Sil MS capillary column in full scan mode with injector mode-splitless and quadra pole mass selective detector (MSD). The injection temperature was set at 250 °C while GC-MS interface temperature at 250 °C. An aliquot of 1 μL volume was injected into the column. Helium was used as a carrier gas (pressure: 57.5 KPa, flow rate: 1 mL/min). Mass spectra were detected at 70 eV. The temperature programming was set as follows: column temperature was started from 60 °C (held for 2 min) and linearly increased by 5 °C/min to 200 °C (held for 2 min); after that it was increased by 3 °C/min to 220 °C (held for 1 min); further it was increased by 6 °C/min to 250 °C (held for 7 min). Total GC running time was 51.67 min. The compounds were identified by comparing mass spectra of each peak with NIST5 and WILEY libraries.

3. Results

The overall goal of this study was to examine the anti-cancer potential of the extract from C. raktakanda that has demonstrated larvicidal activities. Most of the experiments were performed using C-6 glioma cell lines. We also used breast (MDA-MB-231, MCF-7) and cervical (HeLa) cancer cell lines to determine the specificity of the extract. The underlying mechanism and the potential components from the extract were also examined.

3.1. Curcuma raktakanda Suppresses Viability and Reduces Long-Term Colony Formation of Glioma Cells

We used three different extracts (acetone, hexane, and ethylacetate) from the rhizomes of C. raktakanda. The cytotoxic potential of the extract was examined by measuring mitochondrial reductase activity using MTT as the substrate. We observed that the viability of C-6 glioma cells was suppressed by the three extracts in a concentration dependent manner (Figure 1A). However, the acetone extract was more effective when compared to the hexane and ethyl acetate extracts. For example, at a concentration of 25 µg/mL, 39% suppression in the viability was observed by the acetone extract. However, 7% suppression in the viability was observed by both hexane and ethyl acetate extracts. Furthermore, the half maximal inhibition (IC-50) values after treatment of C-6 cells for 48 h was found to be 32.97 µg/mL (acetone extract), 40.63 µg/mL (hexane extract), and 51.65 µg/mL (ethyl acetate extract). Therefore, we used the acetone extract (AE) for most experiments. Under similar experimental conditions, cisplatin and imatinib (positive controls) suppressed the viability of C-6 cells in a dose dependent manner (Figure 1B).
Next, we examined the colony forming ability of C-6 glioma cells without and with AE treatment. Cells were exposed to 4, 8, 16, 32, and 64 µg/mL AE for 6 h. Cells were then washed and allowed to form colonies for 7 days. The extract significantly suppressed the number of colonies at a concentration as low as 16 µg/mL (Figure 1C). At 64 µg/mL, almost no colonies were observed.

3.2. Acetone Extract induces Apoptosis in Glioma Cells

Apoptosis, a process of programmed cell death, is a normal physiological process. However, cancer cells have developed mechanisms to evade apoptosis. The induction of apoptosis selectively in cancer cells is one of the potential strategies of cancer therapy. Numerous assays were performed to examine the apoptosis inducing potential of AE. First, we examined the changes in the morphology of the cells by AO/PI dual staining. While AO can enter both live and dead cells, PI enters only dead cells with compromised mitochondria. Acridine orange stains all nucleated cells to generate green fluorescence. Propidium iodide stains dead nucleated cells to generate red fluorescence. Thus, the live nucleated cells produce green fluorescence, while dead nucleated cells produce red fluorescence. An increase in the concentration of AE was associated with a significant decrease in the number of viable cells. At a concentration as low as 10 µg/mL, features of early apoptosis such as membrane blebbing and nuclear condensation were observed after 24 h of treatment (Figure 2A). To confirm the observations obtained by AO/PI staining, we stained the control and treated cells with DAPI. A normal, oval, and round shaped nuclei was observed in control cells (Figure 2B). However, AE treated cells exhibited nuclear fragmentation and chromatin condensation (Figure 2B). One hallmark of late apoptosis is the cleavage of genomic DNA into oligonucleosomal fragments. Degraded DNA can be visualized by agarose gel electrophoresis. While the DNA from control cells was intact, DNA smear was observed from AE treated cells (Figure 2C). Cancer cells, including glioma, have evolved mechanism to survive. The suppression of Bcl-xL expression is one potential strategy to induce apoptosis in cancer cells. Whether AE can modulate Bcl-xL expression in C-6 glioma cells was examined by western blot analysis. While Bcl-xL was abundant in control cells, AE induced a concentration dependent decrease in the expression of Bcl-xL after 24 h of treatment (Figure 2D). Overall, these results suggest the apoptosis inducing potential of AE in C-6 glioma cells.

3.3. Acetone Extract Induces Cell Cycle Arrest and Lowers Mitochondrial Membrane Potential in Glioma Cells

Next, we examined the sub-G1 population in the cells treated with or without AE. The treatment of C-6 cells with AE was associated with a modest increase in sub-G1 population (Figure 3A). One hallmark of early apoptosis is an irreversible reduction in mitochondrial membrane potential (MMP). At high MMP, JC-1 dye aggregates and produces red to orange colored fluorescence. JC-1 dye exists in monomeric form and produces green fluorescence at low MMP. In control glioma cells, red fluorescence was observed (Figure 3B, upper). In treated cells, an increase in green fluorescence was observed by increasing the concentration of AE (Figure 3B, lower). However, the red stained cells were decreased with an increase of AE concentration (Figure 3B, lower). Similarly, a concentration dependent decrease in the ratio of red/green intensity was observed with an increase of AE concentration. These observations suggest that the mitochondria are involved in the induction of apoptosis by AE in C-6 glioma cells.

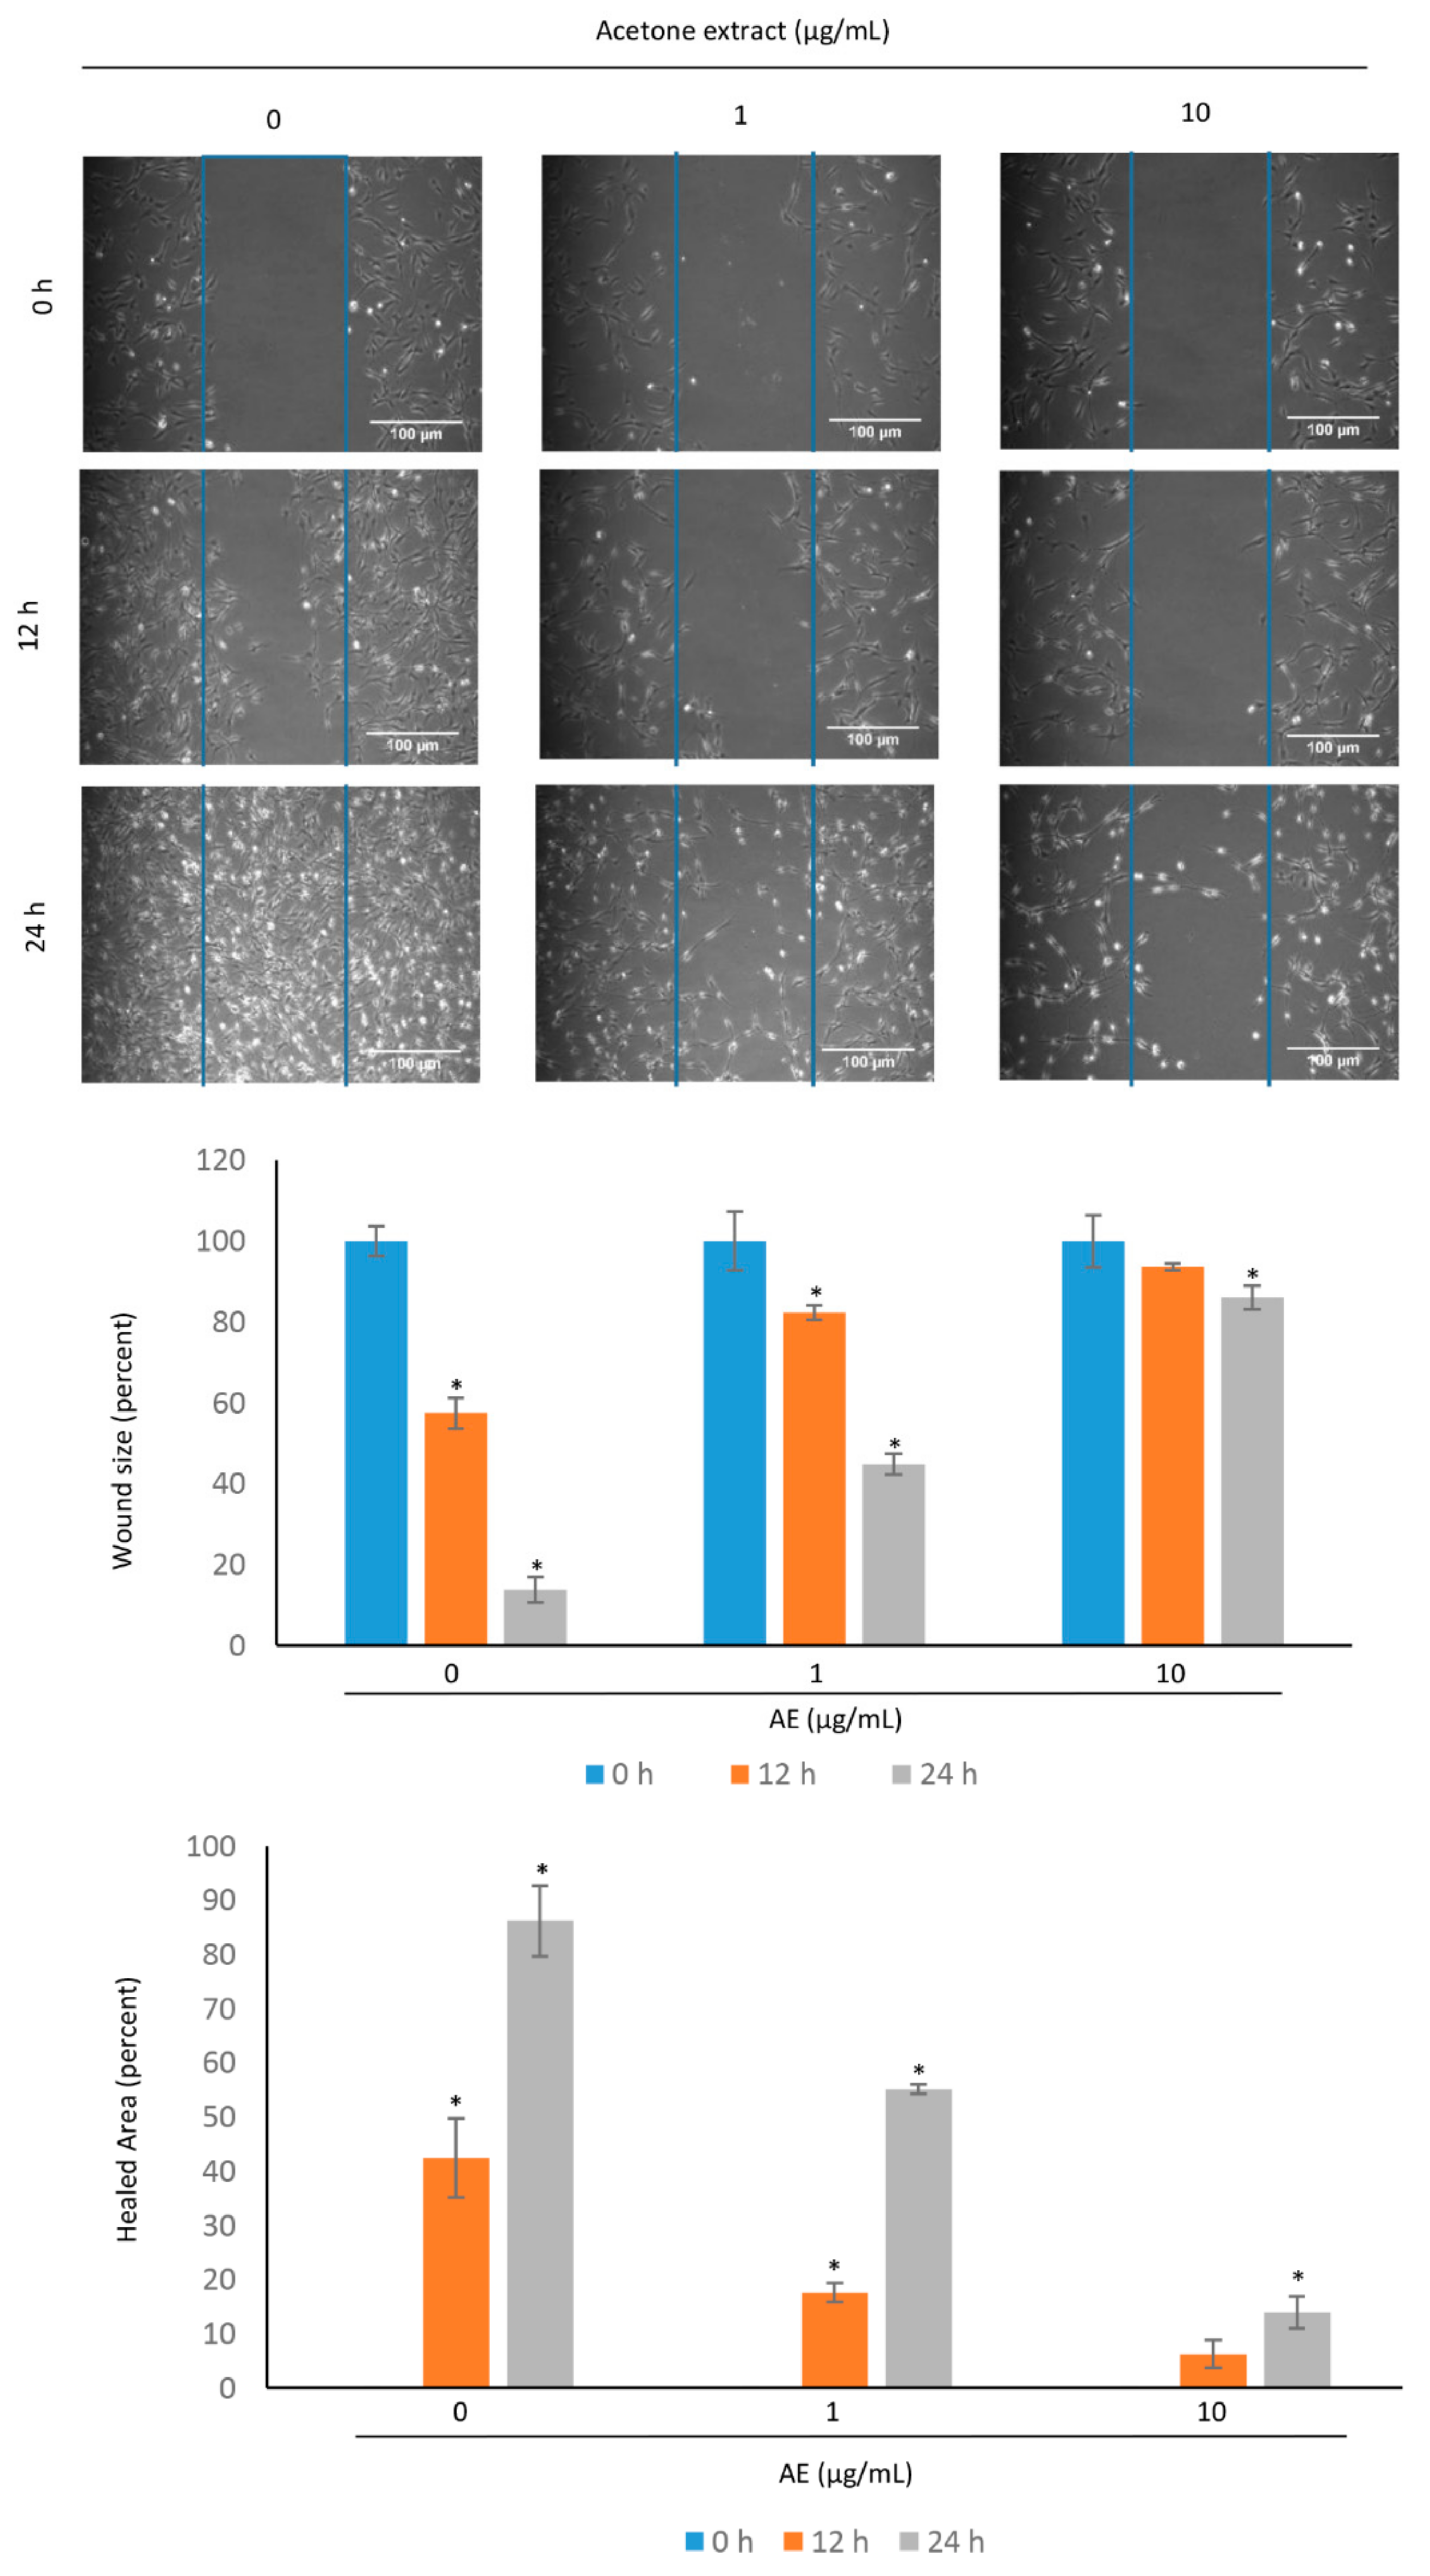
3.4. Acetone Extract Suppresses the Migration of Glioma Cells

The glioma is characterized by local invasion. Before invasion, cells are detached from the primary tumor and migrate to the surrounding normal brain tissue. C-6 cells were exposed to different concentrations of AE (1, 10 µg/mL) and the migration of the cells was examined in the normal and treated cells after 12 h and 24 h (Figure 4). In control cells, the wound area was occupied by migrated cells with an increase of time. However, less cells were migrated to the wound area in the group treated with AE extract. Similarly, there was a significant increase in the healed area over time in the control cells. The increase in the healed area in the treated cells was less as compared to that observed in the control cells. These results suggest that the AE suppresses the migration of glioma cells. However, the migration of C-6 glioma cells were minimally affected by 1 µg/mL AE.

3.5. Acetone Extract Induces Reactive Oxygen Species Generation in Glioma Cells

Cancer cells have the inherent property of increased ROS generation that can be exploited to induce ROS selectively. Next, we examined the potential of AE on ROS generation in C-6 glioma cells. The cells were exposed to different concentrations of AE for 1 h and stained with H2DCFDA. The ROS generation was measured by flow cytometry and also by fluorescence microscopy. The ROS generation in control and in 5 µg/mL AE treated cells was minimal (Figure 5). However, an increase in ROS generation was observed with an increase in AE concentration. For example, a respective 1.6-fold and 1.7-fold increase in ROS generation was observed at 10 µg/mL and 20 µg/mL AE, respectively.

3.6. Curcuma raktakanda Reduces the Viability of Breast and Cervical Cancer Cells

Next, we examined the cytotoxic activities of C. raktakanda in cancer cells other than glioma. For this, we used breast (MDA-MB-231, MCF-7) and cervical (HeLa) cancer cell lines. Cells were exposed to different extracts of C. raktakanda and proliferation was examined by MTT assay. The three extracts suppressed the proliferation of cancer cells in a concentration dependent manner (Figure 6). However, the cancer cells exhibited varied degrees of sensitivity to the extracts. For example, at lower concentrations (0.1–50 µg/mL), acetone extract was more effective compared to hexane and ethyl acetate extracts in MCF-7 cells. However, at the highest tested concentration (100 µg/mL) of the hexane extract was more effective. In MDA-MB-231 cells, the ethyl acetate extract was relatively more effective compared to the acetone and hexane extracts. In HeLa cells, acetone extract was more effective compared to the other two extracts. Overall, these results suggest that the cancer cells differ in their sensitivity to the C. raktakanda.

3.7. Gas Chromatography-Mass Spectrometry Analysis of Curcuma raktakanda Rhizome Fractions

A previous study demonstrated the larvicidal activity of C. raktakanda [20]. However, the phytoconstituents of this plant have not been analyzed. Finally, we analyzed the phytoconstituents of three extracts by GC-MS. The identification and interpretation of GC-MS data was accomplished using the data from National Institute Standard and Technology (Gaithersburg, MD, USA). A respective 26, 21, and 30 peaks were obtained from acetone, hexane, and the ethyl acetate fraction, respectively (Table 1, Table 2 and Table 3). The major compounds in hexane fractions were: beta-Elemenone (16.84%), Cycloprop[e]indene-1a,2(1H)-dicarboxaldehyde,3a,4,5,6,6a,6b-hexahydro-5,5,6b-trimethyl (1a.alpha.,3a.beta.,6a.beta.,6b.alpha) (10.49%), Alloaromadendreneoxide-(1) (8.47%), and 5,8-dihydroxy-4a-methyl-4,4a,4b,5,6,7,8,8a,9,10-decahydro-2(3H)-phenanthrenone (8.33%). The ethyl acetate fraction contained mainly 2-phosphabicyclo[3.1.0]hex-3-ene, 6,6-dimethyl-2,3,4-triphenyl-, (endo)- (16%), desmethylnomifensine (12.6%), 1,1,6-trimethyl-3-methylene-2-(3,6,9,13-tetramethyl-6-ethenye-10,14-dimethylene-pentadec-4-enyl) cyclohexane (9.48%), and cobalt, hexamethylbenzene-pentamethylcyclopentadienyl (8.67%). The major components in the acetone fraction were reported to be tetracontane (38.53%), (-)-(1R,2R,4aS,8aS)-1-(2-hydroxyethyl)-2,5,5,8a-tetramethyldecahydro-2-naphthalenol (9.10%) and dotriacontane (6.16%).

4. Discussion

Although much has been published on the golden spice, turmeric (C. longa), very little is known about other Curcuma species. Curcumin, which constitutes 2–5% of turmeric, is one of the most active components [18]. Both curcumin and turmeric are known to modulate a number of cancer related targets by preclinical and clinical studies [16,29]. The genus Curcuma constitutes more than 130 species. Whether C. raktakanda exhibit anti-cancer activities is unknown. Therefore, the focus of the current study was to examine the biological activities of C. raktakanda against glioblastoma cells.
We observed that the three extracts of C. raktakanda exhibited activities against C-6 glioblastoma cell lines. However, the acetone extract was more effective compared to the other two. Further, the acetone extract induced apoptosis and suppressed proliferation of C-6 glioma cells. For the first time, we found that the acetone extract inhibited the expression of cell survival protein Bcl-xL. Glioblastoma cells are known to express high levels of Bcl-xL [30]. The Bcl-xL promotes tumorigenesis partly through the nuclear factor-kappa B/chemokine (C-X-C motif) ligand 8 (NF-κB/CXCL8) mediated angiogenesis [31,32]. Additionally, the survival of several cancer types primarily depends on the Bcl-xL expression [33,34]. The observed inhibitory effects of the extract on tumor cell survival could be due to the suppression of the Bcl-xL expression. The suppression of Bcl-xL expression by the acetone extract may be due to its inhibitory effects on NF-κB activation. The presence of membrane blebbing, nuclear condensation, and accumulation of cells at the sub-G1 phase after treatment with Curcuma raktakanda (CR) extract further supports its negative effects on the survival of C-6 glioblastoma cells.
The main cause of glioblastoma mortality is not the primary tumor but because the tumor invades locally. This leads to the ineffectiveness of current treatment options and recurrence of the tumor. The invasion involves detaching the cells from the primary tumor followed by migration in the surrounding normal brain tissue. In our observations, CR extract was found to suppress the migration of C-6 glioma cells. The process of migration and invasion involved the synthesis of proteases such as metalloproteinases that degrade extracellular-matrix (ECM) components selectively [35]. Whether CR extract modulates these proteases remains to be elucidated.
The extract used in the current study is a mixture of several components. The GC-MS analyses indicated that the three extracts are different in terms of phytochemical constituents. The major component of acetone fraction such as tetracontane, dotriacontane, and hexatriacontane has not been reported to exhibit anti-cancer activities previously. However, minor components of the acetone fraction such as pentacosane and eicosane are reported to exhibit anti-cancer activities. In a previous study, the essential oil from the leaves of Malus domestica containing pentacosane exhibited activities against C-6, A549 (lung carcinoma), CHOK1 (ovarian), and THP-1 (acute monocytic leukemia) cells [36]. Similarly, eicosane (macrolide) produces cytotoxicity both in vitro and in nude mice bearing human ovarian carcinoma cells [37]. Eucalyptol and elemene, identified in the hexane and ethylacetate extracts, are also known to exhibit anti-cancer activities [38,39,40,41]. Whether the components of the extract interact in an additive, synergistic, or antagonistic manner remains to be explored.
We also observed that the CR extract inhibits the viability of not only glioblastoma cells but also breast cancer cells and cervical cancer cells. These observations suggest the broad-spectrum effects of the extract. We observed that AE induces ROS generation in C-6 glioblastoma cells. The role of ROS in the regulation of cancer associated cell signaling pathways is well established [42]. Further, chemotherapeutic agents and nutraceuticals mediate their effects through the production of ROS [43,44]. Implication of all these suggest that ROS act as a double-edged sword during cancer pathogenesis [45]. Whether ROS is required for the anti-cancer activities of the acetone extract remains to be elucidated. The ability of CR extract to disrupt mitochondrial membrane potential suggest that the apoptosis is mediated through the mitochondria.
A previous study demonstrated that the CR extract exhibit larvicidal activities [20]. Thus, our observations provide a possibility that the non-cancer agents such as larvicides could be repurposed for anti-cancer activities. The application of larvicides in cancer therapy may appear unconventional. However, drug repurposing is an emerging novel approach to significantly reduce the time involved in drug development process [46]. Similar to our observation, deltamethrin, deguelin, destruxin, and rotenone type of insecticides have also demonstrated potential against cancer cells [47]. Similarly, rapamycin which was originally developed as a macrolide antibiotic exhibits anti-cancer activities [48]. Minocycline is another antibiotic being tested for its activities against ovarian cancer, glioma, and numerous other cancer types [49].
The development of drug resistance is a major hurdle in the therapy of several cancer types including glioblastoma [50]. Our unpublished observations suggest that the acetone extract can sensitize C-6 cells to doxorubicin at higher concentrations. These observations provide an opportunity that the AE can be used in combination with existing drugs to overcome chemoresistance. Cancer related genes such as NF-κB and cell survival proteins are involved in the development of drug resistance [51]. A possibility that the suppression in Bcl-xL expression by AE sensitizes cancer cells to doxorubicin cannot be ruled out. Whether AE modulate NF-κB activation remains to be elucidated.
In conclusion, our observations suggest that the rhizome extract from C. raktakanda exhibit anti-carcinogenic activities. The components from the extract responsible for all these activities remains to be elucidated. The generation of ROS by the extract may contribute to its anti-cancer activities. Our observations are important as very little is known about this plant. One limitation of the current study is that the actual component of the extract responsible for the observed anticancer effects is not known. However, with several components, the mixture can target multiple glioblastoma associated pathways. This may offer an advantage as the glioblastoma is caused by dysregulation of multiple genes and thus multi-targeting approach is required. We are currently working on the constituents and the underlying mechanism by which this plant exhibits broad-spectrum anti-cancer activities.

Author Contributions

Conceptualization: K.K.M. and S.C.G.; methodology: S.M., S.S.V., V.R., N.A. and J.S.A.; validation: S.M. and J.S.A.; formal analysis: S.M., S.S.V., J.S.A., K.K.M. and S.C.G.; data curation: S.M. and J.S.A.; writing—original draft preparation: S.M. and S.C.G.; writing—review and editing: S.M. and S.C.G.; supervision: K.K.M. and S.C.G.; project administration: S.C.G., funding acquisition: S.M. and S.C.G.

Acknowledgments

The work was financially supported by the grants from Science and Engineering Research Board (ECR/2016/000034), and University Grants Commission [No.F. 30-112/2015 (BSR)]. The financial assistance from ICMR New Delhi to SM (3/1/3/JRF-2016/LS/HRD-65-80388), DBT New Delhi to SSV (DBT/2017/BHU/786), and BHU Varanasi to NA (R/Dev/IX-Sch-BHU Res Sch 2018-19), is thankfully acknowledged. The fluorescence microscopy and flow cytometry facilities were provided by BHU’s Interdisciplinary School of Life Sciences.

Conflicts of Interest

The authors declare no conflict of interest.

References

  1. Louis, D.N.; Perry, A.; Reifenberger, G.; Von Deimling, A.; Figarella-Branger, D.; Cavenee, W.K.; Ohgaki, H.; Wiestler, O.D.; Kleihues, P.; Ellison, D.W. The 2016 World Health Organization classification of tumors of the central nervous system: A summary. Acta Neuropathol. 2016, 131, 803–820. [Google Scholar] [CrossRef]
  2. Shirai, K.; Chakravarti, A. Towards personalized therapy for patients with glioblastoma. Expert Rev. Anticancer. Ther. 2011, 11, 1935–1944. [Google Scholar] [CrossRef]
  3. Greenlee, R.T.; Murray, T.; Bolden, S.; Wingo, P.A. Cancer statistics, 2000. CA Cancer J. Clin. 2000, 50, 7–33. [Google Scholar] [CrossRef] [PubMed]
  4. Régina, A.; Demeule, M.; Laplante, A.; Jodoin, J.; Dagenais, C.; Berthelet, F.; Moghrabi, A.; Béliveau, R. Multidrug resistance in brain tumors: Roles of the blood–brain barrier. Cancer Metastasis Rev. 2001, 20, 13–25. [Google Scholar] [CrossRef]
  5. Mirimanoff, R.-O.; Gorlia, T.; Mason, W.; Van den Bent, M.J.; Kortmann, R.-D.; Fisher, B.; Reni, M.; Brandes, A.A.; Curschmann, J.; Villa, S. Radiotherapy and temozolomide for newly diagnosed glioblastoma: Recursive partitioning analysis of the EORTC 26981/22981-NCIC CE3 phase III randomized trial. J. Clin. Oncol. 2006, 24, 2563–2569. [Google Scholar] [CrossRef] [PubMed]
  6. Fulda, S. Evasion of apoptosis as a cellular stress response in cancer. Int. J. Cell Biol. 2010, 2010. [Google Scholar] [CrossRef]
  7. Newman, D.J.; Cragg, G.M. Natural products as sources of new drugs from 1981 to 2014. J. Nat. Prod. 2016, 79, 629–661. [Google Scholar] [CrossRef]
  8. Newman, D.J.; Cragg, G.M.; Snader, K.M. Natural products as sources of new drugs over the period 1981–2002. J. Nat. Prod. 2003, 66, 1022–1037. [Google Scholar] [CrossRef] [PubMed]
  9. Butler, M.S. The role of natural product chemistry in drug discovery. J. Nat. Prod. 2004, 67, 2141–2153. [Google Scholar] [CrossRef] [PubMed]
  10. Balunas, M.J.; Kinghorn, A.D. Drug discovery from medicinal plants. Life Sci. 2005, 78, 431–441. [Google Scholar] [CrossRef]
  11. Gurib-Fakim, A. Medicinal plants: Traditions of yesterday and drugs of tomorrow. Mol. Asp. Med. 2006, 27, 1–93. [Google Scholar] [CrossRef]
  12. Wani, M.C.; Horwitz, S.B. Nature as a remarkable chemist: A personal story of the discovery and development of Taxol. Anti-Cancer Drugs 2014, 25, 482–487. [Google Scholar] [CrossRef] [PubMed]
  13. Holmes, F.A.; Walters, R.S.; Theriault, R.L.; Buzdar, A.U.; Frye, D.K.; Hortobagyi, G.N.; Forman, A.D.; Newton, L.K.; Raber, M.N. Phase II trial of taxol, an active drug in the treatment of metastatic breast cancer. J. Natl. Cancer Inst. 1991, 83, 1797–1805. [Google Scholar] [CrossRef]
  14. McGuire, W.P.; Rowinsky, E.K.; Rosenshein, N.B.; Grumbine, F.C.; Ettinger, D.S.; Armstrong, D.K.; Donehower, R.C. Taxol: A unique antineoplastic agent with significant activity in advanced ovarian epithelial neoplasms. Ann. Intern. Med. 1989, 111, 273–279. [Google Scholar] [CrossRef] [PubMed]
  15. Datta, S.; Misra, S.K.; Saha, M.L.; Lahiri, N.; Louie, J.; Pan, D.; Stang, P.J. Orthogonal self-assembly of an organoplatinum (II) metallacycle and cucurbit [8] uril that delivers curcumin to cancer cells. Proc. Natl. Acad. Sci. USA 2018, 115, 8087–8092. [Google Scholar] [CrossRef]
  16. Banerjee, S.; Ji, C.; Mayfield, J.E.; Goel, A.; Xiao, J.; Dixon, J.E.; Guo, X. Ancient drug curcumin impedes 26S proteasome activity by direct inhibition of dual-specificity tyrosine-regulated kinase 2. Proc. Natl. Acad. Sci. USA 2018, 115, 8155–8160. [Google Scholar] [CrossRef]
  17. Gupta, S.C.; Patchva, S.; Koh, W.; Aggarwal, B.B. Discovery of curcumin, a component of golden spice, and its miraculous biological activities. Clin. Exp. Pharmacol. Physiol. 2012, 39, 283–299. [Google Scholar] [CrossRef] [PubMed]
  18. Gupta, S.C.; Sung, B.; Kim, J.H.; Prasad, S.; Li, S.; Aggarwal, B.B. Multitargeting by turmeric, the golden spice: From kitchen to clinic. Mol. Nutr. Food Res. 2013, 57, 1510–1528. [Google Scholar] [CrossRef] [PubMed]
  19. Tohda, C.; Nakayama, N.; Hatanaka, F.; Komatsu, K. Comparison of anti-inflammatory activities of six Curcuma rhizomes: A possible curcuminoid-independent pathway mediated by Curcuma phaeocaulis extract. Evid.-Based Complementary Altern. Med. 2006, 3, 255–260. [Google Scholar] [CrossRef]
  20. Latha, C.; Ammini, J. Curcuma raktakanda is a potential larvicide for mosquito control. Pharm. Biol. 2000, 38, 167–170. [Google Scholar] [CrossRef]
  21. Gupta, S.C.; Sung, B.; Prasad, S.; Webb, L.J.; Aggarwal, B.B. Cancer drug discovery by repurposing: Teaching new tricks to old dogs. Trends Pharmacol. Sci. 2013, 34, 508–517. [Google Scholar] [CrossRef]
  22. Awasthee, N.; Rai, V.; Verma, S.S.; Francis, K.S.; Nair, M.S.; Gupta, S.C. Anti-cancer activities of Bharangin against breast cancer: Evidence for the role of NF-κB and lncRNAs. Biochim. Biophys. Acta (BBA)-Gen. Subj. 2018, 1862, 2738–2749. [Google Scholar] [CrossRef]
  23. Gupta, S.C.; Prasad, S.; Sethumadhavan, D.R.; Nair, M.S.; Mo, Y.-Y.; Aggarwal, B.B. Nimbolide, a limonoid triterpene, inhibits growth of human colorectal cancer xenografts by suppressing the proinflammatory microenvironment. Clin. Cancer Res. 2013, 19, 4465–4476. [Google Scholar] [CrossRef]
  24. Herrmann, M.; Lorenz, H.; Voll, R.; Grünke, M.; Woith, W.; Kalden, J. A rapid and simple method for the isolation of apoptotic DNA fragments. Nucleic Acids Res. 1994, 22, 5506. [Google Scholar] [CrossRef]
  25. Gupta, S.C.; Nair, M.S.; Mo, Y.-Y.; Aggarwal, B.B. Azadirone, a Limonoid Tetranortriterpene, Induces Death Receptors and Sensitizes Human Cancer Cells to TRAIL through a p53-Independent Mechanism: Evidence for the Role of the ROS-ERK-CHOP-Death Receptor Pathway. J. Biol. Chem. 2013, 288, 32343–32356. [Google Scholar] [CrossRef]
  26. Bognar, Z.; Fekete, K.; Antus, C.; Hocsak, E.; Bognar, R.; Tapodi, A.; Boronkai, A.; Farkas, N.; Gallyas Jr, F.; Sumegi, B. Desethylamiodarone—A metabolite of amiodarone—Induces apoptosis on T24 human bladder cancer cells via multiple pathways. PLoS ONE 2017, 12, e0189470. [Google Scholar] [CrossRef]
  27. Gupta, S.; Singh, R.; Asters, M.; Liu, J.; Zhang, X.; Pabbidi, M.; Watabe, K.; Mo, Y. Regulation of breast tumorigenesis through acid sensors. Oncogene 2016, 35, 4102. [Google Scholar] [CrossRef]
  28. Gupta, S.C.; Singh, R.; Pochampally, R.; Watabe, K.; Mo, Y.-Y. Acidosis promotes invasiveness of breast cancer cells through ROS-AKT-NF-κB pathway. Oncotarget 2014, 5, 12070. [Google Scholar] [CrossRef]
  29. Omoregie, S.N.; Omoruyi, F.O.; Wright, V.F.; Jones, L.; Zimba, P.V. Antiproliferative activities of lesser galangal (Alpinia officinarum Hance Jam1), turmeric (Curcuma longa L.), and ginger (Zingiber officinale Rosc.) against acute monocytic leukemia. J. Med. Food 2013, 16, 647–655. [Google Scholar] [CrossRef]
  30. Trisciuoglio, D.; Tupone, M.G.; Desideri, M.; Martile, M.; Gabellini, C.; Buglioni, S.; Pallocca, M.; Alessandrini, G.; D’Aguanno, S.; Bufalo, D. BCL-X L overexpression promotes tumor progression-associated properties. Cell Death Dis. 2017, 8, 3216. [Google Scholar] [CrossRef]
  31. Gabellini, C.; Gómez-Abenza, E.; Ibáñez-Molero, S.; Tupone, M.G.; Pérez-Oliva, A.B.; de Oliveira, S.; Del Bufalo, D.; Mulero, V. Interleukin 8 mediates bcl-xL-induced enhancement of human melanoma cell dissemination and angiogenesis in a zebrafish xenograft model. Int. J. Cancer 2018, 142, 584–596. [Google Scholar] [CrossRef]
  32. Khoshnan, A.; Tindell, C.; Laux, I.; Bae, D.; Bennett, B.; Nel, A.E. The NF-κB cascade is important in Bcl-xL expression and for the anti-apoptotic effects of the CD28 receptor in primary human CD4+ lymphocytes. J. Immunol. 2000, 165, 1743–1754. [Google Scholar] [CrossRef]
  33. Choi, S.; Chen, Z.; Tang, L.H.; Fang, Y.; Shin, S.J.; Panarelli, N.C.; Chen, Y.-T.; Li, Y.; Jiang, X.; Du, Y.-C.N. Bcl-xL promotes metastasis independent of its anti-apoptotic activity. Nat. Commun. 2016, 7, 10384. [Google Scholar] [CrossRef] [PubMed]
  34. Zeuner, A.; Francescangeli, F.; Contavalli, P.; Zapparelli, G.; Apuzzo, T.; Eramo, A.; Baiocchi, M.; De Angelis, M.; Biffoni, M.; Sette, G. Elimination of quiescent/slow-proliferating cancer stem cells by Bcl-X L inhibition in non-small cell lung cancer. Cell Death Differ. 2014, 21, 1877. [Google Scholar] [CrossRef]
  35. Rao, J.S. Molecular mechanisms of glioma invasiveness: The role of proteases. Nat. Rev. Cancer 2003, 3, 489. [Google Scholar] [CrossRef] [PubMed]
  36. Walia, M.; Mann, T.S.; Kumar, D.; Agnihotri, V.K.; Singh, B. Chemical composition and in vitro cytotoxic activity of essential oil of leaves of Malus domestica growing in Western Himalaya (India). Evid.-Based Complementary Altern. Med. 2012, 2012. [Google Scholar] [CrossRef] [PubMed]
  37. Xie, C.-Y.; Zhu, H.; Lin, L.-P.; Miao, Z.-H.; Geng, M.-Y.; Cai, Y.-J.; Chen, Y.; Zhao, H.-J.; Luo, H.-B.; Zhang, X.-W. MFTZ-1, an actinomycetes subspecies–derived antitumor macrolide, functions as a novel topoisomerase II poison. Mol. Cancer Ther. 2007, 6, 3059–3070. [Google Scholar] [CrossRef] [PubMed]
  38. Leighton, X.; Bera, A.; Eidelman, O.; Eklund, M.; Puthillathu, N.; Pollard, H.B.; Srivastava, M. High ANXA7 Potentiates Eucalyptol Toxicity in Hormone-refractory Prostate Cancer. Anticancer Res. 2018, 38, 3831–3842. [Google Scholar] [CrossRef]
  39. Taha, A.M.; Eldahshan, O.A. Chemical characteristics, antimicrobial, and cytotoxic activities of the essential oil of Egyptian Cinnamomum glanduliferum bark. Chem. Biodivers. 2017, 14, e1600443. [Google Scholar] [CrossRef]
  40. Zheng, F.; Tang, Q.; Zheng, X.-h.; Wu, J.; Huang, H.; Zhang, H.; Hann, S.S. Inactivation of Stat3 and crosstalk of miRNA155-5p and FOXO3a contribute to the induction of IGFBP1 expression by beta-elemene in human lung cancer. Exp. Mol. Med. 2018, 50, 121. [Google Scholar] [CrossRef]
  41. Chang, Z.; Gao, M.; Zhang, W.; Song, L.; Jia, Y.; Qin, Y. Beta-elemene treatment is associated with improved outcomes of patients with esophageal squamous cell carcinoma. Surg. Oncol. 2017, 26, 333–337. [Google Scholar] [CrossRef]
  42. Dickinson, B.C.; Chang, C.J. Chemistry and biology of reactive oxygen species in signaling or stress responses. Nat. Chem. Biol. 2011, 7, 504. [Google Scholar] [CrossRef] [PubMed]
  43. Heiss, E.H.; Schilder, Y.D.; Dirsch, V.M. Chronic treatment with resveratrol induces redox stress-and ataxia telangiectasia-mutated (ATM)-dependent senescence in p53-positive cancer cells. J. Biol. Chem. 2007, 282, 26759–26766. [Google Scholar] [CrossRef] [PubMed]
  44. Hang, W.; Yin, Z.-X.; Liu, G.; Zeng, Q.; Shen, X.-F.; Sun, Q.-H.; Li, D.-D.; Jian, Y.-P.; Zhang, Y.-H.; Wang, Y.-S. Piperlongumine and p53-reactivator APR-246 selectively induce cell death in HNSCC by targeting GSTP1. Oncogene 2018, 37, 3384. [Google Scholar] [CrossRef]
  45. Gupta, S.C.; Hevia, D.; Patchva, S.; Park, B.; Koh, W.; Aggarwal, B.B. Upsides and downsides of reactive oxygen species for cancer: The roles of reactive oxygen species in tumorigenesis, prevention, and therapy. Antioxid. Redox Signal. 2012, 16, 1295–1322. [Google Scholar] [CrossRef]
  46. Boguski, M.S.; Mandl, K.D.; Sukhatme, V.P. Repurposing with a difference. Science 2009, 324, 1394–1395. [Google Scholar] [CrossRef] [PubMed]
  47. Naguib, A.; Mathew, G.; Reczek, C.R.; Watrud, K.; Ambrico, A.; Herzka, T.; Salas, I.C.; Lee, M.F.; El-Amine, N.; Zheng, W. Mitochondrial complex I inhibitors expose a vulnerability for selective killing of Pten-Null cells. Cell Rep. 2018, 23, 58. [Google Scholar] [CrossRef] [PubMed]
  48. Récher, C.; Beyne-Rauzy, O.; Demur, C.; Chicanne, G.; Dos Santos, C.; Mansat-De Mas, V.; Benzaquen, D.; Laurent, G.; Huguet, F.; Payrastre, B. Antileukemic activity of rapamycin in acute myeloid leukemia. Blood 2005, 105, 2527–2534. [Google Scholar] [CrossRef] [PubMed]
  49. Lokeshwar, B.L. Chemically modified non-antimicrobial tetracyclines are multifunctional drugs against advanced cancers. Pharmacol. Res. 2011, 63, 146–150. [Google Scholar] [CrossRef] [PubMed]
  50. Nguyen, H.; Shabani, S.; Awad, A.; Kaushal, M.; Doan, N. Molecular Markers of Therapy-Resistant Glioblastoma and Potential Strategy to Combat Resistance. Int. J. Mol. Sci. 2018, 19, 1765. [Google Scholar] [CrossRef]
  51. Yang, S.; Qiang, L.; Sample, A.; Shah, P.; He, Y.-Y. NF-κB signaling activation induced by chloroquine requires autophagosome, p62 protein, and c-Jun N-terminal Kinase (JNK) signaling and promotes tumor cell resistance. J. Biol. Chem. 2017, 292, 3379–3388. [Google Scholar] [CrossRef] [PubMed]
Figure 1. The rhizome extract of C. raktakanda suppresses viability and long-term colony formation of glioma cells. (A) C-6 glioma cells were exposed to different concentrations (µg/mL) of CR extracts (acetone, hexane, and ethyl acetate) for 48 h. The proliferation of cells was examined by 3-[4,5-dimethylthiazol-2-yl]-2,5-diphenyl tetrazolium bromide (MTT) assay. Note that the acetone extract was more potent as compared to hexane and ethyl acetate. (B) Cisplatin and imatinib were used as positive controls. (C) C-6 cells (1000 cells/well) were treated with indicated concentrations (µg/mL) of the acetone extract for 6 h. After seven days, the colonies were stained with 0.1% crystal violet and counted manually. A concentration dependent reduction in the number of colonies was observed after treatment with acetone extract. Where indicated, the values are mean ± SE from three experiments. *- indicates the significance of difference compared to the control group; P < 0.05. AE, acetone extract; CR, Curcuma raktakanda.
Biomolecules 09 00159 g001
Figure 2. Acetone extract induces apoptosis in glioma cells. (A) C-6 glioma cells were exposed to different concentrations (µg/mL) of acetone extract. After 24 h, cells were stained with acridine orange (AO)/propidium iodide (PI) (10 µg/mL) and observed under fluorescence microscope. As indicated by arrows, control cells exhibited round to oval shaped green nucleus. In treated cells, orange to red fluorescence was observed with condensed and fragmented nucleus. (B) C-6 cells were treated with indicated concentration (µg/mL) of acetone extract. After 24 h, cells were fixed, permeabilized and mounted with DAPI. While fragmentation was observed in the treated cells, round and oval shaped nuclei were observed in the control cells as shown by arrows. (C) C-6 cells were exposed to acetone extract for 24 h, DNA was isolated and electrophoresed on agarose gel. Note the presence of DNA smear in the treated cells at higher concentration. (D) C-6 cells were exposed to indicated concentrations (µg/mL) of acetone extract for 24 h and the expression of Bcl-xL was examined in the whole cell extract by western blotting. Glyceraldehyde-3-phosphate dehydrogenase (GAPDH) was used as an internal control. Values below the blot indicate fold change in the Bcl-xL expression compared to control. The scale bar represents 100 µm. AE, acetone extract.
Biomolecules 09 00159 g002
Figure 3. Acetone extract induces cell cycle arrest and lowers mitochondrial membrane potential in glioma cells. (A) C-6 glioma cells were exposed to indicated concentrations (µg/mL) of acetone extract for 24 h. Cells were then fixed and washed with PBS before staining with PI. The population at different phases of cell cycle were examined by flow cytometry. Note an increase in the sub-G1 population at the higher doses of acetone extract. (B) C6 cells were treated with the indicated concentrations (µg/mL) of the acetone extract for 24 h and then stained with JC-1 (10 µg/mL). The cells were then washed and observed under fluorescence microscope. In control cells, the intense red fluorescence indicates high mitochondrial membrane potential. The presence of green fluorescence in treated cells suggests depolarized mitochondria. A concentration dependent decrease in the ratio of red/green fluorescence was observed (lower left). While red stained cells decreased in a concentration dependent manner, a significant increase in the green stained cells was observed (lower right). Where indicated, the values are mean ± SE from three experiments. *- indicates the significance of difference compared to the control group; P < 0.05. The scale bar represents 100 µm. AE, acetone extract.
Biomolecules 09 00159 g003
Figure 4. Acetone extract suppresses the migration of C-6 glioma cells. The sterile microtips were used to scratch over the cells with 70% confluency. The different concentrations (µg/mL) of acetone extract was then provided to the cells. The scratched area was examined under phase contrast microscope. The percentage of wound size and healed area was measured at different time intervals. The values are mean ± SE from three experiments. *- indicates the significance of difference compared to the control group; P < 0.05. Note a decrease in the migration potential of C-6 cells after treatment with acetone extract. The scale bar represents 100 µm. AE, acetone extract.
Biomolecules 09 00159 g004
Figure 5. Acetone extract induces reactive oxygen species (ROS) generation. (A) C-6 cells were treated with indicated concentrations (µg/mL) of acetone extract for 1 h. The cells were then stained with H2DCFDA (10 µM) for 30 min and ROS generation was measured by flow cytometry. (B) The stained cells were also visualized under fluorescence microscope. The arrows indicate DCFDA stained cells in the control and treated groups. Note a concentration dependent increase in the level of ROS (DCFDA stained cells) after treatment with acetone extract. The scale bar represents 100 µm. AE, acetone extract.
Biomolecules 09 00159 g005
Figure 6. The rhizome extract of C. raktakanda suppresses the proliferation of cancer cells from diverse origin. Breast (MDA-MB-231, MCF-7) and cervical (HeLa) cells were exposed to different concentrations (µg/mL) of CR extracts (acetone, hexane, ethyl acetate) for 48 h. The viability of cells was examined by mitochondrial membrane potential (MTT) assay. Note that the cancer cells exhibited varied degree of sensitivity to the three extracts. Values are mean ± SE from three experiments. *- indicates the significance of difference compared to the control group; P < 0.05.
Biomolecules 09 00159 g006
Table 1. Gas chromatography-mass spectrometry (GC-MS) analysis of acetone extract of Curcuma raktakanda.
S. No.Peak No.Retention Time (min)Area %Compound NameMolecular WeightMolecular Formula
1118.9850.8413,17-Dimethylhentriacontane464.907 C33H68
2219.3310.71Hexacosane366.718C26H54
3320.1290.75Eicosane282.5475C20H42
4420.5412.41Tetracontane563.096C40H82
5521.2191.17Tetracontane563.096C40H82
6621.6460.80Pentacosane352.691C25H52
7722.1290.12Pentacosane352.691C25H52
8822.4940.26Dotriacontane450.88 C32H66
9922.8602.15Tetracontane563.079 C40H82
101027.8900.08Acetic acid, 1-[2-(2,2,6-trimethyl-bicyclo[4.1.0]hept-1-yl)-ethyl]-vinyl ester250.376 C16H26
111139.2801.02Celidoniol, deoxy-424.798C29H60
121240.4940.20Nonacosane408.799 C29H60
131340.7270.20Pentatriacontane492.961C35H72
141441.5350.54Heneicosyl pentafluoropropionate458.5890C24H43F5O2
151542.3520.401,30-Triacontanediol454.812 C30H62
161643.0004.14(2e)-1-methyl-3-(2,6,6-trimethyl-2-cyclohexen-1-yl)-2-propenyl acetate236.355C15H24O2
171743.1006.16Dotriacontane450.88C32H66
181843.28638.53Tetracontane563.096C40H82
191944.3960.33Tetratriacontyl heptafluorobutyrate690.9421C38H69F7O2
202044.6200.21Pentatriacontane492.961C35H72
212144.8900.191-Hentetracontanol593.122C41H84O
222245.2900.28Tetrapentacontane, 1,54-dibromo-917.266C54H108Br2
232346.2201.67Hexatriacontane506.988C36H74
242446.7460.52Hexatriacontane506.988C36H74
252548.3459.10(-)-(1R,2R,4aS,8aS)-1-(2-Hydroxyethyl)-2,5,5,8a-tetramethyldecahydro-2-naphthalenol308.499 C20H36
262648.50127.22Tetracontane563.096C40H82
The compounds were detected using database NIST08s.LIB (Gaithersburg, MD, USA), WILEY8.LIB (Hoboken, NJ, USA), and PUBCHEM (NCBI, MD, USA).
Table 2. GC-MS analysis of hexane extract of C. raktakanda.
S. No.Peak
No.
Retention Time (min)Area %Compound NameMolecular WeightMolecular Formula
118.2774.4Eucalyptol154.249 C10H18O
2211.5165.17(+)-2-Bornanone152.2334C10H16O
3316.7460.88.delta.-Elemene204.357C15H24
4418.2067.442,4-diisopropenyl-1-methyl-1-vinylcyclohexane204.351 C15H24
5519.2225.14.gamma.-Elemene204.3511C15H24
6620.7392.45beta.-Selinene204.357C15H24
7720.8588.2Benzofuran, 6-ethenyl-4,5,6,7-tetrahydro-3,6-dimethyl-5-isopropenyl-, trans-216.3187C15H20O
8823.39816.84beta.-Elemenone218.34C15H22O
9924.0442.181H-Cycloprop[e]azulen-7-ol, decahydro-1,1,7-trimethyl-4-methylene-, [1ar-(1a.alpha.,4a.alpha.,7.beta.,7a.beta.,7b.alpha.)]-220.3505C15H24O
101025.5393.913,7-Dimethyl-10-(1-methylethylidene)-3,7-cyclodecadien-1-one218.3346C15H22O
111126.8998.335,8-Dihydroxy-4a-methyl-4,4a,4b,5,6,7,8,8a,9,10-decahydro-2(3H)-phenanthrenone250.333 C15H22
121227.65210.49Cycloprop[e]indene-1a,2(1H)-dicarboxaldehyde, 3a,4,5,6,6a,6b-hexahydro-5,5,6b-trimethyl-, (1a.alpha.,3a.beta.,6a.beta.,6b.alpha232.323 C15H20O2
131328.6432.17Elemene204.3511C15H24
141428.9586.54Acetic acid, 6-(1-hydroxymethyl-vinyl)-4,8a-dimethyl-3-oxo-1,2,3,5,6,7,8,8a-octahydronaphthalen-2-yl ester292.375 C17H24O4
151529.8720.72Bufa-20,22-dienolide, 14,15-epoxy-3,5,16-trihydroxy-, (3.beta.,5.beta.,15.beta.,16.beta.)-500.588 C28H36O8
161630.0331.07Cyclohexane, 1-ethenyl-1-methyl-2-(1-methylethenyl)-4-(1-methylethylidene)-204.3511C15H24
171731.131.41n-Hexadecanoic acid256.4241C16H32O2
181831.6170.51Hydroxydehydrostevic acid318.457 C20H30O3
191935.3621.674,8,13-Cyclotetradecatriene-1,3-diol, 1,5,9-trimethyl-12-(1-methylethyl)-306.49C20H34O2
201841.1978.47Alloaromadendrene oxide-(1)220.3505C15H24O
211944.8612.01Longifolenaldehyde220.356 C15H24O
The compounds were detected using database NIST08s.LIB (Gaithersburg, MD, USA), WILEY8.LIB (Hoboken, NJ, USA), and PUBCHEM (NCBI, MD, USA).
Table 3. GC-MS analysis of ethyl acetate extract of C. raktakanda.
S. No.Peak No.Retention Time (min)Area %Compound NameMolecular WeightMolecular Formula
11.11.5530.74Bicyclo[2.2.1]heptan-2-one, 1,7,7-trimethyl-152.2334C10H16O
22.12.2620.28Bicyclo[2.2.1]heptan-2-ol, 1,7,7-trimethyl-, (1S-endo)-196.2860C12H20O2
33.18.1971.142,4-Diisopropenyl-1-methyl-1-vinylcyclohexane204.351 C15H24
44.18.4350.52Hexadecane226.41C16H34
55.19.2190.68.gamma.-Elemene204.357C15H24
66.20.7430.33.beta.-Selinene204.357C15H24
77.20.8320.345-Isopropenyl-3,6-dimethyl-6-vinyl-4,5,6,7-tetrahydro-1-benzofuran216.3187C15H20O
88.20.9511.19Heptadecane240.4677C17H36
99.23.3463.81beta.-Elemenone218.34C15H22O
1010.24.0410.61Isospathulenol220.356C15H24O
1111.25.5310.643,7-Dimethyl-10-(1-methylethylidene)-3,7-cyclodecadien-1-one218.3346C15H22O
1212.27.5850.86Cycloprop[e]indene-1a,2(1H)-dicarboxaldehyde, 3a,4,5,6,6a,6b-hexahydro-5,5,6b-trimethyl-, (1a.alpha.,3a.beta.,6a.beta.,6b.alpha232.323C15H20O2
1313.27.7451.68Norethindrone298.426C20H26O2
1414.27.8641.25(Albicanol) Decahydro-2-methylene-5,5,8a-trimethyl-1-naphthalenemethanol222.366 C15H26
1515.28.630.889-t-Butyltricyclo[4.2.1.1(2,5)]decane-9,10-diol224.339 C14H24
1616.30.0310.7gamma.-Elemene204.357C15H24
1717.30.3870.81Longifolenaldehyde220.3505C15H24O
1818.31.0971.46l-(+)-Ascorbic acid 2,6-dihexadecanoate652.954C38H68O8
1919.33.248.322-Hydroxy-4-isopropyl-7-methoxytropone194.23C11H14O3
2020.34.6848.34Pregn-4,16-diene-3,20-dione dimethoxime314.469C21H30O2
2121.35.3671.244,8,13-Cyclotetradecatriene-1,3-diol, 1,5,9-trimethyl-12-(1-methylethyl)-306.49C20H34O2
2222.36.4951.92H-Cyclohepta[b]furan-2-one, 6-[1-(acetyloxy)-3-oxobutyl]-3,3a,4,7,8,8a-hexahydro-7-methyl-3-methylene-306.146C17H22O5
232338.0012.034,7-Methanofuro[3,2-c]oxacycloundecin-6(4H)-one, 7,8,9,12-tetrahydro-3,11-dimethyl-246.306C15H18O3
242439.4990.9Behenic alcohol326.6000C22H46O
252541.1769.481,1,6-trimethyl-3-methylene-2-(3,6,9,13-tetramethyl-6-ethenye-10,14-dimethylene-pentadec-4-enyl)cyclohexane220.350 C15H24
262642.513162-Phosphabicyclo[3.1.0]hex-3-ene, 6,6-dimethyl-2,3,4-triphenyl-, (endo)-136.194 C8H12N
272743.4298.67Cobalt, hexamethylbenzene-pentamethylcyclopentadienyl-329.39C20H30Co
282844.58712.6Desmethylnomifensine224.307C15H16N2
292944.8718.26Longifolenaldehyde220.3505C15H24O
303046.3444.34Furan, 2,5-bis(3,4-dimethoxyphenyl)tetrahydro-3,4-dimethyl-, [2S-(2.alpha.,3.beta.,4.alpha.,5.beta.)]-372.461C22H28O5
The compounds were detected using database NIST08s.LIB (Gaithersburg, MD, USA), WILEY8.LIB (Hoboken, NJ, USA), and PUBCHEM (NCBI, MD, USA)

