Systematic FTIR Spectroscopy Study of the Secondary Structure Changes in Human Serum Albumin under Various Denaturation Conditions


Abstract
:1. Introduction
2. Materials and Methods
3. Results
3.1. Acid Denaturation of HSA
3.2. Alkaline Denaturation of HSA
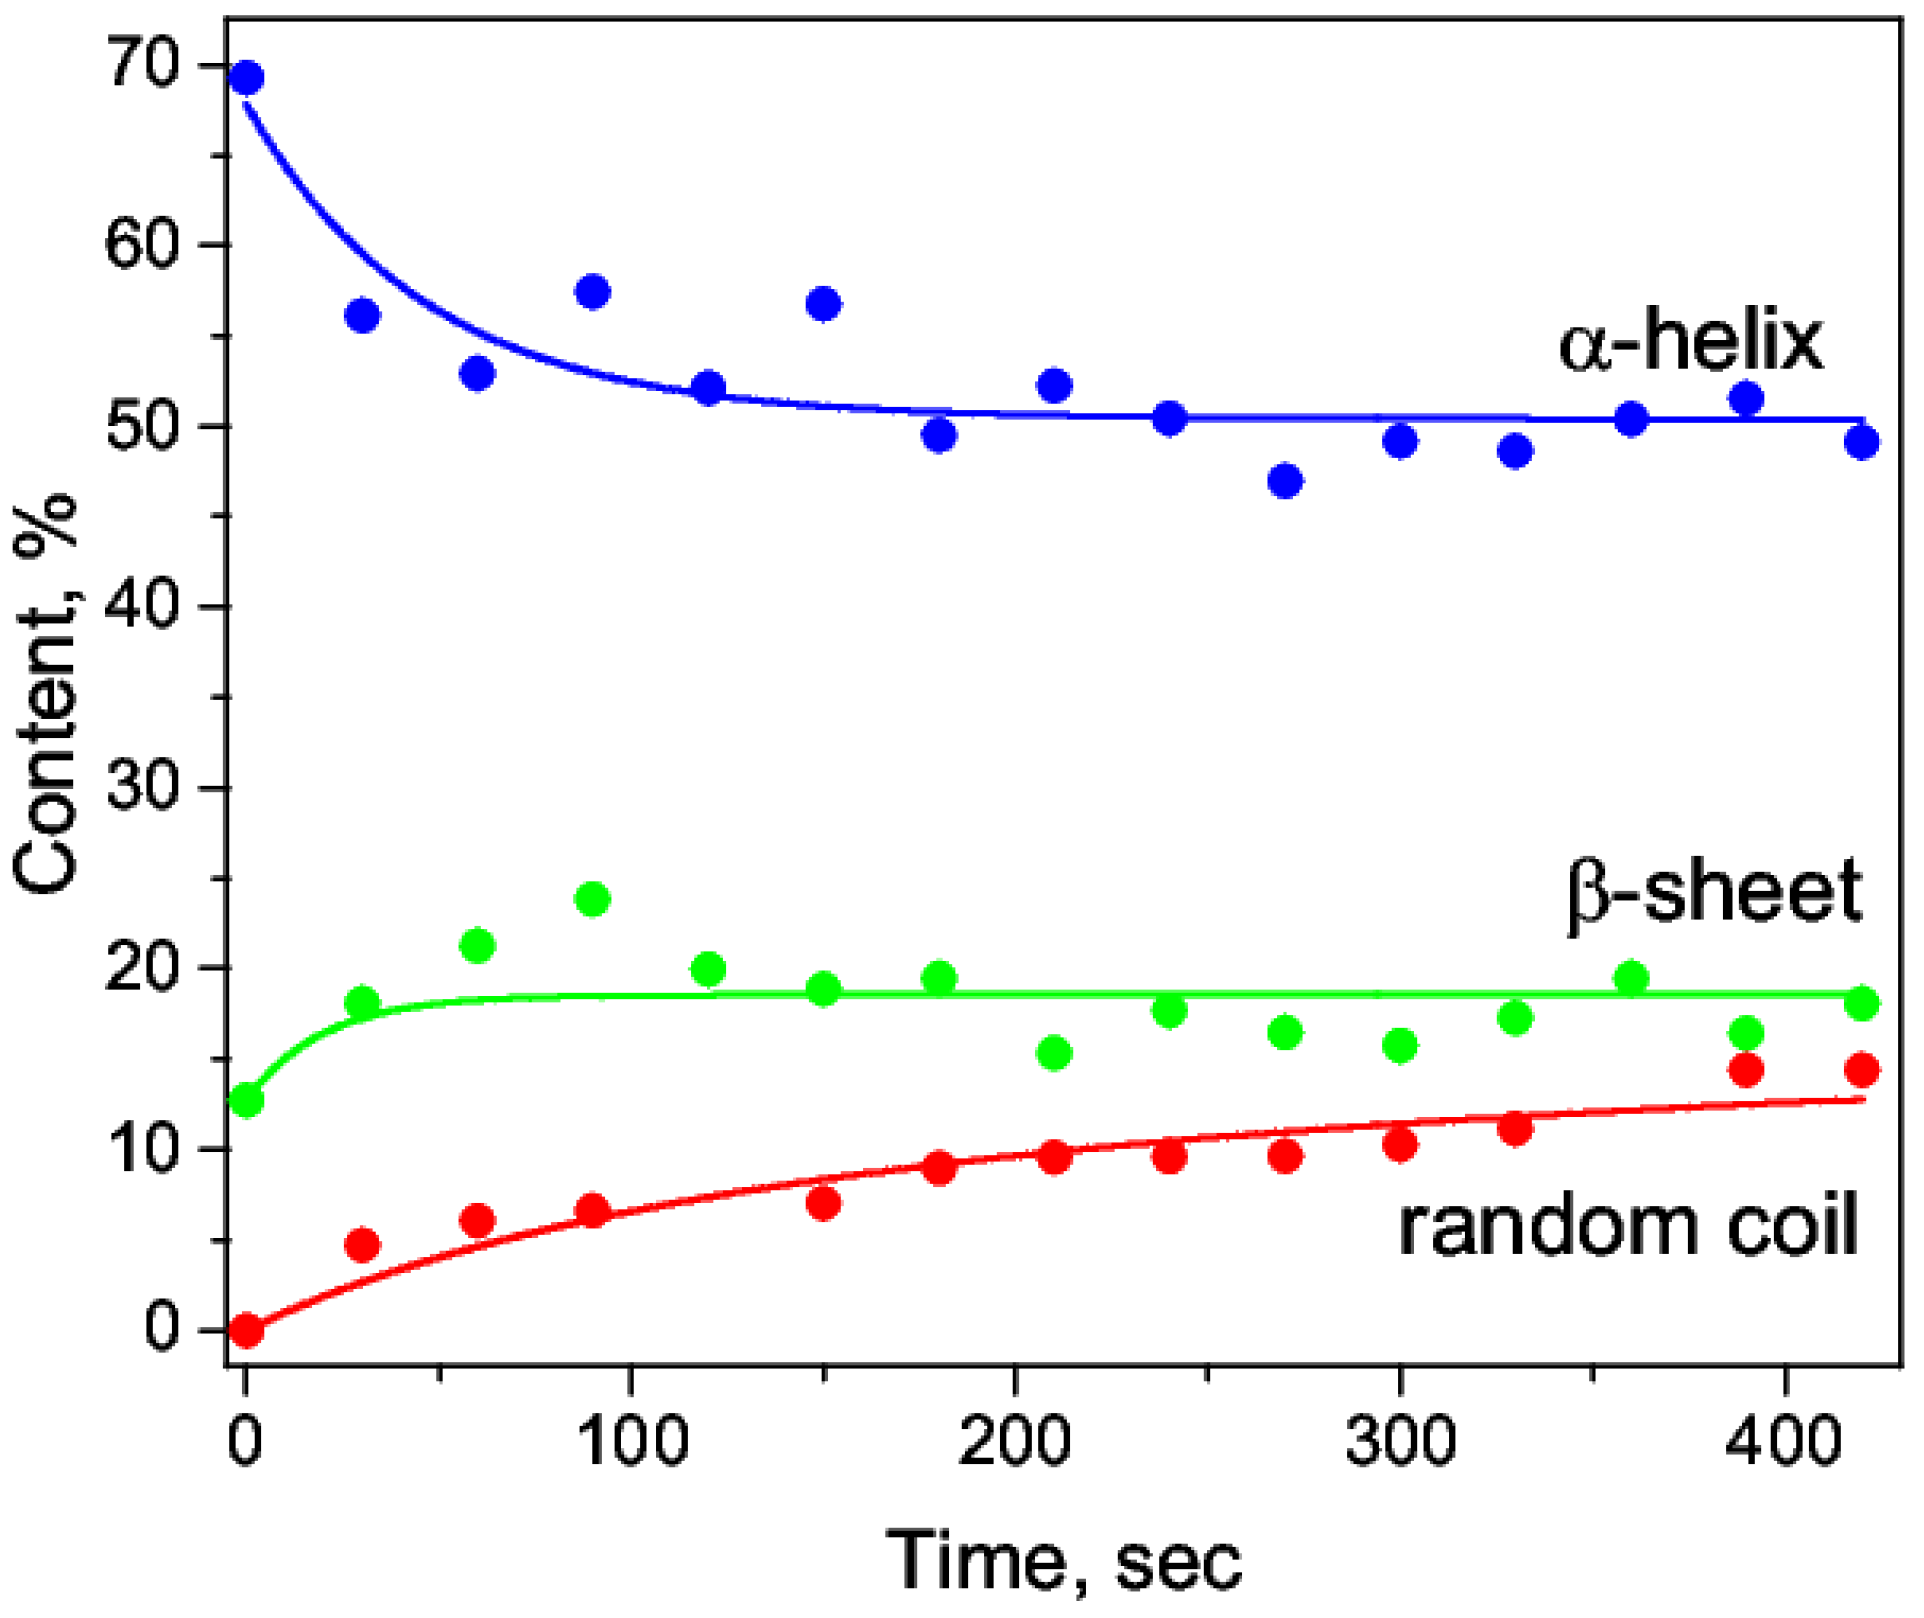
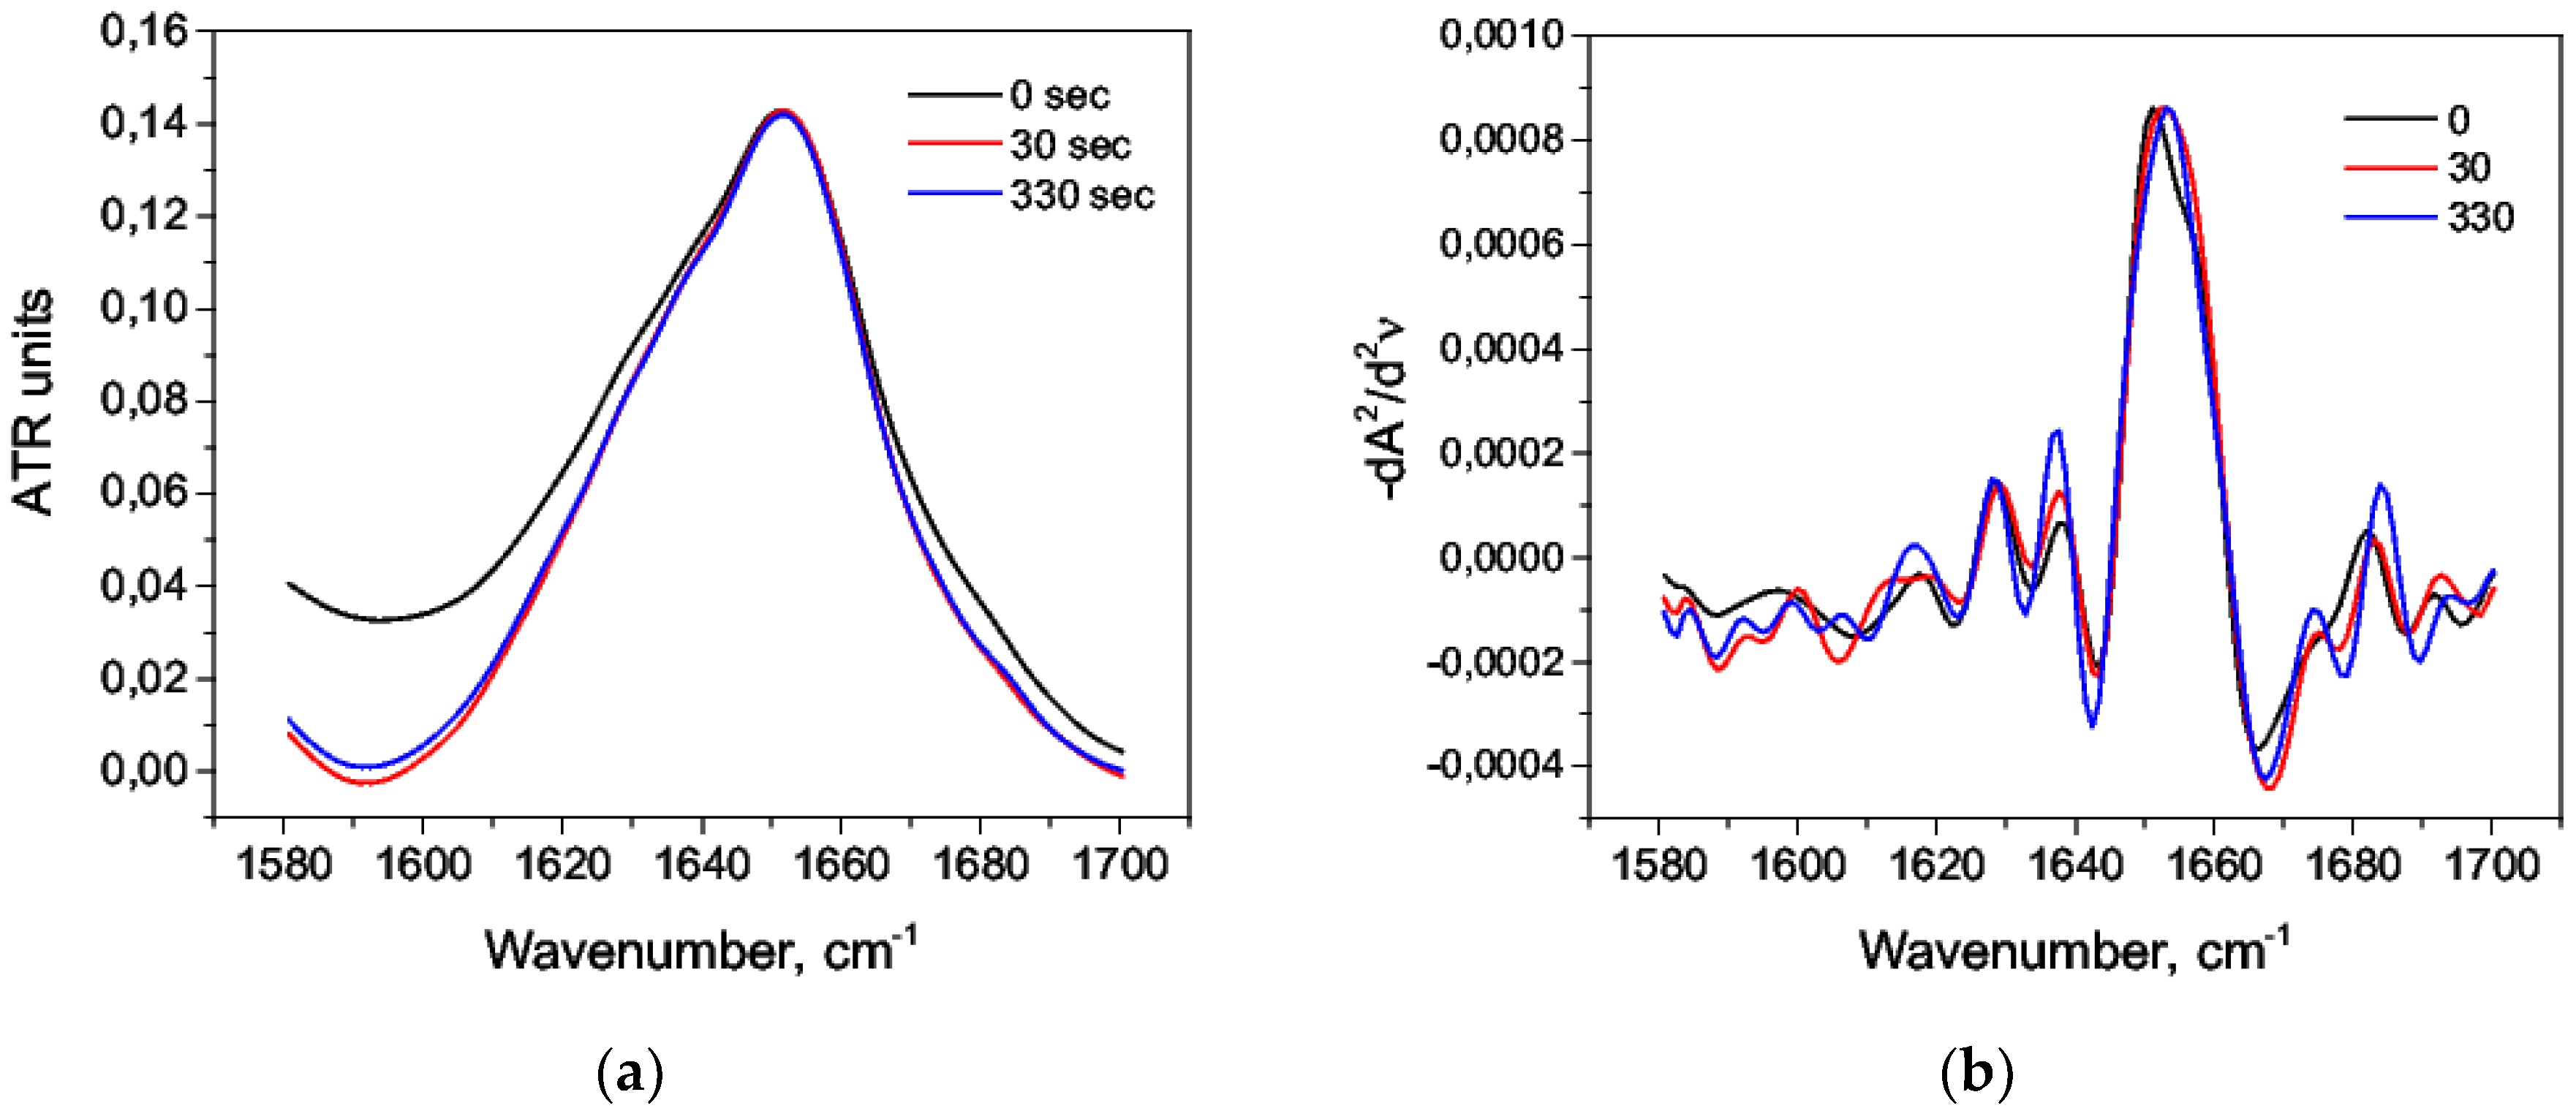
3.3. Thermal Denaturation of HSA
3.4. The Effect of Alcohol on the HSA Secondary Structure
4. Conclusions
Author Contributions
Funding
Conflicts of Interest
Appendix A

References
- Berg, J.; Tymoczko, J.; Stryer, L. Biochemistry, 5th ed.; W H Freeman: New York, NY, USA, 2002. [Google Scholar]
- Lynch, I.; Dawson, K.; Linse, S. Detecting cryptic epitopes created by nanoparticles. Sci. STKE 2006, 2006. [Google Scholar] [CrossRef] [PubMed]
- Lu, R.; Li, W.; Katzir, A.; Raichlin, Y.; Yu, H.; Mizaikoff, B. Probing the secondary structure of bovine serum albumin during heat-induced denaturation using mid-infrared fiberoptic sensors. Analyst 2015, 140, 765–770. [Google Scholar] [CrossRef] [PubMed]
- Baronio, C.; Baldassarre, M.; Barth, A. Insight into the internal structure of amyloid- oligomers by isotope-edited fourier transform infrared spectroscopy. Phys. Chem. Chem. Phys. 2019, 21, 8587–8597. [Google Scholar] [CrossRef] [PubMed]
- Wei, W.; Hu, W.; Zhang, X.-Y.; Zhang, F.-P.; Sun, S.-Q.; Liu, Y.; Xu, C.-H. Analysis of protein structure changes and quality regulation of surimi during gelation based on infrared spectroscopy and microscopic imaging. Sci. Rep. 2018, 8, 5566. [Google Scholar] [CrossRef] [PubMed]
- Carton, I.; Bcker, U.; Ofstad, R.; Srheim, O.; Kohler, A. Monitoring secondary structural changes in salted and smoked salmon muscle myofiber proteins by FTIR microspectroscopy. J. Agric. Food Chem. 2009, 57, 3563–3570. [Google Scholar] [CrossRef] [PubMed]
- Tatulian, S. FTIR analysis of proteins and protein-membrane interactions. Methods Mol. Biol. 2019, 203, 281–325. [Google Scholar]
- Krimm, S.; Bandekar, J. Vibrational spectroscopy and conformation of peptides, polypeptides, and proteins. Adv. Protein Chem. 1986, 38, 181–364. [Google Scholar] [PubMed]
- Bandekar, J. Amide modes and protein conformation. Biochim. Biophys. Acta 1992, 1120, 123–143. [Google Scholar] [CrossRef]
- Lin, K.; Yang, H.; Gao, Z.; Li, F.; Yu, S. Overestimated accuracy of circular dichroism in determining protein secondary structure. Eur. Biophys. J. 2013, 42, 455–461. [Google Scholar] [CrossRef]
- Kelly, S.M.; Price, N.C. The Use of Circular Dichroism in the Investigation of Protein Structure and Function. Curr. Prot. Pept. Sci. 2000, 1, 349–384. [Google Scholar] [CrossRef] [Green Version]
- Barth, A. Infrared spectroscopy of proteins. Biochim. Biophys. Acta 2007, 1767, 1073–1101. [Google Scholar] [CrossRef] [PubMed] [Green Version]
- Zeeshan, F.; Tabbassum, M.; Jorgensen, L.; Medlicott, N. Attenuated total reflection fourier transform infrared (ATR FTIR) spectroscopy as an analytical method to investigate the secondary structure of a model protein embedded in solid lipid matrices. Appl. Spectr. 2018, 72, 268–279. [Google Scholar] [CrossRef] [PubMed]
- Susi, H.; Byler, M. Protein structure by fourier transform infrared spectroscopy: second derivative spectra. Biochem. Biophys. Res. Commun. 1988, 115, 391–397. [Google Scholar] [CrossRef]
- Kong, J.; Yu, S. Fourier transform infrared spectroscopic analysis of protein secondary structures. Acta Biochim. Biophys. Sin. 2007, 39, 549–559. [Google Scholar] [CrossRef] [PubMed]
- Jiang, Y.J.Y.; Li, C.; Nguyen, X.; Muzammil, S.; Towers, E.; Gabrielson, J.; Narhi, L. Qualification of FTIR spectroscopic method for protein secondary structural analysis. J. Pharm. Sci. 2011, 100, 4631–4641. [Google Scholar]
- Dong, A.; Huang, P.; Caughey, B.; Caughey, W. Infrared analysis of ligand and oxidation-induced conformational changes in hemoglobins and myoglobins. Arch. Biochem. Biophys. 1995, 316, 893–898. [Google Scholar] [CrossRef] [PubMed]
- Cameron, D.; Moffatt, D. A generalized approach to derivative spectroscopy. Appl. Spectrosc. 1987, 41, 539–544. [Google Scholar] [CrossRef]
- Baldassarre, M.; Li, C.; Eremina, N.; Goormaghtigh, E.; Barth, A. Simultaneous fitting of absorption spectra and their second derivatives for an improved analysis of protein infrared spectra. Molecules 2015, 20, 12599–12622. [Google Scholar] [CrossRef]
- Yang, H.; Yang, S.; Kong, J.; Dong, A.; Yu, S. Obtaining information about protein secondary structures in aqueous solution using Fourier transform IR spectroscopy. Nat. Prot. 2015, 10, 382–396. [Google Scholar] [CrossRef]
- Surewicz, W.; Mantsch, H.; Chapman, D. Determination of protein secondary structure by Fourier transform infrared spectroscopy: A critical as sessment. Biochemistry 1993, 32, 389–394. [Google Scholar] [CrossRef]
- Usoltsev, D.; Sitnikova, V.; Nosenko, T.; Olekhnovich, R.; Uspenskaya, M. Comparison of protein secondary structure calculation methods based on infrared spectra deconvolution. Sci. Techn. J. Inform. Technol. Mechan. Optics 2019, 19, 586–593. [Google Scholar] [CrossRef]
- Byler, D.; Susi, H. Examination of the secondary structure of proteins by deconvolved FTIR spectra. Biopolymers 1986, 25, 469–487. [Google Scholar] [CrossRef]
- Sarver, R.W., Jr.; Krueger, W.C. Protein secondary structure from Fourier transform infrared spectroscopy: a database analysis. Anal. Biochem. 1991, 194, 89–100. [Google Scholar] [CrossRef]
- Dong, A.; Huang, P.; Caughey, W. Protein secondary structures in water from second-derivative amide I infrared spectra. Biochemistry 1990, 29, 3303–3308. [Google Scholar] [CrossRef]
- Holloway, P.; Mantsch, H. Structure of cytochrome b5 in solution by Fourier transform infrared spectroscopy. Biochemistry 1989, 28, 931–935. [Google Scholar] [CrossRef]
- Chou, P.; Fasman, G. β-turns in proteins. J. Mol. Biol. 1977, 115, 135–175. [Google Scholar] [CrossRef]
- Dong, A.; Huang, P.; Caughey, W. Redox-dependent changes in β extended chain and turn structures of cytochrome c in water solution determined by second derivative amide I infrared spectra. Biochemistry 1992, 31, 182–189. [Google Scholar] [CrossRef]
- Olsztynska-Janus, S.; Gasior-Glogowska, M.; Szymborska-Malek, K.; Czarnik-Matusewicz, B.; Komorowska, M. Specific applications of vibrational spectroscopy in biomedical engineering. In Biomedical Engineering, Trends, Research and Technologies; Olsztynska-Janus, S., Komorowska, M., Eds.; IntechOpen: Rijeka, Croatia, 2011; pp. 91–120. [Google Scholar]
- Srour, B.; Bruechert, S.; Andrade, S.; Hellwig, P. Secondary Structure Determination by Means of ATR-FTIR Spectroscopy. Methods Mol. Biol. 2017, 1635, 195–203. [Google Scholar]
- Peters Jr., T. All about Albumin: Biochemistry, Genetics, and Medical Applications, 1st ed.; Academic Press: San Diego, CA, USA, 1996; p. 432. [Google Scholar]
- Razzak, A.; Leeb, J.E.; Choi, S.S. Structural insights into the binding behavior of isoflavonoid glabridin with human serum albumin. Food Hydrocoll. 2019, 91, 290–300. [Google Scholar] [CrossRef]
- Jurkowski, W.; Porbski, G.; Obtuowicz, K.; Roterman, I. Serum Albumin Complexation of Acetylsalicylic Acid Metabolites. Curr. Drug Metabol. 2009, 10, 448–458. [Google Scholar] [CrossRef]
- Rimac, H.; Debeljak, Ž.; Bojić, M.; Miller, L. Displacement of Drugs from Human Serum Albumin: From Molecular Interactions to Clinical Significance. Curr. Med. Chem. 2017, 24, 1930–1947. [Google Scholar] [CrossRef]
- Foster, J.F. Some aspects of the structure and conformational properties of serum albumin. In Albumin: Structure, Function and Uses, 1st ed.; Elsevier Inc.: Amsterdam, The Netherlands, 1977; pp. 53–84. [Google Scholar]
- Curry, S.; Mandelkow, H.; Brick, P.; Franks, N. Crystal structure of human serum albumin complexed with fatty acid reveals an asymmetric distribution of binding sites. Nat. Struct. Biol. 1998, 5, 827–835. [Google Scholar] [CrossRef] [PubMed]
- Sugio, S.; Kashima, A.; Mochizuki, S.; Noda, M.; Kobayashi, K. Crystal structure of human serum albumin at 2.5 a resolution. Protein Eng. 1999, 12, 439–444. [Google Scholar] [CrossRef] [PubMed]
- Dockal, M.; Carter, D.; Rueker, F. Conformational transitions of the three recombinant domains of human serum albumin depending on pH. J. Biol. Chem. 2000, 275, 3042–3050. [Google Scholar] [CrossRef] [PubMed]
- Barone, G.; Giancola, C.; Verdoliva, A. DSC studies on the denaturation and aggregation of serum albumins. Thermochim. Acta 1992, 199, 197–205. [Google Scholar] [CrossRef]
- Bramanti, E.; Benedetti, E. Determination of the secondary structure of isomeric forms of human serum albumin by a particular frequency deconvolution procedure applied to Fourier transform IR analysis. Biopolymers 1996, 38, 639–653. [Google Scholar] [CrossRef]
- Hvidt, A.; Wallevik, K. Conformational changes in human serum albumin as revealed by hydrogen-deuterium exchange studies. J. Biol. Chem. 1972, 247, 1530–1535. [Google Scholar] [PubMed]
- Lin, V.; Koenig, J. Raman studies of bovine serum albumin. Biopolymers 1976, 15, 203–218. [Google Scholar] [CrossRef] [PubMed]
- Wetzel, R.; Becker, M.; Behlke, J.; Billwitz, H.; Bohn, S.; Ebert, B.; Hamann, H.; Krumbiegel, J.; Lassmann, G. Temperature behaviour of human serum albumin. Eur. J. Biochem. 1980, 104, 469–478. [Google Scholar] [CrossRef] [PubMed]
- Berman, H.; Westbrook, J.; Feng, Z.; Gilliland, G.; Bhat, T.; Weissig, H.; Shindyalov, I.; Bourne, P. The protein data bank. Nucleic Acids Res. 2000, 28, 235–242. [Google Scholar] [CrossRef]
- Kabsch, W.; Sander, C. Dictionary of protein secondary structure: pattern recognition of hydrogen bonded and geometrical features. Biopolymers 1983, 22, 2577–2637. [Google Scholar] [CrossRef] [PubMed]
- Touw, W.G.; Baakman, C.; Black, J.; te Beek, T.A.; Krieger, E.; Joosten, R.P.; Vriend, G. A series of PDB related databases for everyday needs. Nucleic Acids Res. 2014, 43, 364–368. [Google Scholar] [CrossRef] [PubMed]
- Frishman, D.; Argos, P. Knowledge-based protein secondary structure assignment proteins: Structure, function, and genetics. Proteins 1995, 23, 566–579. [Google Scholar] [CrossRef] [PubMed]
- Heinig, M.; Frishman, D. STRIDE: A web server for secondary structure assignment from known atomic coordinates of proteins. Nucleic Acids Res. 2004, 32, W500–W502. [Google Scholar] [CrossRef] [PubMed]
- Ulrichs, T.; Drotleff, A.; Ternes, W. Determination of heat-induced changes in the protein secondary structure of reconstituted livetins (water-soluble proteins from hens egg yolk) by FTIR. J. Food Chem. 2015, 172C, 909–920. [Google Scholar] [CrossRef] [PubMed]
- Zhang, J.; Zhang, X.; Zhang, F.; Yu, S. Solid-film sampling method for the determination of protein secondary structure by Fourier transform infrared spectroscopy. Anal. Bioanal. Chem. 2017, 409, 4459–4465. [Google Scholar] [CrossRef] [PubMed]
- White, J.; Laux, V.; Fraser, N.; Heß, D.; Haertlein, M.; Forsyth, T. Deuterium effects on human serum albumin in solution. Phys. B 2018, 551, 208–211. [Google Scholar] [CrossRef]
- Ge, Y.-S.; Jin, C.; Song, Z.; Zhang, J.-Q.; Jiang, F.-L.; Liu, Y. Multispectroscopic analysis and molecular modeling on the interaction of curcumin and its derivatives with human serum albumin: A comparative study. Spectrochim. Acta Part A 2014, 124C, 265–276. [Google Scholar] [CrossRef]
- Tankovskaia, S.; Abrosimova, K.; Paston, S. Spectral demonstration of structural transitions in albumins. J. Mol. Struct. 2018, 1171, 243–252. [Google Scholar] [CrossRef]
- Muzammil, S.; Kumar, Y.; Tayyab, S. Molten globule-like state of human serum albumin at low pH. Eur. J. Biochem. 1999, 266, 26–32. [Google Scholar] [CrossRef] [Green Version]
- Lee, J.Y.; Hirose, M. Partially folded state of the 510 disulfide-reduced form of human serum albumin as an intermediate for reversible denaturation. J. Biol. Chem. 1992, 267, 14753–14758. [Google Scholar] [PubMed]
- Era, S.; Itoh, K.; Sogami, M.; Kuwata, K.; Iwama, T.; Yamada, H. Structural transition of bovine plasma albumin in the alkaline regionthe n-b transition. Int. J. Pept. Protein Res. 1990, 35, 1–11. [Google Scholar] [CrossRef] [PubMed]
- Pico, G.A. Thermodynamic features of the thermal unfolding of human serum albumin. Int. J. Biol. Macromol. 1997, 20, 63–73. [Google Scholar] [CrossRef]
- Stirpe, A.; Pantusa, M.; Rizzuti, B.; Santo, M.P.; Sportelli, L.; Bartucci, R.; Guzzi, R. Resveratrol induces thermal stabilization of human serum albuminand modulates the early aggregation stage. Int. J. Biol. Macromol. 2016, 92, 1049–1056. [Google Scholar] [CrossRef] [PubMed]
- Shivu, B.; Seshadri, S.; Li, J.; Oberg, K.; Uversky, V.N.; Fink, A.L. Distinct β-sheet structure in protein aggregates determined by ATR-FTIR spectroscopy. Biochemistry 2013, 52, 5176–5183. [Google Scholar] [CrossRef] [PubMed]
- Das, N.K.; Ghosh, N.; Kale, A.P.; Mondal, R.; Anand, U.; Ghosh, S.; Tiwari, V.K.; Kapur, M.; Mukherjee, S. Temperature induced morphological transitions from native to unfolded aggregated states of human serum albumin. J. Phys. Chem. B 2014, 118, 7267–7276. [Google Scholar] [CrossRef]
- Capomaccio, R.; Osrio, I.; Ojea-Jimnez, I.; Ceccone, G.; Colpo, P.; Gilliland, D.; Hussain, R.; Siligardi, G.; Rossi, F.; Ricard-Blum, S.; et al. Gold nanoparticles increases UV and thermal stability of human serum albumin. Biointerphases 2016, 11. [Google Scholar] [CrossRef]
- Tonoyan, S.; Astaryan, A.; Mamasakhlisov, E.; Morozov, V. Helix-coil transition in biopolymers with multicomponent heterogeneity in energy and in number of conformations. J. Contemp. Phys. 2014, 49, 209–218. [Google Scholar] [CrossRef]
- Guglielmelli, A.; Rizzuti, B.; Guzzi, R. Stereoselective and domain-specific effects of ibuprofen on the thermal stability of human serum albumin. Eur. J. Pharm. Sci. 2018, 112, 122–131. [Google Scholar] [CrossRef]
- Cooper, A. Thermodynamics of Protein Folding and Stability. Jai Press: Greenwich, CT, USA, 1999; pp. 217–270. [Google Scholar]
- Aoki, K.; Sato, K.; Nagaoka, S.; Kamada, M.; Hiramatsu, K. Heat denaturation of bovine serum albumin in alkaline pH region. Biochim. Biophys. Acta 1973, 328, 323–333. [Google Scholar] [CrossRef]
- Takeda, K.; Wada, A.; Yamamoto, K.; Moriyama, Y.; Aoki, K. Conformational change of bovine serum albumin by heat treatment. J. Protein Chem. 1989, 8, 653–659. [Google Scholar] [CrossRef] [PubMed]
- Michnik, A.; Drzazga, Z. Effect of ethanol on the thermal stability of human serum albumin. J. Therm. Anal. Calorim. 2007, 88, 449–454. [Google Scholar] [CrossRef]
- Sundd, M.; Kundu, S.; Jagannadham, M. Alcohol-induced conformational transitions in ervatamin C. An α-helix to β-sheet switchover. J. Protein Chem. 2000, 19, 169–176. [Google Scholar] [CrossRef] [PubMed]
- Pace, C.; Trevino, S.; Prabhakaran, E.; Scholtz, J. Protein structure, stability and solubility in water and other solvents. Philos. Trans. R. Soc. Lond. B Biol. Sci. 2004, 359, 1225–1235. [Google Scholar] [CrossRef] [PubMed] [Green Version]
- Ahmed, A.; Znassi, N.; Chateau, M.; Kajava, A. A structure-based approach to predict predisposition to amyloidosis. Alzheimers Dement. 2015, 11, 681–690. [Google Scholar] [CrossRef] [PubMed]


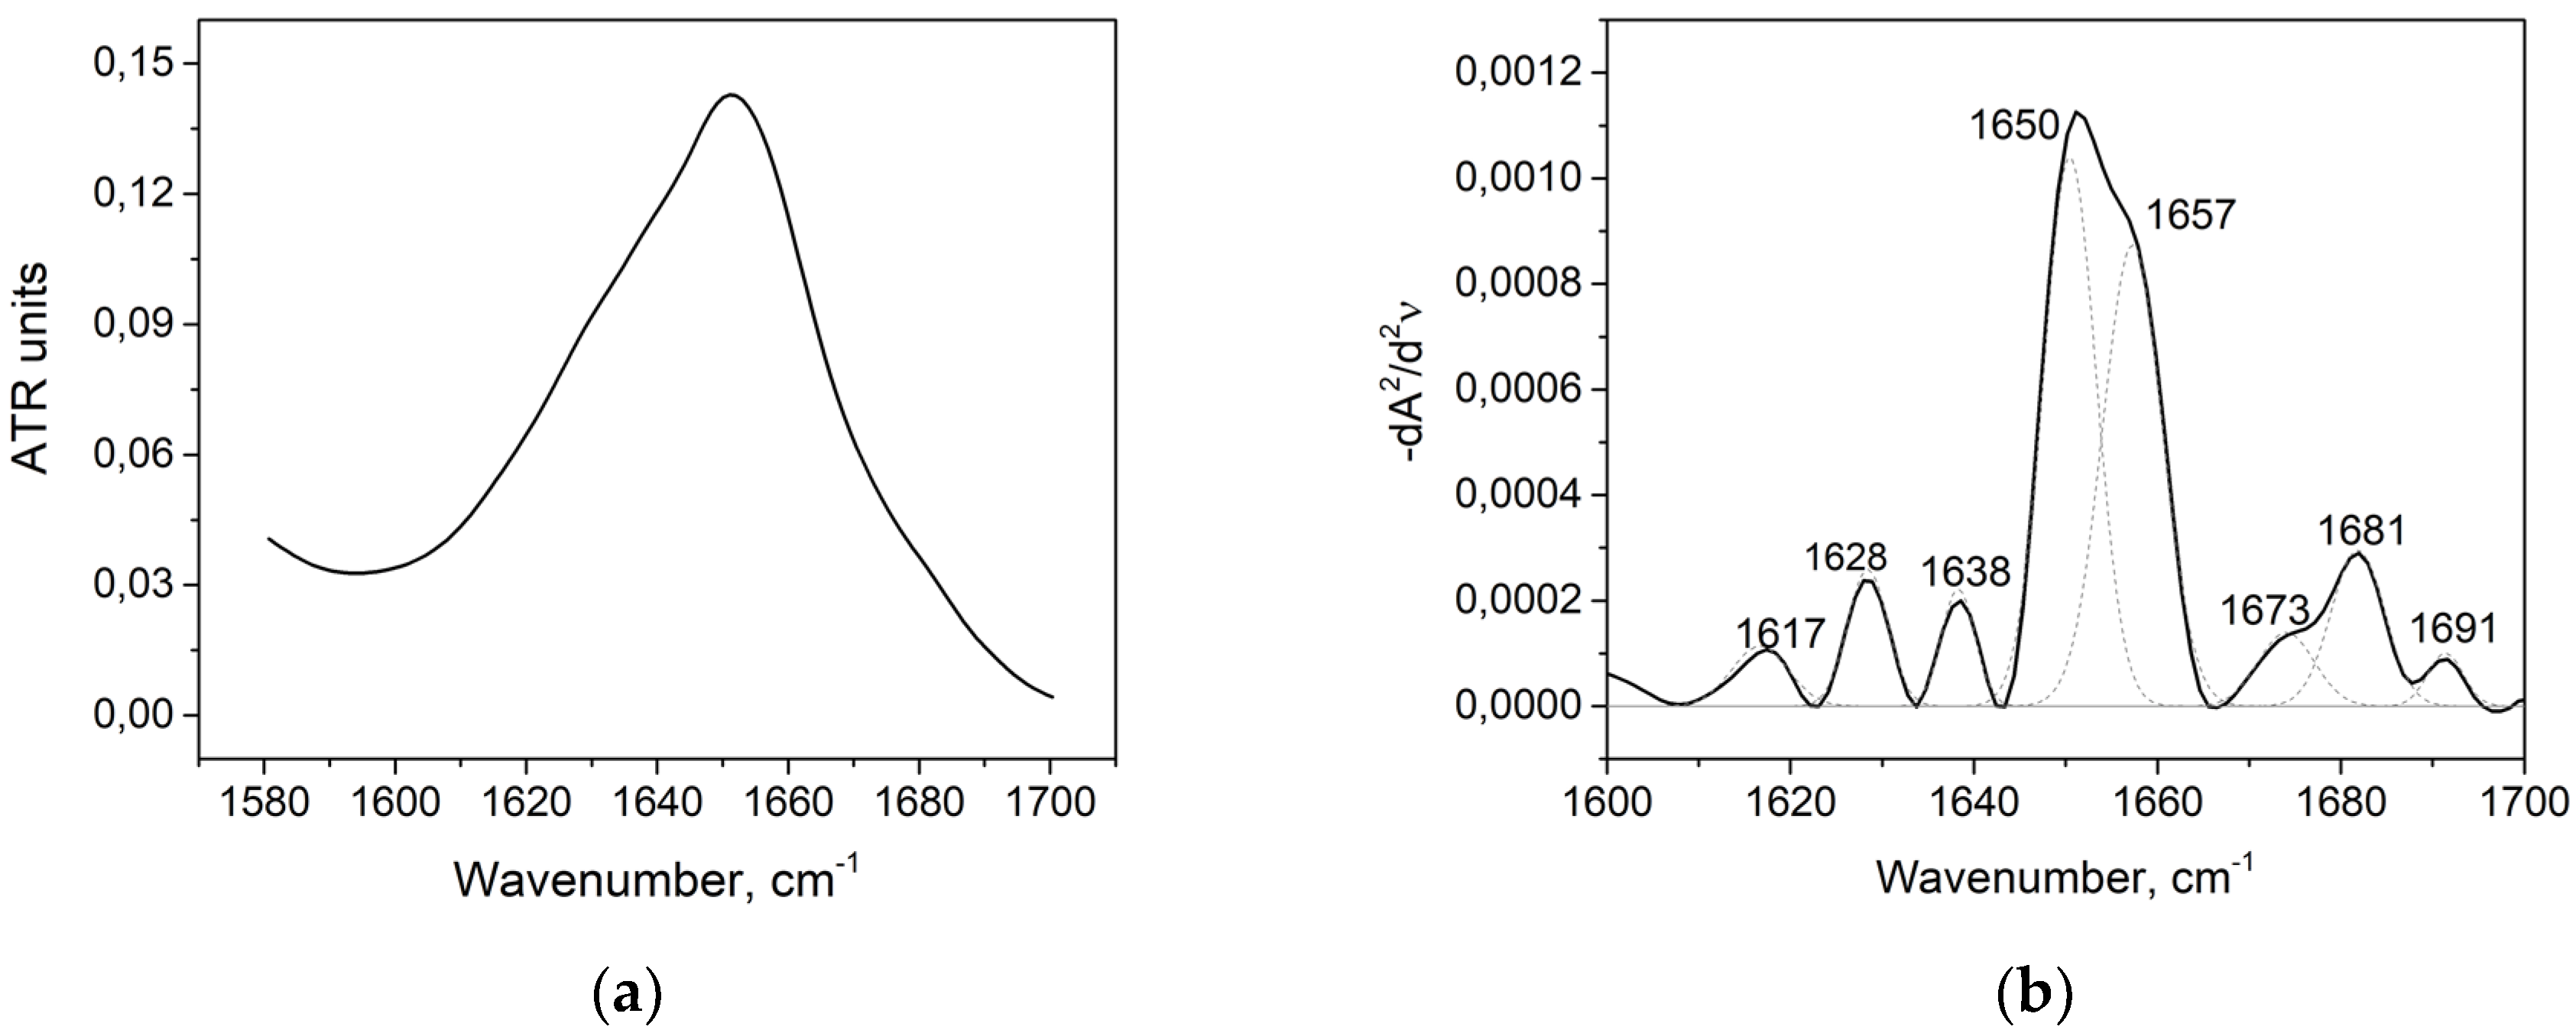
| Wavenumber, cm−1 | Range, cm−1 | Secondary Structure |
|---|---|---|
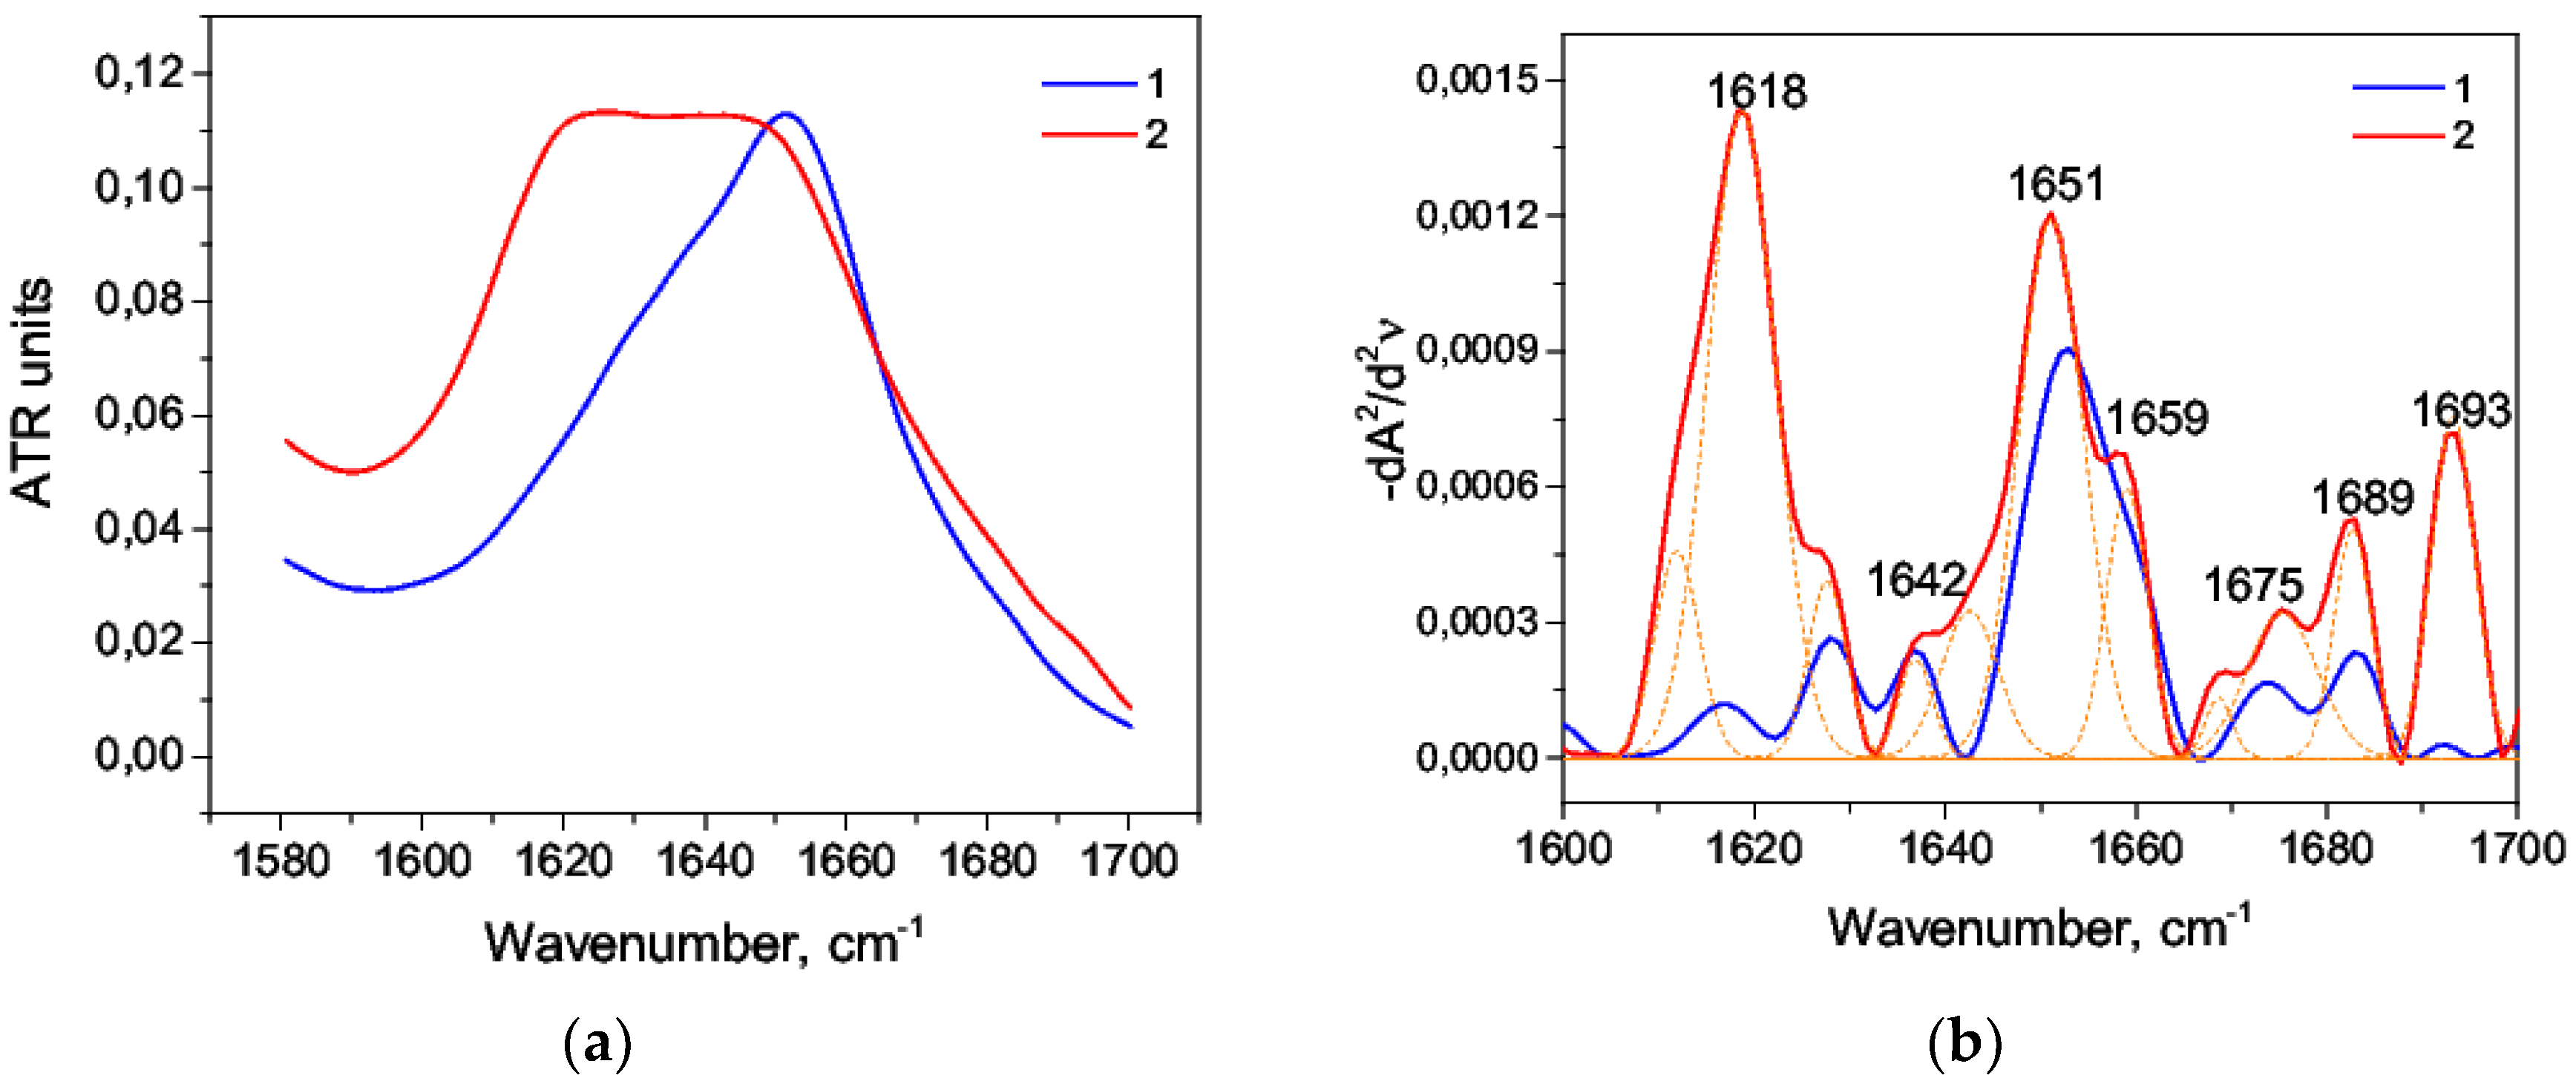
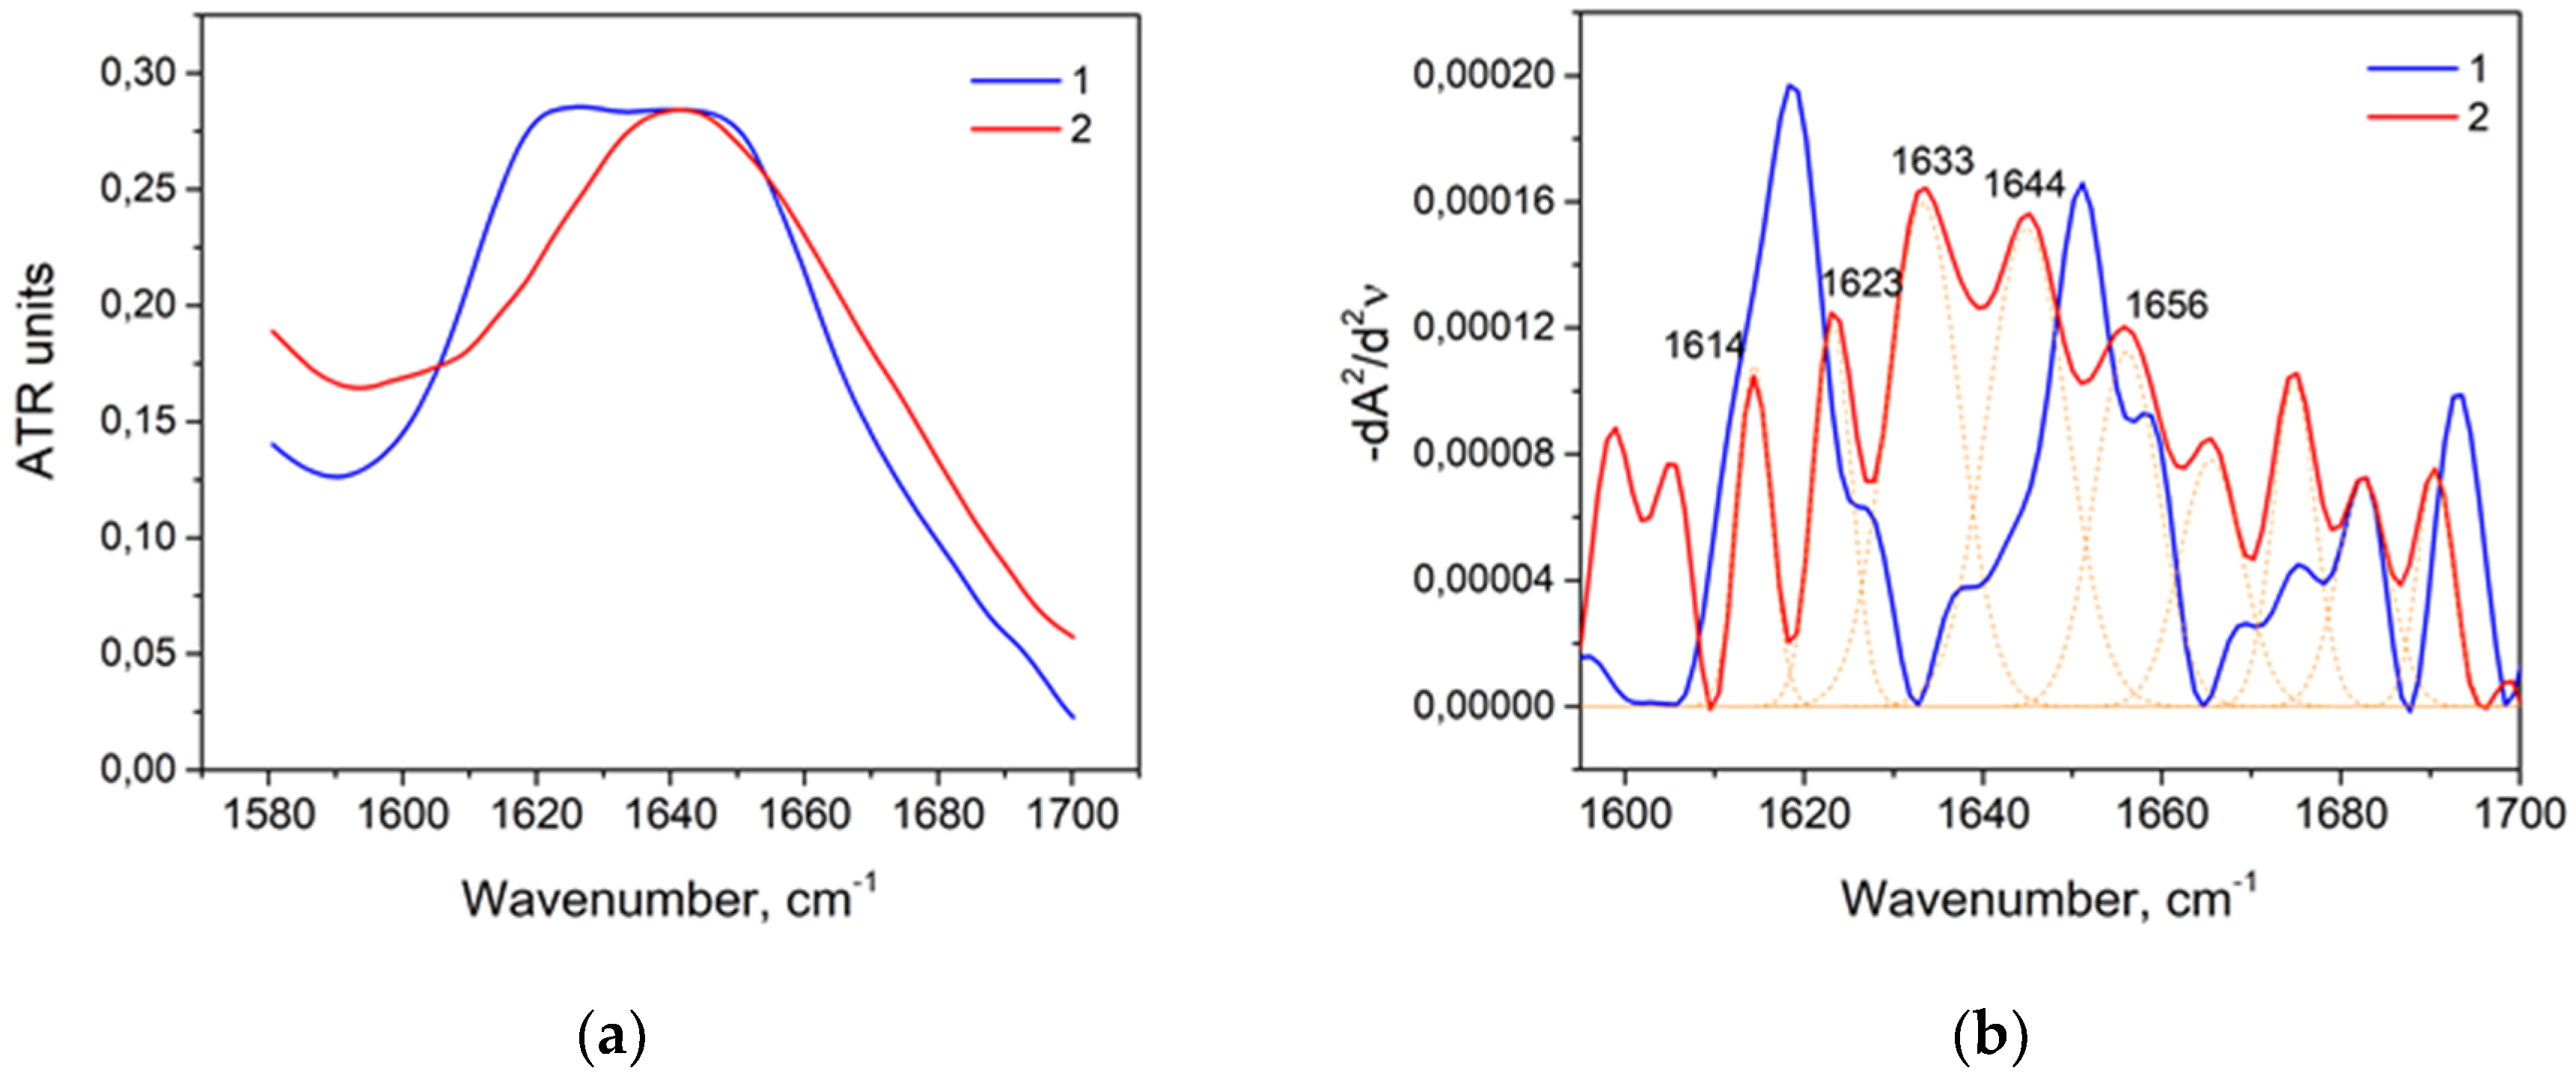
| 1618 | 1610–1619 | Intermolecular β-sheet |
| 1628, 1638, 1691 | 1620–16139, 1689–1695 | β-sheet |
| 1650, 1657 | 1650–1660 | α-helix |
| 1673, 1681 | 1660–1689 | β-turn |
| Data Source | α-helix, % | β-sheet, % | β-turn, % | Random Coil, % | Irregular Structure, % |
|---|---|---|---|---|---|
| FTIR 1 | 69.30 | 12.72 | 14.57 | 0 | 0 |
| DSSP 2 [37,38,39] | |||||
| Chain A Chain B | 68.38 69.23 | 0 0 | 8.89 7.18 | 0 0 | 12.99 12.99 |
| STRIDE 3 [37,40,41] | |||||
| Chain A Chain B | 69.06 69.06 | 0 0 | 15.70 14.52 | 0 0 | 12.48 12.82 |
| X-ray analysis [37,42] | 68.8 | 7.3 | 2.1 | 21.8 |
| Time, sec | α-Helix, % | β-Sheet, % | β-Turn, % | Random Coil, % | Intermolecular β-Sheet, % |
|---|---|---|---|---|---|
| 0 | 69 ± 2 | 13 ± 2 | 14.5 ± 2 | - | 3 ± 2 |
| 30 | 56 ± 2 | 17 ± 2 | 16 ± 2 | 5 ± 2 | 6 ± 2 |
| 60 | 53 ± 2 | 18 ± 2 | 15 ± 2 | 6 ± 2 | 8 ± 2 |
| 90 | 57 ± 2 | 19 ± 2 | 12 ± 2 | 6 ± 2 | 5 ± 2 |
| 120 | 52 ± 2 | 18 ± 2 | 18 ± 2 | 5 ± 2 | 6 ± 2 |
| 150 | 57 ± 2 | 16 ± 2 | 17 ± 2 | 7 ± 2 | 3 ± 2 |
| 180 | 50 ± 2 | 17 ± 2 | 19 ± 2 | 8 ± 2 | 6 ± 2 |
| 210 | 52 ± 2 | 18 ± 2 | 14 ± 2 | 9 ± 2 | 6 ± 2 |
| 240 | 50 ± 2 | 21 ± 2 | 16 ± 2 | 8 ± 2 | 4 ± 2 |
| 270 | 47 ± 2 | 19 ± 2 | 17 ± 2 | 10 ± 2 | 7 ± 2 |
| 300 | 49 ± 2 | 20 ± 2 | 14 ± 2 | 10 ± 2 | 6 ± 2 |
| 330 | 49 ± 2 | 19 ± 2 | 17 ± 2 | 10 ± 2 | 5 ± 2 |
| 360 | 50 ± 2 | 18 ± 2 | 14 ± 2 | 13 ± 2 | 5 ± 2 |
| 390 | 51 ± 2 | 18 ± 2 | 11 ± 2 | 13 ± 2 | 6 ± 2 |
| 420 | 49 ± 2 | 19 ± 2 | 12 ± 2 | 14 ± 2 | 6 ± 2 |
| Time, sec | α-Helix, % | β-Sheet, % | β-Turn, % | Random Coil, % | Intermolecular β-Sheet, % |
|---|---|---|---|---|---|
| 0 | 69 ± 2 | 13 ± 2 | 15 ± 2 | - | 3 ± 2 |
| 30 | 62 ± 2 | 18 ± 2 | 15 ± 2 | 1.6 ± 2 | 5 ± 2 |
| 60 | 55 ± 2 | 21 ± 2 | 14 ± 2 | 5 ± 2 | 4 ± 2 |
| 90 | 55 ± 2 | 24 ± 2 | 11 ± 2 | 6 ± 2 | 4 ± 2 |
| 120 | 55 ± 2 | 22 ± 2 | 13 ± 2 | 5 ± 2 | 5 ± 2 |
| 150 | 59 ± 2 | 19 ± 2 | 12 ± 2 | 4 ± 2 | 5 ± 2 |
| 180 | 64 ± 2 | 19 ± 2 | 8 ± 2 | 3 ± 2 | 5 ± 2 |
| 210 | 69 ± 2 | 15 ± 2 | 11 ± 2 | 2 ± 2 | 4 ± 2 |
| 240 | 58 ± 2 | 24 ± 2 | 12 ± 2 | 2 ± 2 | 5 ± 2 |
| 270 | 69 ± 2 | 17 ± 2 | 9 ± 2 | 0 ± 2 | 5 ± 2 |
| 300 | 64 ± 2 | 16 ± 2 | 13 ± 2 | 2 ± 2 | 5 ± 2 |
| 330 | 67 ± 2 | 17 ± 2 | 11 ± 2 | 2 ± 2 | 5 ± 2 |
| 360 | 64 ± 2 | 19 ± 2 | 12 ± 2 | 0 | 5 ± 2 |
| 390 | 67 ± 2 | 16 ± 2 | 12 ± 2 | 0 | 5 ± 2 |
| 420 | 64 ± 2 | 18 ± 2 | 15 ± 2 | 0 | 6 ± 2 |
| Time, sec | α-Helix, % | β-Sheet, % | β-Turn, % | Random coil, % | Intermolecular β-Sheet, % |
|---|---|---|---|---|---|
| 0 | 69 ± 2 | 14.5 ± 2 | 13 ± 2 | 0 | 3 ± 2 |
| 30 | 59 ± 2 | 13 ± 2 | 20 ± 2 | 0 | 8 ± 2 |
| 60 | 63 ± 2 | 12 ± 2 | 20 ± 2 | 0 | 5 ± 2 |
| 90 | 58 ± 2 | 15 ± 2 | 20 ± 2 | 0 | 6 ± 2 |
| 120 | 61 ± 2 | 13 ± 2 | 18 ± 2 | 0 | 8.5 ± 2 |
| 150 | 61 ± 2 | 14 ± 2 | 20 ± 2 | 0 | 7 ± 2 |
| 180 | 60 ± 2 | 13 ± 2 | 19 ± 2 | 0 | 7 ± 2 |
| 210 | 62 ± 2 | 14 ± 2 | 19 ± 2 | 0 | 5 ± 2 |
| 240 | 58 ± 2 | 12 ± 2 | 22 ± 2 | 0 | 8 ± 2 |
| 270 | 61 ± 2 | 13 ± 2 | 20 ± 2 | 0 | 6 ± 2 |
| 300 | 59 ± 2 | 13 ± 2 | 20 ± 2 | 0 | 7 ± 2 |
| 330 | 60 ± 2 | 13 ± 2 | 21 ± 2 | 0 | 6 ± 2 |
| 360 | 60 ± 2 | 12 ± 2 | 19 ± 2 | 0 | 8 ± 2 |
| 390 | 60 ± 2 | 14 ± 2 | 19 ± 2 | 0 | 7 ± 2 |
| 420 | 62 ± 2 | 13 ± 2 | 18 ± 2 | 0 | 7 ± 2 |
| Temperature, °C | α-Helix, % | β-Sheet, % | β-Turn, % | Random Coil, % | Intermolecular β-Sheet, % |
|---|---|---|---|---|---|
| 25 | 69 ± 2 | 13 ± 2 | 14.6 ± 2 | 0 | 3 ± 2 |
| 90 | 30 ± 2 | 16 ± 2 | 13 ± 2 | 5.5 ± 2 | 35 ± 2 |
| Medium | α-Helix, % | β-Sheet, % | β-Turn, % | Random Coil, % | Intermolecular β-Sheet, % |
|---|---|---|---|---|---|
| Neutral | 30 ± 2 | 16 ± 2 | 13 ± 2 | 5.5 ± 2 | 35 ± 2 |
| Alkaline (1M KOH) | 13 ± 2 | 34 ± 2 | 23.6 ± 2 | 22 ± 2 | 6.6 ± 2 |
| Acidic (1M HNO3) | 23.7 ± 2 | 15 ± 2 | 10.5 ± 2 | 9 ± 2 | 37.7 ± 2 |
| Alcohol, mL | α-Helix, % | β-Sheet, % | β-Turn, % | Random Coil, % | Intermolecular β-Sheet, % |
|---|---|---|---|---|---|
| 0 | 61 ± 2 | 21 ± 2 | 14 ± 2 | 0 | 4 ± 2 |
| 30 | 60 ± 2 | 20 ± 2 | 16 ± 2 | 0 | 4 ± 2 |
| 60 | 62 ± 2 | 19 ± 2 | 11 ± 2 | 0 | 4.6 ± 2 |
| 90 | 62 ± 2 | 18 ± 2 | 14 ± 2 | 0 | 4 ± 2 |
| 120 | 63 ± 2 | 17.5 ± 2 | 13 ± 2 | 0 | 4 ± 2 |
| 150 | 64 ± 2 | 17 ± 2 | 13 ± 2 | 0 | 5.5 ± 2 |
| 180 | 63 ± 2 | 20.6 ± 2 | 14 ± 2 | 0 | 2.5 ± 2 |
| 210 | 62 ± 2 | 21 ± 2 | 13.5 ± 2 | 0 | 2.7 ± 2 |
| Alcohol, mL | α-Helix, % | β-Sheet, % | β-Turn, % | Random Coil, % | Intermolecular β-Sheet, % |
|---|---|---|---|---|---|
| 0 | 61 ± 2 | 21 ± 2 | 14 ± 2 | 0 | 4 ± 2 |
| 30 | 63.6 ± 2 | 19 ± 2 | 13.6 ± 2 | 0 | 4 ± 2 |
| 60 | 63 ± 2 | 20 ± 2 | 12 ± 2 | 0 | 4 ± 2 |
| 90 | 61.6 ± 2 | 20 ± 2 | 14.5 ± 2 | 0 | 4 ± 2 |
| 120 | 60 ± 2 | 21.5 ± 2 | 14.4 ± 2 | 0 | 4 ± 2 |
| 150 | 63 ± 2 | 20 ± 2 | 14 ± 2 | 0 | 2.6 ± 2 |
| 180 | 62 ± 2 | 22.4 ± 2 | 12.5 ± 2 | 0 | 3 ± 2 |
| 210 | 64 ± 2 | 18 ± 2 | 14.5 ± 2 | 0 | 3 ± 2 |
| Medium | α-Helix, % | β-Sheet, % | β-Turn, % | Random Coil, % | Intermolecular β-Sheet, % |
|---|---|---|---|---|---|
| Alcohol-free | 30 ± 2 | 16 ± 2 | 13 ± 2 | 5.5 ± 2 | 35 ± 2 |
| Octanol-1 (3%) | 43 ± 2 | 15 ± 2 | 13 ± 2 | 2.7 ± 2 | 26 ± 2 |
| Isopropanol (6%) | 37 ± 2 | 13.5 ± 2 | 10 ± 2 | 8 ± 2 | 32 ± 2 |
© 2019 by the authors. Licensee MDPI, Basel, Switzerland. This article is an open access article distributed under the terms and conditions of the Creative Commons Attribution (CC BY) license (http://creativecommons.org/licenses/by/4.0/).
Share and Cite
Usoltsev, D.; Sitnikova, V.; Kajava, A.; Uspenskaya, M. Systematic FTIR Spectroscopy Study of the Secondary Structure Changes in Human Serum Albumin under Various Denaturation Conditions. Biomolecules 2019, 9, 359. https://0-doi-org.brum.beds.ac.uk/10.3390/biom9080359
Usoltsev D, Sitnikova V, Kajava A, Uspenskaya M. Systematic FTIR Spectroscopy Study of the Secondary Structure Changes in Human Serum Albumin under Various Denaturation Conditions. Biomolecules. 2019; 9(8):359. https://0-doi-org.brum.beds.ac.uk/10.3390/biom9080359
Chicago/Turabian StyleUsoltsev, Dmitrii, Vera Sitnikova, Andrey Kajava, and Mayya Uspenskaya. 2019. "Systematic FTIR Spectroscopy Study of the Secondary Structure Changes in Human Serum Albumin under Various Denaturation Conditions" Biomolecules 9, no. 8: 359. https://0-doi-org.brum.beds.ac.uk/10.3390/biom9080359