1. Introduction
Since the invention of the first telemanipulator system in the 1940s [
1], teleoperation has played an important role in the nuclear industry for tasks such as handling, maintenance and decommissioning [
2,
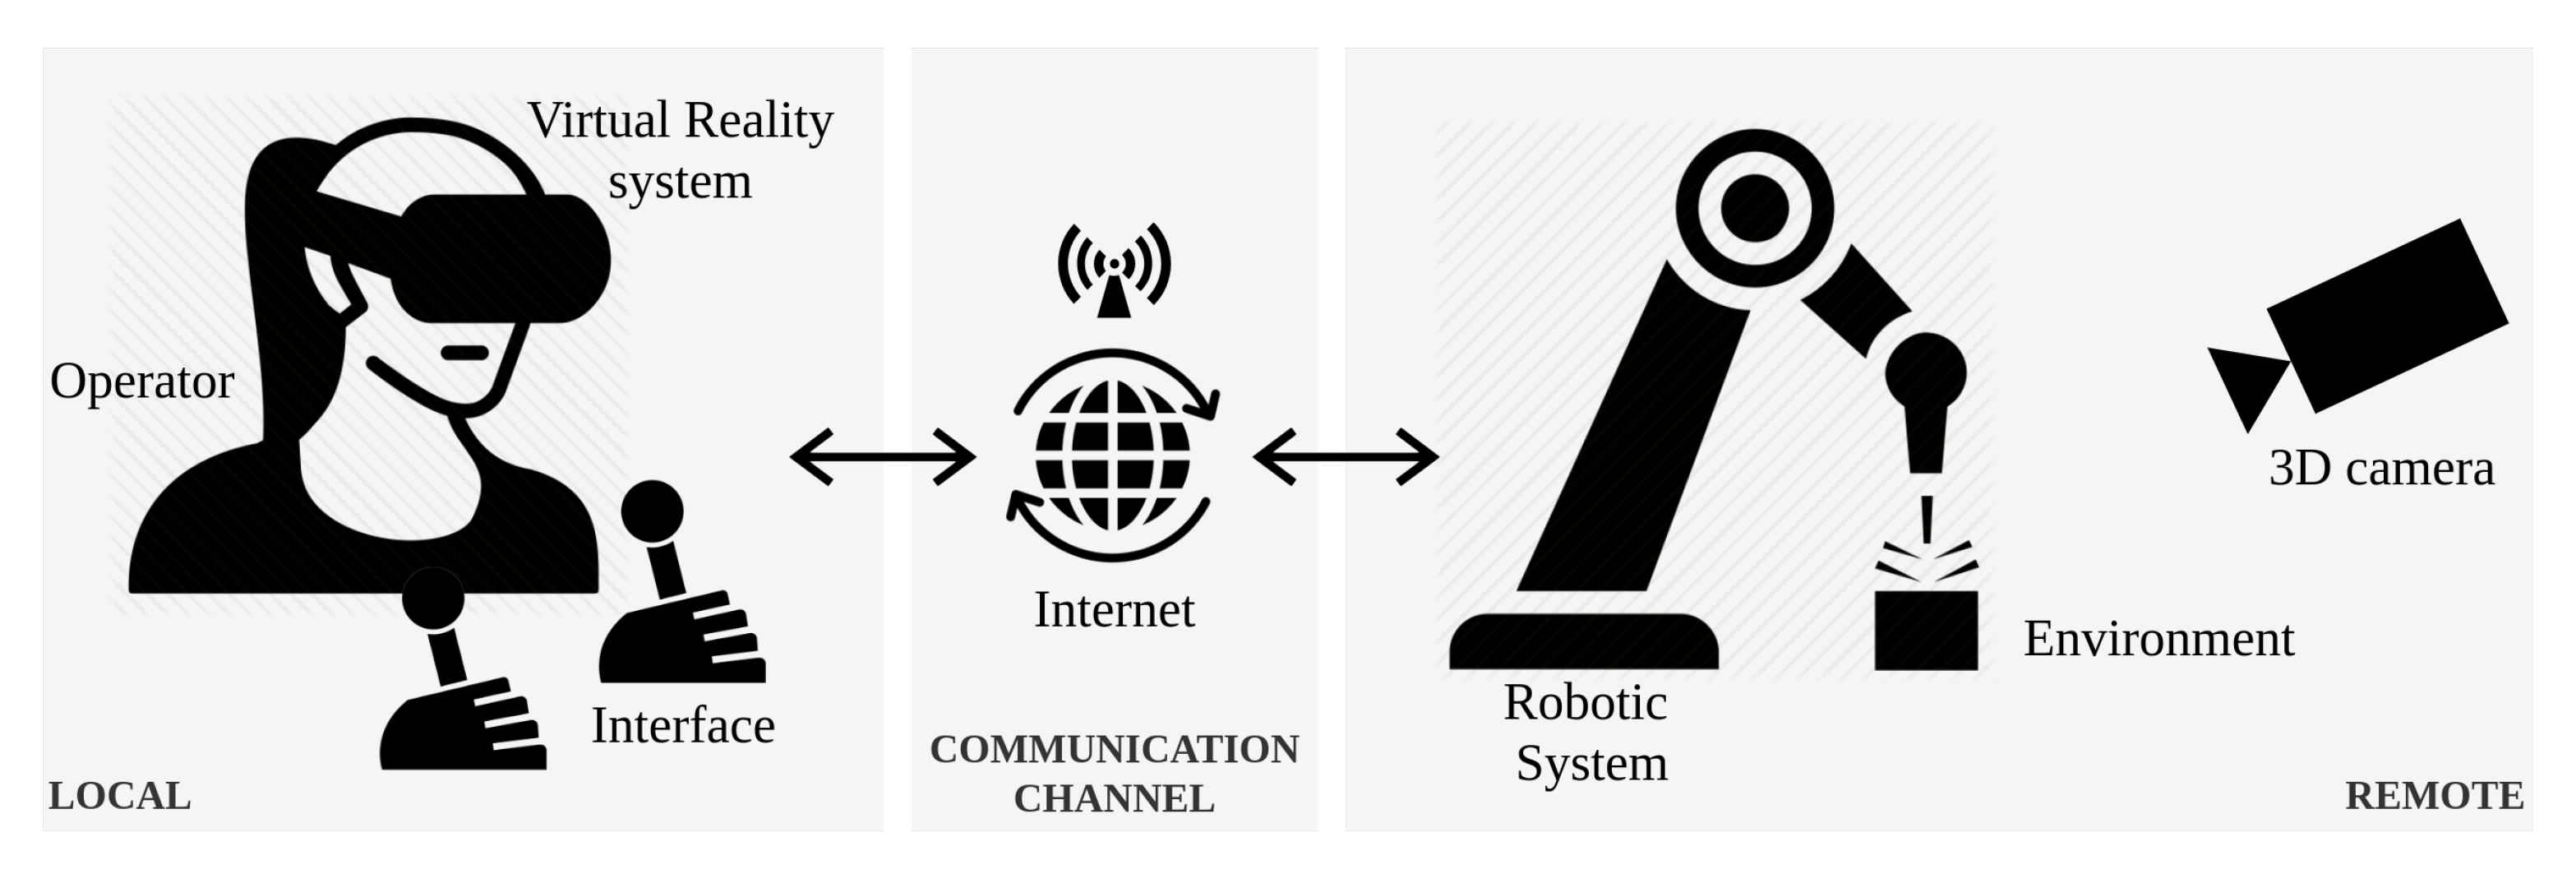
3]. Teleoperation enables a user to manipulate objects remotely, and an increased level of immersion (i.e., as if the operator is located at the remote site) can increase the safety and reliability of the operations. A typical teleoperation system has the means (e.g., an interface between the operator and the manipulated in situ objects such as a joystick or haptic pen) to allow the operator to provide motion commands to the robotic system performing the actual task in situ, as shown in
Figure 1. This interface may be a replica of the device that is deployed in the remote environment [
4]. Such interface devices can be controlled in a unilateral or bilateral fashion. On the one hand, unilateral control refers to a situation where one side follows the position or forces of the other. On the other hand, bilateral control is a scheme where both the interface and robotic systems feed-back to each other in a closed-loop architecture.
The main aspects of teleoperation are: stability and telepresence [
4]. The former relates to the stability of the closed-loop system and its capability to cope with undesired user behaviour and external disturbances. The latter consists of providing the user with an adequate sense of immersion in the remote environment. In fact, the knowledge of the environment surrounding the remote manipulator is of utmost importance to carry out manipulation tasks and especially to avoid collisions. Although stability and telepresence are equally important and necessary, in this paper, we primarily focus on the latter by enhancing the operator’s viewing system with up-to-date physical models located in the remote environment.
In teleoperation, the feeling of
being there is achieved by enhancing the user experience with sensory stimuli provided by sensors located on the remote side. Studies have shown that such a feeling is highly dependent on the capability of the system to provide a detailed visualisation of the remote environment, while alleviating the effects of field of view, reference frame, frame rates and system latency [
5]. Particularly for viewing systems, video cameras have been the first choice for remote visualisation for decades [
6,
7]. Given the amount of research and development already conducted on the optimisation of image/video transmission over the Internet, video cameras can easily be identified as a mature and reliable technology. Working group alliances such as the Moving Picture Experts Group (MPEG) have set the solid grounds for the standardisation of compression codecs for this type of information [
8].
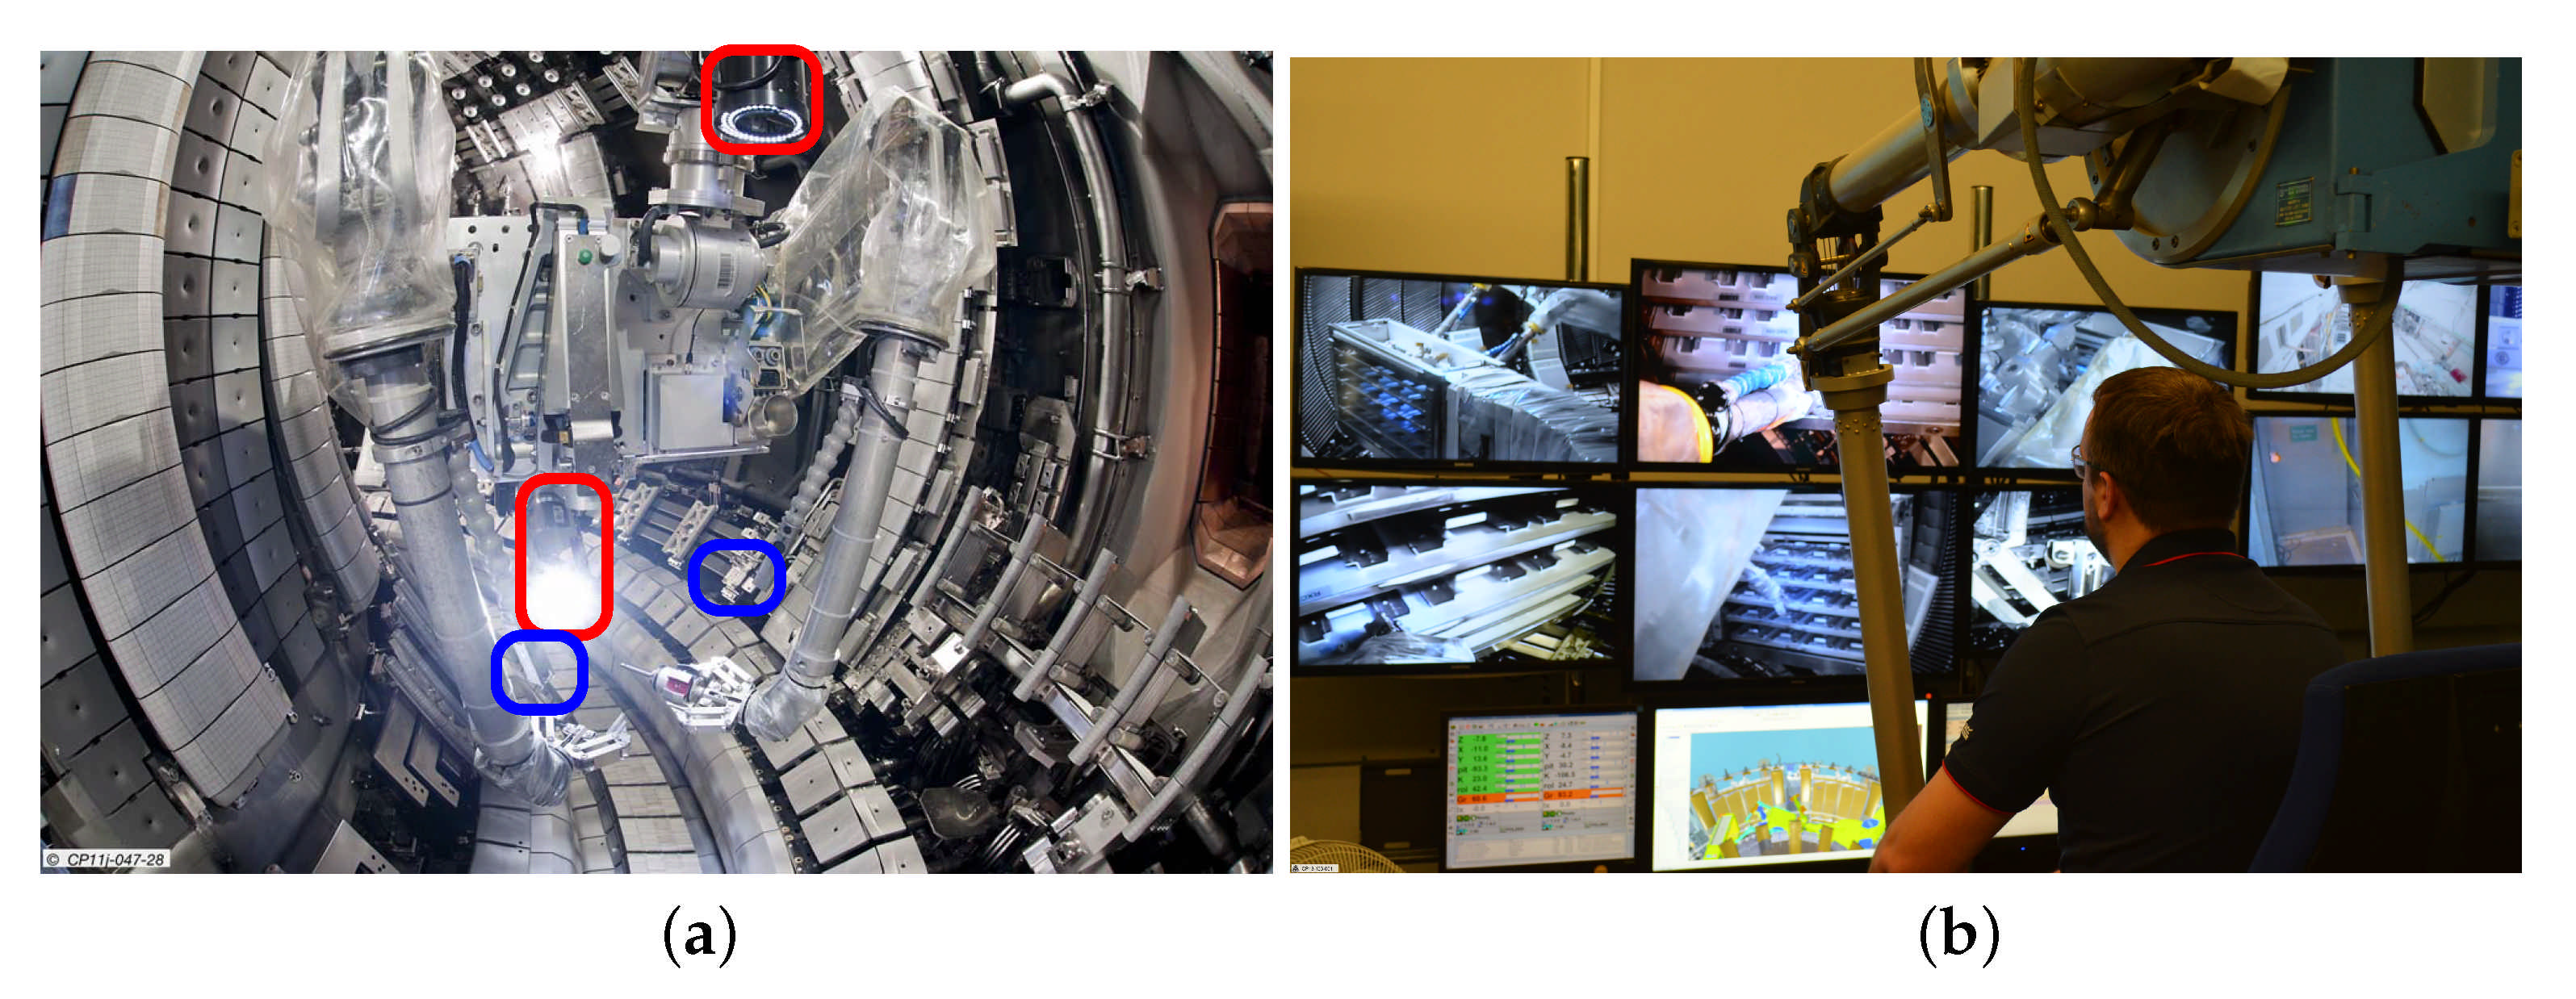
Although video cameras are practical and easy to use, there are still multiple and important challenges associated with the viewing experience of the user. To exemplify this, we can consider the remote handling system of the Joint European Torus (JET) shown in
Figure 2. The robotic device shown in
Figure 2a called MASCOT (Italian: MAnipulatore Servo COntrollato Transistorizzato) [
9] is a teleoperated dual-arm robotic manipulator with seven degrees-of-freedom (DOF), built in the 1960s and currently used for maintenance and handling tasks inside JET’s vacuum vessel. More information about the remote handling system of JET can be found in [
2]. The onboard viewing system of MASCOT consists of two high-definition (HD) and two ancillary cameras. The HD cameras, highlighted in red in
Figure 2, are mounted above and behind the operative area. The ancillary cameras are mounted on each one of the arms, aiding the operator with closer views. This viewing system transmits real-time image/video information to the remote operators located in the control room, as shown in
Figure 2b.
Remote handling using the aforementioned (teleoperation and viewing system) setup is a long, slow process that requires extensive training for operators to become competent and long hours to accomplish tasks associated with maintenance and inspection. Among others, it is possible to highlight three main causes related to the viewing system: lack of depth perception, inadequate camera location and/or placement limitations, and occlusions [
10]. The perception of depth is related to the ability to perceive the environment in 3D, providing the operator with a better understanding of the environment and its constraints; this is crucial when handling highly sophisticated and expensive pieces of equipment. In addition, due to mechanical constraints, it is not always possible to adequately position the cameras. Even when possible, the spatial orientation perceived by the operator may be difficult to relate with regards to the actual positioning of the remote handling equipment. Furthermore, occlusions of target objects may forbid the user safely conducting certain tasks. Having said this, it appears obvious that there is a need for a 3D virtually enhanced viewing system to counteract the aforementioned issues.
Recent developments in computer graphics have allowed to replace or improve video-based systems with virtual reality augmented ones [
6,
11]. A virtual reality (VR) system consists of an interactive computer simulation capable of enhancing the human sensory system, particularly the viewing system, providing feedback in such a way that the operator can perceive the feeling of being immersed in the simulation [
12]. The applications of VR in the industry are diverse [
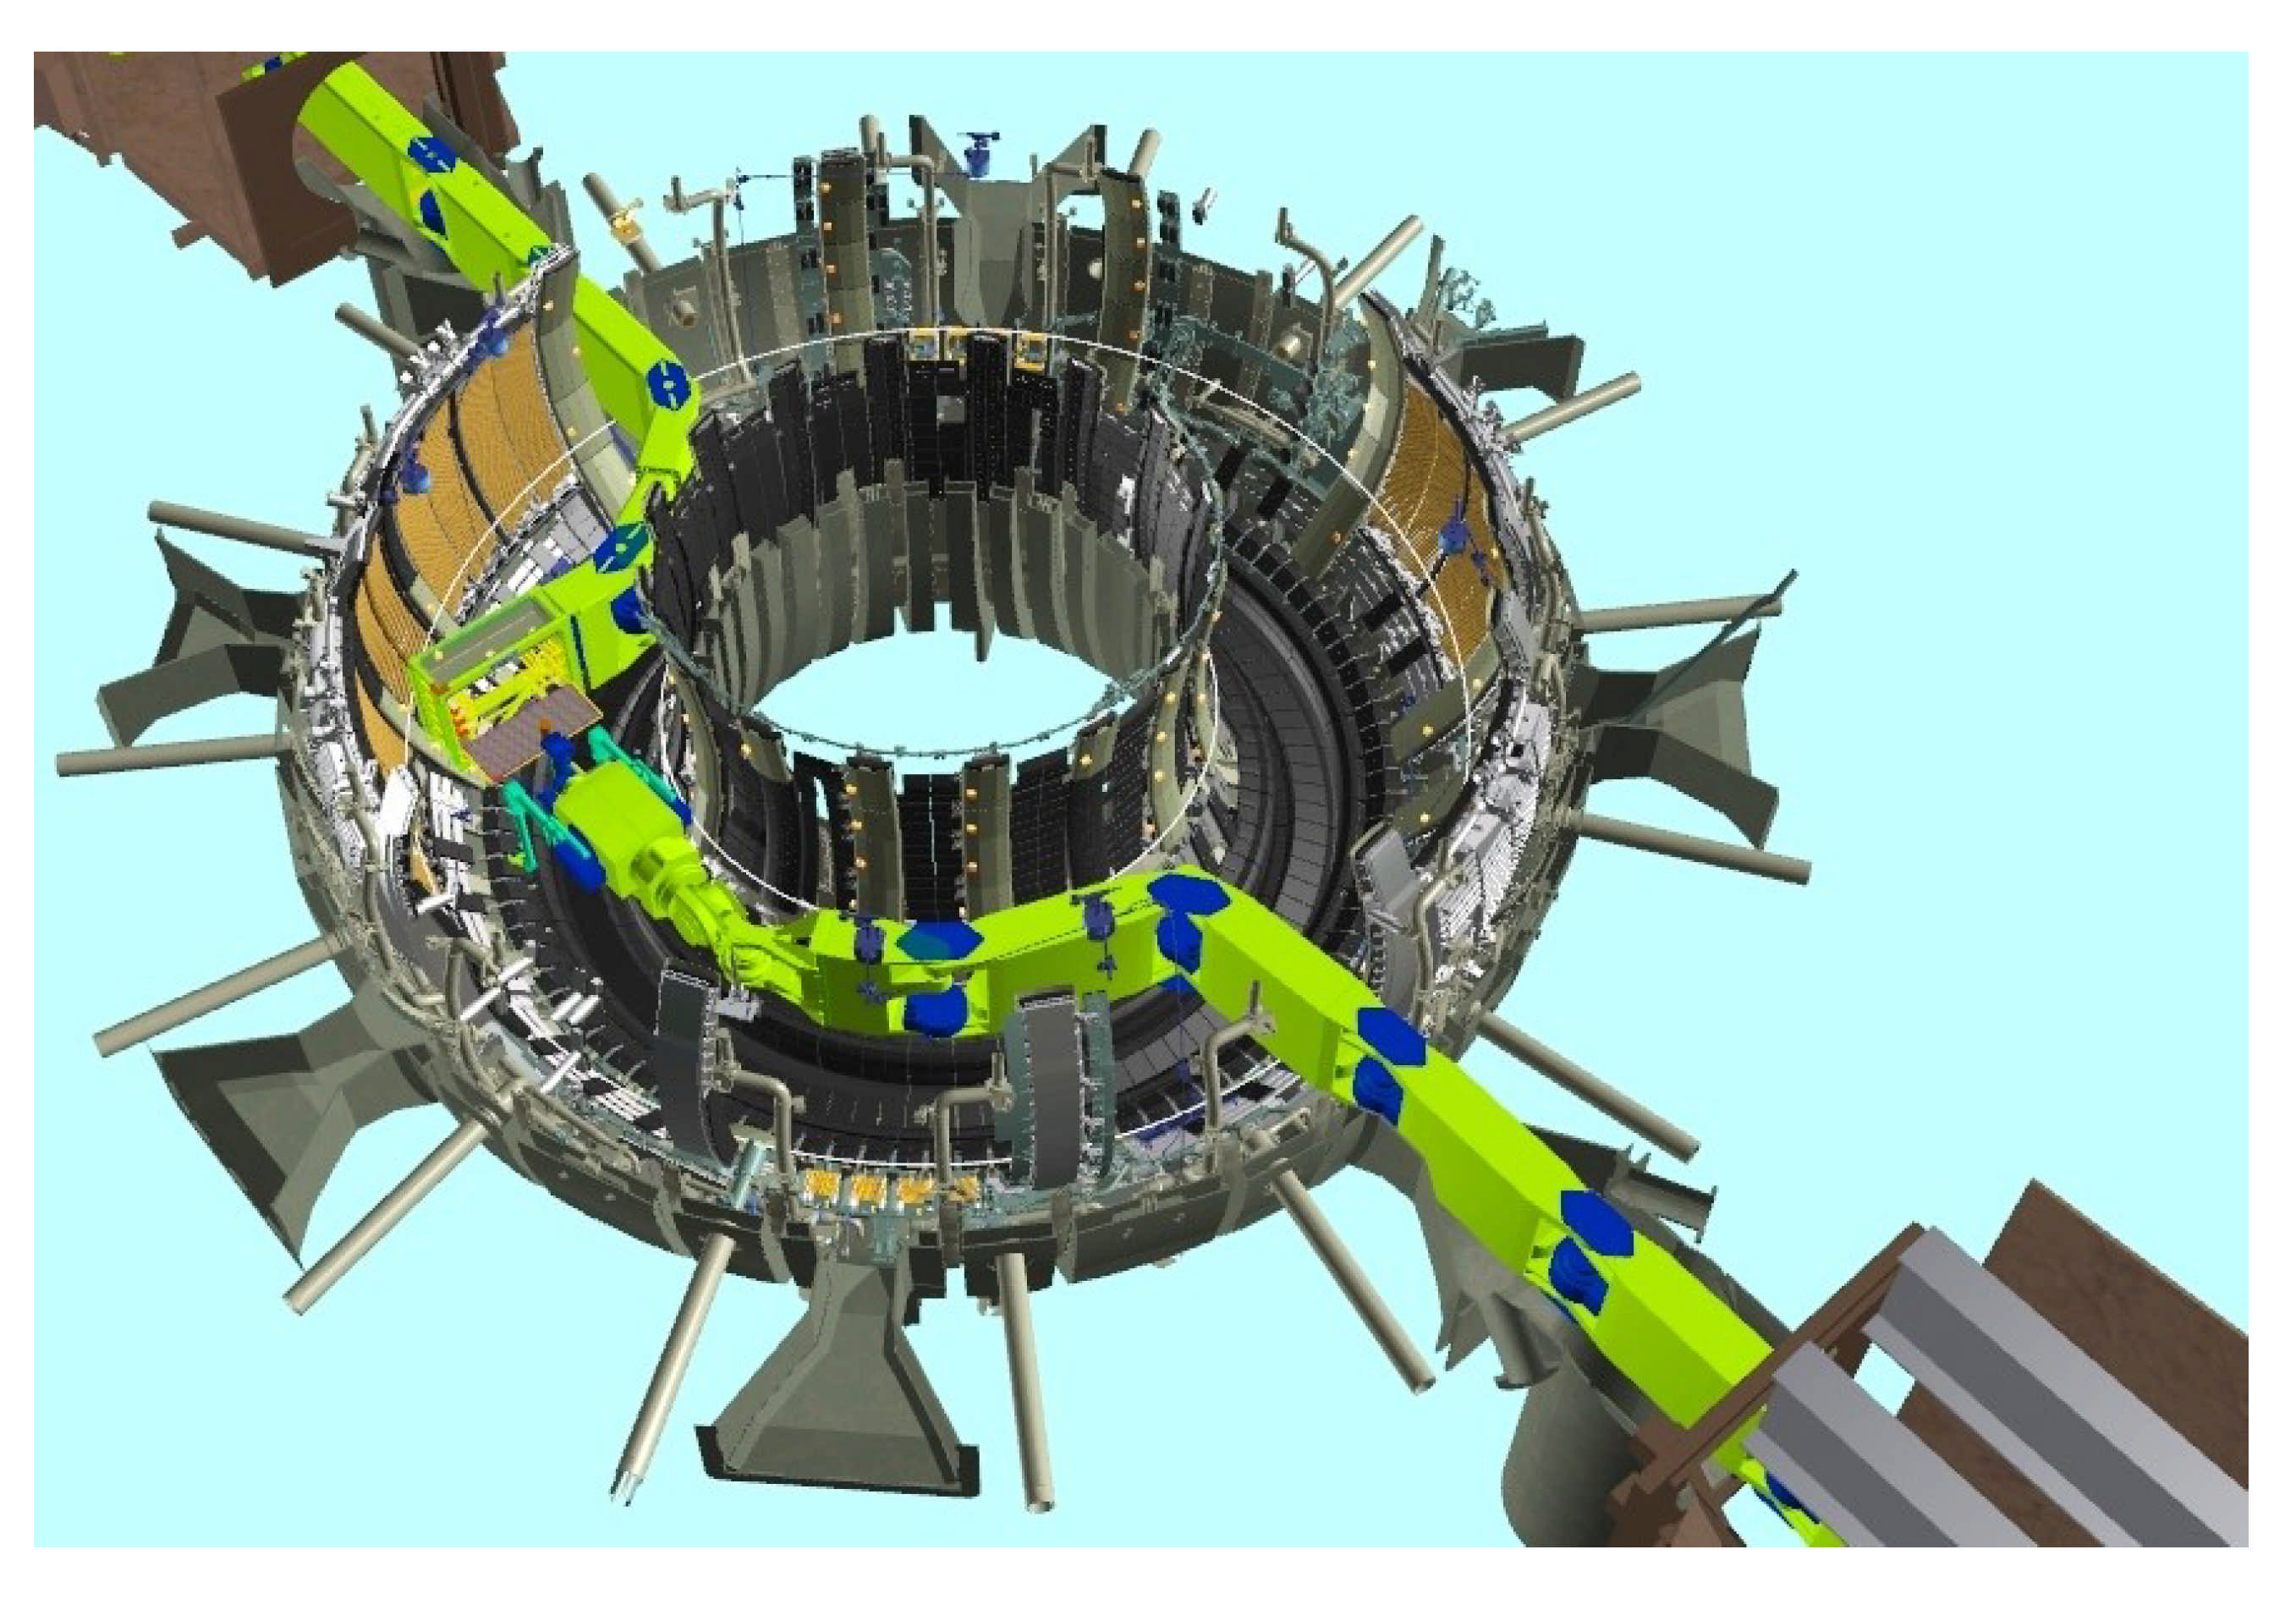
13], e.g., the simulation of mechatronic systems, training, prototyping assembly tasks and design assessment, to mention a few. Moreover, VR has been used in JET as an approach trying to solve the lack of depth perception when performing remote operations and training. A real-time VR replica of the teleoperated system interacting within JET’s inner vessel (environment) has been used as part of the viewing system for operators to benefit from the depth perception [
6] in addition to its other uses (e.g., simulate and validate positional info), as shown in
Figure 3. Moreover, several studies and developments are being conducted for the integration of VR on the next generation viewing system for ITER [
14,
15].
The models of objects in VR systems are required to enclose a description of its behaviour which can be static or Newtonian [
12]. The former relates to motionless objects lacking interaction and used for visualisation purposes only; the latter to objects that are governed by physics laws present in the real world. What is more, these objects are required to be known in advance, meaning that any unforeseen changes on the real scenario may not be captured in the virtual replica causing unexpected behaviours which can lead to disastrous collisions. It is then necessary to utilise live 3D feedback information to update or augment the virtual world accordingly.
Modern developments on 3D cameras, commonly addressed as RGB-D sensors (which stands for red, green, blue and depth), allow the gathering of point cloud frames (a point cloud is a collection of points in the Euclidean space
often consisting of multiple attributes such as colour, texture and normal) consisting of millions of high-density points with a high-precision of ∼0.06 mm at fast acquisition rates capable of providing an outstanding insight of the environment. Unfortunately, this vast amount of data represents a significant burden for communications (e.g., a point cloud with ∼700 k points per frame at 30 frames per second (fps) would require a bandwidth of approximately 500 MB/s [
16]) and becomes a problem when minimum specifications in teleoperation require updates no more than 100 ms [
5,
11]. Moreover, the adverse effects on the transmission time escalate for worse in scenarios where the operator and the telemanipulator are located at geographically distant locations.
Having said this, the aim of this work was to develop a novel technique for transmitting dense data such as point clouds data across remote locations for teleoperation. This technique is built upon tree-like structures for codification and decodification enhanced with a novel hierarchical, multiple level-of-detail compression which allows varying the resolution of sections of a single frame. Furthermore, a comparison against raw point cloud data transmission and a codification strategy previously proposed by the authors is provided. This paper is organised as follows: in
Section 2, current developments on 3D data compression and transmission are discussed;
Section 3 provides the theoretical background related to tree-based codification structures. In
Section 4, our proposed multiple level-of-detail compression approach is presented, while the analysis and assessment of the results is covered in
Section 6. Finally, the conclusions and future work are discussed in
Section 7.
2. Related Work
Depending on the type of sensor and the application, point clouds can be classified as static or dynamic. Static point clouds do not change over time and they are commonly used for the preservation of 3D information and on-demand visualisation. A point cloud is considered dynamic when it can change at every frame without necessarily maintaining a direct relationship from one frame to the other. Dynamic point clouds are commonly used for real-time visualisation, mapping, recognition, etc. Due to our application, we focus on dynamic point clouds rather than on static ones.
The need for the integration of dynamic real-time point clouds in virtual and augmented reality applications have increased in recent years. However, the main drawback for real-time visualisation is the large amount of data that is required to be transmitted. An average of 500 MBps are required to transmit an average of 800 k points in colour at a relatively visually acceptable rate [
16].
Although several point cloud compression (PCC) techniques have been investigated, we focused our research on those that relate the most to our application. Existing techniques can be classified into either deep-learning- and geometrical-based. Deep learning techniques are relatively recent and aim to identify salience attributes on point clouds to generate a codified latent space representation. Geometrical approaches aim to explore the spatial relationship of the points for further codification (e.g., serialised, projected, etc.).
2.1. Deep-Learning Approach
In recent years, several deep-learning techniques have been developed for point cloud codification in latent space. According to [
17], one of the main techniques consists of the usage of autoencoders (AE) based on 3D convolutional neural networks to compress point cloud geometry [
18,
19,
20]. Some of these techniques combined autoencoders with octrees by exploding the characteristics of tree structures during codification [
21,
22].
Most of these techniques take the early MPEG’s implementations of V-PCC and G-PCC as grounds for comparison, taking into consideration parameters such as compression rates, algorithm complexity, distortion (point-to-point and point-to-plane), codification size, time, etc. Although experiments showed an improved reconstruction accuracy, due to the low distortion rates and high compression ratios, the computational time is far from being applicable in teleoperation scenarios. Moreover, some methodologies require highly specialised processing units to perform training and provide reasonable inference times.
2.2. Geometrical Approach
The vast amount of PCC research and the need for standardisation were brought to the attention of the Moving Picture Experts Group (MPEG), which in 2017, launched a call for PCC proposals to define the ISO/IEC 23090-5 and -9 standards [
23]. The proposal defined two main approaches: video-based compression (V-PCC) and geometry-based compression (G-PCC) [
24].
V-PCC consists of the projection of 3D point clouds into 2D images, therefore taking advantage of the well-developed video compression techniques. Schwarz et al. [
25] proposed a methodology for decomposing a point cloud in patches by grouping points with similar normal directions. These groups were then mapped onto the local planar surface defined by the mean of the calculated normals. Similar approaches consisted in the projection of point clouds onto a grid for further clustering (patching) and parameterisation [
26]. In [
27], projection was based on the 2D plane obtained through principal component analysis and in [
28], multiple synthetic camera views were considered to build the projected image.
G-PCC encodes geometrical information associated with the location of each point in the 3D space using data structures, such as octrees (discussed in more detail in
Section 3.1), kd-trees and binary trees. Investigations presented in [
24] showed that G-PCC is more suitable for sparse point clouds in comparison with V-PCC, which applies to most real-time data acquisition applications. At the time of this writing, both V-PCC and G-PCC standards are still under development [
29,
30].
However, octree structures are the primer technology used for the codification of point clouds in a geometrical fashion, and multiple case-dependent adaptations have been proposed for a variety of applications. In [
31], a local 2D parameterisation approach that considers incrementally acquired data compression is proposed, even though this approach is mainly aimed at the codification of large data sets for sites scan preservation, the authors provided validation data for smaller scenarios which show promising results. A similar approach based on progressive encoding and decoding can be found in [
32]. In terms of mapping and collision detection, a statistical sensor data integration approach based on octrees is presented in [
33]. Research has focused not only on the structure of the tree but also on the improvement of the bit-level tree codification by exploring relationships between neighbouring leaves [
34], which may result as beneficial for reducing the compressed point cloud size; however, this technique is still under revision and consideration for the G-PCC MPEG standard.
The level of detail used by the PCC has also been investigated in [
35,
36,
37]. In these approaches, the LoD corresponds to the depth of the octree generated from the whole point cloud. Other attributes such as normals and colour are obtained by averaging the values that fall within a certain leaf at a determined level. Although this variation in LoD is beneficial for real-time transmission, the LoD is homogeneously applied to the point cloud, hence the resolution of important elements of the scene may lack in detail. In this sense, our approach outperforms these methods by increasing the resolution of those elements that are more relevant. A comprehensive comparison and schematic grouping of other geometrical methods for PCC can be found in [
16] for further reading.
In summary, it is well known that the construction of octree structures using high levels of detail may be resource and time consuming, particularly on sparse, dynamic point clouds where real-time data transmission is required. Although multiple variations and improvements for codification using octrees have been proposed, our implementation for application in remote handling scenarios focuses on prioritising the parts of the scene that are considered more relevant than others. This is reflected in the smaller sizes of transmitted message, which signify lower transmission times allowing higher update frame rates. This in comparison with the transmission size of raw point clouds or even compressed ones. However, in this work, we built on the octree implementation described in
Section 3, and it is worth mentioning that our proposed technique is not necessarily tied to a particular octree implementation. Hence, there is potential for adaptation to other application scenarios.
It is important to highlight that our approach stems from the viewing needs of operators in real nuclear facilities, where visualising up-to-date information of the remote environment is mandatory.
3. 3D Data Compression
As mentioned before, the remote teleoperation of sophisticated and potentially hazardous equipment demands fast and accurate visualisation, hence requiring prioritisation on computation and transmissions time. Furthermore, it is important to consider that in real teleoperation scenarios, there may not be enough information about in situ objects (e.g., CAD, pose, type, geometry, etc.). A good 3D viewing system should be able to support the operator’s decision process by projecting and enhancing the available information.
The compression strategy proposed in this paper builds upon the codification via tree-like structures, more specifically, octrees. Therefore, before going into the implementation details, it is important to provide the basic foundations of the backbone of our compression strategy.
3.1. Octrees
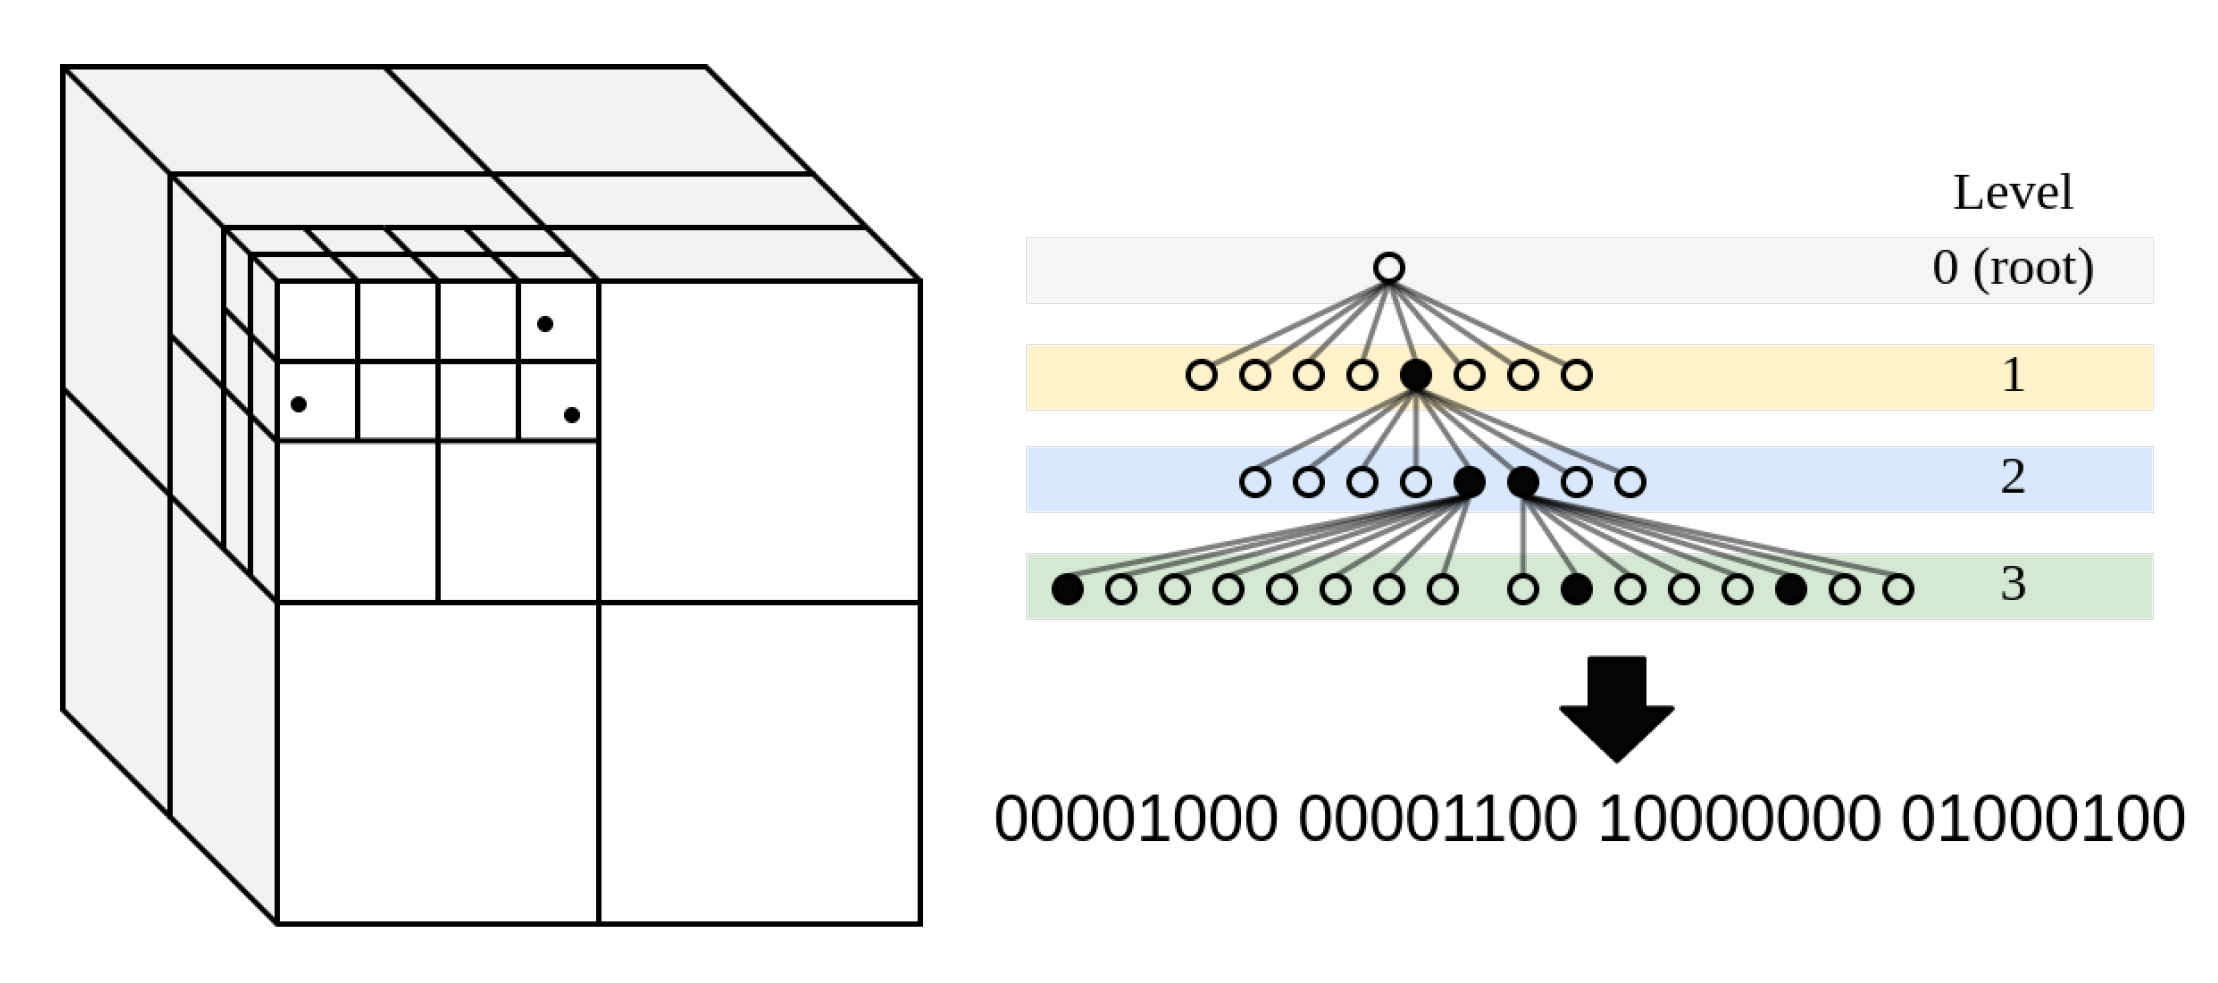
An octree allows the partition of a set of unordered, sparse points into a tree-like data structure. The construction of an octree consists of dividing the space defined by the minimum enclosing box, known as the root node, into eight equally sized boxes. Each of these boxes is then subdivided into other eight boxes, etc., until a certain resolution is reached. From this point, it is necessary to orderly traverse the tree from lower to higher depth levels, assigning the corresponding child leaf to every branch, as shown in
Figure 4. The eight-element node subdivision has the advantage that each of these nodes can be represented with 8 bits, hence a byte. For colour codification, the colour of all points contained within each one of the smallest nodes (highest level) is normalised with respect to the colour band present within the node. Then, each point is normalised with respect to this band, and this value is codified together with the binary tree. Other information such as three depth and traversing order can be added to the header of the serialised stream of bytes, hence providing the decoder with information on how to handle and decode the information received.
For this work, we used the octree implementation in [
38], which also performs the codification of colour, normal vectors and other texture values.
Similar to octrees, kd-trees are a tree-like structure for data partitioning. In contrast to octrees, the partition of the boxes is not evenly performed along the three axes. The partition, by means of hyperplanes, is computed along each axis considering statistical distribution values such as the median using algorithms such as quick sort [
39]. A comparison between octrees and the kd-tree for fast codification applications can be found in [
37], where experimental results showed that octrees provide a better performance in terms of compression ratio and serialised message size than its kd-tree counterpart.
3.2. Single Level-of-Detail Compression
In [
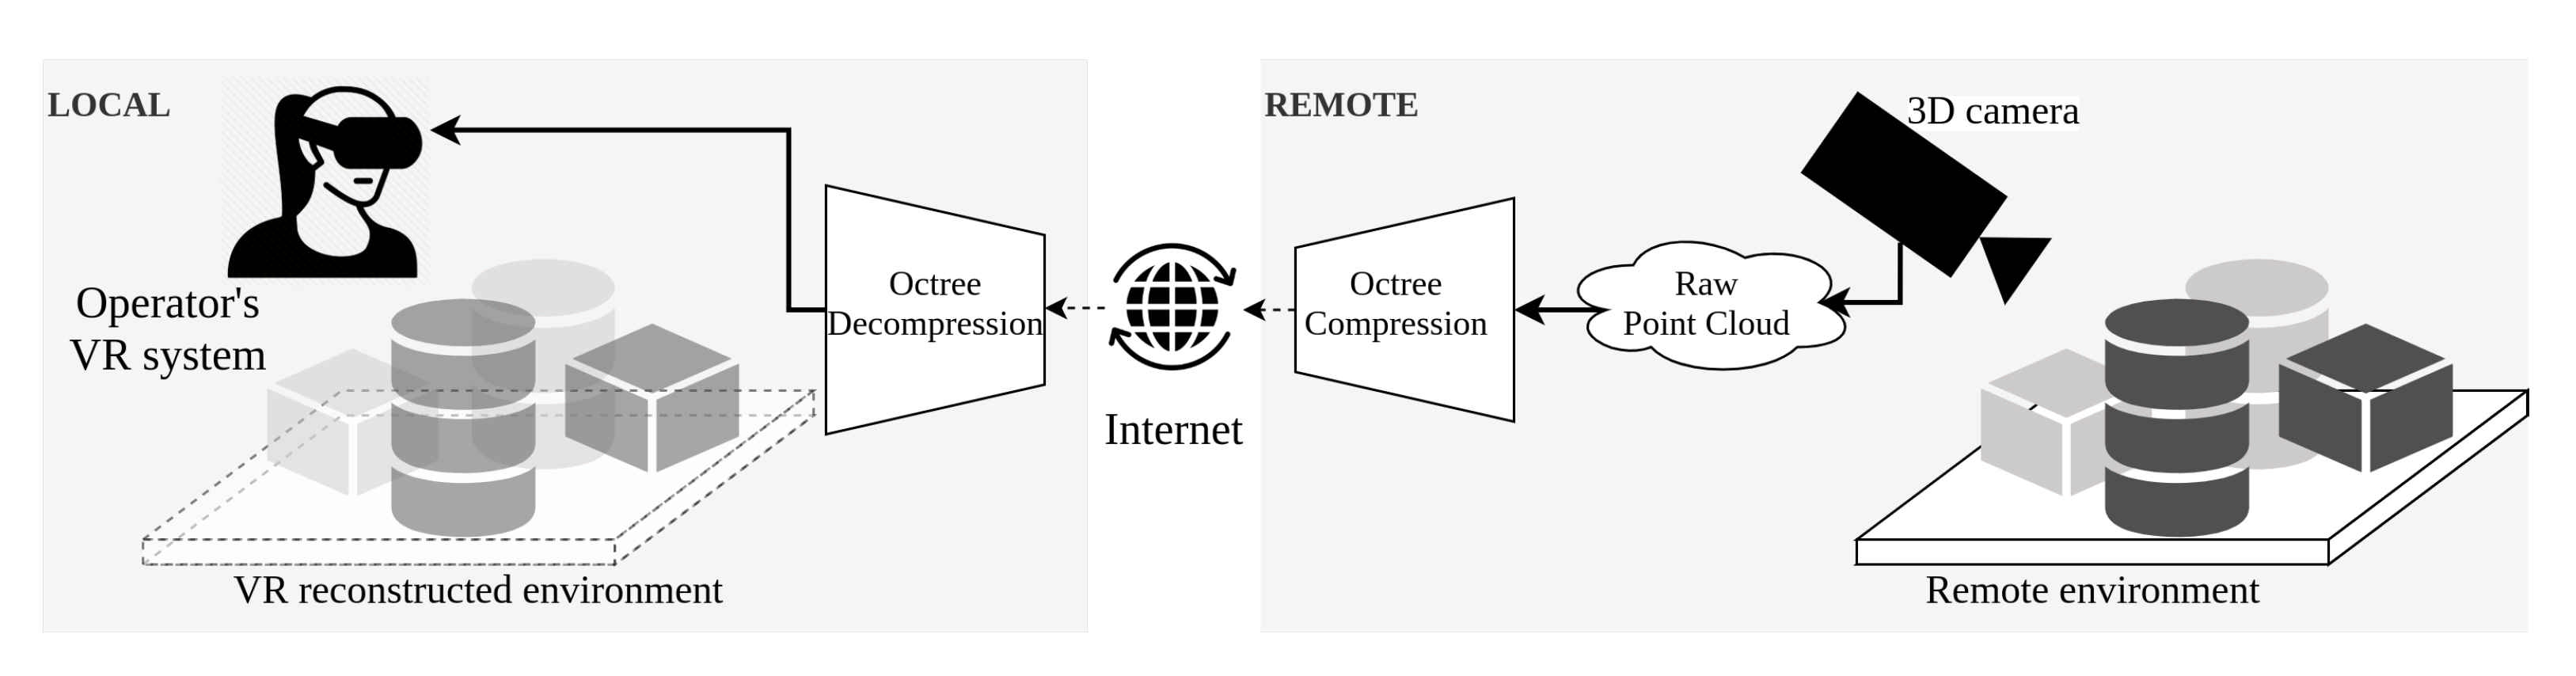
37], the corresponding author proposed an octree-based, whole-scene PCC, able to vary the level of compression during run time based on user requirements. In this paper, we refer to this approach as single LoD compression due to the fact that codification is performed over the whole point cloud frame with no distinction between sets or subsets of points. A schematic diagram of this approach is shown in
Figure 5.
The implementation was conducted within the robot operating system (ROS) middleware framework using a local area network. Comparisons were made using two 3D cameras with a different number of points, resolution, density and quality. Moreover, a kd-tree compression using the implementation in [
40] was compared against the octree implementation. Results showed that the octree codification strategy offered faster computational times at a cost of lossy data codification. Moreover, it was possible to conclude that for the static, storage or partial query of point clouds, the kd-tree implementation offered better performance.
The nature of our application regarding the real-time data transmission and the trade-off between quality and computation time led us to continue our research using octree structures. For the experiments conducted in this paper, we used a subset of the most relevant compression profiles analysed in [
37], which are listed in
Table 1.
4. Multiple Level-of-Detail Compression
Although experiments conducted in [
37] demonstrated a good performance in compression size and transmission time, we identified opportunities for the improvement of the compression algorithm. To begin with, not all the information has the same level of relevance within the scene. For instance, objects located on the surface of interaction are more important than the surface itself or the walls. Moreover, some objects may be considered more important than others due to their hazardous or fragile nature. Assuming some objects have a higher level of importance than the others, bandwidth usage could be optimised by exploring the compression of the scene in a heterogeneous fashion. This can provide a higher resolution to specific objects in the scene, whilst reducing resolution to others that may be less relevant.
The general overview of the multiple level-of-detail point cloud compression is shown in
Figure 6. The pipeline consists of five main blocks: A. point cloud acquisition; B. geometrical clustering; C. compression and packaging; D. decompression; and E. rendering and visualisation. An extra block, labelled as F., is also shown and represents the parameter configuration interface.
4.1. Point Cloud Acquisition
First, the raw point cloud data are obtained using a 3D sensor at the remote location. It is worth noticing that no data pre-processing is considered in order to prevent any extra delays in the processing pipeline. However, if ultra-high-resolution cameras are used (e.g., >2 M points) pre-processing is recommended. Most of the currently available 3D cameras provide on-board pre-processing capabilities such as down-sampling, attenuation, cropping and outlier removal. Some devices even provide an intermediate layer between the camera and the output using field-programmable gate arrays (FPGAs) for high frame rate pre-processing stages; an example of this can be found in the SceneScan Stereo Vision Sensor System by Nerian.
Another element to consider is the merging of point clouds coming from multiple cameras. This is possible and even recommended in most scenarios. However, the output of fusion information coming from two or more cameras with different acquisition capabilities may result in an unevenly distributed point cloud, i.e., variations in density. Unfortunately, the analysis of the effects of sensor fusion for this algorithm of compression is out of the scope of this work. For the sake of simplicity, this work considers the use of a single 3D camera on the experiments.
4.2. Cluster Segmentation
The point cloud undergoes an Euclidean clustering phase during which the point cloud is geometrically analysed and separated in multiple individual clusters, merely selected on the basis of the distance between the points. To accomplish this, we used the implementation proposed in [
41]. Due to the nature of this algorithm, clusters are expected to be physically separated from each other, therefore it is necessary to identify the set of points corresponding to the surface on which the objects are lying on.
Ground segmentation is achieved by performing a sample consensus fitting algorithm, which consists of iteratively proposing and evaluating a hypothesis of the parameters describing a specific mathematical model, in this case a plane. This is recursively done until the squared error of the distance from the model to a subset of the points satisfies a defined threshold. In this work, we use the progressive sample consensus (PROSAC) algorithm [
42], a variation of its predecessor random sample consensus (RANSAC). In most conditions, PROSAC has proven to be up to a hundred times faster than RANSAC. In the situation where the algorithm fails to find a plane that suits the desired conditions, e.g., the minimum number of points given a certain point-to-plane distance threshold, the whole point cloud is analysed in the search for clusters.
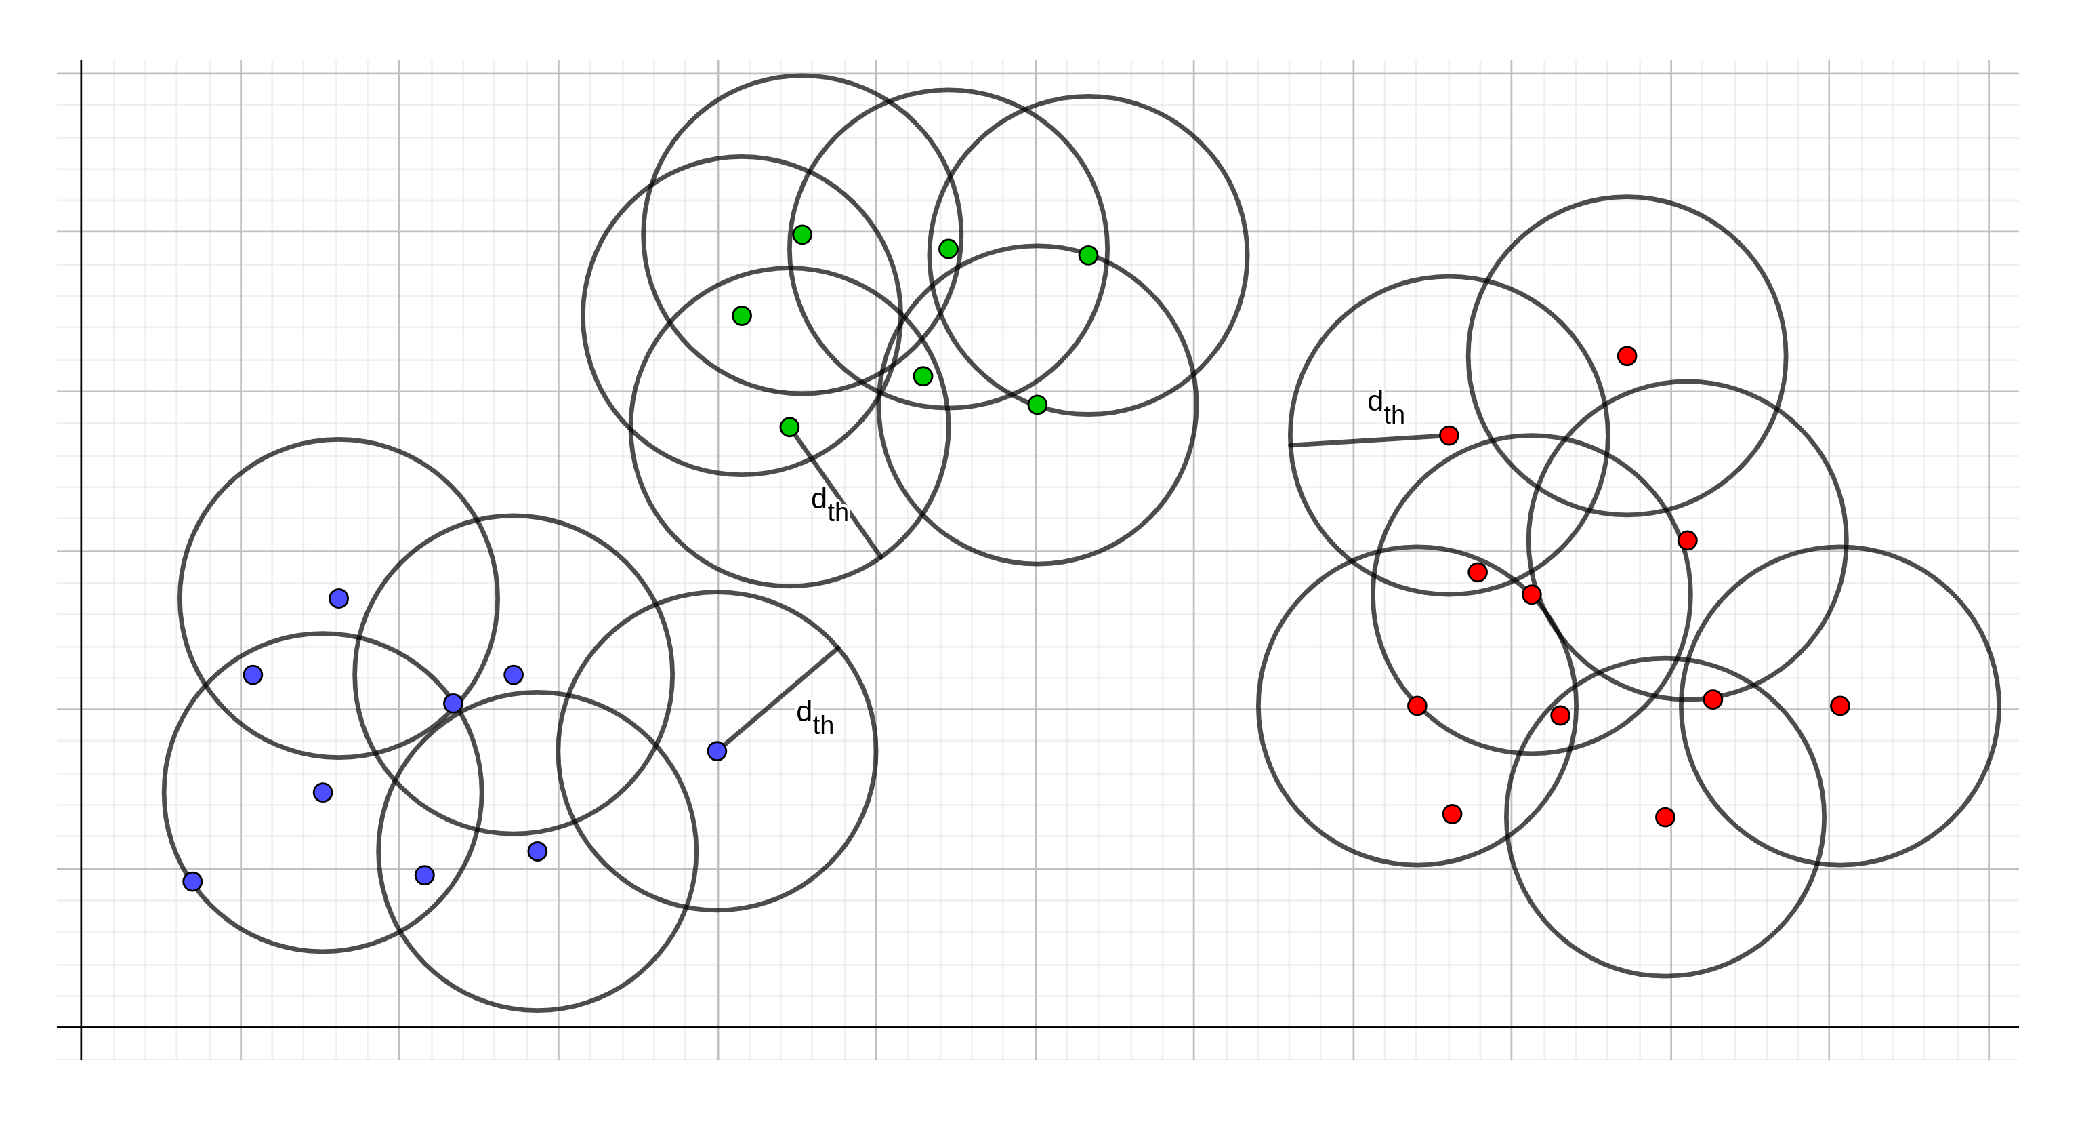
Once the ground has been identified, we proceed to perform the Euclidean cluster segmentation. In simple terms, the algorithm consists of analysing each point and find its nearest neighbours, this is, all the points located at a distance defined by a minimum distance threshold
as shown in
Figure 7. If a point lies within the neighbourhood of another point, this is flagged as
processed and skipped in subsequent iterations. This is performed until all points are processed and grouped within a specific cluster. Other parameters such as the minimum and maximum cluster size, and minimum cluster-to-cluster distance can be specified by the user during runtime.
During the clustering stage, individual clusters are labelled based on its location on the scene, and if known, with its type, e.g., robot, box, container, or surface. At this point, an intermediate object classification stage could be integrated for automated object prioritisation. This is currently under development and assessment.
4.3. Cluster Compression and Packaging
The output of the geometrical clustering is a set of clusters
corresponding to different objects located on the scene where, by default, cluster
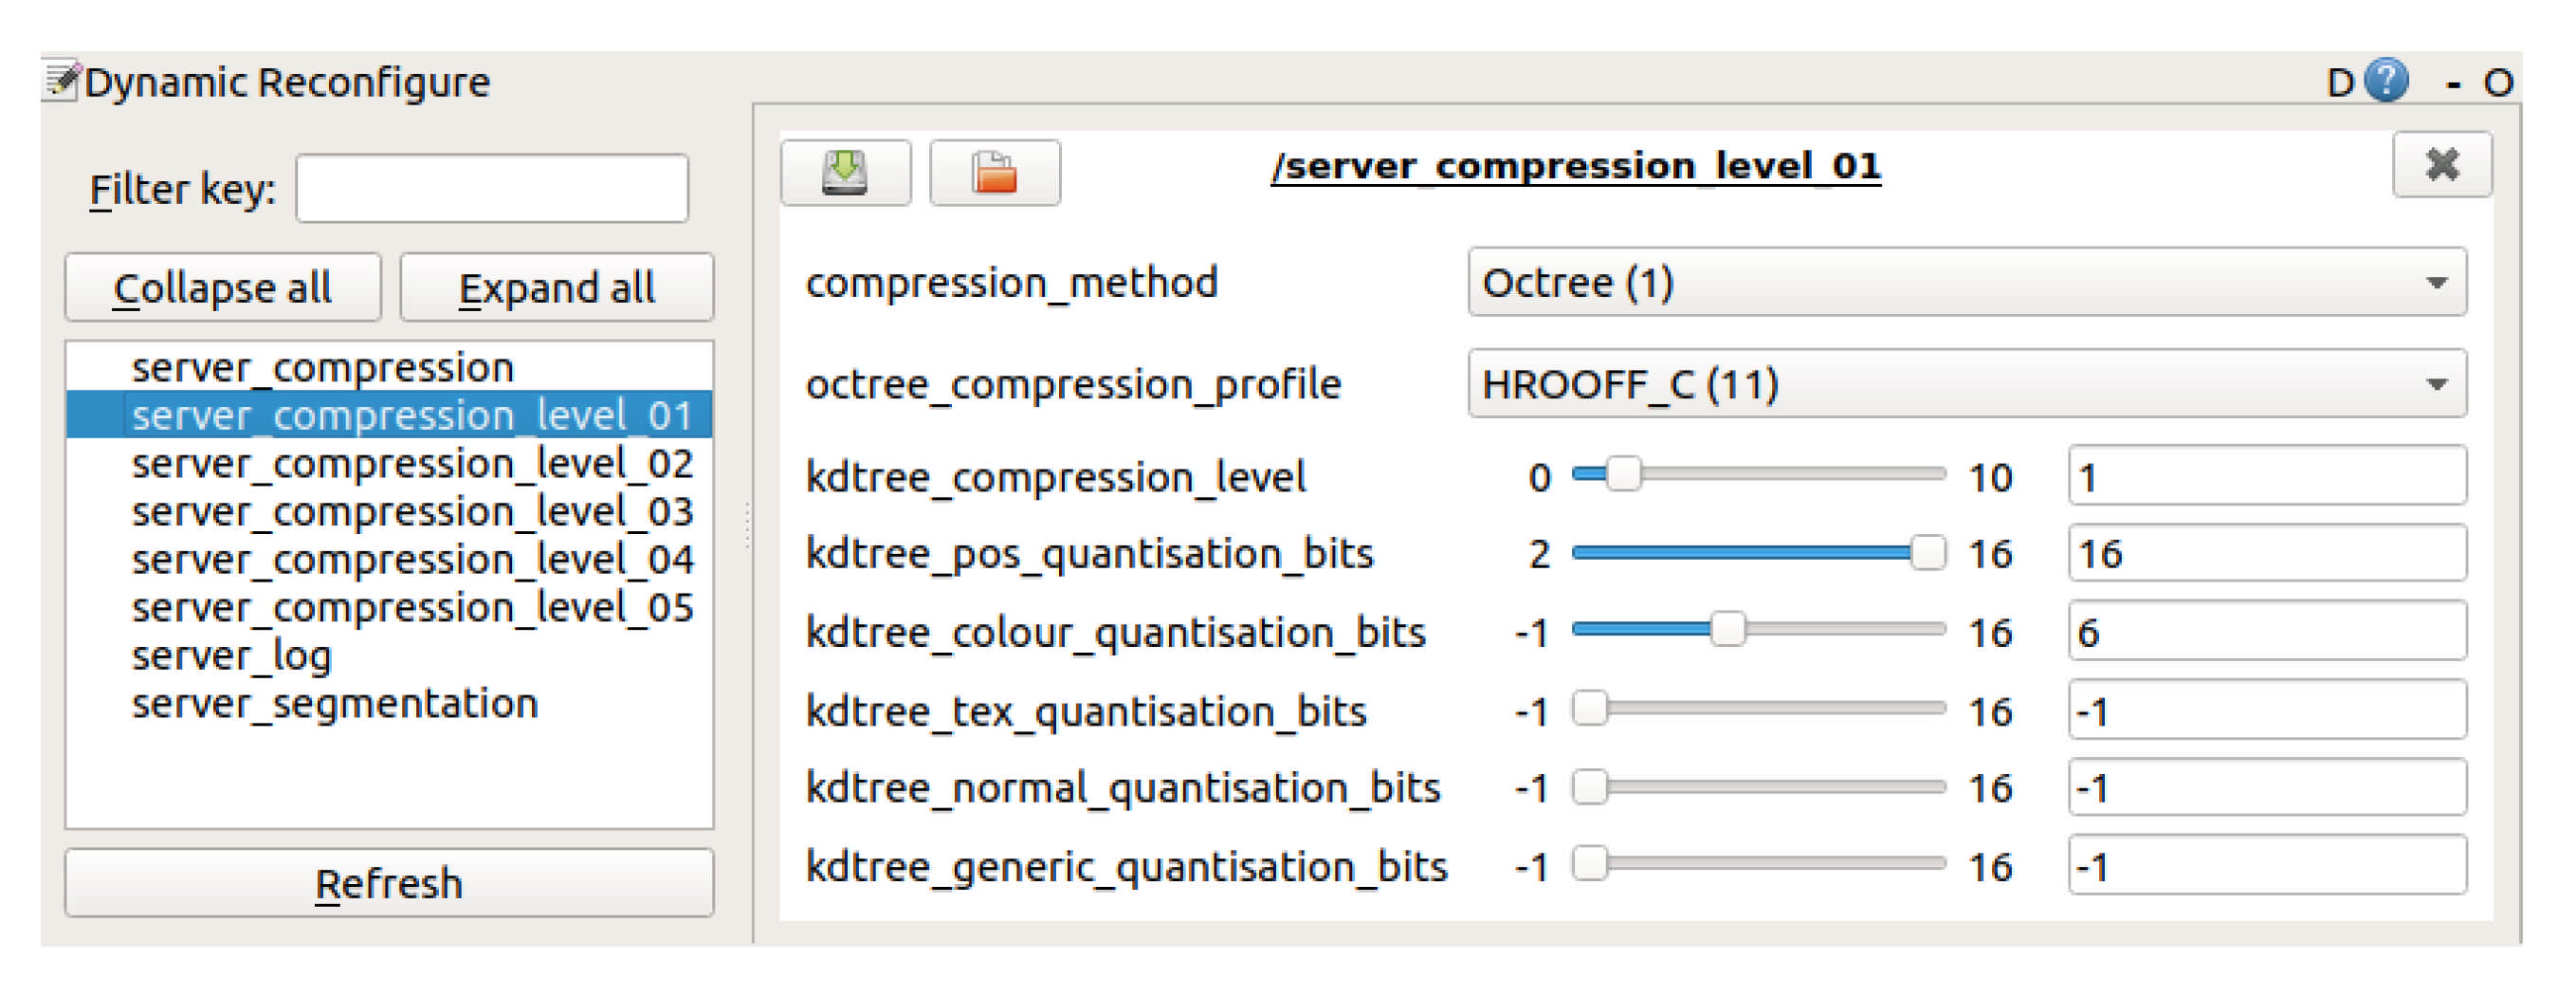
correspond to the largest plane, typically the ground or surface where the objects are located. The individual clusters are then individually compressed at a level of detail defined by the user via the user interface for the parameter configuration shown in block F in
Figure 6. This interface is displayed on the operator side and is communicates in real time with all the other blocks, allowing the adjustment of parameters during runtime based on the user needs. The actual graphical user interface (GUI) is shown in
Figure 8.
In terms of compression, five different pre-defined levels were defined as default: where level 1 corresponds to a low compression, hence higher resolution; whereas level 5 corresponds to high compression, and hence lower resolution. The five levels, ranging from 1 to 5 correspond to a subset of the compression profiles shown in
Table 1 and are HR-C, HR-NC, MR-C, MR-NC, and LR-NC, respectively. It is worth noting that these levels can be adjusted in runtime and according to the user requirements.
The label assigned to each cluster during the clustering stage was then used to assign a compression level. The ground was assigned to the highest level of compression, level 5, while the objects located on the scene were assigned to level 3. This can be observed in
Figure 6, block E.
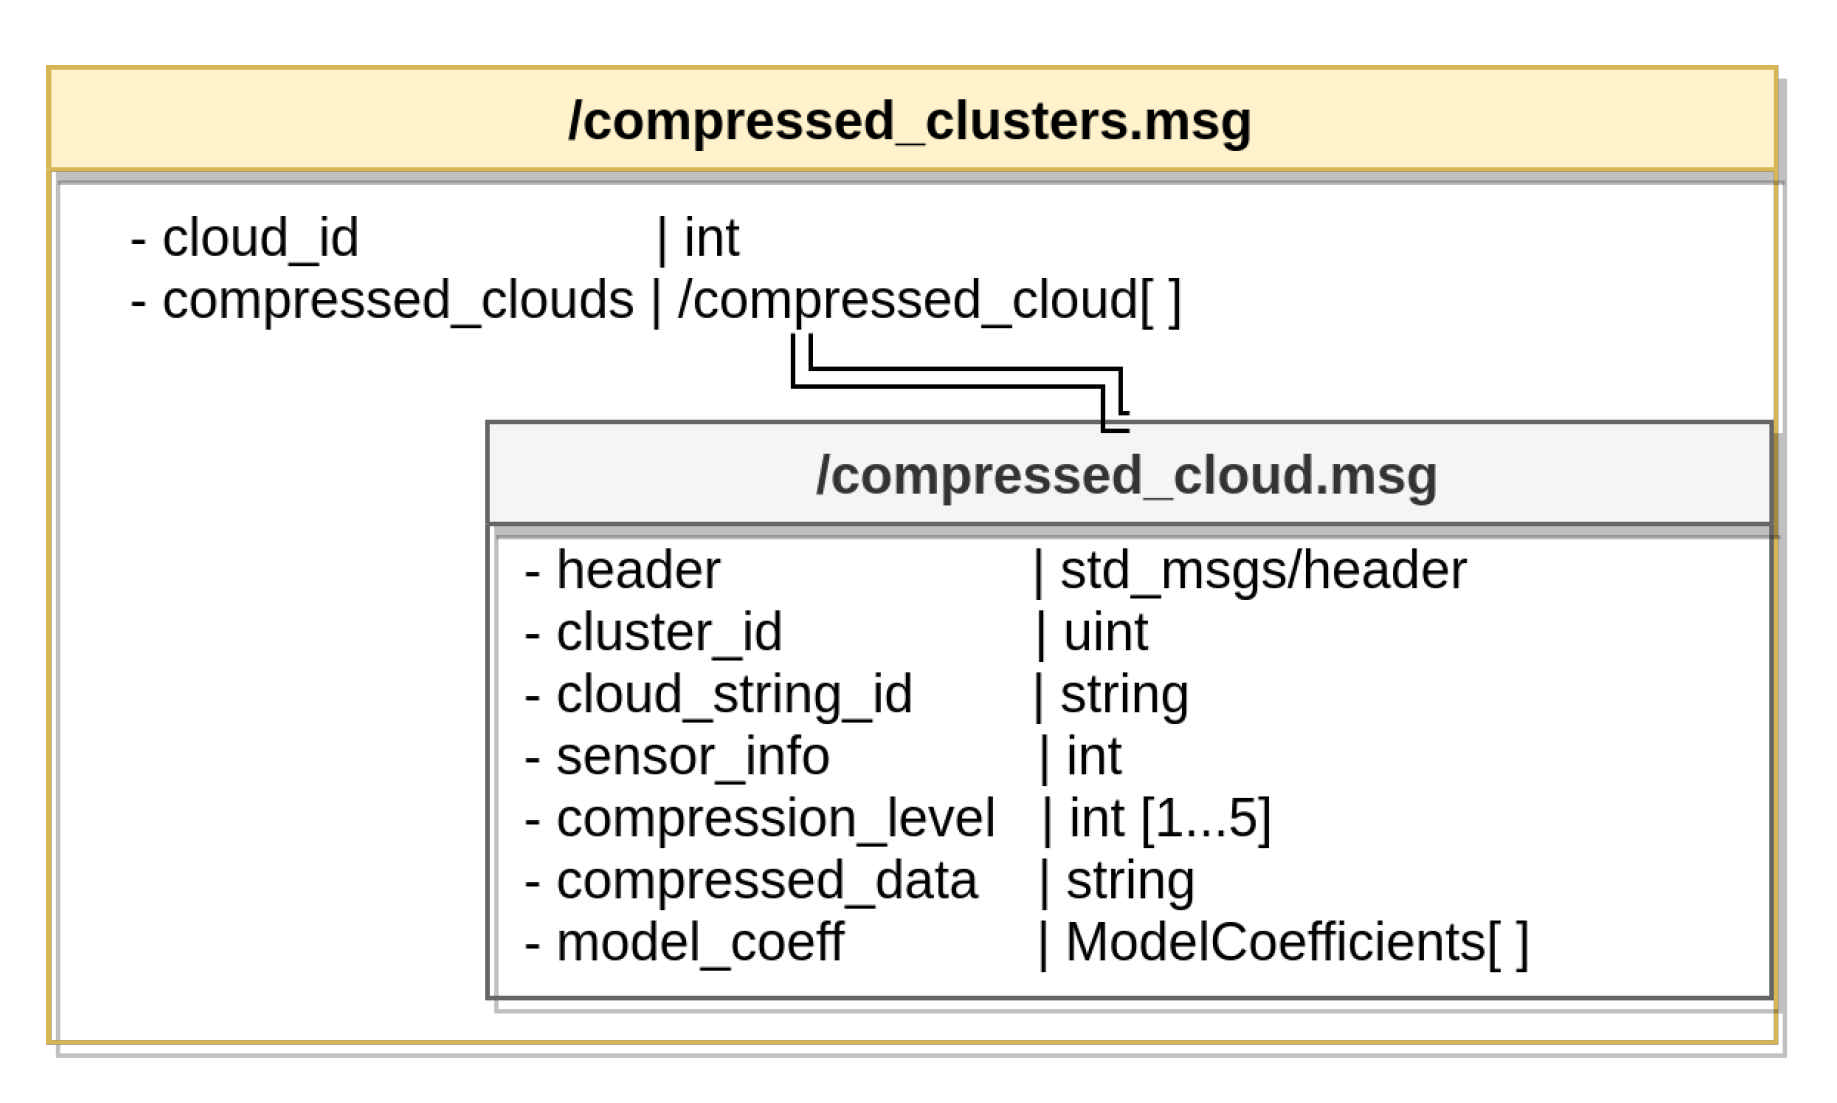
For the transmission of the compressed information, a customised ROS message was created. The structure of this message is shown in
Figure 9. As can be observed, the custom message consists of a unique identified cloud (frame) as well as a vector of individually compressed clusters. Each of these clusters is provided with its own header, cluster ID, compression level, encoded data, and if existing, coefficients of an identified primitive geometrical model.
4.4. Decompression
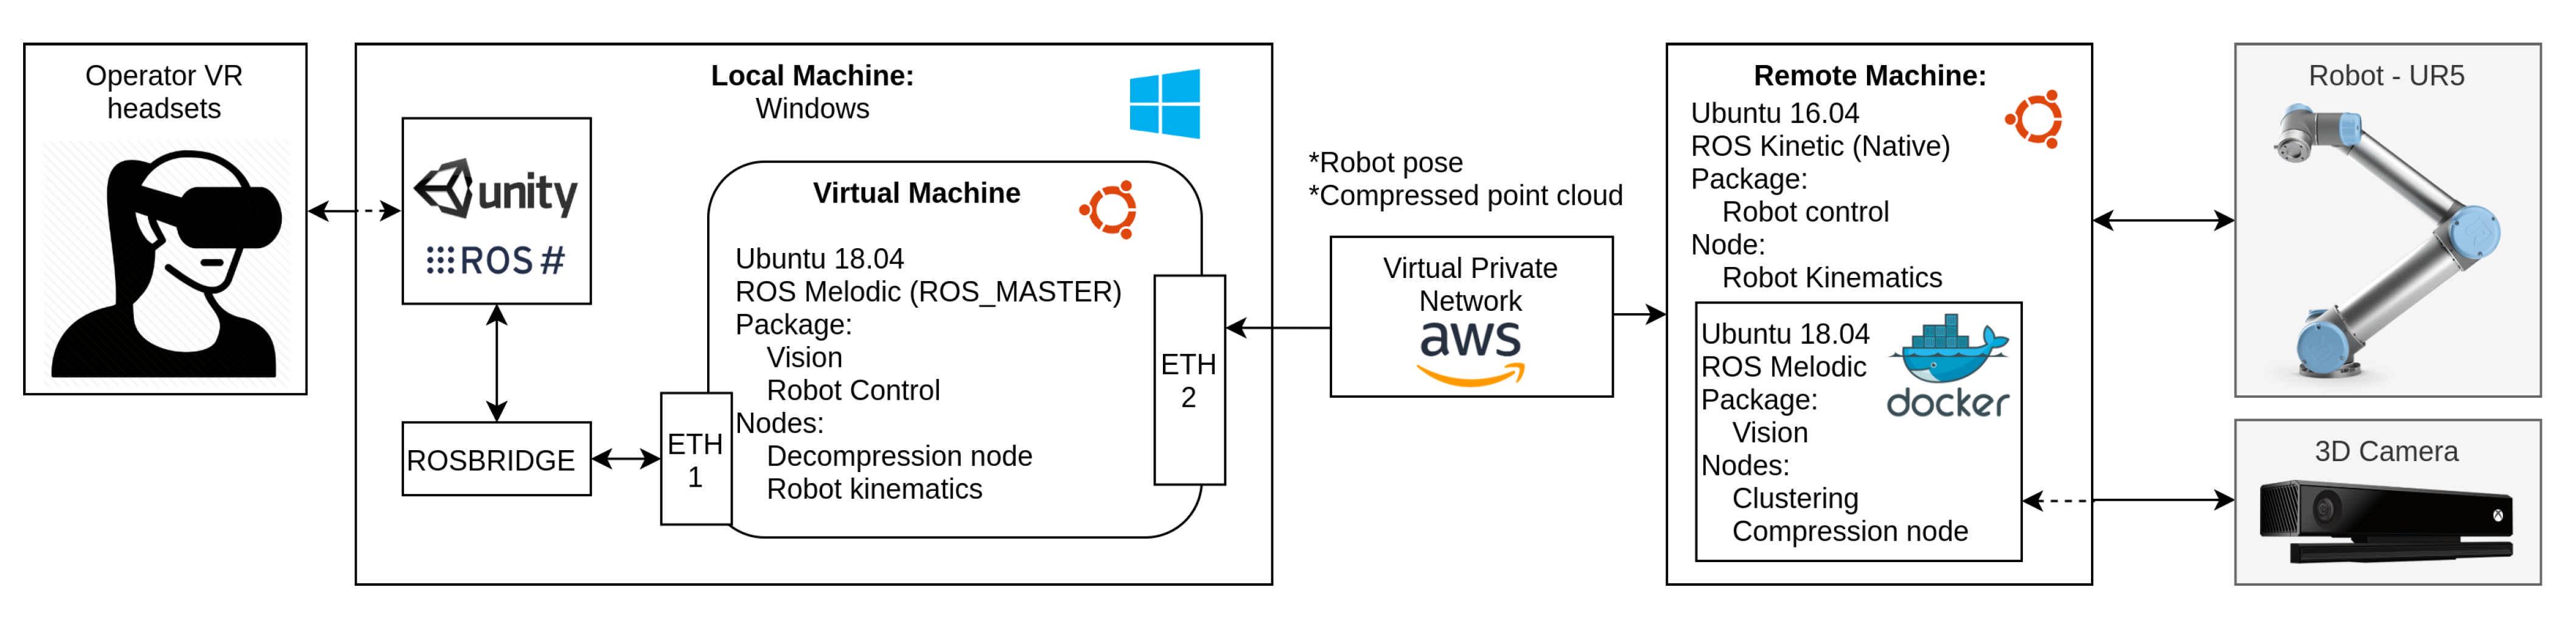
The packaged clustered information is transmitted via a virtual private network (VPN) which tunnels the data transmitted from one end to the other over the Internet. The information is then received on the local side and processed for decodification. As mentioned in
Section 4.3, each individually codified cluster contains information about its compression level, which is particularly useful at this stage to select the adequate level of decompression. Moreover, the flexibility of this message is such that any other compression implementation can be easily added and tested for transmission.
4.5. Rendering and Visualisation
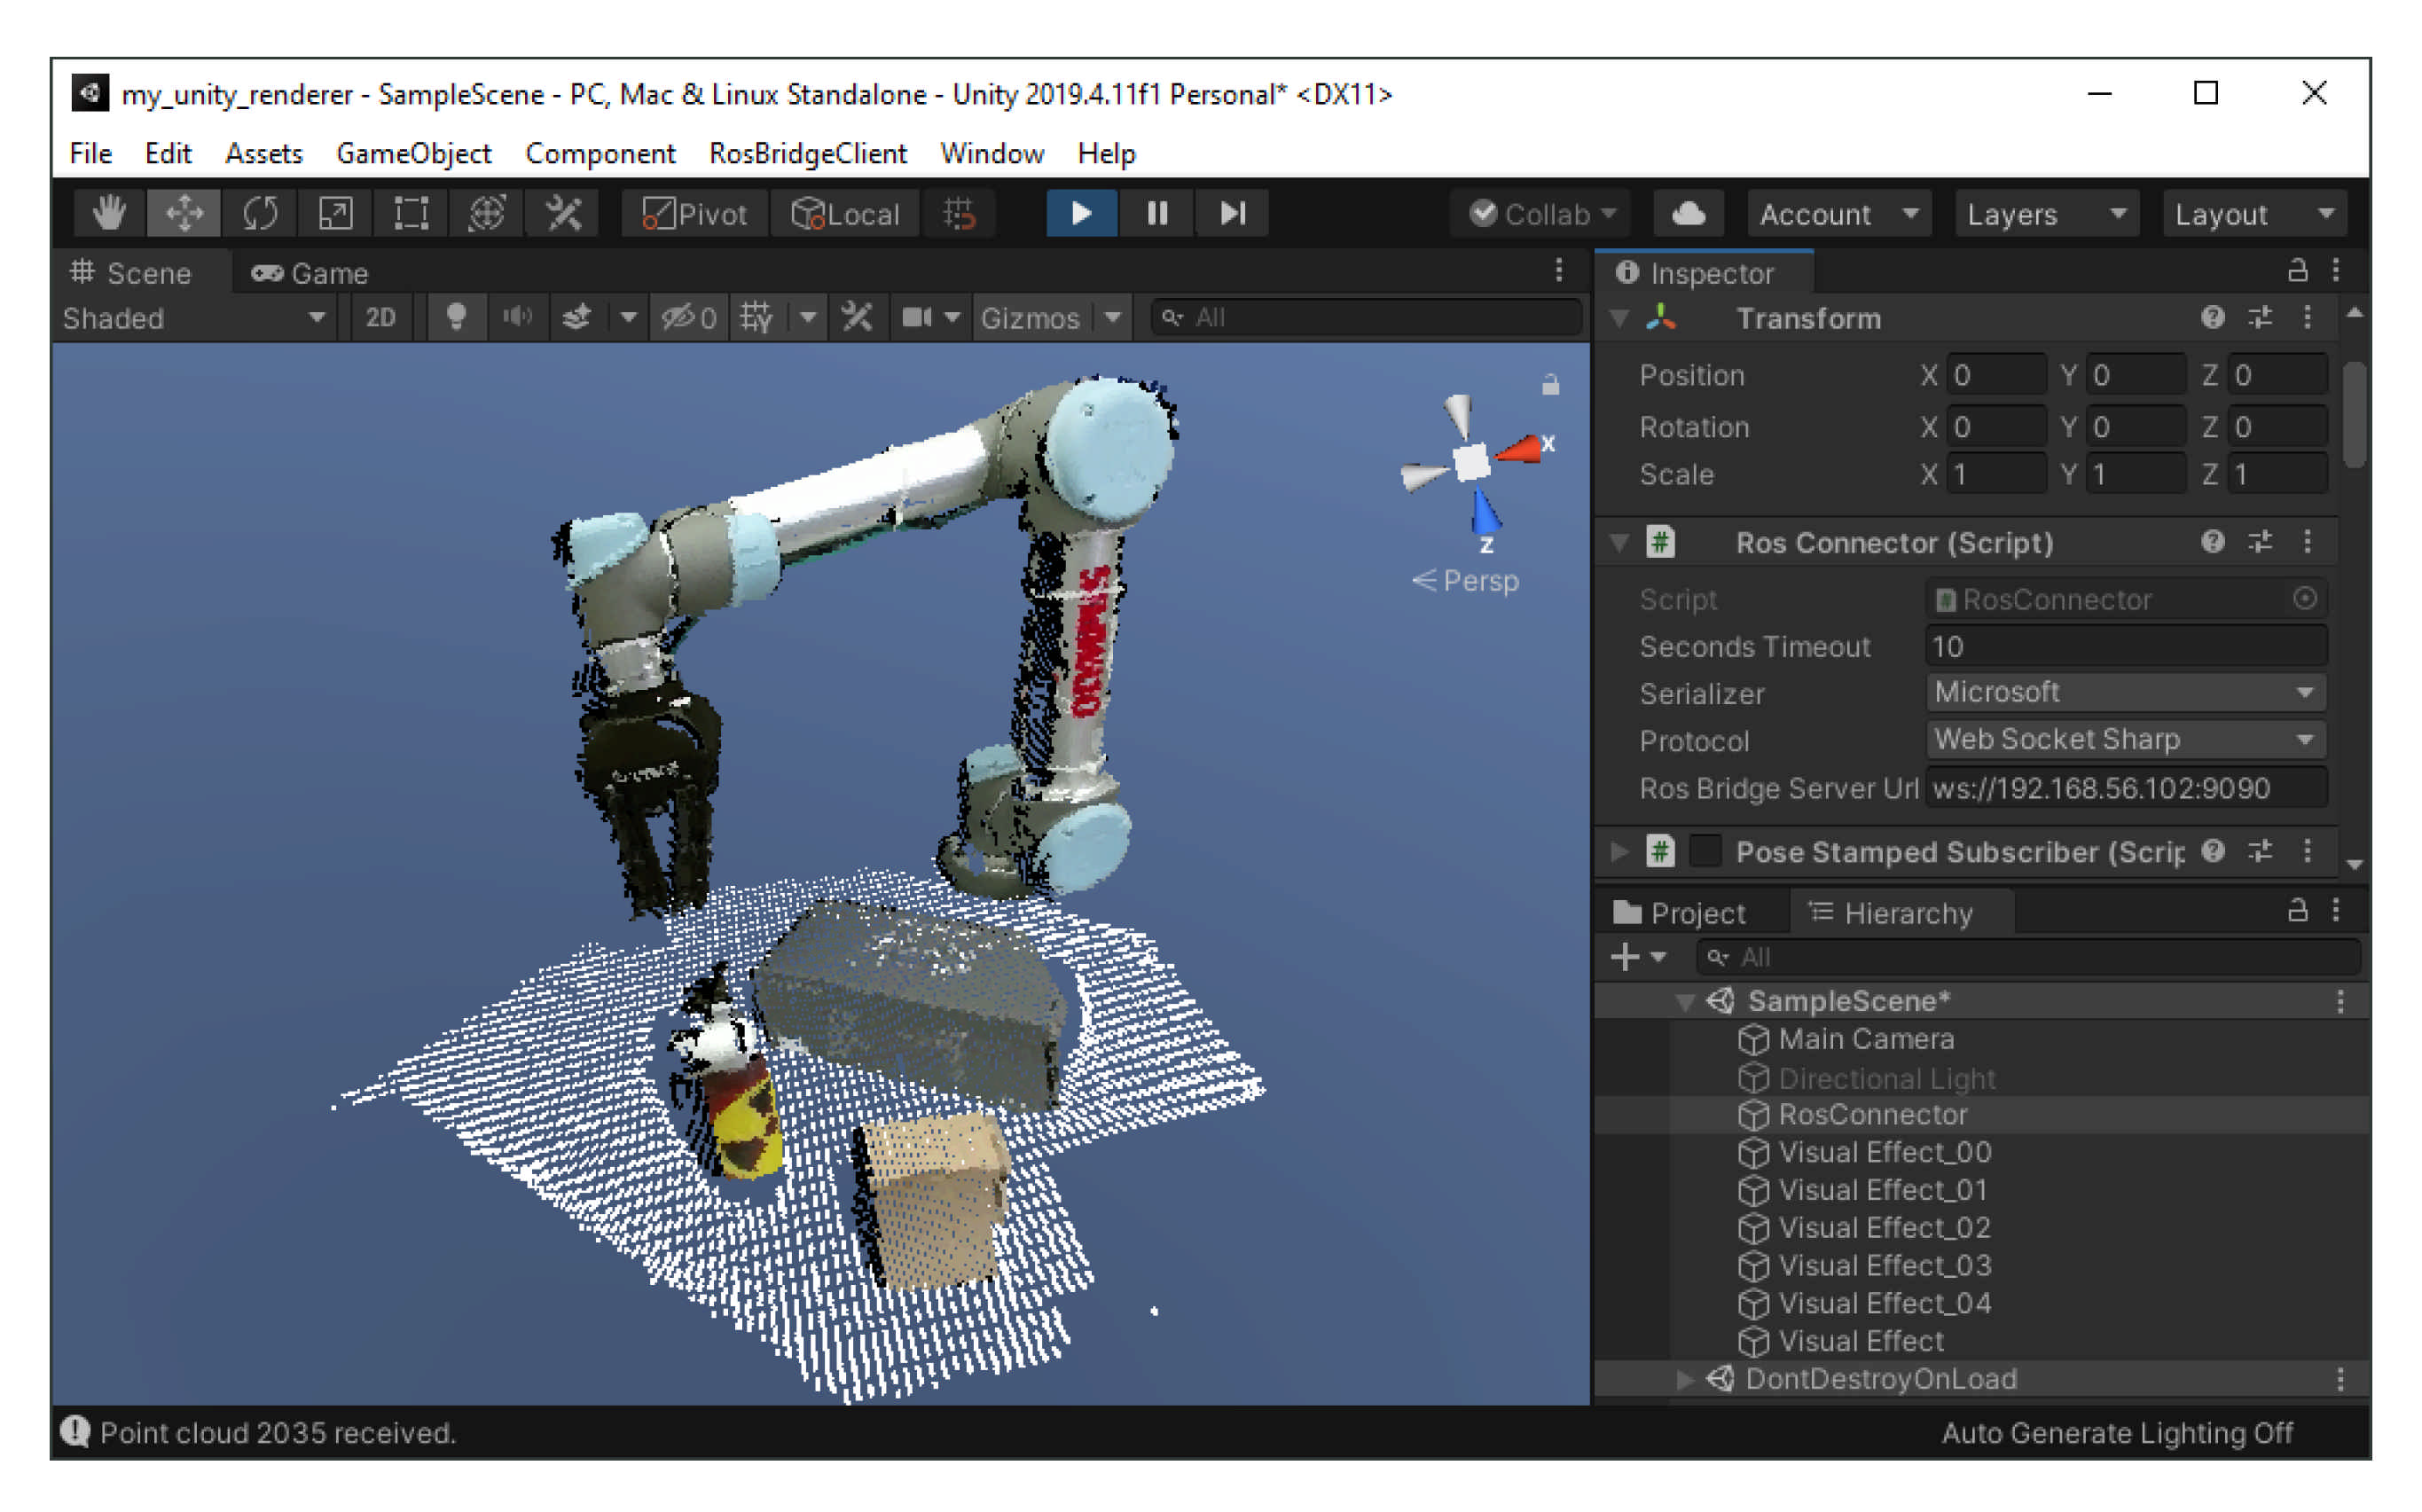
The visualisation of the remote data is the primer of this work. For this, we integrated a viewing interface in Unity. This allows the incorporation of a variety of VR headset devices and other external input devices for remote manipulation, such as leap motion sensors and joysticks.
The native programming language of Unity is C#, hence we used ROS#, which is a set of open source libraries for interfacing the standard ROS middle-ware structure with .NET applications, such as Unity [
43]. For rendering, we used the VFX particle renderer plug-in for Unity, which allows rendering millions of points as particles on-screen at the same time, as shown in
Figure 10.
6. Results
Since the primary objective of this work is to assess the time and quality of the 3D data being transferred and its visualisation, any aspect related to the control of the robot and/or any other aspect related to other parts of the system is left out of the scope.
For 3D data acquisition, the low-cost 3D camera Kinect2 was used. This device is capable of acquiring data at three different resolutions: standard definition (SD) 512 × 424 @ 29.5 Hz, quarter high definition (QHD) 960 × 540 @ 13 Hz and high definition (HD) 1920 × 1080 @ 3.5 Hz. The SD resolution was used since it provides the fastest acquisition with a relatively good resolution. During the tests, buffering is not considered, that is, any frame not used or processed immediately is dropped by the system. This was in the aim of reducing overall latency and delayed user reaction.
For our tests, we considered a conservative Internet connection of 50 MBps for calculating the transmission time. For comparison purposes, we analysed our multiple LoD method against other four approaches considered relevant to our application. These are listed below:
The comparison with methods 3 and 4 was conducted on the basis of the data provided by their corresponding authors with the aims of assessing their total compression, decompression and transmission time, as discussed in
Section 6.3. Due to the nature of its implementation, the comparison against single LoD was performed more in depth and considered the following aspects:
Number of points before and after transmission, i.e., data loss ratio;
Size of the codified point cloud, i.e., compress ratio;
Compression and decompression time;
Transmission time 50 Mbps;
Distortion of decompressed cloud.
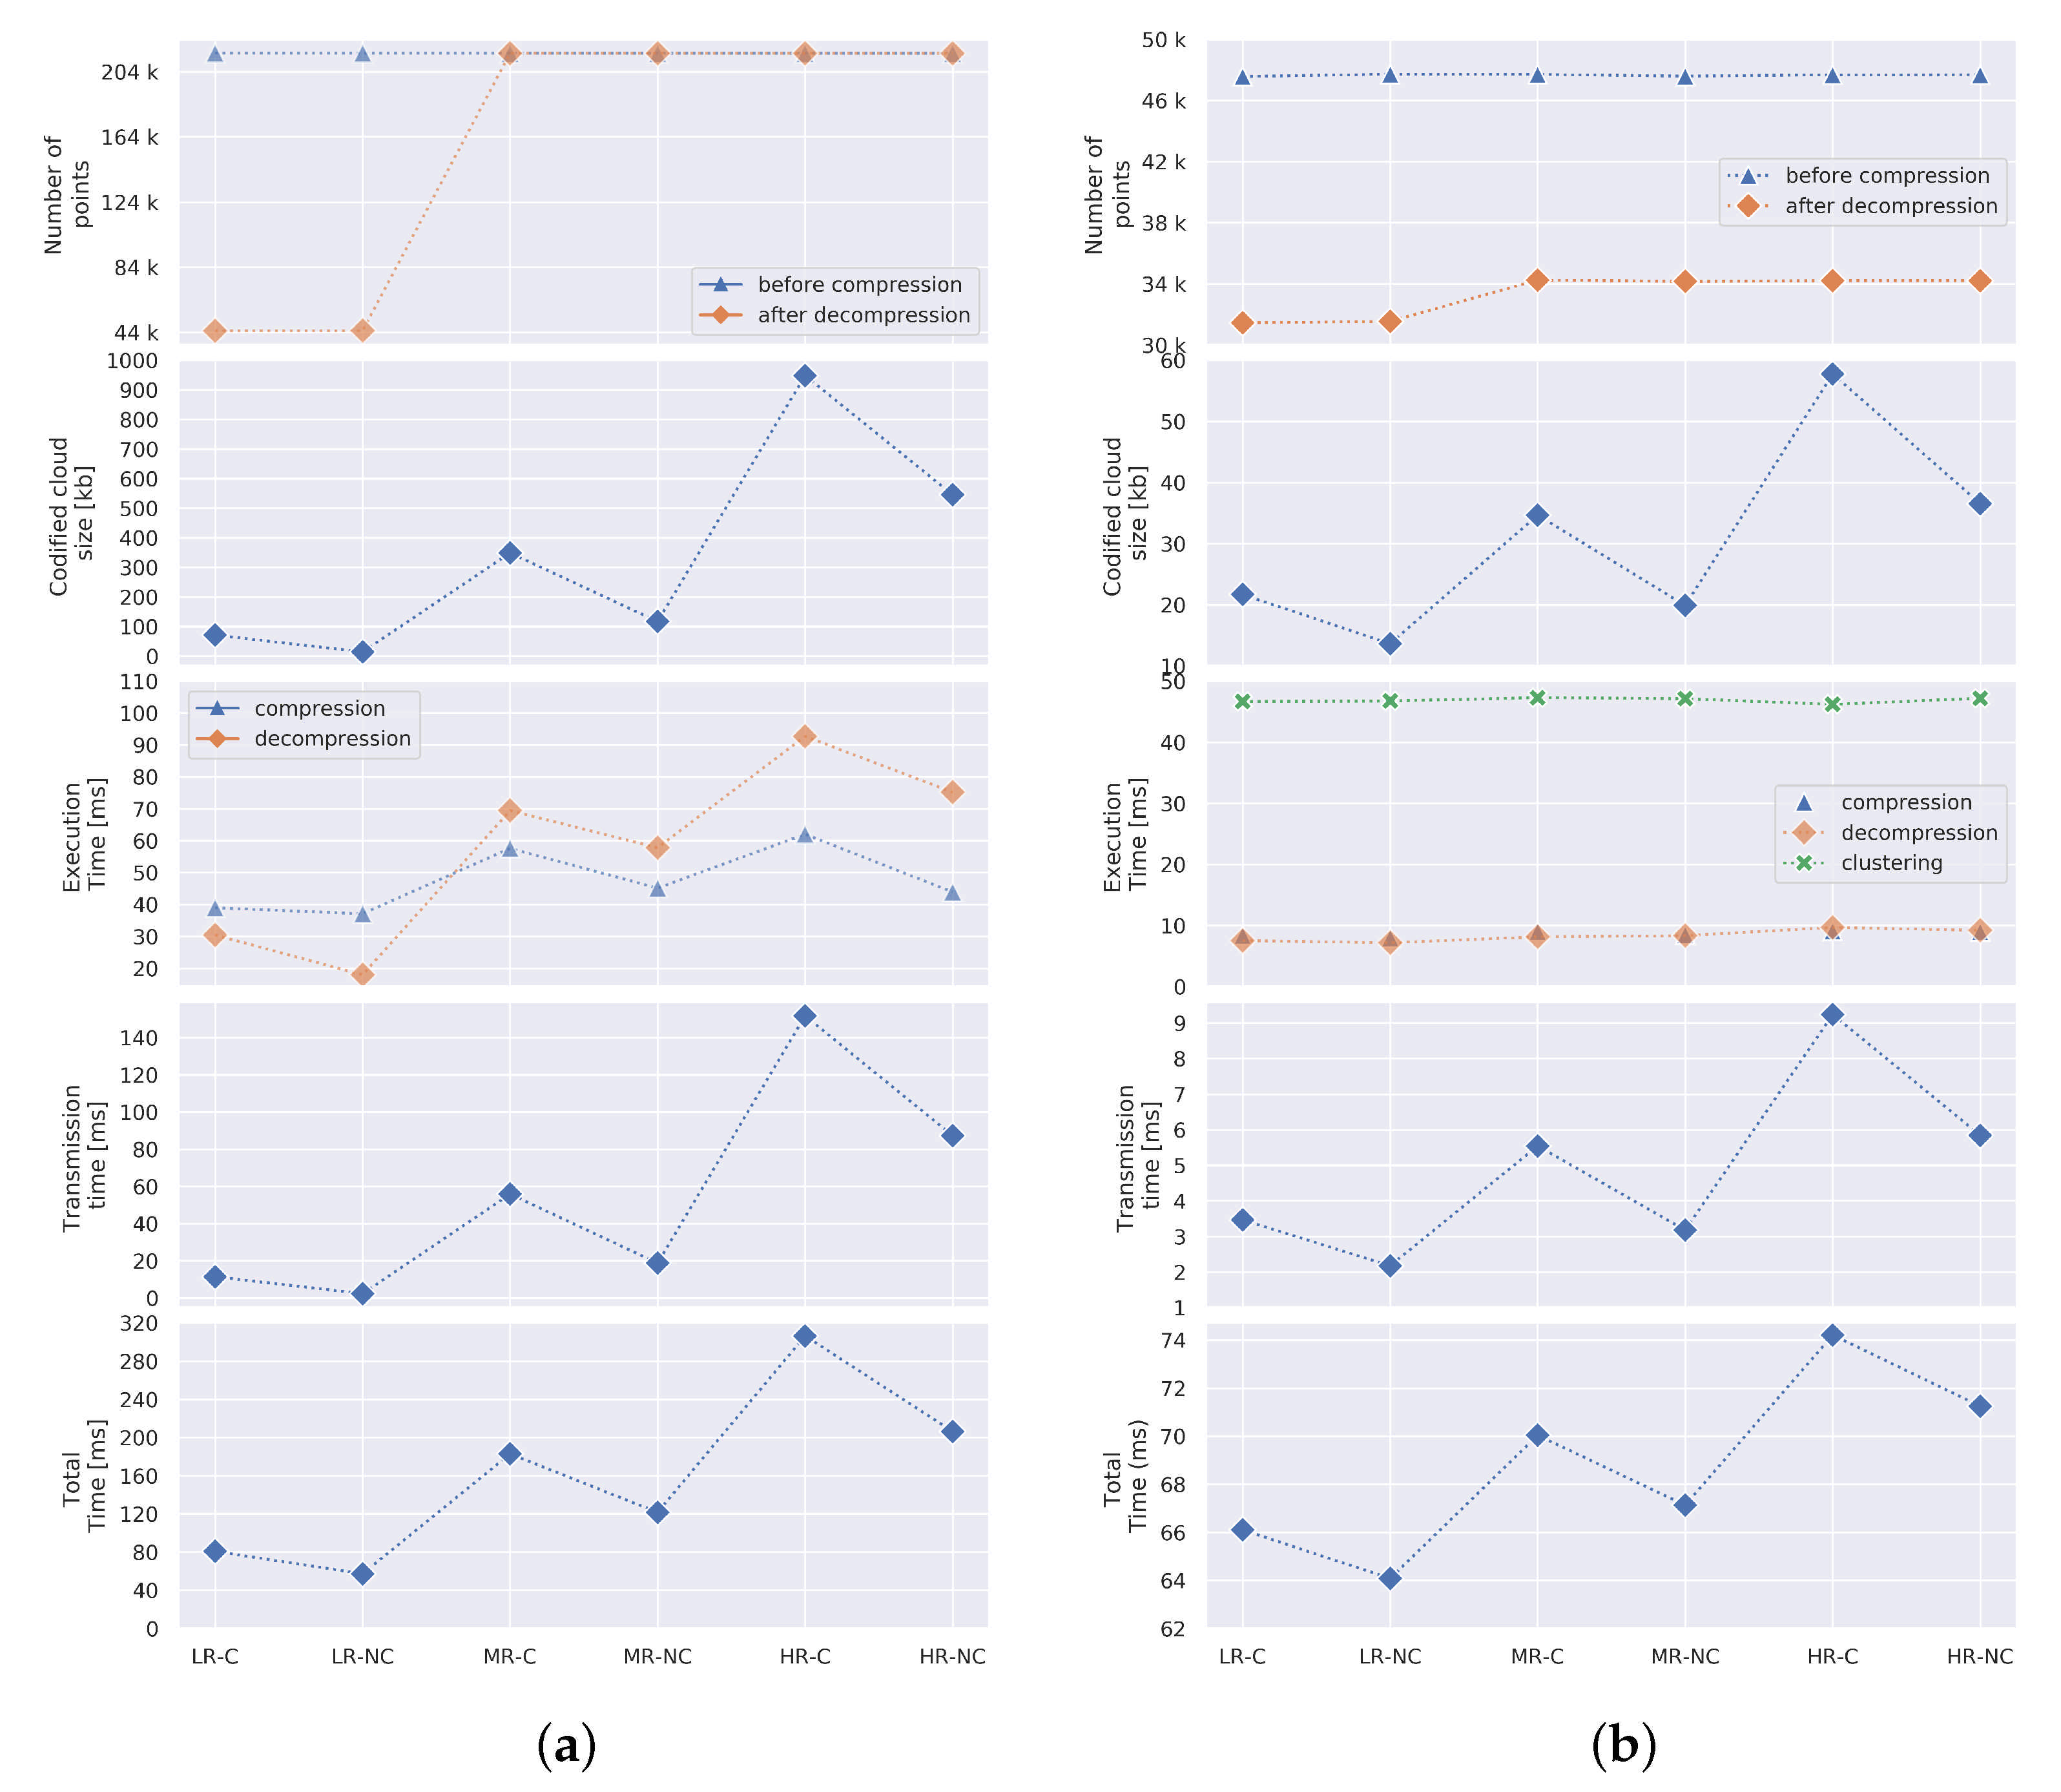
Figure 12,
Figure 13 and
Figure 14 graphically show the comparative results obtained for single and multiple LoD. It is worth mentioning that connecting (dotted) lines do not represent a continuous plot, and should only be considered for visual differentiation and trend appreciation purposes. These results are discussed in the following sub-sections.
6.1. Raw Data
As a baseline for comparison, we analysed the transmission of raw data gathered from the 3D sensor remote system and directly transmitted, with no processing, to the operator’s viewing system. For this, we considered a point cloud with 217,088 points (X,Y,Z) with colour information (R,G,B), totalling a size of 6946.82 kB. The results are shown in
Table 2.
The data are retrieved at the frame rate provided by the sensor, approximately 29.5 fps; however, the frame rate perceived by the operator dropped to approximately 0.9 fps. This represents a drop of approximately 97% of the camera frame rate. The transmission time of 1.11 s between frames and the delay this causes to the visualisation is far from being appropriate for teleoperation minimum requirements. In this sense, this simple test demonstrated the requirements for an adequate compression strategy.
6.2. Single LoD
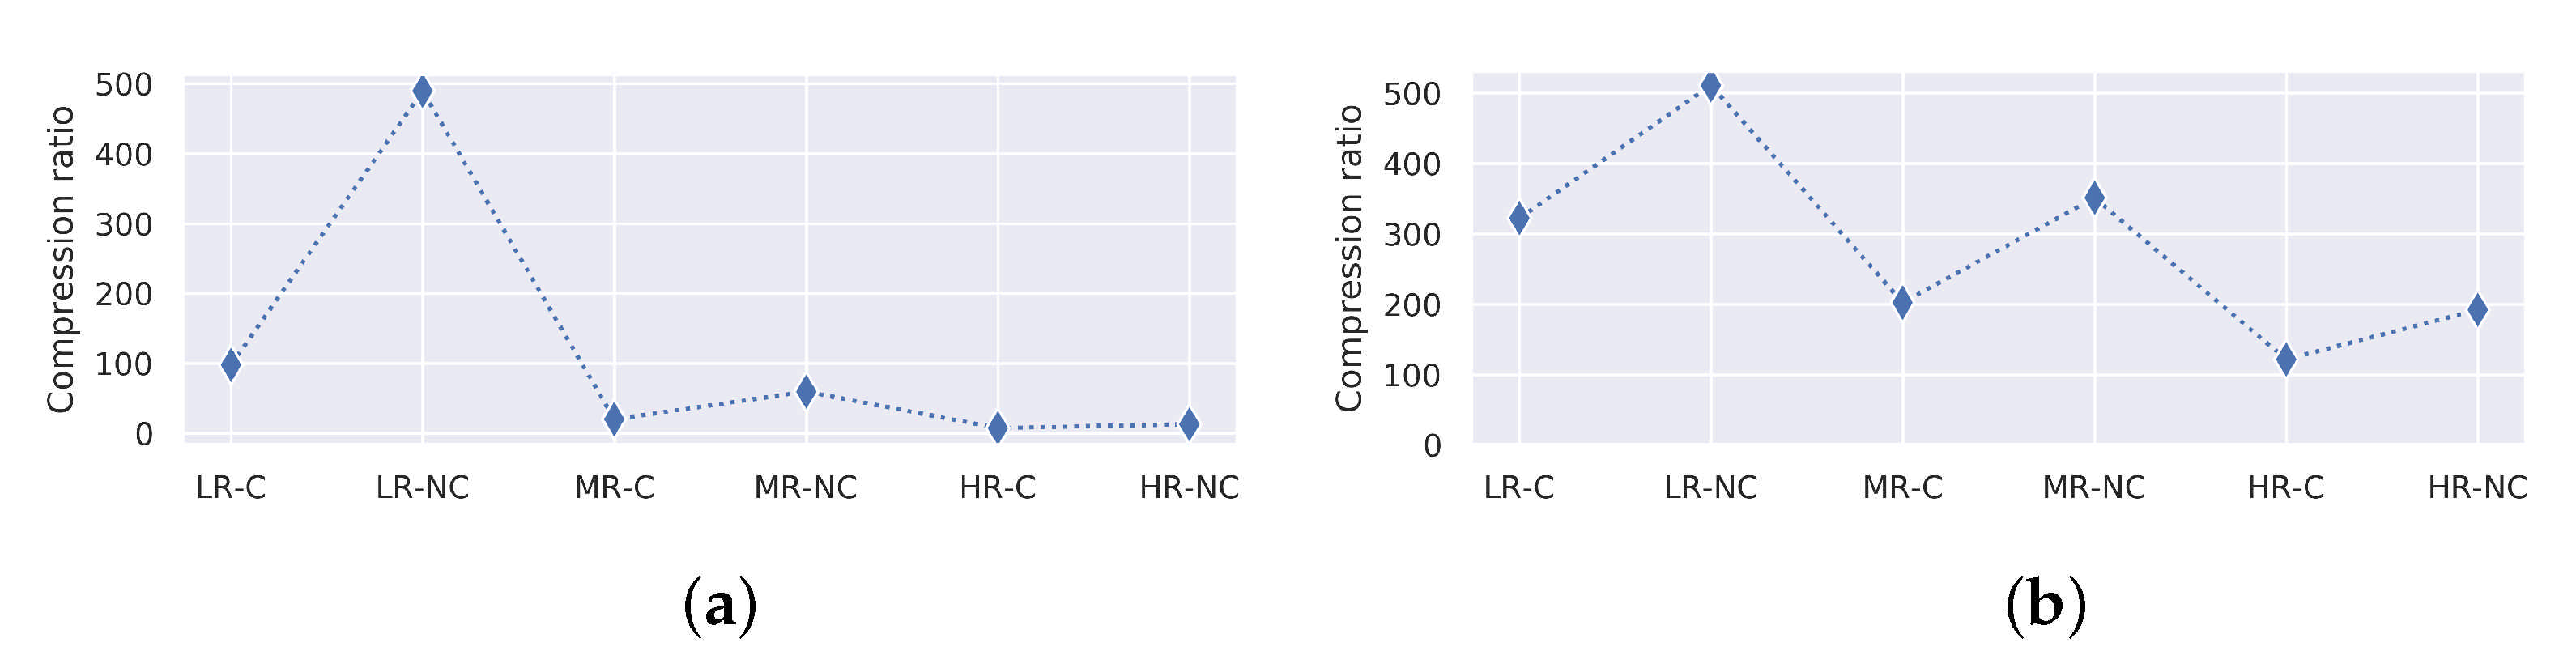
For comparison purposes, all the compression profiles shown in
Table 1 were considered. As expected, the profiles that discard colour during compression, which are LR-NC, MR-NC and HR-NC, deliver the highest compression ratio, resulting in smaller codified point clouds with regard to its coloured counterparts. Particularly, the LR-C and LR-NC profiles offer the fastest computation and transmission times. For the LR-NC, it is possible to achieve frame rates of up to ∼17.44 fps (see
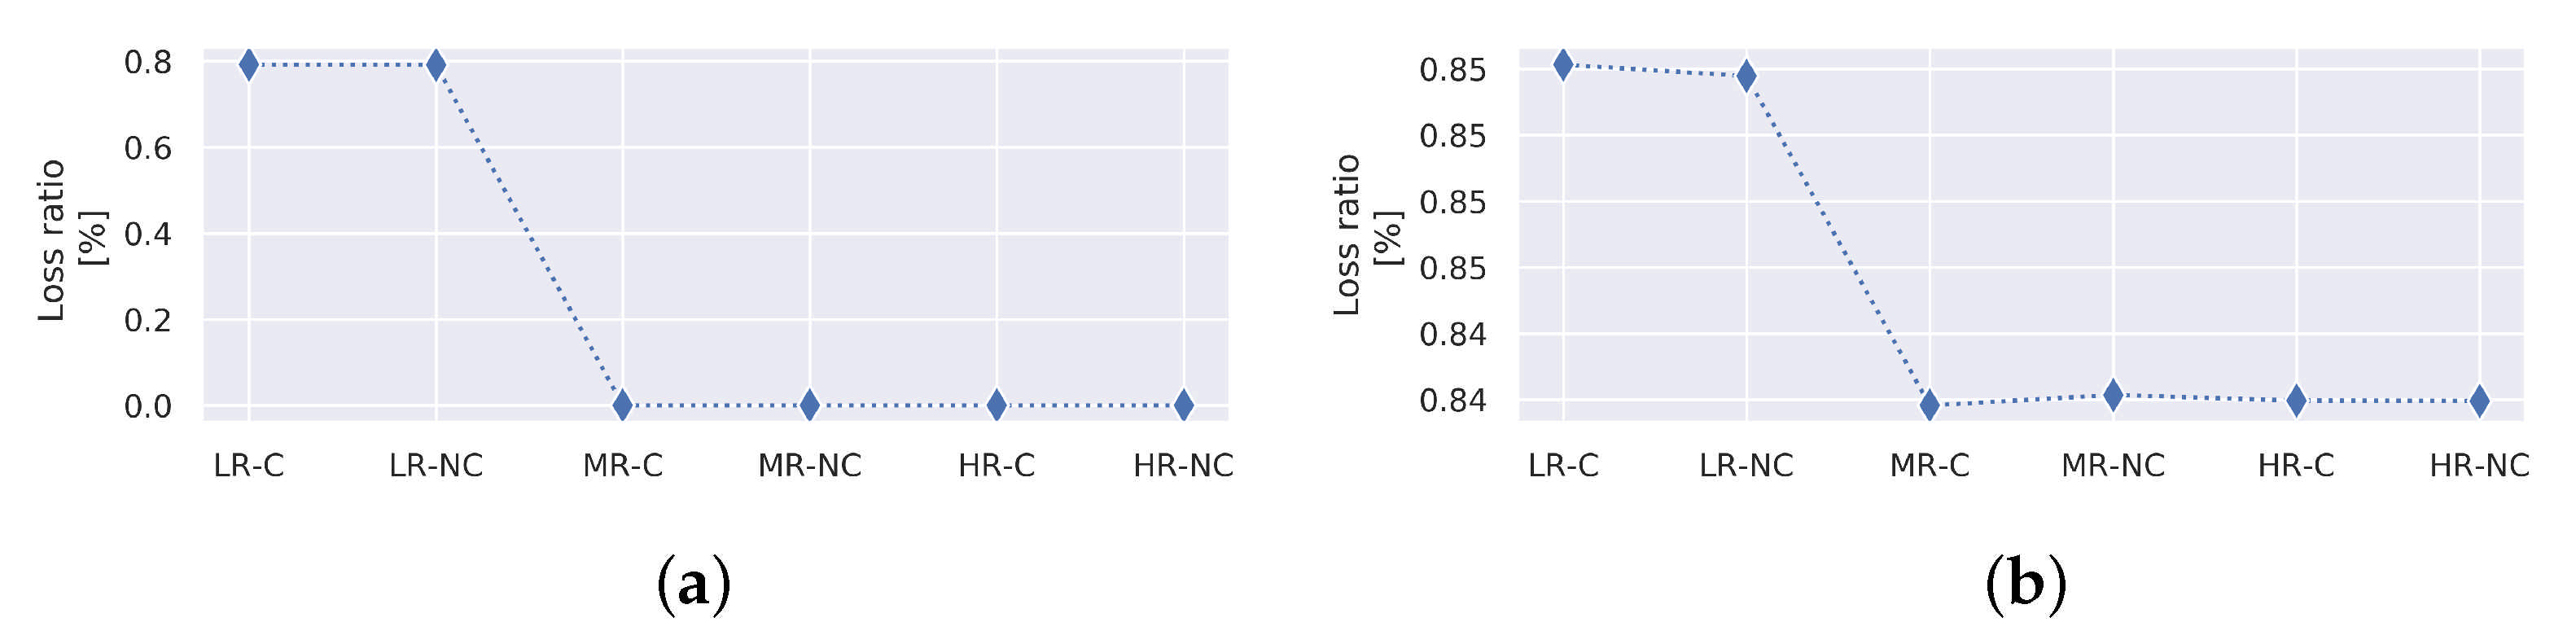
Table 3). However, the loss-ratio rounds to ∼0.8, as shown in
Figure 14a). Regardless of the compression profile used, the performance of raw 3D data transmission is surpassed by being able to provide update rates ranging from 3.25 fps, in highest coloured resolution to 17.44 colourless lowest resolution.
It is important to highlight that the necessity for coloured information is, in most cases, as important as a good frame rate. Hence, although non-coloured profiles offer an exceptional frame rate, they are not suitable in most practical scenarios.
6.3. Multiple LoD
In order to compare the single and multiple LoD compression approaches, we considered a simple test scenario: having segmented the objects on the scene as explained in
Section 4.2, the lowest resolution compression profile (LR-NC) is only assigned to the surface on which the objects lie. The rest of the objects are individually compressed using all the other compression profiles listed in
Table 1. The results are shown in
Figure 12b. The execution time as well as the total time shown in
Figure 12b consider all the time required for all the individual objects compressed on the scene. This scenario is realistically practical since, in most cases, the operator is handling the objects on the scene requiring the minimum knowledge of the surfaces enclosing the environment. Moreover, this consideration implies that, in most cases, approximately 45% of the point cloud will be compressed at the lowest resolution.
Although the multiple LoD approach delivers a higher loss ratio (see
Figure 14b), this mostly relates to the surface on which the objects lie, hence optimising the prioritised objects. As explained in
Section 4, the overall codified cloud size could further reduce if not only the surface but other objects on the scene are codified with a lower resolution as well. It is worth noticing that the required time for clustering shown in
Figure 12b represents approximately 68% of the overall processing time. Faster clustering techniques would have a beneficial impact on the total processing time.
In general terms, the codified point cloud size using multiple LoD only represents a fraction in comparison with the single LoD approach. This directly reflects upon the transmission time, which is drastically reduced.
A comparative table of results obtained is shown in
Table 3. For the single and multiple LoD approaches, a visual comparison is presented in
Appendix A,
Table A1. Results demonstrate that it is possible to reach frame rates of up to 13.5 fps when using the highest resolution compression profile HR-C on the objects. Furthermore, our approach was compared against the single level of detail octree-based compression approach presented in [
38] and the 2D surface parameterisation approach proposed in [
31]. For the former, a 1 mm resolution octree was considered, and for the latter, we used the evaluation using the room data set (provided in their paper) to generate an estimation of the compression size and transmission time of a point cloud with the same characteristics as that used in our tests. We would like to reiterate that the fps was estimated considering a connection speed of 50 Mbps and taking into consideration the compression, decompression and transmission time.
Using
Table 3 and
Table A1, it is possible to analytically and visually compare the results. The methods proposed in [
31,
38] provide a good frame rate suitable for real-time visualisation, however, our multiple LoD approach clearly surpasses them both. For the single LoD approach, the best viewing quality is obtained when using the HR-C profile, however, this does not suit the frame rate required. In contrast, with the multiple LoD approach, the user can visualise the objects using high-resolution while maintaining a reasonably high frame rate.
What is more, a general improvement in frame rate is observed over most of the compression profiles utilised for single and multiple LoD. It is worth noticing that a multiple LoD approach is more beneficial for medium and high-resolution profiles rather than low ones, which is mainly due to the added computational time required for clustering.
6.4. Distortion of Decompressed Data
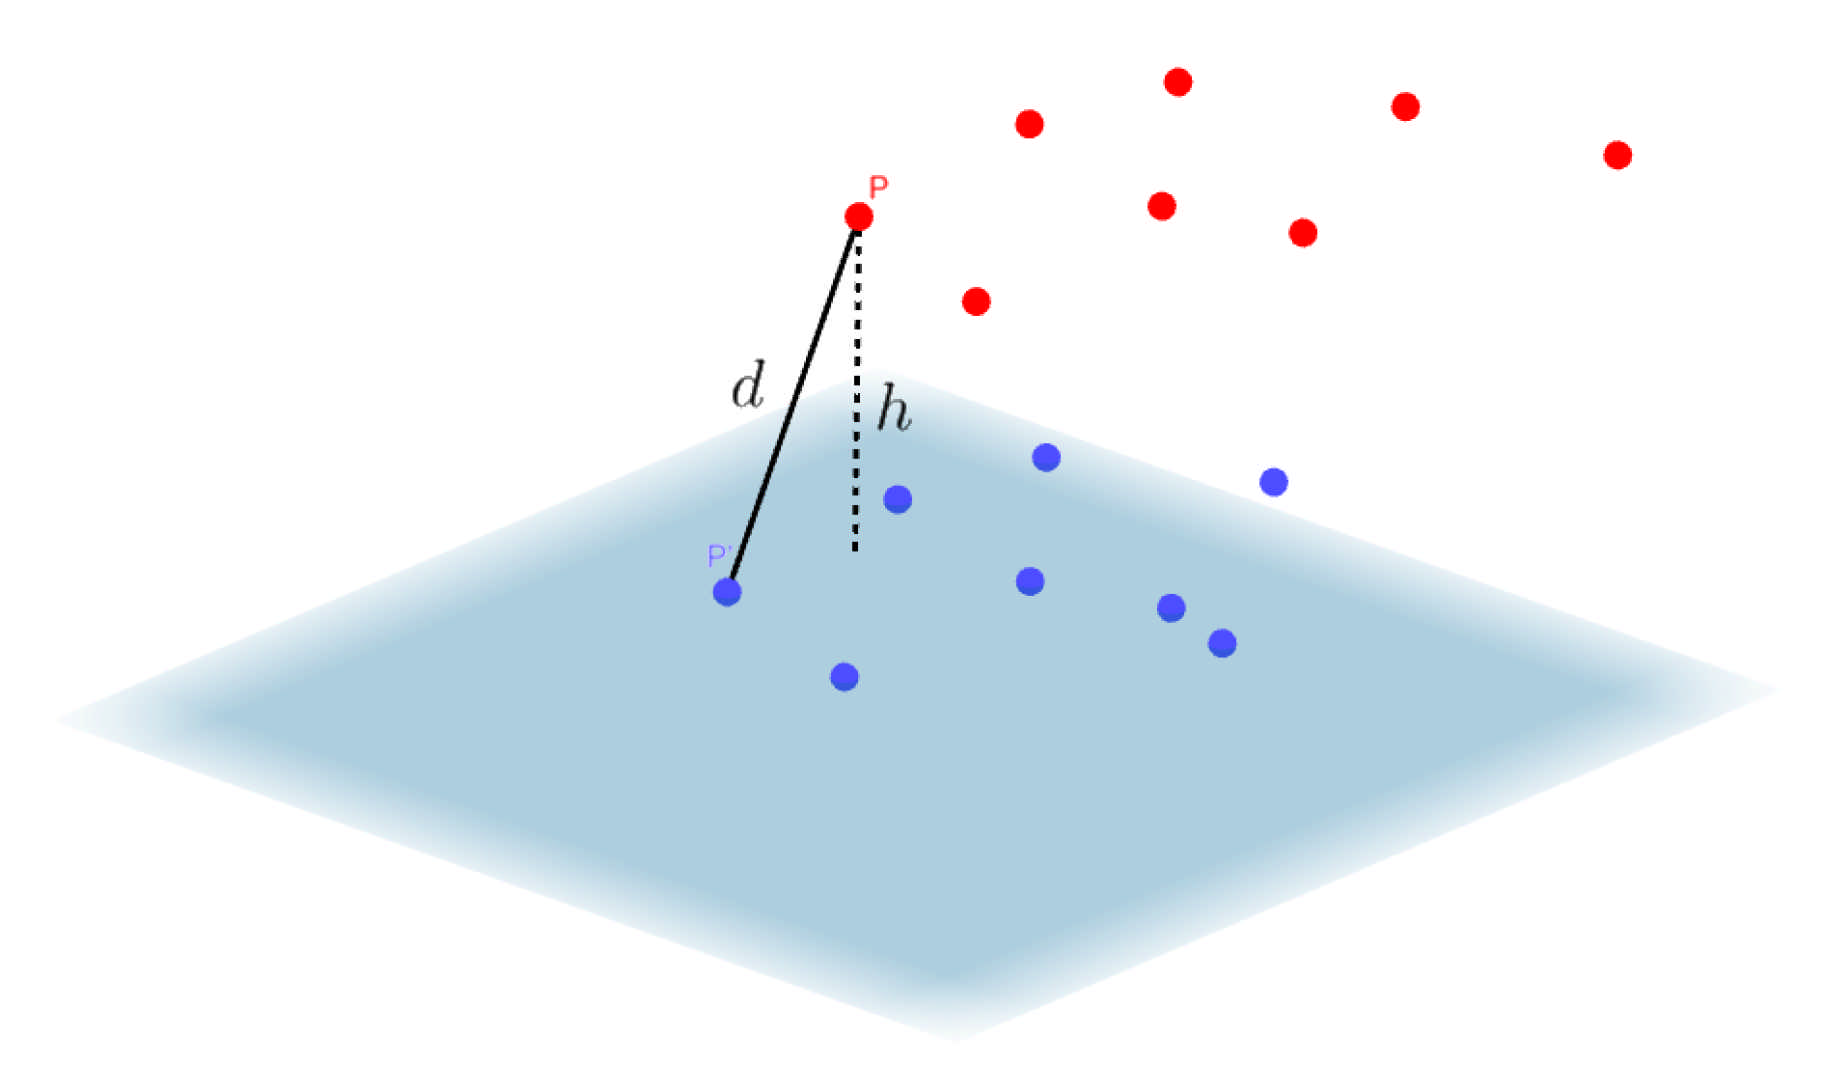
In order to provide an estimation of the distortion or differences of the decompressed point cloud with respect to the original point cloud, a point-to-model (P2M) comparison analysis was conducted [
46]. For clarity, let us define the original (raw) point cloud as the reference and the decompressed point cloud as the target, these are represented with blue and red dots in
Figure 15, respectively. For each point
P in the target cloud, the closest point
on the reference cloud is computed. Then, a local plane model is estimated utilising the neighbouring points to
. With this information, it is then possible to estimate
h. In this way, the mean of all
h’s and its standard deviation can provide an intuitive estimation of the overall distortion after compression.
The P2M comparison was utilised since the density of both the reference and target clouds is likely to be different, hence a point-to-point (P2P) comparison may not be suitable. The direct comparison of the distances between the closest points will not necessarily represent the shortest distance between the surfaces they lie on.
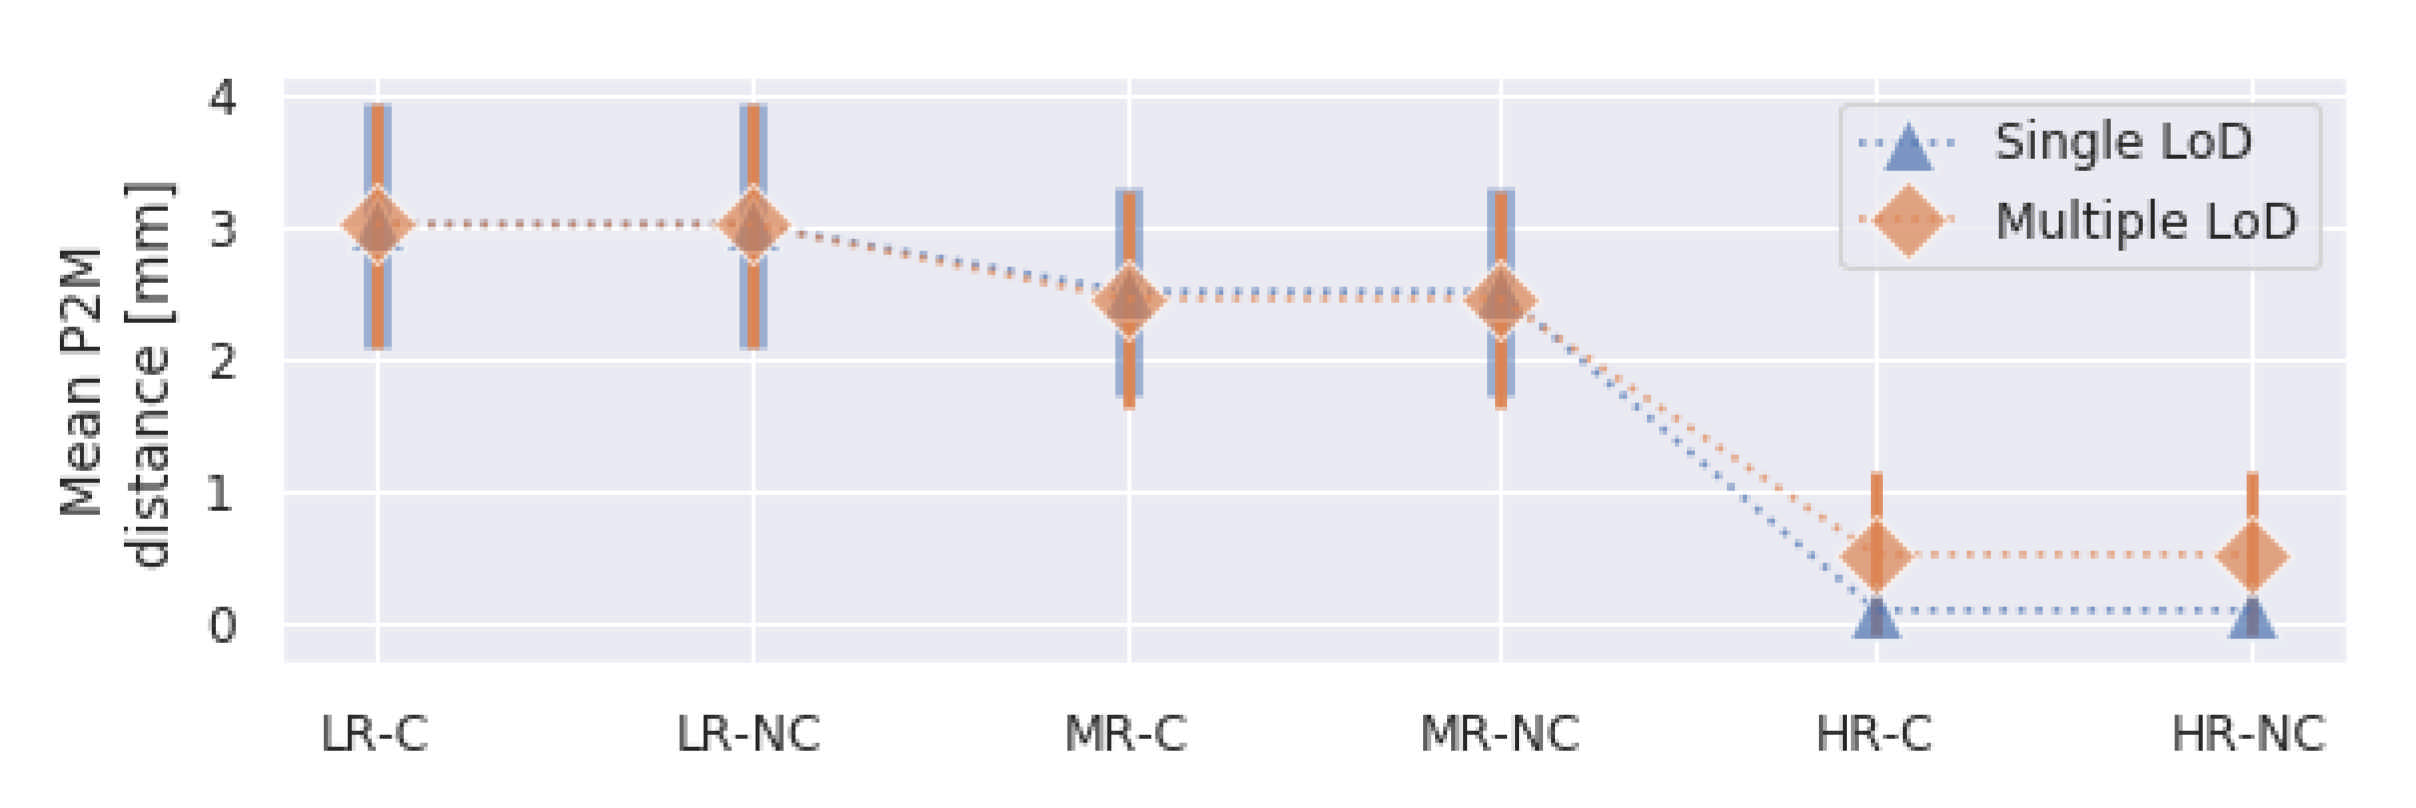
Figure 16 shows the mean P2M distance and standard deviation for each compression profile using single and multiple LoD compression. As can be observed, the mean remains fairly similar in both approaches. The main difference occurs on the high-resolution profiles were the single LoD approach exhibits less distortion.
However, by visually analysing the source of such differences in
Figure 17, it was demonstrated that these relate to the low resolution at which the surface was compressed, hence this distortion is acceptable.
7. Conclusions
This paper presented a novel approach for fast 3D data transmission for remote viewing in teleoperation applications. The proposed methodology utilises tree-like structures with multiple depth levels to codify sections of the scene at different resolutions according to the user viewing requirements. Our technique was integrated and tested in a teleoperation system consisting of a serial telemanipulator, and a digital replica controlled using VR glasses and leap motion sensors on the operator side.
Our technique was compared against raw data transmission, single LoD compression and two state-of-the-art techniques based on pure octree codification and 2D surface parameterisation encoding. The results show a remarkable improvement in 3D compression data size, transmission time and hence update rate. The experiments conducted considered the simplest test scenario: compressing at the lowest resolution only the surface on which the objects lie while varying the resolution of the rest of the objects. Since the configuration in terms of variable resolution across the scene are endless and entirely dependent on the setup and user needs, the results in other scenarios could potentially exceed the ones presented herein. Moreover, the analysis of the distortion of the decompressed point cloud with respect to the original point cloud was conducted. This showed a deviation ranging from 0.5 to 3 mm using a point-to-plane comparison approach, this being acceptable in most teleoperation applications.
Further investigation is to be conducted on how to automatically identify high-priority objects on the scene for a more optimal LoD compression. This will require the integration of sophisticated model fitting and/or deep-learning techniques within our pipeline. To do so, it is required to evaluate the computational cost vs. benefit derived from such techniques. Moreover, the exploring of parallelisation processing within our computational framework could have a beneficial impact on the overall performance.


