
Wilderness Search for Lost Persons Using a Multimodal Aerial-Terrestrial Robot Team


Department of Mechanical and Industrial Engineering, University of Toronto, Toronto, ON M5S 3G8, Canada
*
Authors to whom correspondence should be addressed.
Robotics 2022, 11(3), 64; https://0-doi-org.brum.beds.ac.uk/10.3390/robotics11030064
Submission received: 20 April 2022
/
Revised: 21 May 2022
/
Accepted: 30 May 2022
/
Published: 1 June 2022
(This article belongs to the Section Aerospace Robotics and Autonomous Systems)
Abstract
:Mobile robots that are capable of multiple modes of locomotion may have tangible advantages over unimodal robots in unstructured and non-homogeneous environments due to their ability to better adapt to local conditions. This paper specifically considers the use of a team of multimodal robots capable of switching between aerial and terrestrial modes of locomotion for wilderness search and rescue (WiSAR) scenarios. It presents a novel search planning method that coordinates the members of the robotic team to maximize the probability of locating a mobile target in the wilderness, potentially, last seen on an a priori known trail. It is assumed that the search area expands over time and, thus, an exhaustive search is not feasible. Earlier research on search planning methods for heterogeneous though unimodal search teams have exploited synergies between robots with different locomotive abilities through coordination and/or cooperation. Work on multimodal robots, on the other hand, has primarily focused on their mechanical design and low-level control. In contrast, our recent work, presented herein, has two major components: (i) target-motion prediction in the presence of a priori known trails in the wilderness, and (ii) probability-guided multimodal robot search-trajectory generation. For the former sub-problem, the novelty of our work lies in the formulation and use of 3D probability curves to capture target distributions under the influence of a priori known walking/hiking trails. For the latter, the novelty lies in the use of a tree structure to represent the decisions involved in multimodal probability-curve-guided search planning, which enables trajectory generation and mode selection to be optimized simultaneously, for example, via a Monte Carlo tree search technique. Extensive simulations, some of which are included herein, have shown that multimodal robotic search teams, coordinated via the trajectory planning method proposed in this paper, clearly outperform their unimodal counterparts in terms of search success rates.
1. Introduction
Mobile robots capable of multiple modes of locomotion, known as multimodal robots, may outperform their unimodal counterparts on tasks in complex environments with spatially varying traversability and target visibility [1]. Examples of multimodal robots include aerial–aquatic robots inspired by water beetles or seabirds [2,3,4], gliding-climbing robots that mimic flying squirrels [5,6], amphibious robots [7,8,9,10], and aerial–terrestrial robots [11,12,13].
Although a myriad of mechanical solutions for multimodal robots has been proposed [14,15], many of these systems have been developed to demonstrate the feasibility of bio-inspired designs, though lacking focused applications. As a result, such systems are, typically, limited to low technology-readiness levels, where mechanical design and low-level control have been the main focus of research. The potential of these multimodal systems can, thus, only be fully realized by considering deployment and planning methods tailored towards specific applications to leverage their adaptability.
This paper considers the deployment and search planning of a team of multimodal aerial–terrestrial robots in the context of wilderness search and rescue (WiSAR). An important part of formulating a WiSAR plan is generating probabilistic predictions of the lost person’s whereabouts, based on which an informed search can then be planned. Lost person behaviour has been studied extensively to predict how a lost person might behave, and Section 1.1 discusses literature that addresses the tendency to follow trails in the wilderness, which is one of the factors that is known to impact lost person behaviour.
Although this paper considers the use of multimodal search agents in WiSAR, literature that addresses this topic is very limited to none, to the best of our knowledge. To understand how WiSAR may benefit from a search team with both aerial and terrestrial locomotion capabilities, we reviewed works on a closely related topic of search planning for heterogeneous search teams with unmanned aerial vehicles (UAVs) and unmanned ground vehicles (UGVs) in WiSAR in Section 1.2. Some works related to multimodal path planning in non-SAR scenarios are discussed in Section 1.3. Lastly, the novelties of this paper are delineated in Section 1.4.
1.1. Influence of Trails on Lost Person Behaviour
Trails are natural choices of paths for a person in the wilderness since they tend to be easier to traverse than off-trail areas potentially covered in vegetation and obstacles. As such, knowledge of existing trails in a search area (such as National Parks) could provide searchers with invaluable information on a lost person’s potential whereabouts. However, only 27% of lost hikers reported in the International Search & Rescue Incident Database were found on trails and other linear features [16], suggesting that it would be inadequate to assume lost persons always remain on-trail and that it is important to understand how trails influence a lost person’s travel.
In order to study how a person lost in the wilderness may strategize his/her travel in an attempt to re-orient themselves, [17] conducted structured interviews with lost persons shortly after their rescue. In doing so, several behavioural patterns emerged that revealed how trails provide guidance to lost persons in the wilderness, one of which is the route-travelling strategy. Targets who employ such a strategy would travel along a trail, away from the LKP, with the hope that it would guide them toward somewhere familiar or safe. Although, at some point in time, the target might give up on following the trail and start wandering randomly off-trail instead. Believing that safety lies ahead, they are, usually, reluctant to reverse their direction to go back to where they started. The work in [18] and [19] identified this pattern of trail-following followed by abandoning the trail, when analyzing global positioning system (GPS) track logs retrieved from an online database and collected through an experiment with ten participants.
Based on the qualitative behavioral pattern that emerged from lost-person behaviour, several models have been proposed. In [20], the authors modelled route-travelling behaviour in a grid map, in which the target may move into neighbouring cells that align with the direction of the trail. While the tendency to follow nearby trails is captured in the model, the potential that the lost person would depart from the trail somewhere along it is omitted. The work in [19] proposes a detailed model that incorporates the effects of re-orientation strategy, perception, and environment. In their model, the route-travelling strategy is considered as part of a larger category of strategy in which the target’s heading is not influenced by the intention to go to a specific point. The target’s preference to stay on-trail is incorporated into a transition table that attracts the target to move towards or continue on a trail in sight, while the behaviour of abandoning the trail is modelled as a change in re-orientation strategy potentially triggered by events including, but not limited to, coming to the end of a trail and seeing a landmark of interest.
1.2. Heterogeneous UAV-UGV Teams in WiSAR
Search agents with various sensing and locomotion capabilities, such as static sensor networks, UAVs, and UGVs, have been proposed for search and rescue (SAR) applications [21,22,23,24,25,26,27,28,29,30,31,32,33,34,35,36]. Specifically, the use of UAVs has received significant attention due to their mobility and ability to collect information from a high vantage point. In WiSAR, however, the perception of targets on the ground poses a challenge to UAVs due to limited sensing resolution and potential occlusions, such as tree canopy and fog.
Some researchers have also proposed techniques such as thermal imaging [37] and the use of aerial locomotion under canopy to enhance UAV capabilities [38]. Others have proposed the use of heterogeneous UAV-UGV teams to exploit synergies between their complementary characteristics in perception, mobility, payload, and battery life.
In [26], for example, a heterogeneous UAV-UGV team is used to carry out delivery tasks with different payloads, urgency levels, and destinations in a WiSAR scenario. Considering the task characteristics and the capabilities of the heterogeneous team members, the tasks are allocated amongst the agents to effectively utilize the agents. The work in [39] outlines a cooperation framework for humans, UAVs, and UGVs in alpine WiSAR scenarios. In this framework, UAVs utilize their superior maneuverability and high vantage point for patrolling, surveillance, and mapping, while UGVs act as transportation carriers and charging docks for the UAVs. In [35], both UAVs and UGVs actively search for the target in a coordinated manner, though once a potential target is detected by a UAV, a UGV in the team is dispatched to confirm the detection. As such, the search is able to benefit from UAVs’ fast and large area coverage, while potential false–positive detections by UAVs are verified by UGVs. Although the cooperative and coordinated use of aerial and terrestrial locomotion has been considered in search planning for heterogeneous UAV-UGV teams, search planning for a team of multimodal aerial–terrestrial agents has not been explored to the best of our knowledge.
1.3. Multimodal Path Planning
Beyond the realm of SAR, multimodal path-planning for robotic agents has also been proposed. For example, in [40], drones that can choose between flying and riding on top of vehicles during their journey to a destination are considered. A shortest-path algorithm on a time-dependent directed cyclic graph is used at the top of the hierarchical planning framework to decide the locomotion mode for different parts of the journey, while an inner layer executes the decisions and handles control under uncertainty. In [41], a bimodal robot is considered in an environment comprising regions that can only be traversed in a specific locomotion mode. Nodes are sampled in the environment with the constraint that no edges can cross region boundaries, resulting in a graph in which visiting a node on region boundaries corresponds to a switch in modality. In [42], energy- and time-efficient path planning for a group of mobile robots capable of driving and flying, each with a unique starting position and destination, is considered. Two methods are proposed: (i) A fast but non-optimal method that assigns priority to robots and plans a collision free path for each robot in the order of their priority; and (ii) a method that produces optimal solutions with integer linear programming.
1.4. Contribution
In this paper, we consider the deployment and search planning of a multimodal aerial–terrestrial robot team in wilderness search and rescue (WiSAR) scenarios. We utilize iso-probability curves as an efficient representation of probabilistic information on the target’s whereabouts to guide search planning [43,44]. Briefly stated, in a polar coordinate system centered at the lost person’s last known position (LKP), iso probability curves delimit the radial distance of the closest th percentile target to the LKP at any given angular position and time. Iso-probability curves form time-dependent continuous contours encircling the LKP, and searches guided by iso-probability curves have been proven effective in similar WiSAR scenarios [22,31,32,35,45,46,47,48,49].
The search planning method proposed herein is novel in two primary ways, as detailed below. First, it uses 3D iso-probability curves to capture target distributions under the influence of a priori known walking/hiking trails, modelled on the basis of the route-travelling re-orientation strategy. Due to the tendency to follow trails, it might be more likely to find the target when searching on or around the trail, and this 3D iso-probability curve representation differs from the original iso-probability curves in that we are able to represent the probability of finding the target at different angular positions along the original probability curves encircling the LKP.
Secondly, the new method simultaneously optimizes trajectory waypoints and locomotion modes, in Monte Carlo tree search (MCTS), using a tree structure to represent decisions involved in multimodal iso-probability-curve-guided search trajectory planning. Previous works on heterogeneous UAV-UGV search teams have demonstrated that WiSAR may benefit from the utilization of multiple modes of locomotion. Instead of using a heterogeneous team consisted of unimodal agents capable of different modes of locomotion as addressed in previous works, the method differs in that it addresses search planning for a team of multimodal search agents in a WiSAR scenario. This problem is challenging in that mode selection needs to be considered alongside path-planning, while ensuring that the overall objective of maximizing the chance of finding the target is achieved.
The proposed multimodal search planning method utilizes 3D iso-probability curves to capture the target distribution resulting from route-travelling strategy, though the 3D curve formulation is not specific to the route-travelling strategy. Namely, the 3D curve formulation can be used to represent distributions generated by other target motion models, and the resulting 3D curves can be used in the proposed curve-guided multimodal search planning method.
2. The Search Problem
This paper considers a WiSAR scenario in which a mobile target is to be located in a wilderness environment with a priori known trails and obstacles, within a pre-defined period of search time, starting at and ending at . The subsequent operations, including rescue of the found target, are beyond the scope of this paper.
Since the target remains mobile throughout the duration of the search, the expanding search area cannot be exhaustively searched with the limited resources available. Thus, the goal of search planning is to maximize the probability of finding the lost person within the search time.
2.1. Assumptions
This paper makes several assumptions regarding the lost person, also referred to herein as the target, and the multimodal search agents.
2.1.1. The Target
When a person is reported missing, an SAR agency builds a lost person’s profile, which can include but is not limited to the target’s LKP, demographic information, possible destinations, and familiarity with the area [16]. SAR texts frequently highlight the importance of conducting thorough information-gathering because it forms the basis of the search planning process [16,50,51]. For example, utilizing semantic information about the search space [52] and accounting for target motion as a result of drift in maritime search and rescue [53] have been shown to improve search performance.
With the information collected, a lost-person motion model can yield a probabilistic prediction of the target’s whereabouts, based on which the search operations are planned. Herein, it is assumed that the target’s LKP was on a trail in a wilderness setting, in accordance with the route-travelling strategy described in [16]. It is also assumed that the target neither evades nor cooperates with the search operations.
2.1.2. The Search Agents
Aerial locomotion is, typically, more energy-demanding than would terrestrial locomotion. As a result, how much each mode is utilized would dictate overall energy consumption and how long robots could operate. Herein, it is assumed that all robots have enough energy to sustain the search operations for the entire search duration, irrespective of how much each locomotion mode is utilized. In addition, mode transition times are assumed to be negligible (i.e., instantaneous mode transitions) and can take place anywhere in the search space. Throughout the search, search agents can also perform global positioning and maintain communications with a central search planner.
As the search agents travel along their respective trajectories, on-board sensors continuously monitor the areas for target presence. Multimodal robots’ travel speeds and sensing ranges may differ as they switch between locomotion modes. Herein, let and denote the travel speeds and let and denote the detection radii in aerial and ground/terrestrial modes, respectively, where and , consistent with how current aerial robots and terrestrial robots generally compare, although the proposed method is not constrained by these assumptions.
Regarding the robots’ sensing capabilities, we assume a binary disk sensing model, in which the robot can detect a target within its detection range, as long as the target is visible to the searcher. In an area with tree canopy, the searcher’s view of the ground could be partially occluded in aerial mode. This paper assumes the availability of two time-independent visibility maps that inform the search planner of a priori known occlusions in aerial and terrestrial modes.
Although aerial mode offers a high vantage view that covers a large area, one may note that increasing this area viewed by the camera may result in increasing difficulty in target detection with high confidence due to limited sensing resolution. When a potential sighting of the target is identified in aerial mode, the searcher may transition to terrestrial mode and intercept the target on the ground to confirm the detection. If the detection is confirmed to be a true-positive, the search ends. Otherwise, the search continues. Although the aerial detection, mode-transition, and ground interception sequence described above is not addressed herein, in practice, it may be implemented to deal with detection uncertainty due to limited resolution and high vantage point in aerial mode.
2.1.3. Search Planning
Trajectories for the multimodal search agents need to be planned offline between the time that the SAR agency receives the lost-person report to the time that they are deployed. This, primarily, entails deciding where to search and which locomotion mode to employ along the search trajectories in order to maximize probability of success (PoS).
PoS can be expressed as the joint probability of the following events that:
- The target is in a specific area being searched. The probability of this event is known as probability of area (PoA) and it depends on the target’s motion, which is estimated by a target motion model; and,
- A searcher can detect the target, given that the target is in the area searched. The probability of this event is known as probability of detection (PoD) and it depends on how the plan utilizes search resources in the area.
An optimal search plan that maximizes PoS would require that all areas in the search space receive a level of coverage, from search agents, that is proportional to their probability density, defined as PoA per unit area [54]. This search plan achieves a balance between exploration and exploitation by proportionally, allocating more search effort to areas with higher likelihoods of target presence, at the same time ensuring that search efforts are also distributed to areas with lower likelihoods of target presence. However, such a search plan might require the agents to move instantaneously from one place to another in order to achieve proportionality between coverage and probability density. Disregarding the travel-time expenditure when formulating a search plan could result in significant discrepancies between the planned trajectory and the actual trajectory when executing the plan. Thus, this method of allocating search effort proportional to PoA is not operationally feasible since the robots move at finite speeds.
Thus, this paper utilizes iso-probability curves that form time-dependent continuous contours around the LKP to guide search trajectories [43,44]. They have some characteristics that make them useful in search planning. For example, they evolve over time to reflect the motion of a mobile target. Also, by definition, the curve density at different percentiles reflect the probability of target location in the corresponding percentile regions. Furthermore, searches guided by iso-probability curves have been proven effective in similar WiSAR scenarios [22,31,32,35,45,46,47,48,49]. Further background information on iso-probability curves is provided in Section 2.2.
As such, in this paper, two problems are addressed: the first problem addressed is one of extending the iso-probability curve formulation to capture the influence of trails on the target’s probability distribution in the search space, Section 3.1. The second problem addressed is one of planning a multi-modal iso-probability curve-guided search to maximize the probability of finding the target within the allotted search time, Section 3.2.
2.2. Background
This section provides relevant, though brief, background information on iso-probability curves and Monte Carlo tree search.
2.2.1. Iso-Probability Curves
First proposed in [43], iso-probability curves delimit boundaries of target propagation in the direction radially outward from the LKP with the expanding search area, forming time-dependent 2D contours that encircle the LKP as shown in Figure 1.
Let us consider a target location density function in polar coordinates, , which describes the target probability distribution in the search space at time . The target distribution along a ray, emanating outward from LKP, at angular position at time can, then, be expressed as:
where the corresponding cumulative distribution function (CDF) is:
Above, the qth percentile iso-probability curve is defined in polar coordinates as , where is the inverse CDF.
The 2D iso-probability curves are fully define by radial target distributions, . As such, there is no means to capture non-uniform angular target distributions with this formulation. Thus, this limits the applicability of iso-probability curves, in their original form, to search areas with trails and linear features, where the target might have preferred directions of travel.
2.2.2. Monte Carlo Tree Search
Monte Carlo tree search (MCTS) is a best-first tree search method that uses the results of stochastic simulations to direct tree growth to focus on more promising regions of the tree [55]. In contrast to brute force search methods that exhaustively search all regions of the tree, a best-first tree search method, like MCTS, does not guarantee solution optimality, though it has a lower time complexity and memory demand. In addition, successful applications of MCTS, in a wide range of game and non-game domains have demonstrated its power and versatility. In particular, its versatility can be attributed to the fact that it is a generic algorithm applicable to any problem that can be modelled using a tree structure. Namely, it can grow a tree and make decisions based on accumulated statistics of random samples taken in the solution space without the need of domain-specific knowledge. However, incorporating domain-specific knowledge into MCTS has been shown to improve solution quality [55,56,57,58]. The progressive bias variant is one such approach that applies domain-specific knowledge as heuristic functions to bias the selection towards more promising actions [57].
3. Proposed Method
This section describes our proposed methodology to address the problems outlined in Section 2 above. The problem of target-motion prediction in the presence of trails in the wilderness, along with a 3D iso-probability curve formulation to capture the resulting distribution, is detailed in Section 3.1, and the problem of multimodal search planning is detailed in Section 3.2, respectively.
3.1. Target-Motion Prediction
Numerous past behavioral studies reveal how a lost person’s movements might be influenced by the presence of travel aids in the environment, such as walking/hiking trails, streams, railway tracks, and drainages [16,17,50,59]. From a qualitative description of the route-travelling strategy discussed in Section 1.1, herein, we construct a model that replicates this behavior (Section 3.1.1). Based on this model, predictions on lost-person motion can be generated to inform the search planning process. In order to represent the predictions in a form that will be useful to the search planner, Section 3.1.2 proposes the use of 3D iso-probability curves—an upgraded version of the iso-probability curves first introduced in [43].
3.1.1. Target Motion Modelling in an Environment with Trails
Herein, we adapt the target motion model first described in [21], assuming the lost person’s LKP is on a trail and considering the potential that the lost person might depart from the trail after a while. The target’s path is modelled with connected line segments that are initially aligned with the trail, though, eventually may wander off the trail. At the end of each line segment is a decision point where the target can decide on:
- 1.
- The length of the next segment, , where the lengths are uniformly distributed between 0 and :and,
- 2.
- The heading of the next segment, where
- a.
- For a target that is on-trail, its decision on whether it will depart from the trail at a decision point is modelled as a Bernoulli trial with a probability of staying on-trail being :If the target decides to stay on trail (i.e., ), the next heading will continue to be aligned with the trail. If the target decides to leave the trail (i.e., ), the next heading will be selected from the following distribution:where is the target’s angular position in a polar coordinate system centered at the LKP. This heading distribution models the target’s tendency to start wandering away from the LKP after deciding to stop following the trail. The p/4 range includes all headings with a radial component larger than the tangential component, which would move the target radially away from LKP while limiting travel in the tangential direction.
- b.
Above, determines the maximum distance the target travels until they change their heading, which can be interpreted as a measure of the target’s persistence, . This parameter determines how likely the target will choose to stay on the trail at decision points, which can be interpreted as a measure of the target’s tendency to follow trails, and it is assumed to be available from expert knowledge or statistical data. In addition, above, determines the target’s degree of wandering after their departure from the trail.
With the target-motion model established, target trajectories can be simulated to obtain a time-dependent target distribution. Using the cell-based density prediction method presented in [21], the simulated target distribution can be converted to a target location likelihood function , which describes the likelihood that the target is at location at time . An equivalent target location likelihood function in polar coordinates is denoted as . When the lost person encounters an obstacle, he/she takes the shortest path around the obstacle and continues in the original heading. Although the simplified lost person model presented herein does not incorporate other environmental factors, such as terrain slopes, vegetation type, and trail intersections, the extensions needed to incorporate these factors, along with references to related works, are discussed below.
Environmental factors, such as terrain slope, natural features (lakes, streams, cliffs, ridges), and vegetation, may influence target motion. For example, people tend to prefer walking through sparse vegetation over dense vegetation and avoid steep slopes when possible. In [18] and [19], using a discretized grid representation, three maps are created in which each cell is encoded with local topography, elevation, and vegetation information, respectively. Transition probabilities between neighbouring cells are, then, specified based on statistical data and expert knowledge of the influence of topography, elevation, and vegetation on target motion on the corresponding maps.
In the case that multiple trails are present in the search space, the lost-person behaviour model would need to incorporate a model for trail selection at trail intersections. For example, in [19], trail selection is modeled in a transition table, in which transition probabilities are assigned according to expert knowledge and statistical data to predict which trail the target would take.
3.1.2. 3D Iso-Probability Curves
The 2D iso-probability curves capture the radially outward propagation of targets. However, the presence of travel aids (trails, etc.) in the search space may suggest non-uniform probability of finding the target at different angular positions—which cannot be effectively captured by a 2D iso-probability curve. Namely, 2D curves can tell us how far the fastest qth percentile target has travelled in any direction, but they cannot tell us if the target would be more likely to be found in a direction over another. In order to capture the target’s preference on direction of travel, our proposed new method introduces a third dimension to the original 2D curves, augmenting them into 3D curves.
As stated above, the 2D version of th percentile iso-probability curve can be expressed as in polar coordinates. The proposed method augments the original 2D iso-probability curves to account for non-uniform angular distributions along the curves by introducing the angular target distribution conditional on the percentile curve at Time Step t as the height to form 3D iso-probability curves in a polar cylindrical coordinate system. is a 1D distribution along the qth percentile iso-probability curve from the target location likelihood function, :
As such, the original 2D qth percentile iso-probability curves, defined as in polar coordinates, are augmented to include a third dimension labeled as angular target distribution in Figure 2, becoming in polar cylindrical coordinates.
3.2. Search Planning
In an iso-probability curve guided search, a searcher traverses along its assigned iso-probability curve, specified by a time, , and a target percentile, . As the search progresses, iso-probability curves propagate outward to account for search area expansion, Figure 1, which is an important characteristic of a mobile target search. In addition, the curves are, by definition, denser around percentiles where the target has a higher probability of being located, allowing the search to cover the corresponding region more thoroughly. This section details steps involved in the generation of a multimodal search plan guided by iso-probability curves.
The search-planning framework is illustrated in Figure 3, and outlined in the pseudocode in Algorithm 1.
Lines 1–2 in Algorithm 1 outline the partitioning task (Section 3.2.1), which divides of the overall search into sub-tasks, also referred to herein as partitions. Task allocation, detailed in Section 3.2.2 and outlined in Algorithm 1, Lines 4–12, determines how the available searchers are allocated across the partitions: It first plans trajectories and evaluates the search success rates achievable by different numbers of robots assigned to each partition, Algorithm 1, Lines 5–11. Namely, for each partition, the task of trajectory planning (invoked in Algorithm 1, Line 7, outlined in Algorithm 1, Lines 16–22, and further detailed in Section 3.2.3) is repeated with different numbers of robots to evaluate the search success rates achievable. This builds a collection of data, referred to in Algorithm 1 as success_rate_collection, in which the search success rate for any combination of partition and number of robots considered is available. The task allocation stage, then, uses the information in success_rate_collection and finalizes robot-to-partition allocation to maximize the overall search success rate, represented in Algorithm 1, Line 14 and detailed in Section 3.2.2.
| Algorithm 1. Search planning pseudocode. | |
| 1 | number_of_partitions←DeterminePartitionNumber(number_of_robots, number_of_intersections) |
| 2 | partitions ← CreatePartitions(number_of_partitions) |
| 3 | |
| 4 | for each partition in partitions |
| 5 | for each number_of_robots_in_partition in NumberOfRobotsInPartitionProposal( |
| 6 | number_of_robots, number_of_intersections) |
| 7 | paths ← PlanTrajectories(number_of_robots_in_partition, partition) |
| 8 | save paths in paths_collection |
| 9 | success_rate ← Evaluate(paths) |
| 10 | save success_rate in success_rate_collection |
| 11 | end for |
| 12 | end for |
| 13 | |
| 14 | search_plan ← AssignRobotsToPartitions(success_rate_collection, paths_collection) |
| 15 | |
| 16 | function PlanTrajectories(number_of_robots_in_partition, partition) |
| 17 | starting_locations ← SelectStartingLocations(number_of_robots_in_partition, partition) |
| 18 | for each location in starting_locations |
| 19 | path ← MCTS(location) |
| 20 | save path in planned_paths |
| 21 | end for |
| 22 | return planned_paths |
3.2.1. Partitioning
At any given time, the search area is bounded between the 0% and 100% iso-probability curves. The proposed method divides the 0% to 100% range into partitions, forming sub-tasks that can be assigned to searchers. A searcher assigned to a partition starts the search on its lower partition bound and remains within the partition throughout the search following curve-guided trajectories. In the proposed method, curves are used to guide aerial and terrestrial trajectories the same way as they are used to guide UAV and UGV trajectories, respectively, in [35]. When the searcher is in terrestrial mode, it stays on the same curve and does not move towards the upper bound of its partition. Since the searcher has a higher aerial speed, having the searcher stay on the same curve in aerial mode would heavily bias the search towards selected curves while leaving other regions unsearched. Thus, in the proposed method, when the searcher is in aerial mode, it searches a range of curves while progressing towards the upper bound of its assigned partition.
The search partitions can be defined by specifying partition boundaries within the 0% to 100% range, creating partitions, with the first partition starting at 0% and the last partition ending at 100%. Since the partition boundaries can be anywhere within the 0% to 100% range, theoretically, there would be infinite ways to create the partitions. However, characteristics of iso-probability curves, such as variations in length and density of iso-probability curves at different percentiles, should be considered in order to plan an effective search.
Adapting the method from [35], the partitions are created to ensure that a robot assigned to any partition would be able to traverse across the partition (i.e., starting at the lower bound and ending at the upper bound) in aerial mode within the allotted time with equal coverage on each intermediate curve. One may note that the method in [35] is intended for a team of unimodal aerial robots. Thus, when applied to the multimodal search planning problem at hand, a searcher would only reach the end of its assigned partition range if it stayed in aerial mode throughout the search. Namely, the more time it spends in terrestrial mode, focusing on searching along a specific curve, the larger the range of percentiles at the end of the partition would remain unsearched. In order to address this, an adaptation is incorporated into the trajectory generation process, described in Section 3.2.3 below, to compensate the time spent on searching along a single curve in terrestrial mode.
With the partitioning method established, a unique partition scheme can be formulated for any number of partitions . Given a search scenario, the number of partitions a search is divided into is determined as follows: due to the natural tendency to follow trails, 3D iso-probability curves peak at angular positions that intersect with trails, as seen in Figure 2, indicating that the target is likely located in the corresponding angular regions. Let denote the number of intersections, or crossings, between the curve and trail(s). The proposed method assigns at least searchers to each partition, allowing at least one searcher to search around each trail if needed.
Since the number of searchers () available is finite, the number of partitions () that can be created, while ensuring that at least searchers are in each partition, is between 1 and , inclusive. With a small , the searchers are limited to starting on a limited set of curves, resulting in a search that is heavily biased towards those percentiles early on in the search. In order to address this bias, the proposed method creates partitions, reducing the bias by distributing the searchers across a larger set of iso-probability curves.
3.2.2. Task Allocation
This section describes how robots are allocated across partitions generated by the method presented in Section 3.2.1. Since a minimum of robots are assigned to each partition, the number of robots that can potentially be assigned to a partition is between and . The second term in the upper limit, , denotes the number of searchers available after assigning robots to each of the partitions. These additional searchers, if any, may be assigned to any partition, and, the allocation of to robots to each partition is proposed to the Trajectory Planning task described in Section 3.2.3, which plans and evaluates the search success rates achievable respectively. Let denote the simulated search success rate achievable by assigning j robots to the ith partition, generated by the repeated executions of trajectory planning. Task allocation is then finalized by determining a robot-to-partition assignment scheme that maximizes the overall search success rate, detailed below.
Robot-to-partition assignment can be formulated as a linear integer programming problem, in which the optimization variables are :
The objective function to be maximized is the total search success rate, achieved by searches conducted across all partitions. Herein, it is assumed that the searches conducted in different partitions are independent, so the total search success rate can be obtained by summing the rates achieved in individual partitions:
Maximize
Subject to
Equation (10) above enforces that each partition must be assigned a certain number of robots, between and , inclusive. Equation (11), in turn, ensures that a total of robots are assigned across all partitions.
One may note that, although search paths in different partitions are planned independently, searchers increase the chances of finding the target in their respective partitions by collaborating with each other to avoid unnecessary repeated coverage of the same area.
3.2.3. Trajectory Planning
Section 3.2.1 and Section 3.2.2 above addressed the allocation of search resources across the target propagation percentiles, which determines the distribution of resources across targets at different percentile speeds. The innermost search-planning layer, detailed below, generates multimodal curve-guided search trajectories, which determines how search resources are distributed in the angular direction.
Trajectory generation is done on a partition-by-partition basis. Let denote the number of robot trajectories to be planned in the partition. The goal, then, is to fully define search trajectories starting on the lower bound of the partition to maximize the search success rate achieved in the respective partition. The proposed method first selects their starting angular positions on the lower partition bound. Then, complete search trajectories are planned from their starting locations, following the propagation of iso-probability curves. For each searcher, a tree structure is proposed herein to represent the decisions involved in trajectory planning. With this representation, a path from the first level to the last level of the tree would fully define a search agent’s trajectory from to .
The following sections, in turn, describe how the starting positions are determined (Selection of Starting Angular-Positions), the decisions involved in trajectory planning (Trajectory Generation I), search tree construction (Trajectory Generation II), the application of MCTS to optimize search success rate achieved collectively by robots in the partition (Trajectory Generation III), and the use of 3D iso-probability curves as heuristics in MCTS to improve solution quality (Trajectory Generation IV).
Selection of Starting Angular-Positions
Each of the searchers start on the lower percentile bound of the partition and needs to be dropped off at specific angular positions on the curve. The proposed method samples equally-spaced candidate starting angular positions on the curve. Amongst them, a set of unique angular positions are selected to maximize the probability of encountering the target at . The selection of angular positions can be solved as the standard knapsack problem [60]. The solution would specify an initial search deployment scheme that prioritizes searching angular positions with higher probabilities of encountering the target.
Trajectory Generation I: Selections of Locomotion Mode and Direction of Curve Traversal
In a lost-person incident, in which the target is equally likely to be found in any angular position, searchers should uniformly search in all directions like the strategies proposed in [22,32,35,45]. However, when there is an uneven distribution of target location likelihood in the angular direction, enabling the searchers to search high-probability angular regions more thoroughly could improve the probability of locating the target.
The proposed method incorporates mode and direction selections for curve-guided trajectories to allow for non-uniform angular search effort distribution. Different modes of locomotion are associated with different locomotive and sensing characteristics. In aerial mode, although the detection range is large, the searcher performance could potentially suffer from poor visibility due to the forest canopy, and the opposite can be said about terrestrial mode. Therefore, the search could benefit from switching to terrestrial mode to spend more time in angular regions where the target is more likely located. In addition, by allowing searchers to switch the direction in which they traverse along iso-probability curves (i.e., counter-clockwise or clockwise), certain angular regions can be repeatedly searched, resulting in trajectories that are biased towards searching those angular regions.
Trajectory Generation II: Tree Structure
For each robot, a tree structure is used to represent the sequential decisions involved in generating its trajectory. Each level of the tree corresponds to a time instance and contains nodes that represent candidate trajectory waypoints at the respective time instance. The root node of the tree represents the searcher location at , which is determined by the starting angular-position selection process.
Starting at the root node, moving one level down the tree corresponds to moving forward in time by a period of . Each node has four outgoing edges that represent all potential actions that a robot can take in the next period of : (i) moving counter-clockwise in aerial mode; (ii) moving counter-clockwise in terrestrial mode; (iii) move clockwise in aerial mode; and (iv) move clockwise in terrestrial mode. Each action would lead to a different trajectory waypoint at the next time instance, and the four potential trajectory waypoints are represented by four children nodes in the next level of the tree (Figure 4).
Once an action is selected from a node, the location of the next trajectory waypoint, represented by a child node, is determined similarly to the method proposed in [35], on top of which we have incorporated modifications for multimodal searchers with selective directions of curve traversal, detailed below.
Let us consider a robot at angular position on the percentile curve at time . If the robot were to search in terrestrial mode between and , it would progress radially outward while moving either clockwise or counter-clockwise, to intercept the same curve at . Thus, at Time , the searcher would be on the same curve as before:
The left-hand-side of Equation (13) represents the distance between the searcher location at Time , and a point at Angular Position on the same iso-probability curve after a time interval of . The right-hand-side of the equation represents the distance the search agent can travel in a time interval of . As such, solving for would return two solutions, corresponding to two angular positions at which the robot could intercept its assigned curve at if it were to travel clockwise or counter-clockwise along the curve in terrestrial mode. When encountered with obstacles on the ground in terrestrial mode, the searcher takes the shortest path around the obstacle and returns to the curve.
In aerial mode, the robot traverses a range of iso-probability curves in the time interval of instead of staying on the same percentile curve. Since the searcher is faster in aerial mode, allowing the robot to search the same percentile curve would lead to a search that is heavily biased towards specific percentiles. The radial progression in aerial mode allows the robot to move up to higher percentiles as the search progresses. As proposed in [35], for generating curve-guided UAV trajectories, traversing a range of percentiles with equal coverage of the intermediate percentiles can be achieved by maintaining a proportionality between curve percentiles and angular positions traversed. The relationship can be expressed as:
Above, the proportionality constant, c, controls the effort that the searcher spends on the percentiles traversed in aerial mode. It depends on the searcher’s speed, and it is set to a value that allows a searcher to get to the end of its partition by the end of search. For example, a fast searcher would be able to spend more time to cover a larger angular range on each intermediate percentile, resulting in a more thorough search (Figure 5).
The multimodal searchers move at a different speed in each locomotion mode and only towards their upper partition bound in aerial mode. If the proportionality constant, c, was determined assuming the aerial speed, the searcher would only be able to get to the end of its partition with an entirely aerial trajectory. This is true since spending time in terrestrial mode ultimately reduces the amount of time the searcher can spend to move towards the upper partition bound in aerial mode. In order to compensate for this, the proportionality constant, c, is determined assuming a representative speed, , calculated as a weighted sum of terrestrial and aerial speeds:
where weights, and , are proportions of terrestrial and aerial mode utilization, respectively, determined from empirical knowledge on planned search trajectories.
Similar to the interception problem formulated for terrestrial mode, the positions at which the aerial searcher could end up on can be obtained by solving for :
For simplicity, Equations (13) and (18) assume straight-line segments connecting the trajectory waypoints. Methods like those in [61], could be applied to generate smooth trajectories between waypoints instead.
Trajectory Generation III: Multi-Agent Monte-Carlo Tree Search
The tree structure discussed above fully embodies how direction and mode selections shape the search trajectory. Any path from the root node to the last level of the tree forms a valid curve-guided search trajectory. However, the search planner is interested in making direction and mode selections to maximize the search success rate. The proposed framework employs MCTS to make optimal direction and mode selections. MCTS evaluates the paths in terms of their search success rate according to simulation results. Namely, with a representative set of simulated target trajectories, the search success rate of a search plan can be estimates by the fraction of simulated targets detected along the planned trajectories.
In order to plan trajectories for a group of robots, multiple trees would need to be constructed, each grown from a different starting position. Although a separate tree is constructed for each searcher, searchers assigned to the same partition should cooperate with each other to utilize search resources effectively. In order to achieve cooperative behavior, trajectories that belong to the same partition are planned successively, allowing each added searcher to account for trajectories that have already been planned for other searchers in the same partition. Namely, when planning a trajectory in a partition in which one or more robot trajectories have been planned, MCTS evaluates the trajectory according to the search success rate achieved by all robots in the partition as a team.
Trajectory Generation IV: 3D Iso-Probability Curves as Heuristic Functions in MCTS
A heuristic function is formulated herein based on 3D iso-probability curves to incorporate domain knowledge to MCTS. In the Progressive Bias framework, the heuristic function is applied to all actions that can be taken from a node to bias the selection policy towards actions with higher heuristic values [57]. Previous works on MCTS have shown that using domain knowledge to bias move selection could improve solution quality and reduces variance at the cost of computation time [55,56,57,58].
As detailed in Section 3.1.2, 3D iso-probability curves capture variation in target density along the 2D iso-probability curve contours, which can be used to guide the search to cover angular regions with higher target location probabilities more thoroughly (i.e., regions around a trail). Since iso-probability curves form closed contours encircling the LKP, a searcher can get to any other position on the curve by travelling along the curve in either direction. Nevertheless, the curve can be split into two sections, with one containing all the points that can be reached via a shorter distance in the clockwise direction, and vice versa for the other section, Figure 6a. The proposed heuristic function evaluates the actions based on their direction of curve traversal by considering 3D iso-probability curve in the corresponding section.
The proposed heuristic function is built upon the artificial potential field-based path planning approach, which has been applied to search planning in [37,62]. At each angular position on the curve, an attraction value is calculated considering its proximity to the searcher and the corresponding 3D iso-probability curve value:
where is the 3D iso-probability curve value defined in Equation (7), and is the searcher’s angular position. The term scales the 3D iso-probability curve according to proximity to the searcher’s location in a fashion that results in high attraction values for positions on the curve that have high target location likelihood and are also in close proximity to searcher location (Figure 6b above).
For each direction of curve traversal, the heuristic value is the max attraction value in its corresponding section. The value is applied to MCTS according to the Progressive Bias framework to create a bias towards the direction that would guide the searcher to a high target location likelihood region in a short amount of time. One may note that this heuristic only considers 3D curves and distance, while ignoring factors such as target visibility, detection radii, and other searchers in the same partition. However, previous works on MCTS have shown that the heuristic need not to be complete to contribute positively to algorithm performance [55], provided that it is able to guide the trajectory in a beneficial way. In addition, a simple, time-efficient heuristic allows valuable computation resources to be used towards running more iterations of MCTS to potentially lower the simulation variance, as supposed to computing a more complicated heuristic.
4. Results and Discussion
A diverse set of search scenarios was simulated in MATLAB to verify our proposed approach. The illustrative simulated search planning example in Section 4.1 below details a search planned according to the proposed framework. The comparative simulated search planning experiments presented in Section 4.2 are designed to validate the effectiveness of multimodal, bidirectional trajectories and the use of a 3D curve-based heuristic function in MCTS. The study in Section 4.3 investigates the method’s robustness to discrepancy between the assumed level of trail persistence, , and the target’s actual level of trail persistence.
4.1. Illustrative Example
In this example, a team of eight identical multimodal aerial-terrestrial robots () are employed to search for a lost person last seen on a trail that runs diagonally through the search space, as illustrated in Figure 7a. The robots move at speeds of and , with detection radii of and in aerial and terrestrial (ground) modes, respectively. In terrestrial mode, searchers need to avoid obstacles on the ground, Figure 7b, where the target would be visible unless the line of sight is obstructed by obstacles, Figure 7d. In aerial mode, searchers can fly over obstacles, but 75% of their view of the ground is occluded (Figure 7c).
As discussed in Section 2.1.1, search planning is performed on the basis of behavioral modelling and SAR database statistics for the target’s demographic group. With the model and information from SAR database statistics, a total of 10,000 target paths are simulated with targets parameters of , , and . The target speeds are sampled from a normal distribution with a mean of and a standard deviation of . The level of the target’s persistence with respect to staying on-trail is assumed to be . Figure 7e shows 200 simulated target trajectories based on these parameters.
The search agents arrive at their deployment positions at and search for 1800 s until . A search planning interval of is used to generate the plan. Namely, at the beginning of every , the searchers choose the direction and locomotion mode for the duration of the interval. The search is divided into partitions, amongst which robots are allocated, as detailed in Table 1.
In the trajectory-generation process, mode and direction selections are optimized by MCTS with an exploration constant () of and a limit of 400 iterations. Figure 8 shows the complete search trajectories from to . Trajectory segments traversed in aerial and terrestrial modes are in blue and green, respectively.
Figure 9 shows four snapshots of the simulated search scenario. The target trajectory, in red, is shown in its entirety from to the specific moment captured by the snapshot. For clarity, the search trajectories shown are only the sections traversed in the previous in each snapshot. At, Figure 9a, the target has already left the LKP, and the robots start searching from their starting positions in their respective partitions. At , Figure 9b, the searchers have been following the search plan, but they have not yet found the target. At , Figure 9c, the target is within the detection range of a searcher in aerial mode; however, the searcher is unable to detect it due to occlusions (e.g., foliage and fog) captured in Figure 7c. At (Figure 9d), the target is found by a searcher at (x,y) = (1697.2, 2454.2) in terrestrial mode.
4.2. Comparative Simulated Experiments
In order to validate the effectiveness of incorporating mode and direction selection in curve-guided trajectory generation, simulated experiments were conducted to compare the proposed method against alternative methods with subsets of the proposed locomotion mode and curve traversal direction options (Section 4.2.1). In addition, the effectiveness of 3D iso-probability-curve-based heuristic function to guide the selection strategy in MCTS is demonstrated in comparisons against the default selection strategy (Section 4.2.2).
4.2.1. Selections of Mode and Direction
In this section, unimodal trajectories with fixed curve-traversal direction (Methods 1 and 3) are used as benchmarks for comparison against other methods. Methods 2 and 4 generate unimodal trajectories with selective curve-traversal direction in terrestrial and aerial modes, respectively. The searchers have the ability to switch curve traversal directions to repeatedly search angular regions with high target densities when needed, instead of having to make its way around the LKP to get back to the same or another high target-density angular region. This allows the searchers to concentrate their efforts on angular ranges in which the target is more likely to be found. Method 5 generates multimodal trajectories with fixed curve-traversal direction. Although searchers travel along iso-probability curves in a fixed direction, they are able to select locomotion modes that better suits local search conditions along the trajectories. Finally, Method 6 generates multimodal trajectories with selective curve traversal-direction. As such, the goal of the simulated experiments presented herein is to quantify and compare how locomotion mode and curve-traversal direction selections, enabled by the method proposed in this paper, contribute to search effectiveness, Table 2.
The search scenario used in the comparative simulations is identical to the scenario described in Section 4.1. With the exception that each of the six cases summarized in Table 2 above was tested with target distributions with three levels of persistence with respect to staying on-trail (), Figure 10.
Figure 11 shows where the simulated targets are detected by the search team, and Table 3 shows the number of simulated targets detected by the search team over the duration of the search with different target distributions and search methods. Since MCTS is stochastic in nature, it may generate a different trajectory every time it runs. The results presented in Table 3 are based on a sample of size ten. One may note that results for Methods 1 and 3 have zero standard deviation. This is due to the fact that no selection is involved in those methods, so MCTS is not applied.
Overall, while Methods that enable one of direction selection (Methods 2 and 4) and mode selection (Method 5) clearly outperform Methods that generate unimodal trajectories with fixed curve-traversal direction (Methods 1 and 3), Method 6, with both mode and direction selections enabled, resulted in the most significant performance improvement. This indicates that both multimodal operations and selective directions of curve traversal contribute positively to the search success rate in Method 6.
It can also be noted that enabling mode and direction selections results in the most significant performance gain in the high trail-bias case. This can be attributed to the fact that the simulated targets are most concentrated around the trail, thus, with appropriate trajectories that direct search efforts towards those regions, it resulted in the most significant performance gain out of the three levels of trail persistence tested.
Additionally, despite having poor target visibility, the ability to cover large areas in a short amount of time in aerial mode is still useful in addition to the ability to select curve-traversal direction, as it is evident from comparing the performance of terrestrial trajectories with selective curve-traversal direction (Method 2) against multimodal trajectories with selective curve-traversal direction (Method 6).
4.2.2. 3D Curves as Heuristic Functions
In order to evaluate the effect of incorporating the proposed heuristic function based on 3D iso-probability curves in MCTS, this section compares the effectiveness of searches planned with and without the use of the heuristic. The search scenario used is identical to the scenario described in Section 4.1. A total of 40 sets of trajectories was planned using each method (Table 4). A two-sample t-test with a 95% confidence interval indicated that the performance improvement gained by using the proposed heuristic function is statistically significant.
4.3. Robustness Study
The importance of investigating the lost-person’s information is commonly emphasized in SAR texts [16,50,51], since having a thorough understanding of the target potentially increases the chance of correctly predicting the target’s whereabouts. Nevertheless, one can expect some discrepancy between the predicted and actual target motions. The effects of deviation in target speed on the search effectiveness of trajectories guided by iso-probability curves were investigated in [63]. Not surprisingly, the results indicated that search performance may drop when the discrepancy between estimated and true target speeds is significant.
Similar to target speed discrepancies, deviations in the level of target trail persistence can also influence search outcomes. In order to investigate the robustness of the proposed method, in this sub-section, we test trajectories generated based on an incorrectly assumed level of trail persistence. For example, robustness of the search plan generated for a high-trail-persistence scenario () is evaluated by applying it to medium- and low-trail-persistence scenarios ( and , respectively), in order to mimic a situation in which a target predicted to have a high level of trail persistence actually had a lower level of trail persistence (Figure 12).
As expected, the flexibility offered by mode and curve-traversal direction selections cannot be fully leveraged when the wrong level of trail persistence is assumed. Figure 12 shows degradation in search performance when the estimated level of trail persistence does not agree with the actual level of trail persistence (i.e., a high-trail-persistence target has the best chance to be found when a high-trail-persistence search plan is applied). It can also be observed that, a smaller discrepancy tends to result in a smaller performance drop. For example, trajectories generated for a medium-trail-persistence scenario is more robust than low-trail-persistence trajectories in high-bias scenarios since the medium-bias scenario has more resemblance to the high-bias scenario. In the absence of knowledge on the level of target-trail bias, a preferred option could be to assume a medium-level of trail persistence since it has the best worst-case performance when applied to scenarios with different levels of target trail persistence, making it the most conservative method.
5. Conclusions
We present herein a novel search-planning method that generates multimodal aerial-terrestrial search trajectories guided by 3D iso-probability curves, with the goal of maximizing the probability of finding the lost person over a defined search period. The augmented iso-probability curves capture non-uniform target distributions along the curves to account for the presence of trails. The trajectory-generation process involves partitioning the search, allocating searchers amongst the partitions, and generating multimodal trajectories. In particular, the mode and curve traversal direction selections are embodied in a tree structure, which allows them to be considered simultaneously in trajectory generation.
Simulated comparative studies show that multimodal probability-curve-guided search trajectories, planned using the proposed tree structure and optimized by Monte Carlo tree search, surpass their unimodal counterparts in terms of search success rate. In addition, 3D iso-probability curves capture the angular target distribution under the influence of trails, and in probability-curve-guided search planning, they serve as an effective heuristic function when applied to Monte Carlo tree search by biasing the search towards angular regions with higher target location likelihoods around the trail. Lastly, the robustness study shows that an accurate target-motion model would be beneficial to fully leverage the flexibility enabled by mode and direction changes along curve-guided trajectories.
Author Contributions
Individual contributions from the authors of this research paper are as follows: conceptualization, S.Y.K., G.N. and B.B.; methodology, S.Y.K., G.N. and B.B.; software, S.Y.K.; validation, S.Y.K.; formal analysis, S.Y.K., G.N. and B.B.; investigation, S.Y.K., G.N. and B.B.; resources, G.N. and B.B.; data curation, S.Y.K.; writing—original draft preparation, S.Y.K., G.N. and B.B.; writing—Review and editing, S.Y.K., G.N. and B.B.; visualization, S.Y.K.; supervision, G.N. and B.B.; project administration, G.N. and B.B.; funding acquisition, G.N. and B.B. All authors have read and agreed to the published version of the manuscript.
Funding
This research was funded by the Natural Sciences and Engineering Research Council of Canada.
Institutional Review Board Statement
Not applicable.
Informed Consent Statement
Not applicable.
Conflicts of Interest
The authors declare no conflict of interest. The funders had no role in the design of the study; in the collection, analyses, or interpretation of data; in the writing of the manuscript, or in the decision to publish the results.
References
- Delmerico, J.; Mintchev, S.; Giusti, A.; Gromov, B.; Melo, K.; Horvat, T.; Cadena, C.; Hutter, M.; Ijspeert, A.; Floreano, D.; et al. The Current State and Future Outlook of Rescue Robotics. J. Field Robot. 2019, 36, 1171–1191. [Google Scholar] [CrossRef]
- Chen, Y.; Wang, H.; Helbling, E.F.; Jafferis, N.T.; Zufferey, R.; Ong, A.; Ma, K.; Gravish, N.; Chirarattananon, P.; Kovac, M.; et al. A Biologically Inspired, Flapping-Wing, Hybrid Aerial-Aquatic Microrobot. Sci. Robot. 2017, 2, eaao5619. [Google Scholar] [CrossRef] [PubMed] [Green Version]
- Lock, R.J.; Vaidyanathan, R.; Burgess, S.C.; Loveless, J. Development of a Biologically Inspired Multi-Modal Wing Model for Aerial-Aquatic Robotic Vehicles through Empirical and Numerical Modelling of the Common Guillemot, Uria Aalge. Bioinspir. Biomim. 2010, 5, 046001. [Google Scholar] [CrossRef] [PubMed]
- Lock, R.J.; Vaidyanathan, R.; Burgess, S.C. Design and Experimental Verification of a Biologically Inspired Multi-Modal Wing for Aerial-Aquatic Robotic Vehicles. In Proceedings of the 2012 4th IEEE RAS & EMBS International Conference on Biomedical Robotics and Biomechatronics (BioRob), Rome, Italy, 24–27 June 2012; pp. 681–687. [Google Scholar]
- Dickson, J.D.; Clark, J.E. Design of a Multimodal Climbing and Gliding Robotic Platform. IEEE/ASME Trans. Mechatron. 2013, 18, 494–505. [Google Scholar] [CrossRef]
- Shin, W.D.; Park, J.; Park, H. Bio-Inspired Design of a Gliding-Walking Multi-Modal Robot. In Proceedings of the 2018 IEEE/RSJ International Conference on Intelligent Robots and Systems (IROS), Madrid, Spain, 1–5 October 2018; pp. 8158–8164. [Google Scholar]
- Horvat, T.; Karakasiliotis, K.; Melo, K.; Fleury, L.; Thandiackal, R.; Ijspeert, A.J. Inverse Kinematics and Reflex Based Controller for Body-Limb Coordination of a Salamander-like Robot Walking on Uneven Terrain. In Proceedings of the 2015 IEEE/RSJ International Conference on Intelligent Robots and Systems (IROS), Hamburg, Germany, 28 September–2 October 2015; pp. 195–201. [Google Scholar] [CrossRef]
- Crespi, A.; Badertscher, A.; Guignard, A.; Ijspeert, A.J. AmphiBot I: An Amphibious Snake-like Robot. Rob. Auton. Syst. 2005, 50, 163–175. [Google Scholar] [CrossRef] [Green Version]
- Yu, S.; Ma, S.; Li, B.; Wang, Y. An Amphibious Snake-like Robot with Terrestrial and Aquatic Gaits. In Proceedings of the 2011 IEEE International Conference on Robotics and Automation, Shanghai, China, 9–13 May 2011; pp. 2960–2961. [Google Scholar]
- Dudek, G.; Giguere, P.; Prahacs, C.; Saunderson, S.; Sattar, J.; Torres-Mendez, L.; Jenkin, M.; German, A.; Hogue, A.; Ripsman, A.; et al. AQUA: An Amphibious Autonomous Robot. Computer 2007, 40, 46–53. [Google Scholar] [CrossRef]
- Daler, L.; Mintchev, S.; Stefanini, C.; Floreano, D. A Bioinspired Multi-Modal Flying and Walking Robot. Bioinspir. Biomim. 2015, 10, 016005. [Google Scholar] [CrossRef] [PubMed]
- Pratt, C.J.; Leang, K.K. Dynamic Underactuated Flying-Walking (DUCK) Robot. In Proceedings of the 2016 IEEE International Conference on Robotics and Automation (ICRA), Stockholm, Sweden, 16–21 May 2016; pp. 3267–3274. [Google Scholar]
- Yu, Y.; Ding, X. On Hybrid Modeling and Control of a Multi-Propeller Multifunction Aerial Robot with Flying-Walking Locomotion. Auton. Robots 2015, 38, 225–242. [Google Scholar] [CrossRef]
- Lock, R.J.; Burgess, S.C.; Vaidyanathan, R. Multi-Modal Locomotion: From Animal to Application. Bioinspir. Biomim. 2013, 9, 011001. [Google Scholar] [CrossRef] [Green Version]
- Russo, M.; Ceccarelli, M. A Survey on Mechanical Solutions for Hybrid Mobile Robots. Robotics 2020, 9, 32. [Google Scholar] [CrossRef]
- Koester, R.J. Lost Person Behavior: A Search and Rescue Guide on Where to Look for Land, Air, and Water; dbS Productions: Charlottesville; dbS Productions LLC: Charlottesville, VA, USA, 2008; ISBN 1879471396. [Google Scholar]
- Hill, K.A. The Psychology of Lost. In Lost Person Behavior; National SAR Secretariat: Ottawa, ON, Canada, 1998. [Google Scholar]
- Lin, L.; Goodrich, M.A. A Bayesian Approach to Modeling Lost Person Behaviors Based on Terrain Features in Wilderness Search and Rescue. Comput. Math. Organ. Theory 2010, 16, 300–323. [Google Scholar] [CrossRef]
- Mohibullah, W.; Julier, S.J. Developing an Agent Model of a Missing Person in the Wilderness. In Proceedings of the 2013 IEEE International Conference on Systems, Man, and Cybernetics, Manchester, UK, 13–16 October 2013; pp. 4462–4469. [Google Scholar] [CrossRef]
- Hashimoto, A.; Abaid, N. An Agent-Based Model of Lost Person Dynamics for Enabling Wilderness Search and Rescue. In Proceedings of the Dynamic Systems and Control Conference, Park City, UT, USA, 8–11 October 2020; Volume 2, pp. 1–8. [Google Scholar] [CrossRef]
- Kashino, Z.; Kim, J.Y.; Nejat, G.; Benhabib, B. Spatiotemporal Adaptive Optimization of a Static-Sensor Network via a Non-Parametric Estimation of Target Location Likelihood. IEEE Sens. J. 2017, 17, 1479–1492. [Google Scholar] [CrossRef]
- Kashino, Z.; Nejat, G.; Benhabib, B. A Hybrid Strategy for Target Search Using Static and Mobile Sensors. IEEE Trans. Cybern. 2018, 50, 856–868. [Google Scholar] [CrossRef]
- Hood, S.; Benson, K.; Hamod, P.; Madison, D.; O’Kane, J.M.; Rekleitis, I. Bird’s Eye View: Cooperative Exploration by UGV and UAV. In Proceedings of the 2017 International Conference on Unmanned Aircraft Systems (ICUAS), Miami, FL, USA, 13–16 June 2017; pp. 247–255. [Google Scholar]
- Yanguas-Rojas, D.; Mojica-Nava, E. Exploration with Heterogeneous Robots Networks for Search and Rescue. IFAC-PapersOnLine 2017, 50, 7935–7940. [Google Scholar] [CrossRef]
- Al-Buraiki, O.; Wu, W.; Payeur, P. Probabilistic Allocation of Specialized Robots on Targets Detected Using Deep Learning Networks. Robotics 2020, 9, 54. [Google Scholar] [CrossRef]
- Rodriguez, M.; Al-Kaff, A.; Madridano, A.; Martin, D.; de la Escalera, A. Wilderness Search and Rescue with Heterogeneous Multi-Robot Systems. In Proceedings of the 2020 International Conference on Unmanned Aircraft Systems (ICUAS), Athens, Greece, 1–4 September 2020; pp. 110–116. [Google Scholar]
- Dias, A.; Fernandes, T.; Almeida, J.; Martins, A.; Silva, E. 3D Path Planning Methods for Unmanned Aerial Vehicles in Search and Rescue Scenarios. In Proceedings of the Human-Centric Robotics: Proceedings of CLAWAR 2017: 20th International Conference on Climbing and Walking Robots and the Support Technologies for Mobile Machines, Porto, Portugal, 11–13 September 2017; World Scientific: Toh Tuck Link, Singapore, 2017; pp. 213–220. [Google Scholar]
- Queralta, J.P.; Taipalmaa, J.; Can Pullinen, B.; Sarker, V.K.; Nguyen Gia, T.; Tenhunen, H.; Gabbouj, M.; Raitoharju, J.; Westerlund, T. Collaborative Multi-Robot Search and Rescue: Planning, Coordination, Perception, and Active Vision. IEEE Access 2020, 8, 191617–191643. [Google Scholar] [CrossRef]
- Woiceshyn, K.; Kashino, Z.; Nejat, G.; Benhabib, B. Vehicle Routing for Resource Management in Time-Phased Deployment of Sensor Networks. IEEE Trans. Autom. Sci. Eng. 2019, 16, 716–728. [Google Scholar] [CrossRef]
- Lee Shin, J.C.; Kashino, Z.; Nejat, G.; Benhabib, B. A Sensor-Network-Supported Mobile-Agent-Search Strategy for Wilderness Rescue. Robotics 2019, 8, 61. [Google Scholar] [CrossRef] [Green Version]
- Vilela, J.; Kashino, Z.; Ly, R.; Nejat, G.; Benhabib, B. A Dynamic Approach to Sensor Network Deployment for Mobile-Target Detection in Unstructured, Expanding Search Areas. IEEE Sens. J. 2016, 16, 4405–4417. [Google Scholar] [CrossRef]
- Kashino, Z.; Nejat, G.; Benhabib, B. Multi-UAV Based Autonomous Wilderness Search and Rescue Using Target Iso-Probability Curves. In Proceedings of the 2019 International Conference on Unmanned Aircraft Systems (ICUAS), Atlanta, GA, USA, 11–14 June 2019; pp. 636–643. [Google Scholar] [CrossRef]
- Wasim, S.; Kashino, Z.; Nejat, G.; Benhabib, B. Directional-Sensor Network Deployment Planning for Mobile-Target Search. Robotics 2020, 9, 82. [Google Scholar] [CrossRef]
- Nedjati, A.; Izbirak, G.; Vizvari, B.; Arkat, J. Complete Coverage Path Planning for a Multi-UAV Response System in Post-Earthquake Assessment. Robotics 2016, 5, 26. [Google Scholar] [CrossRef] [Green Version]
- Kashino, Z.; Nejat, G.; Benhabib, B. Aerial Wilderness Search and Rescue with Ground Support. J. Intell. Robot. Syst. Theory Appl. 2020, 99, 147–163. [Google Scholar] [CrossRef]
- Grocholsky, B.; Keller, J.; Kumar, V.; Pappas, G. Cooperative Air and Ground Surveillance. IEEE Robot. Autom. Mag. 2006, 13, 16–26. [Google Scholar] [CrossRef] [Green Version]
- Schedl, D.C.; Kurmi, I.; Bimber, O. An Autonomous Drone for Search and Rescue in Forests Using Airborne Optical Sectioning. Sci. Robot. 2021, 6, eabg1188. [Google Scholar] [CrossRef]
- Tian, Y.; Liu, K.; Ok, K.; Tran, L.; Allen, D.; Roy, N.; How, J.P. Search and Rescue under the Forest Canopy Using Multiple UAVs. Int. J. Rob. Res. 2020, 39, 1201–1221. [Google Scholar] [CrossRef]
- Marconi, L.; Melchiorri, C.; Beetz, M.; Pangercic, D.; Siegwart, R.; Leutenegger, S.; Carloni, R.; Stramigioli, S.; Bruyninckx, H.; Doherty, P.; et al. The SHERPA Project: Smart Collaboration between Humans and Ground-Aerial Robots for Improving Rescuing Activities in Alpine Environments. In Proceedings of the 2012 IEEE International Symposium on Safety, Security, and Rescue Robotics (SSRR), College Station, TX, USA, 5–8 November 2012; pp. 12–15. [Google Scholar] [CrossRef]
- Choudhury, S.; Knickerbocker, J.P.; Kochenderfer, M.J. Dynamic Real-Time Multimodal Routing with Hierarchical Hybrid Planning. In Proceedings of the 2019 IEEE Intelligent Vehicles Symposium (IV), Paris, France, 9–12 June 2019; pp. 2397–2404. [Google Scholar] [CrossRef] [Green Version]
- Terry Suh, H.J.; Xiong, X.; Singletary, A.; Ames, A.D.; Burdick, J.W. Energy-Efficient Motion Planning for Multi-Modal Hybrid Locomotion. In Proceedings of the 2020 IEEE/RSJ International Conference on Intelligent Robots and Systems (IROS), Las Vegas, NV, USA, 24 October 2020–24 January 2021; pp. 7027–7033. [Google Scholar] [CrossRef]
- Araki, B.; Strang, J.; Pohorecky, S.; Qiu, C.; Naegeli, T.; Rus, D. Multi-Robot Path Planning for a Swarm of Robots That Can Both Fly and Drive. In Proceedings of the 2017 IEEE International Conference on Robotics and Automation (ICRA), Singapore, 29 May–3 June 2017; pp. 5575–5582. [Google Scholar] [CrossRef]
- MacWan, A.; Nejat, G.; Benhabib, B. Target-Motion Prediction for Robotic Search and Rescue in Wilderness Environments. IEEE Trans. Syst. Man Cybern. Part B Cybern. 2011, 41, 1287–1298. [Google Scholar] [CrossRef]
- MacWan, A.; Nejat, G.; Benhabib, B. On-Line Target-Motion Prediction for Autonomous Multirobot Search in Realistic Terrains with Time-Expanding Boundaries: A Novel Probabilistic Approach. In Proceedings of the 2010 IEEE International Conference on Automation Science and Engineering, Toronto, ON, Canada, 21–24 August 2010. [Google Scholar]
- Kashino, Z.; Vilela, J.; Kim, J.Y.; Nejat, G.; Benhabib, B. An Adaptive Static-Sensor Network Deployment Strategy for Detecting Mobile Targets. In Proceedings of the 2016 IEEE International Symposium on Safety, Security, and Rescue Robotics (SSRR), Lausanne, Switzerland, 23–27 October 2016; pp. 1–8. [Google Scholar] [CrossRef]
- Macwan, A.; Nejat, G.; Benhabib, B. Optimal Deployment of Robotic Teams for Autonomous Wilderness Search and Rescue. In Proceedings of the 2011 IEEE/RSJ International Conference on Intelligent Robots and Systems, San Francisco, CA, USA, 25–30 September 2011; pp. 4544–4549. [Google Scholar] [CrossRef]
- Macwan, A.; Vilela, J.; Nejat, G.; Benhabib, B. A Multirobot Path-Planning Strategy for Autonomous Wilderness Search and Rescue. IEEE Trans. Cybern. 2015, 45, 1784–1797. [Google Scholar] [CrossRef]
- Macwan, A.; Vilela, J.; Nejat, G.; Benhabib, B. Multi-Robot Deployment for Wilderness Search And Rescue. Int. J. Robot. Autom. 2016, 31, 124. [Google Scholar] [CrossRef]
- Macwan, A.; Benhabib, B. A Multi-Robot Coordination Methodology for Autonomous Search and Rescue. In Proceedings of the TIC-STH’09: 2009 IEEE Toronto International Conference—Science and Technology for Humanity, Toronto, ON, Canada, 26–27 September 2009. [Google Scholar]
- Syrotuck, W.G. Analysis of Lost Person Behavior: An Aid to Search Planning; Syrotuck, J.A., Ed.; Barkleigh Productions: Mechanicsburg, PA, USA, 2000. [Google Scholar]
- National Association for Search and Rescue. Fundamentals of Search and Rescue; Donald, C.C., Ed.; Jones & Bartlett Learning: Burlington, MA, USA, 2005. [Google Scholar]
- Quattrini Li, A.; Cipolleschi, R.; Giusto, M.; Amigoni, F. A Semantically-Informed Multirobot System for Exploration of Relevant Areas in Search and Rescue Settings. Auton. Robots 2016, 40, 581–597. [Google Scholar] [CrossRef]
- Xiong, P.; Liu, H.; Tian, Y.; Chen, Z. A Time Domain-Based Iterative Method for Helicopter Maritime Search Area Planning and Construction of the Simulation Environment. IEEE Access 2020, 8, 191460–191471. [Google Scholar] [CrossRef]
- Sozas & Company Ltd. The Theory of Search; Sozas & Company Ltd.: Fairfax, VA, USA, 1996. [Google Scholar]
- Browne, C.B.; Powley, E.; Whitehouse, D.; Lucas, S.M.; Cowling, P.I.; Rohlfshagen, P.; Tavener, S.; Perez, D.; Samothrakis, S.; Colton, S. A Survey of Monte Carlo Tree Search Methods. IEEE Trans. Comput. Intell. AI Games 2012, 4, 1–43. [Google Scholar] [CrossRef] [Green Version]
- Drake, P.; Uurtamo, S. Move Ordering vs Heavy Playouts: Where Should Heuristics Be Applied in Monte Carlo Go? In Proceedings of the the 3rd North American Game-On Conference, Gainesville, FL, USA, 10–12 September 2007; pp. 35–39. [Google Scholar]
- Chaslot, G.M.J.-B.; Winands, M.H.M.; Van Den Herik, H.J.; Uiterwijk, J.W.H.M.; BOUZY, B. Progressive Strategies for Monte-Carlo Tree Search. New Math. Nat. Comput. 2008, 4, 343–357. [Google Scholar] [CrossRef] [Green Version]
- Schadd, M.P.D.; Winands, M.H.M.; van den Herik, H.J.; Chaslot, G.M.J.-B.; Uiterwijk, J.W.H.M. Single-Player Monte-Carlo Tree Search. In Lecture Notes in Computer Science (Including Subseries Lecture Notes in Artificial Intelligence and Lecture Notes in Bioinformatics); Springer: Berlin/Heidelberg, Germany, 2008; pp. 1–12. [Google Scholar]
- Heth, C.D.; Cornell, E.H. Characteristics of Travel by Persons Lost in Albertan Wilderness Areas. J. Environ. Psychol. 1998, 18, 223–235. [Google Scholar] [CrossRef]
- Salkin, H.M. The Knapsack Problem: A Survey*. Nav. Res. Logist. 1975, 22, 127–144. [Google Scholar] [CrossRef]
- Croft, E.A.; Benhabib, B.; Fenton, R.G. Near-Time Optimal Robot Motion Planning Foe on-Line Applications. J. Robot. Syst. 1995, 12, 553–567. [Google Scholar] [CrossRef]
- San Juan, V.; Santos, M.; Andújar, J.M. Intelligent UAV Map Generation and Discrete Path Planning for Search and Rescue Operations. Complexity 2018, 2018, 6879419. [Google Scholar] [CrossRef] [Green Version]
- Macwan, A. A Multi-Robot Coordination Methodology for Wilderness Search and Rescue. Ph.D. Thesis, University of Toronto, Toronto, ON, Canada, 2013. [Google Scholar]
Figure 1.
Propagation of three distinct iso-probability curves over time, with the LKP at Position (0,0). The 25%, 50%, and 75% curves are in blue, orange, and yellow, respectively.
Figure 1.
Propagation of three distinct iso-probability curves over time, with the LKP at Position (0,0). The 25%, 50%, and 75% curves are in blue, orange, and yellow, respectively.

Figure 2.
Augmentation of iso-probability curves, plotted in Cartesian coordinates. The 25%, 50%, and 75% curves are in blue, orange, and yellow, respectively.
Figure 2.
Augmentation of iso-probability curves, plotted in Cartesian coordinates. The 25%, 50%, and 75% curves are in blue, orange, and yellow, respectively.

Figure 3.
Search-planning framework.

Figure 4.
Iso-probability-curve-guided multimodal trajectory generation.

Figure 5.
Effect of proportionality constant, c. Higher value of c (blue); lower value of c (orange).
Figure 5.
Effect of proportionality constant, c. Higher value of c (blue); lower value of c (orange).

Figure 6.
The 3D iso-probability curve-based heuristic function. Searcher position is denoted in red; clockwise direction section is denoted in purple; counter-clockwise direction section is denoted in yellow: (a) 3D iso-probability curve, and (b) scaled 3D iso-probability curve (artificial potential field-like).

Figure 7.
Search scenario: (a) trail and LKP, (b) Impassable obstacles on the ground, (c) visibility in aerial mode–occlusions are denoted in black, (d) visibility in terrestrial mode–target is visible unless the line of sight is obstructed by obstacles, denoted in black, and (e) sample target trajectories.

Figure 8.
Planned trajectories for illustrative example: (a) partition 1, (b) partition 2, (c) partition 3, and (d) partition 4. Trajectory sections traversed in aerial mode are denoted in blue and trajectory sections traversed in terrestrial mode are denoted in green.
Figure 8.
Planned trajectories for illustrative example: (a) partition 1, (b) partition 2, (c) partition 3, and (d) partition 4. Trajectory sections traversed in aerial mode are denoted in blue and trajectory sections traversed in terrestrial mode are denoted in green.

Figure 9.
Illustrative example snapshots at (a) 2400 s, (b) 2800 s, (c) 2983 s, and (d) 3053 s. Target trajectory is denoted in red; trajectory sections traversed in aerial mode are denoted in blue; trajectory sections traversed in terrestrial mode are denoted in green.
Figure 9.
Illustrative example snapshots at (a) 2400 s, (b) 2800 s, (c) 2983 s, and (d) 3053 s. Target trajectory is denoted in red; trajectory sections traversed in aerial mode are denoted in blue; trajectory sections traversed in terrestrial mode are denoted in green.

Figure 10.
Variations in the level of persistence with respect to staying on-trail.

Figure 11.
Target-find locations: targets found in aerial mode are denoted in blue; targets found in terrestrial mode are denoted in green.
Figure 11.
Target-find locations: targets found in aerial mode are denoted in blue; targets found in terrestrial mode are denoted in green.

Figure 12.
Robustness test results.


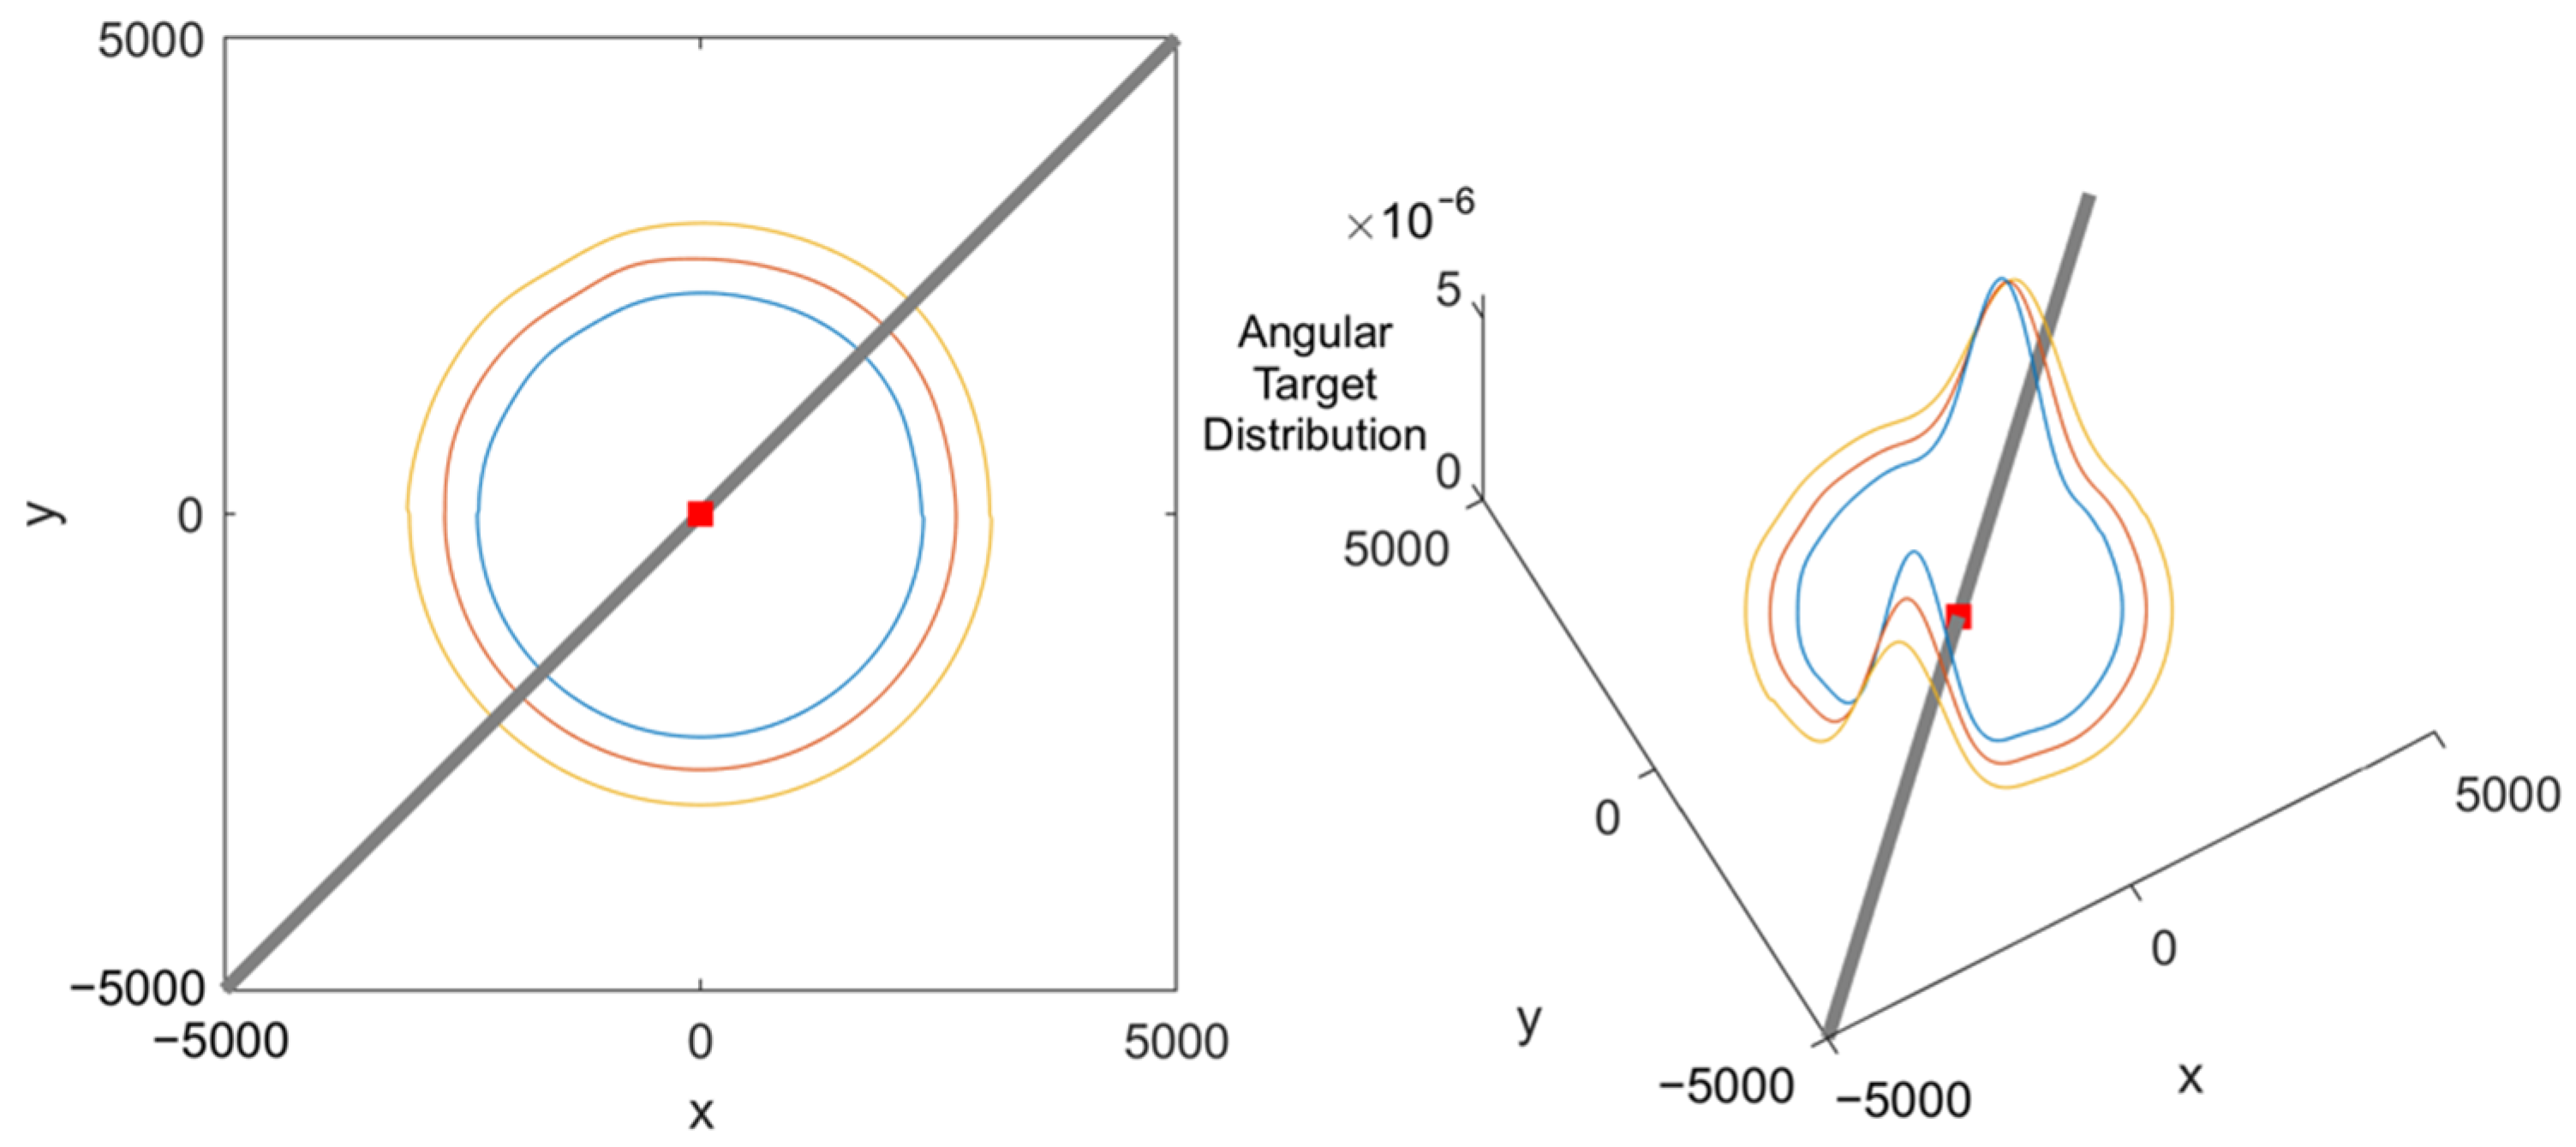
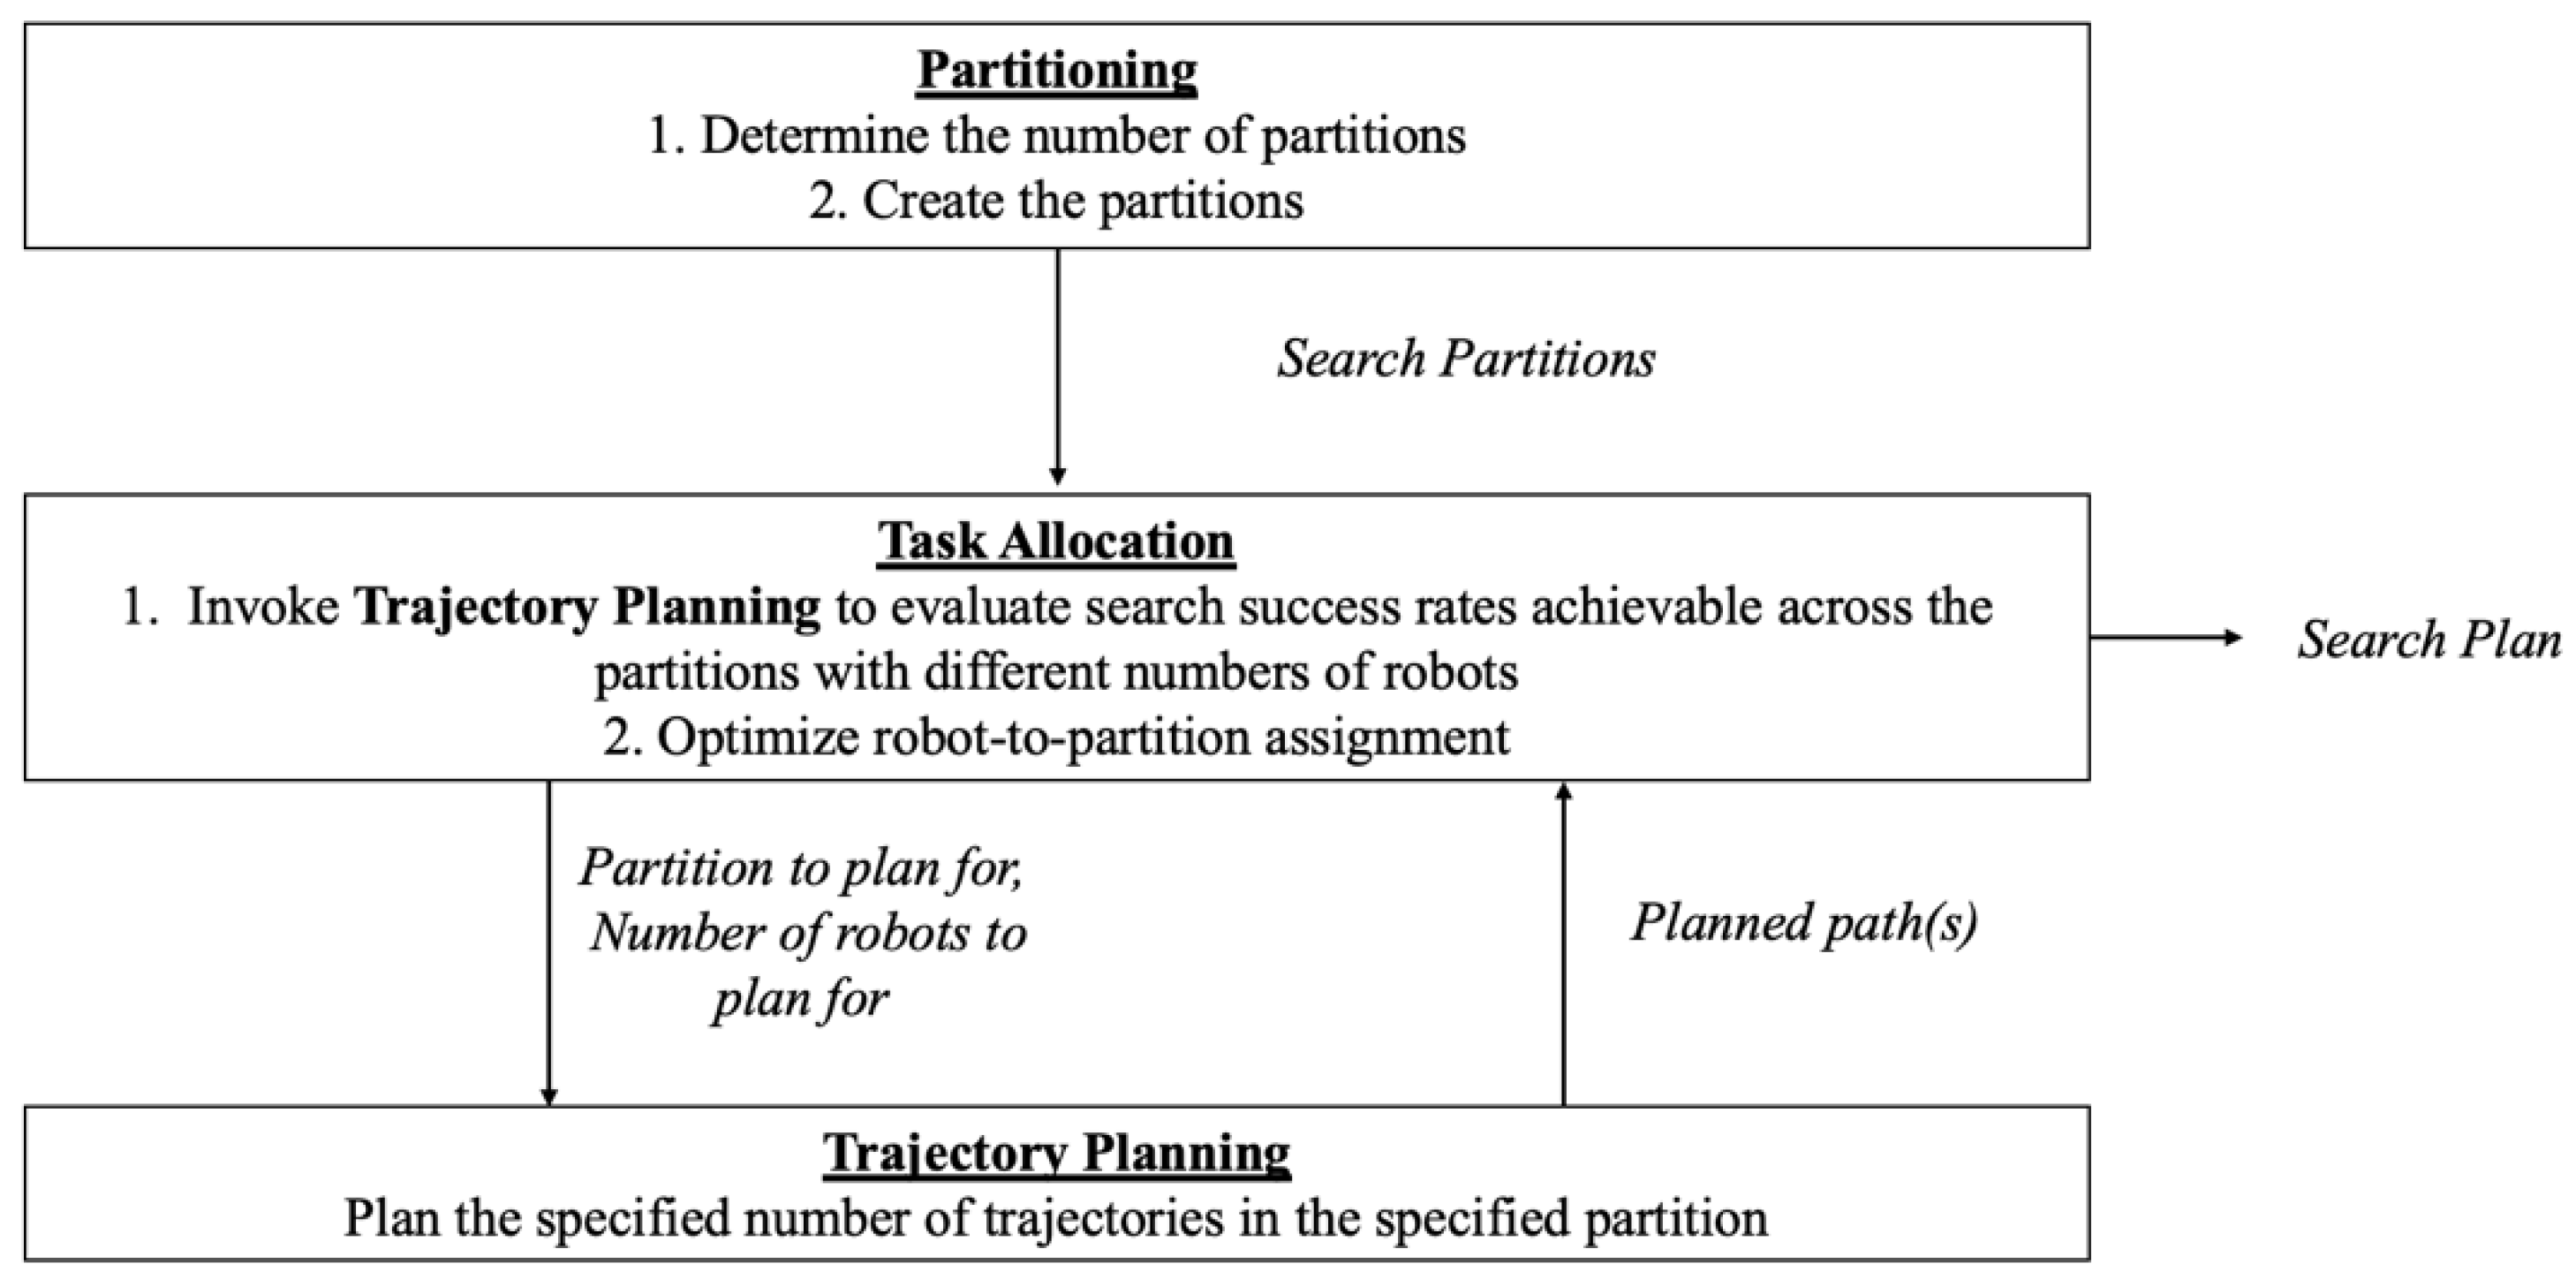
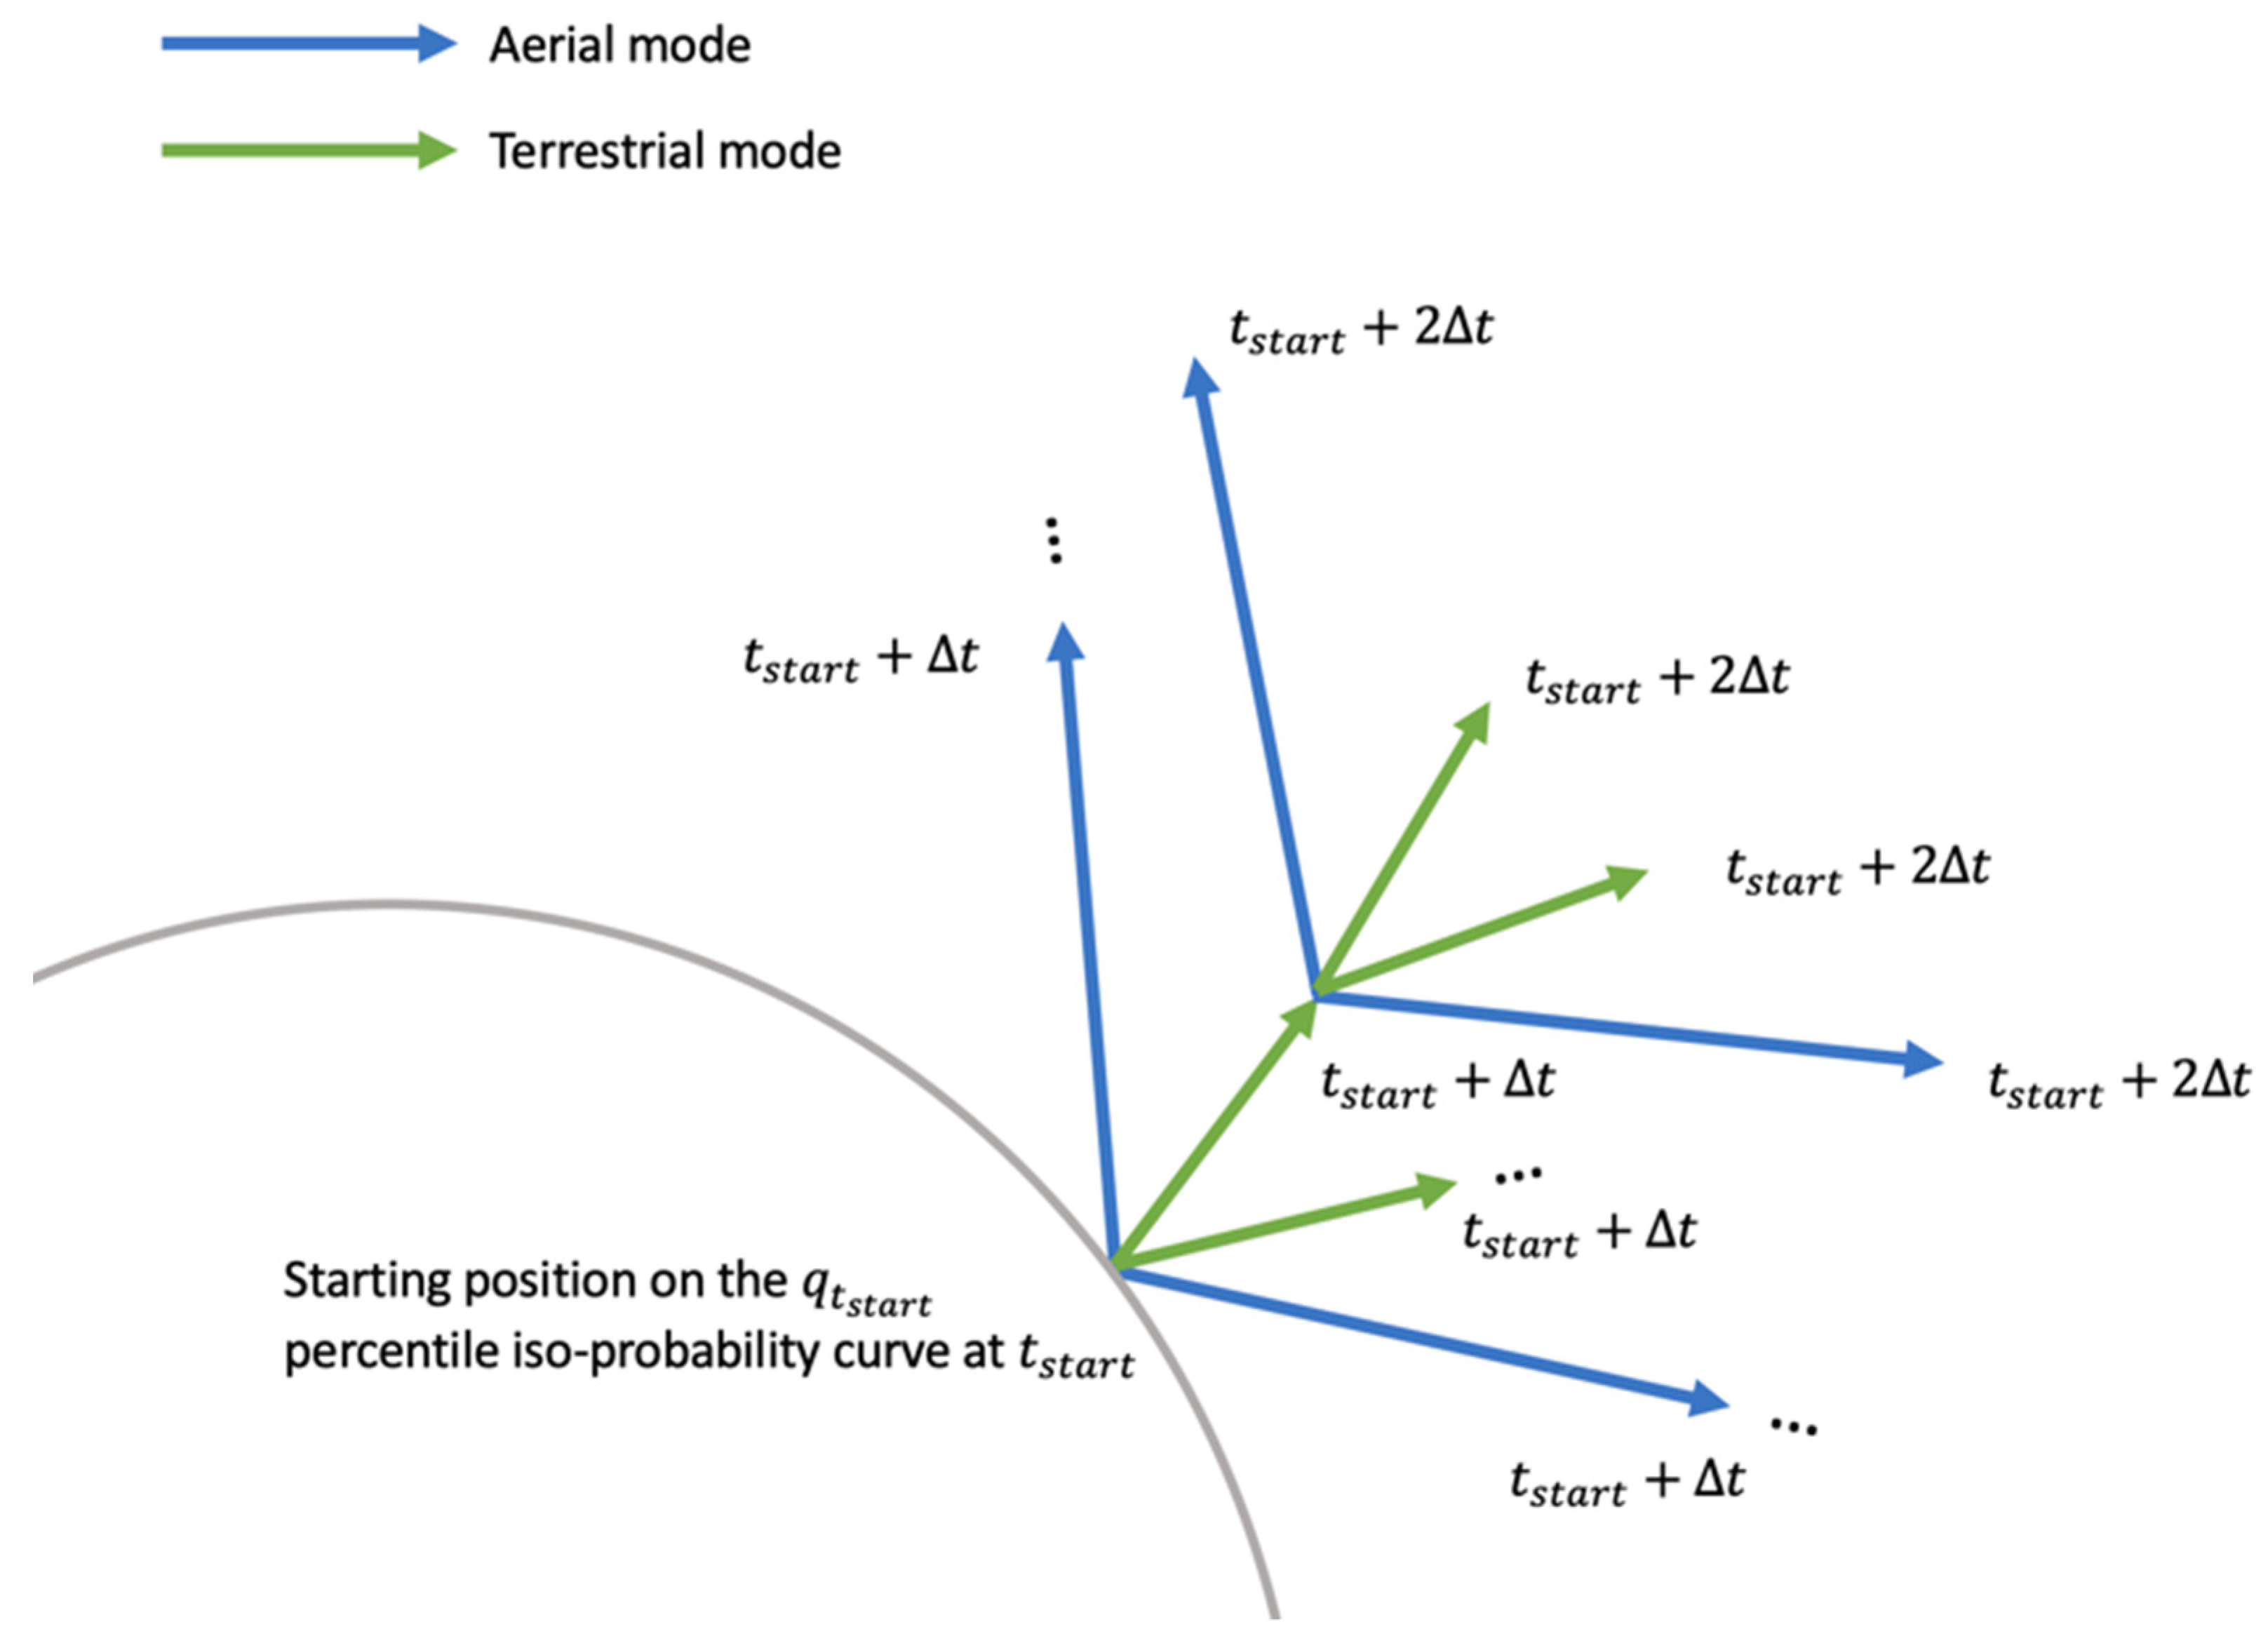
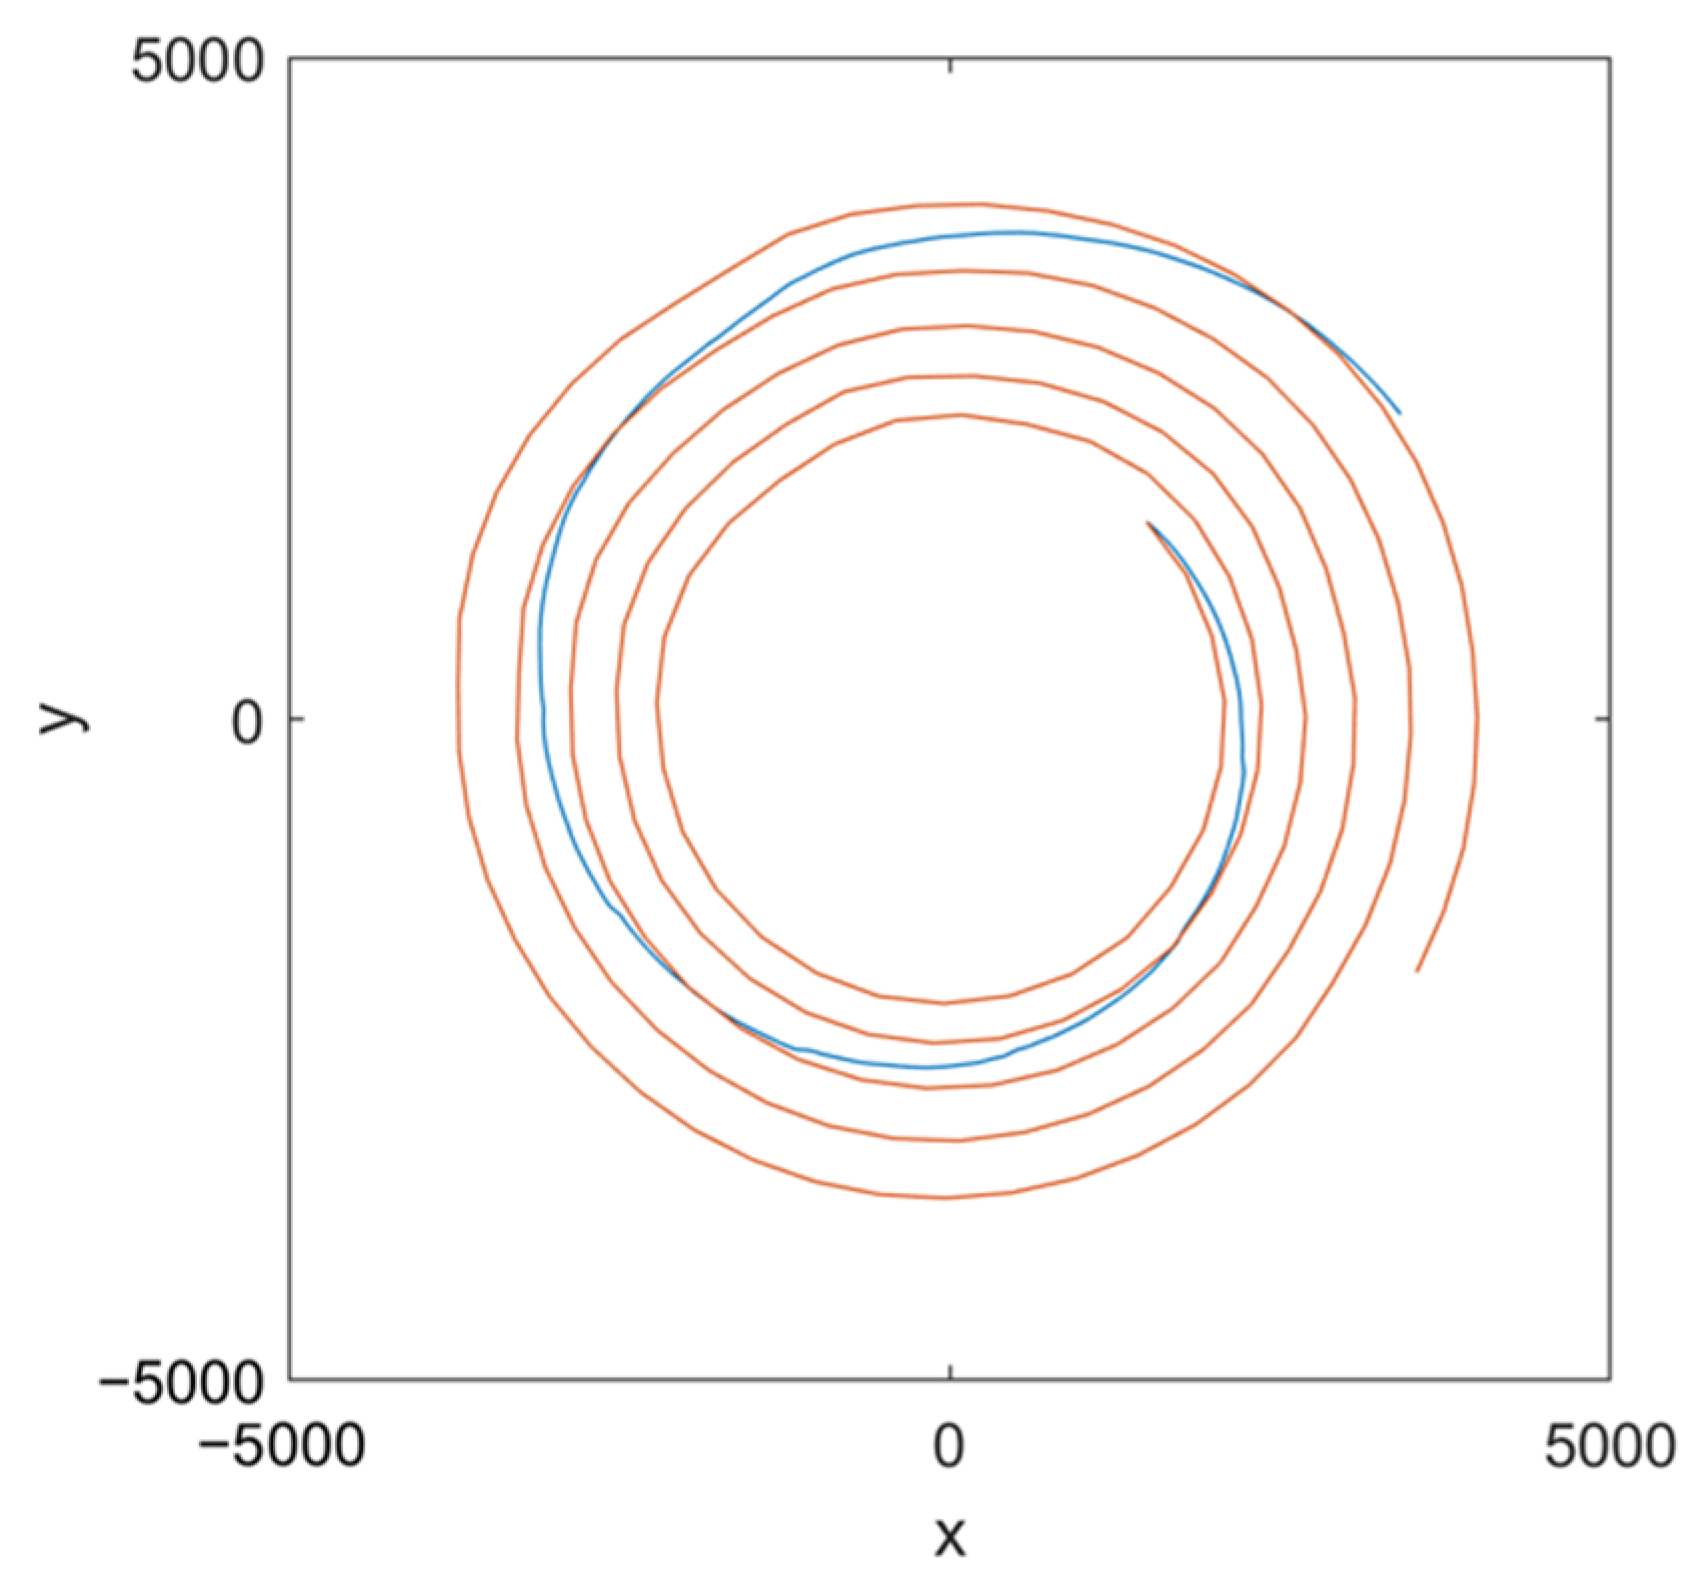
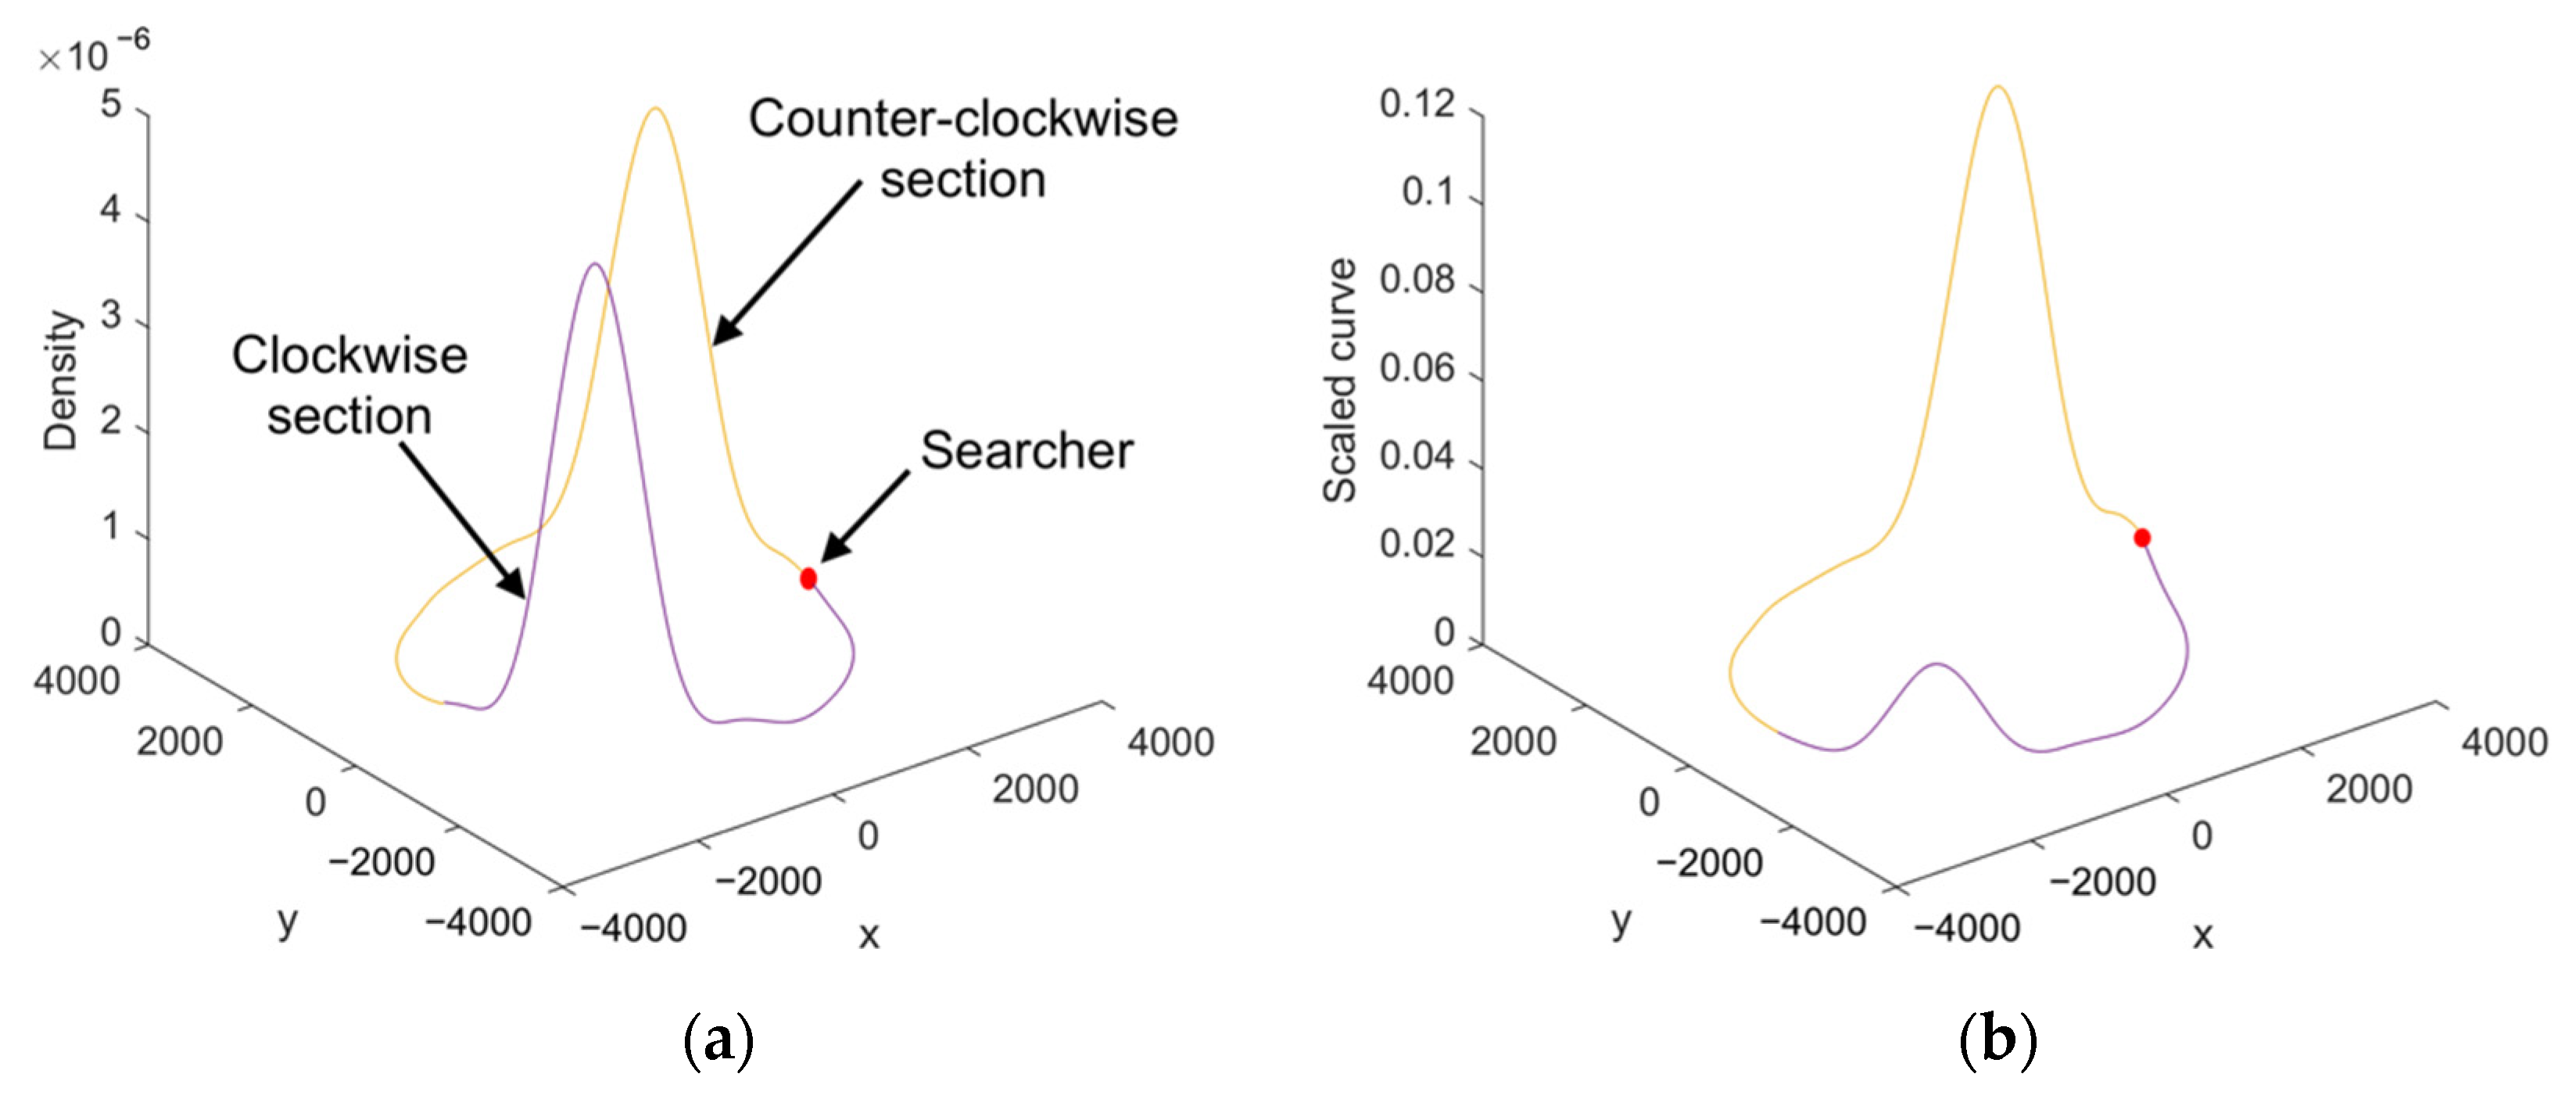
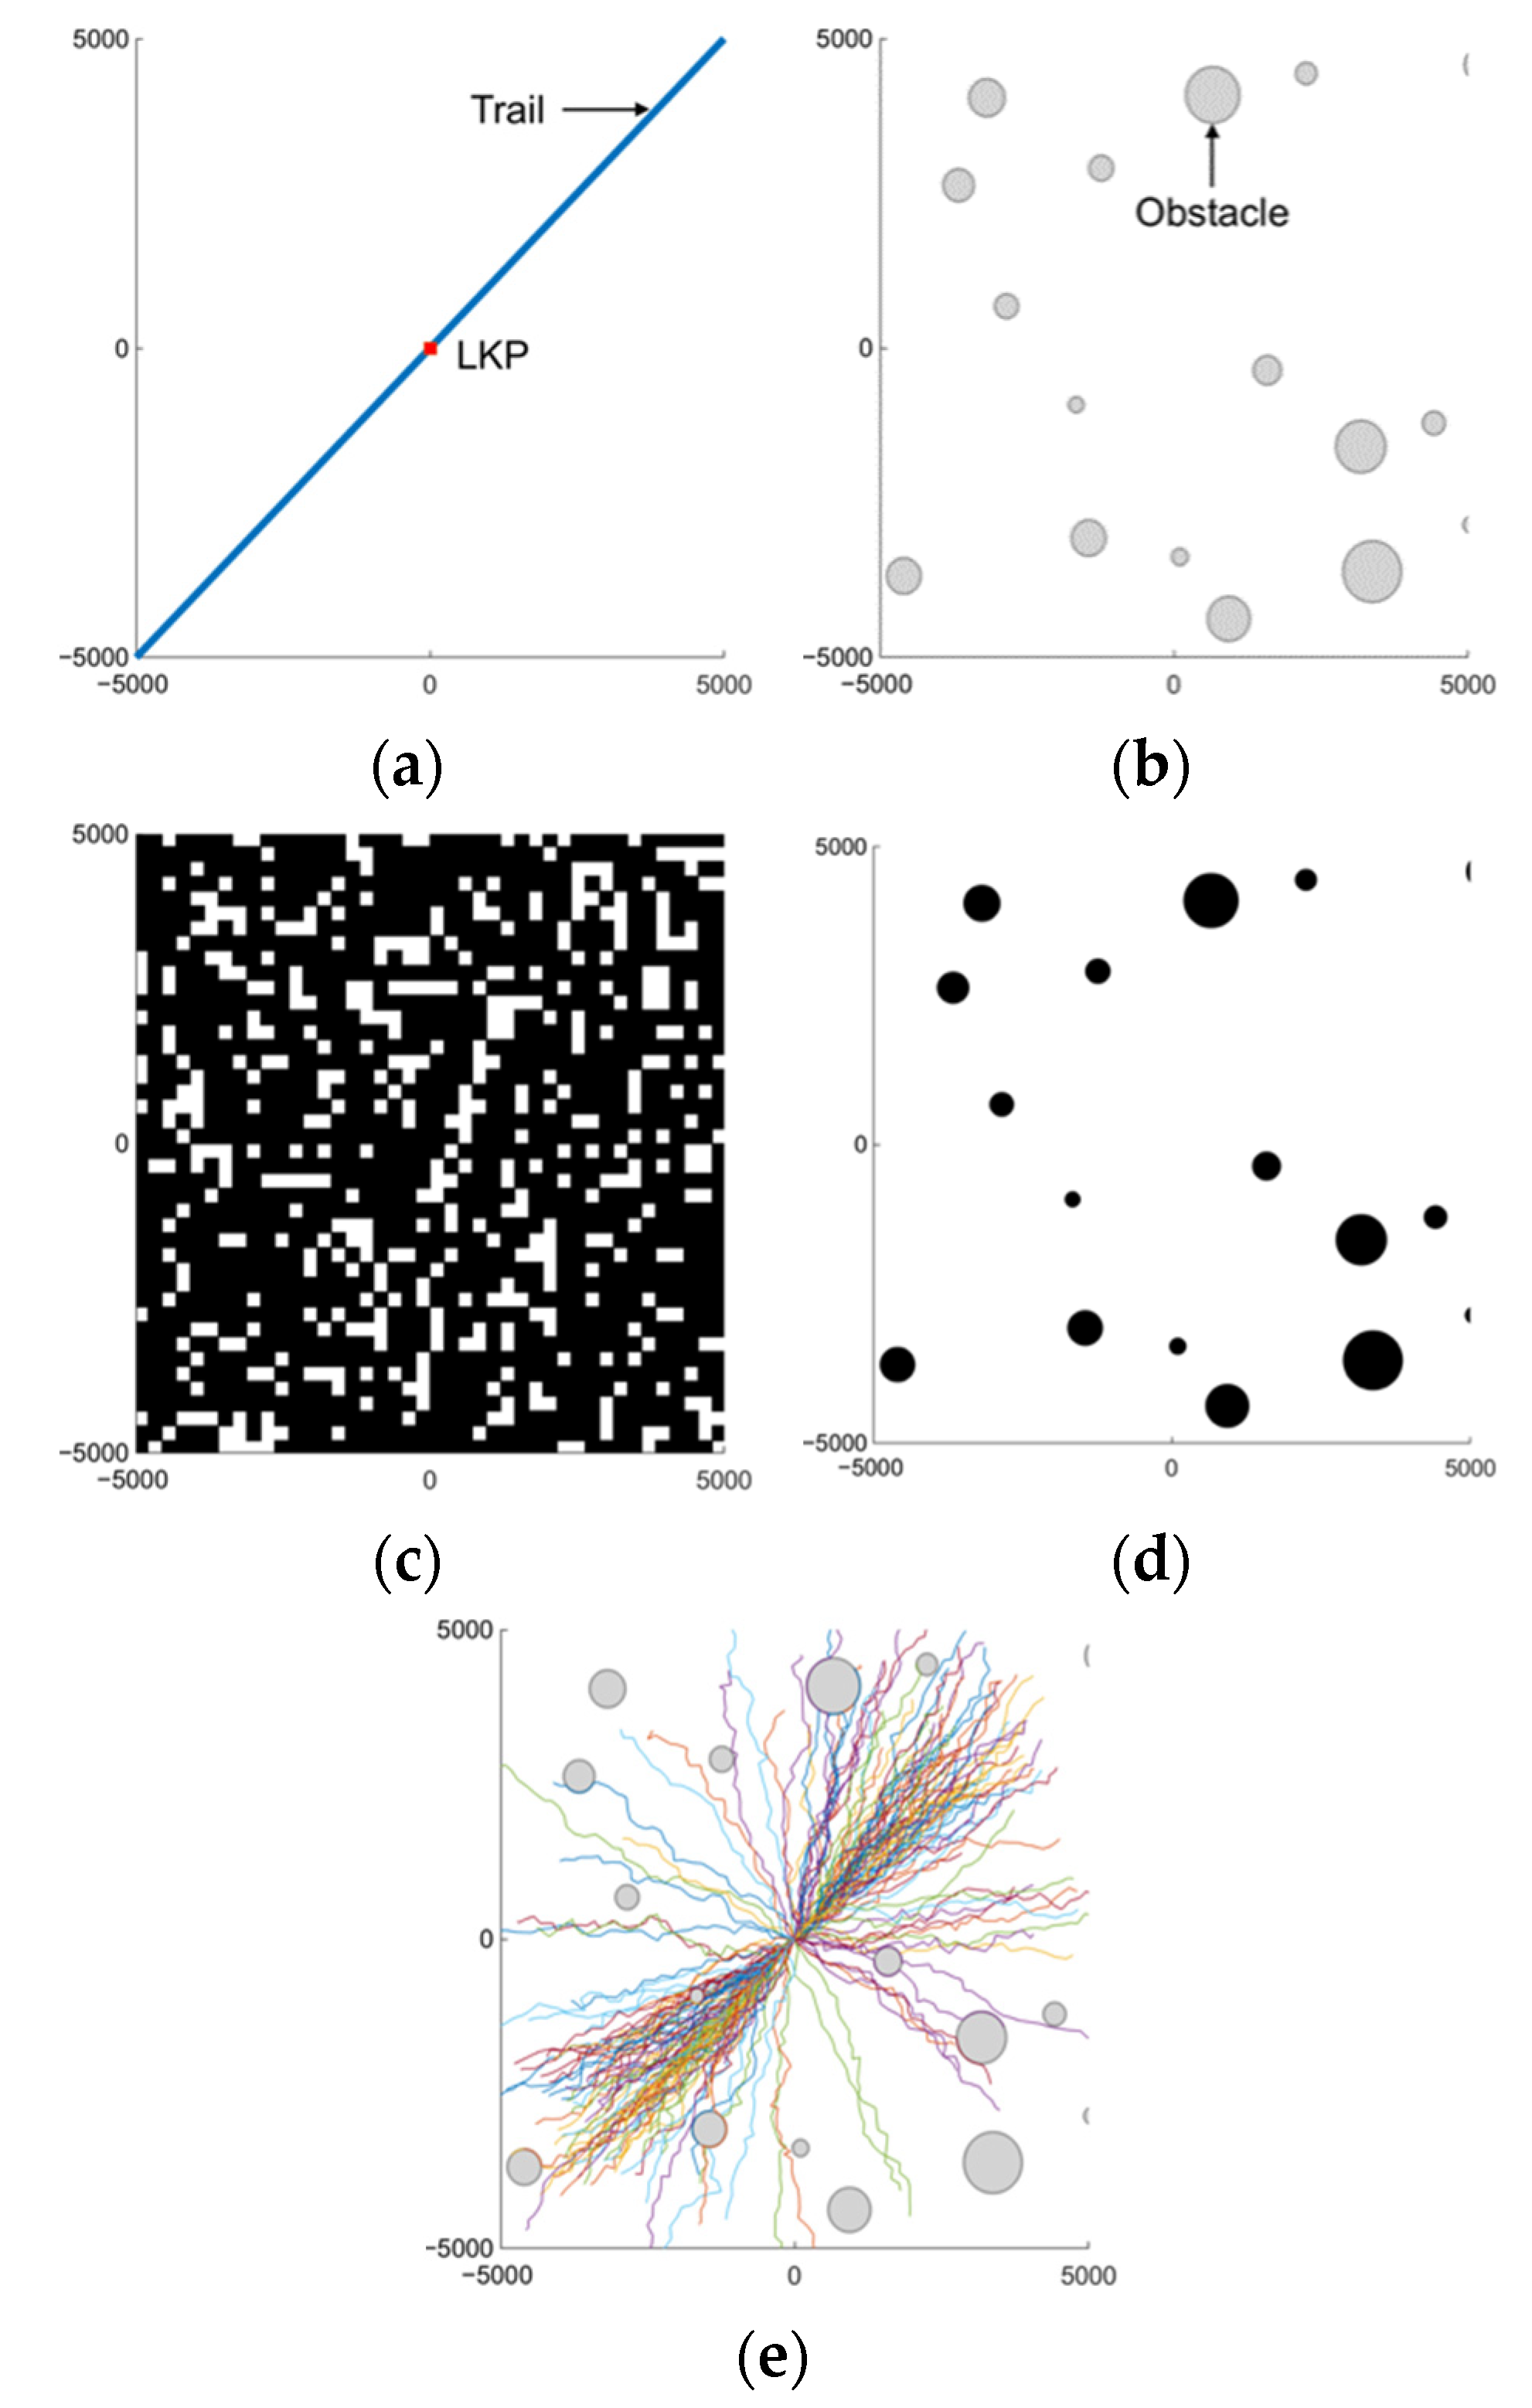
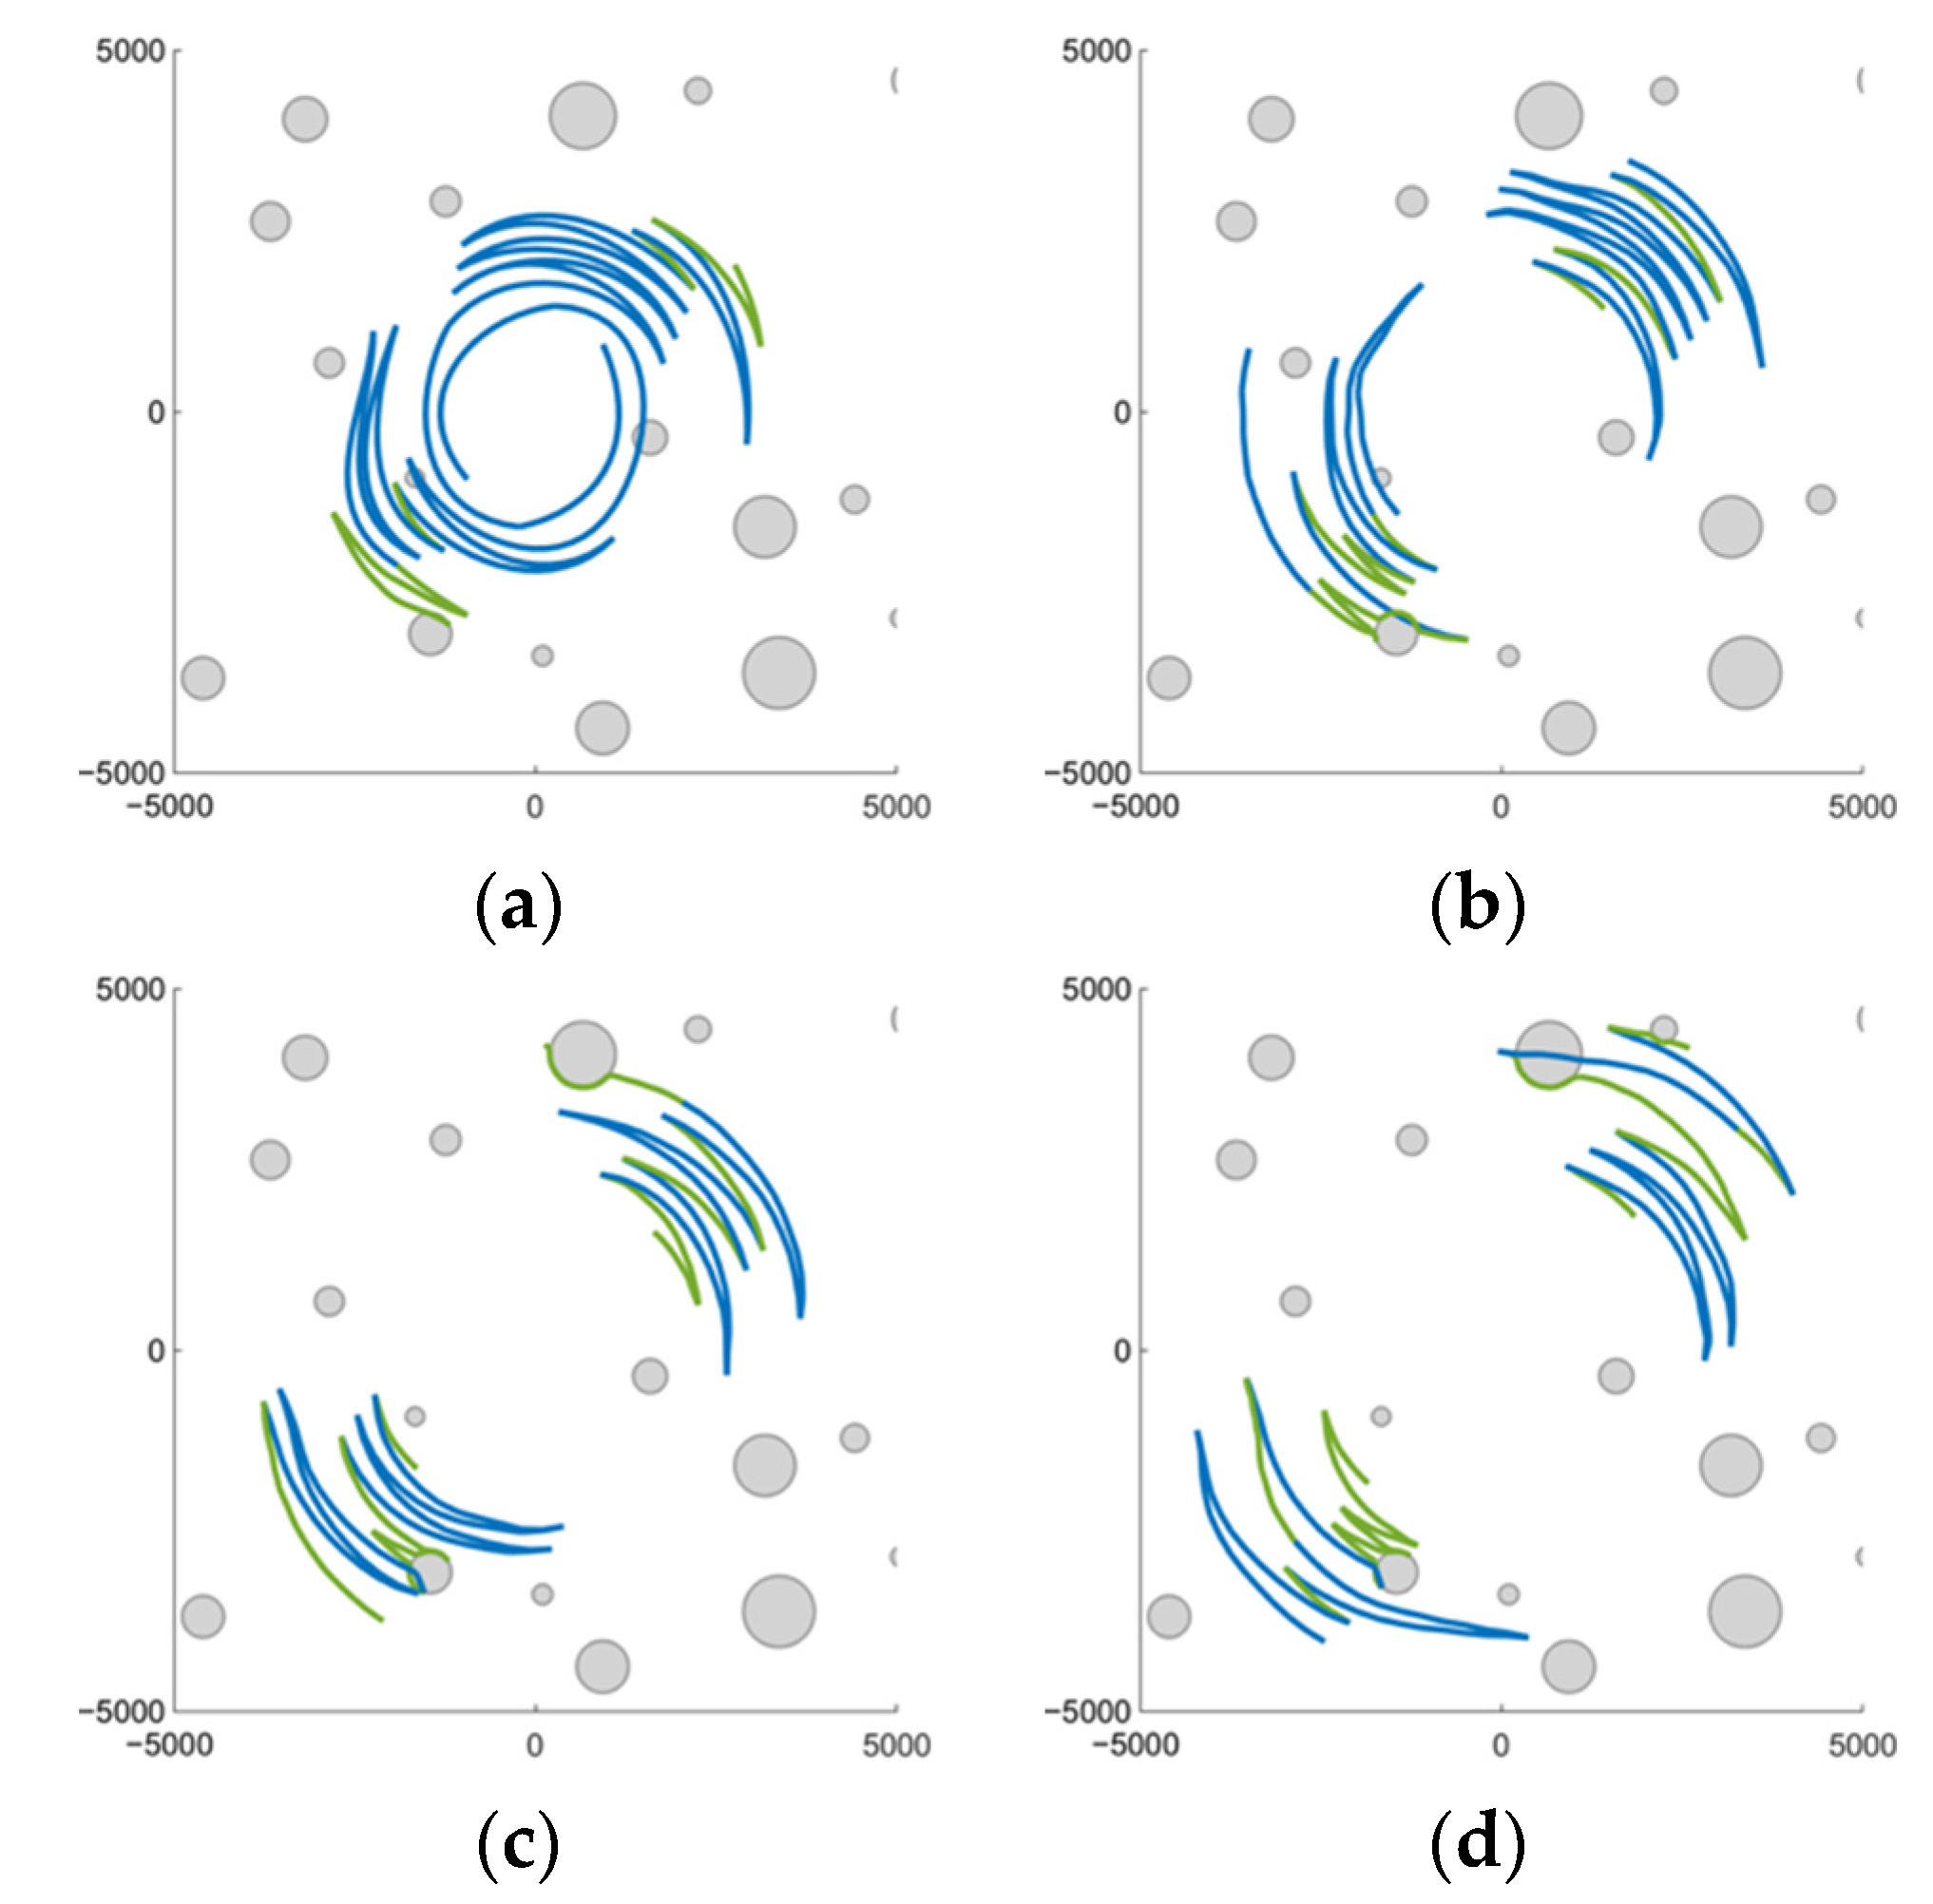
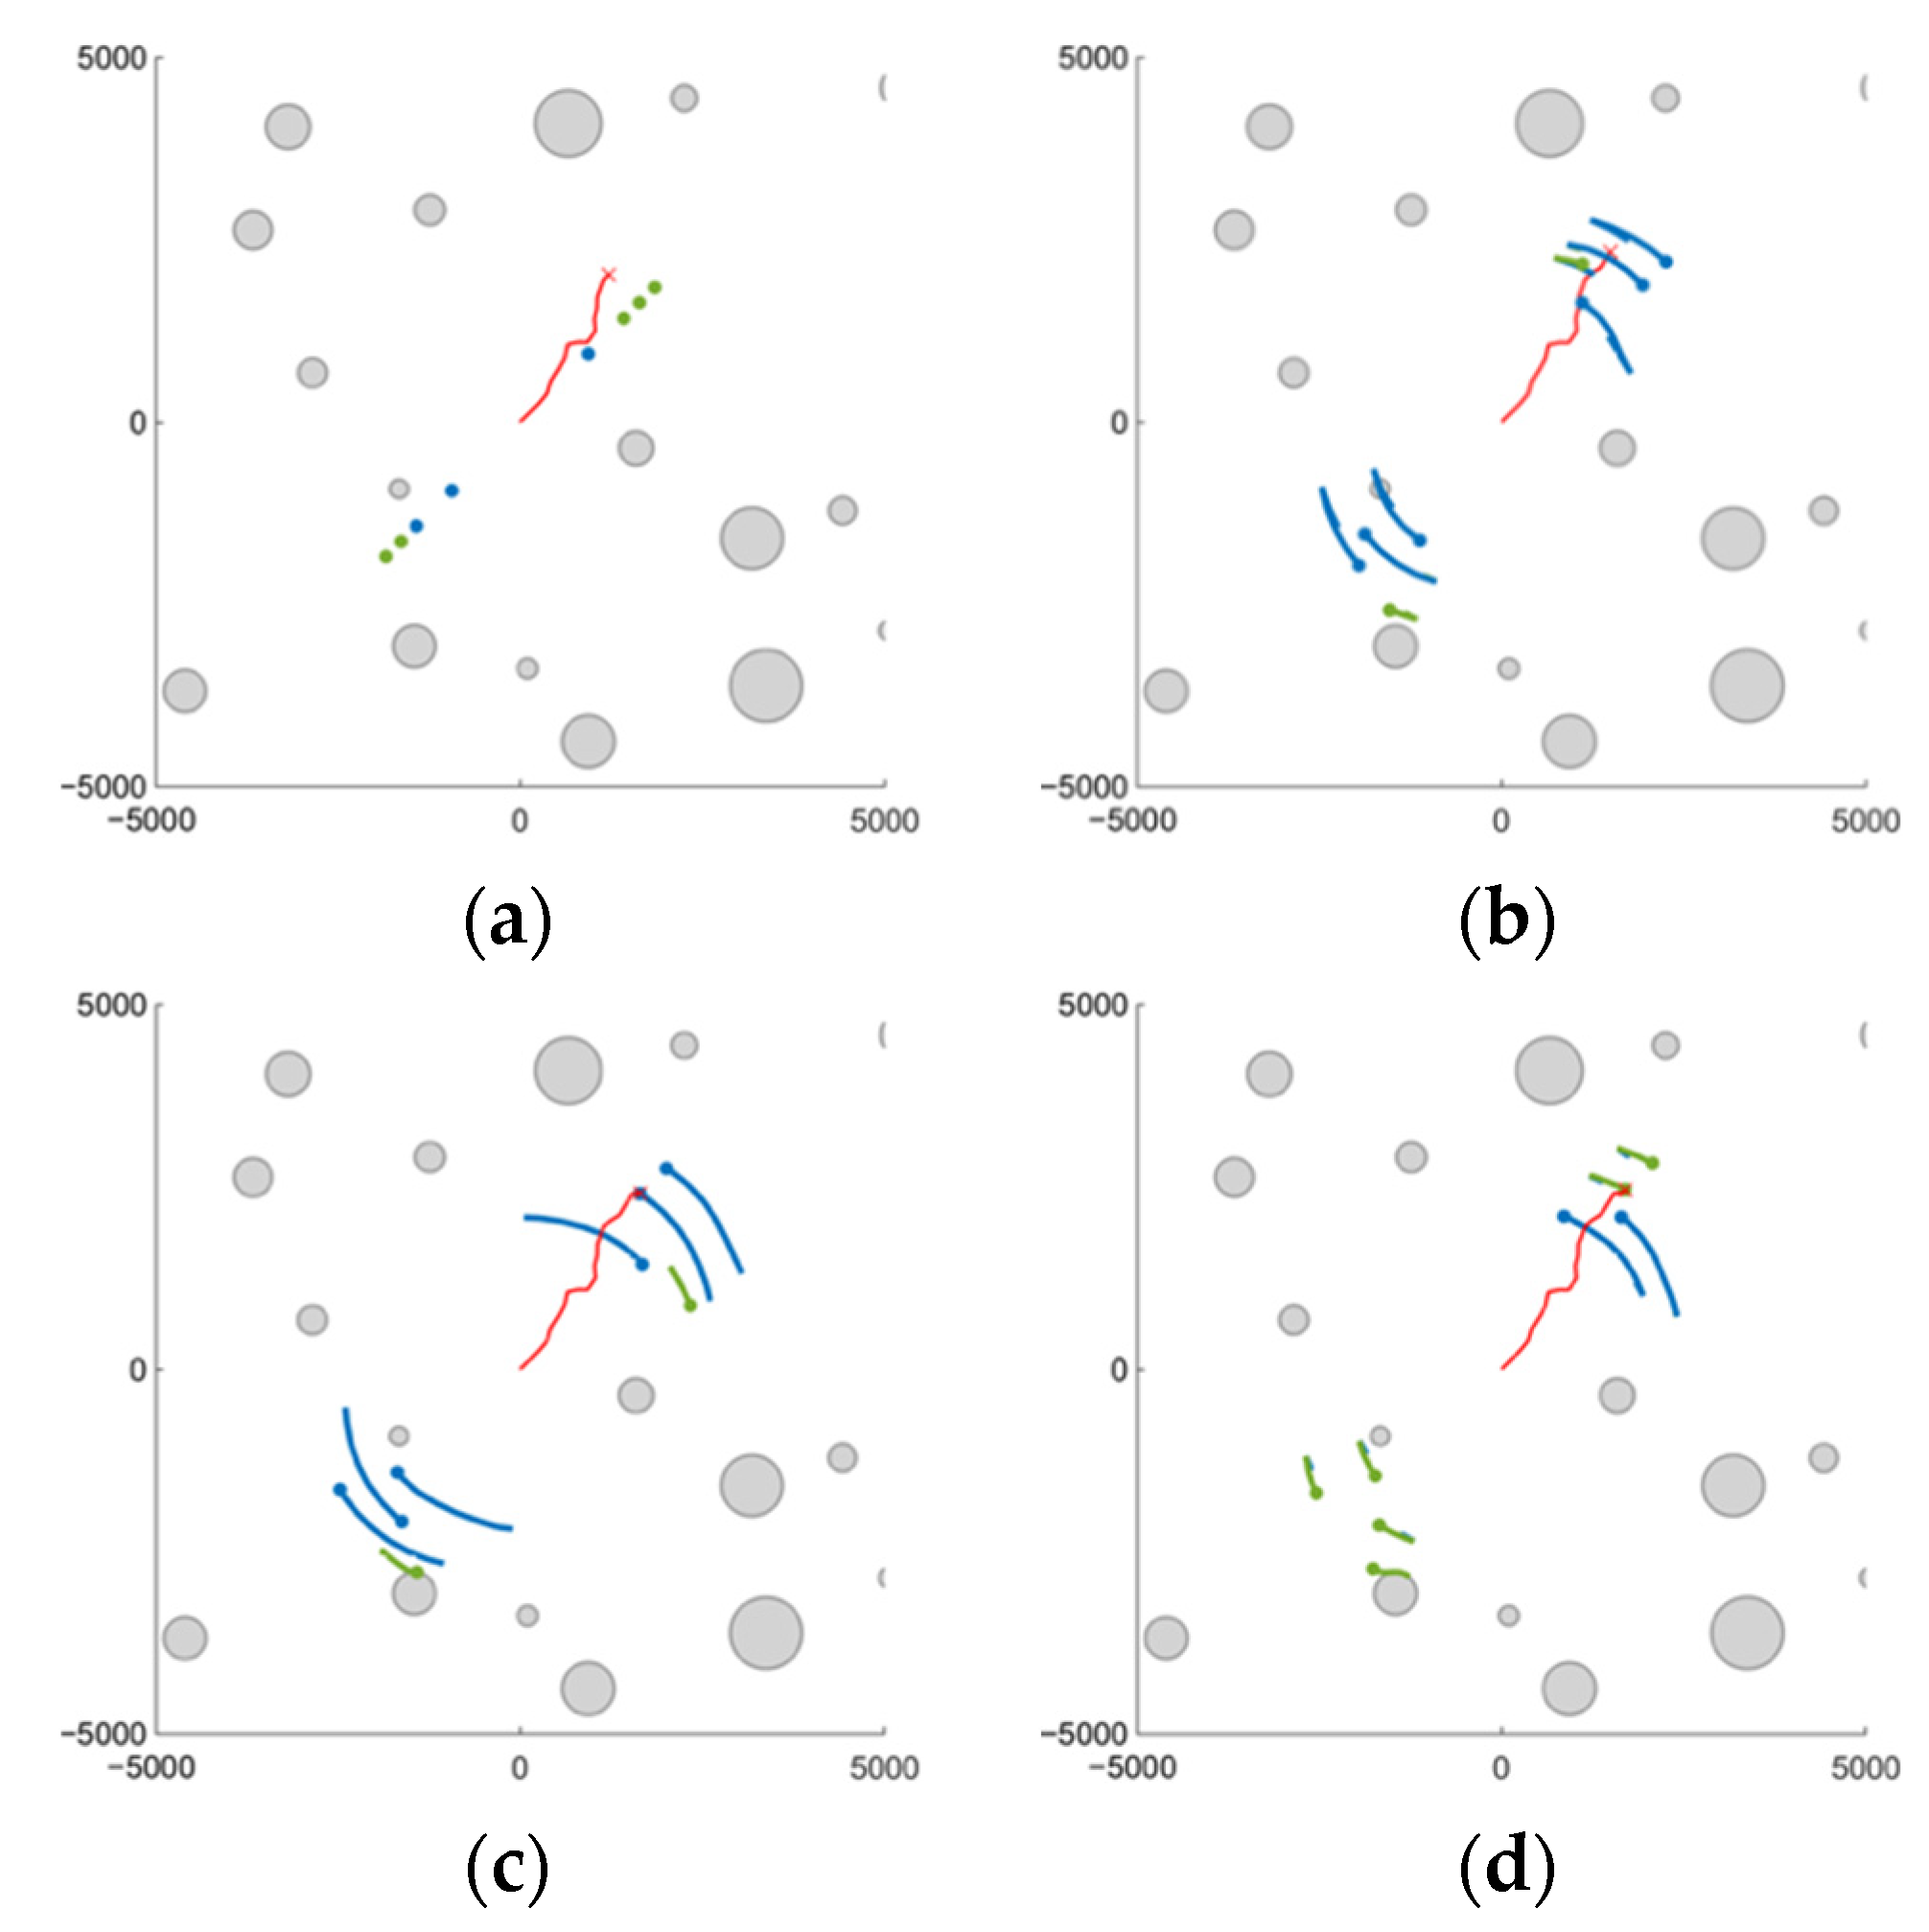
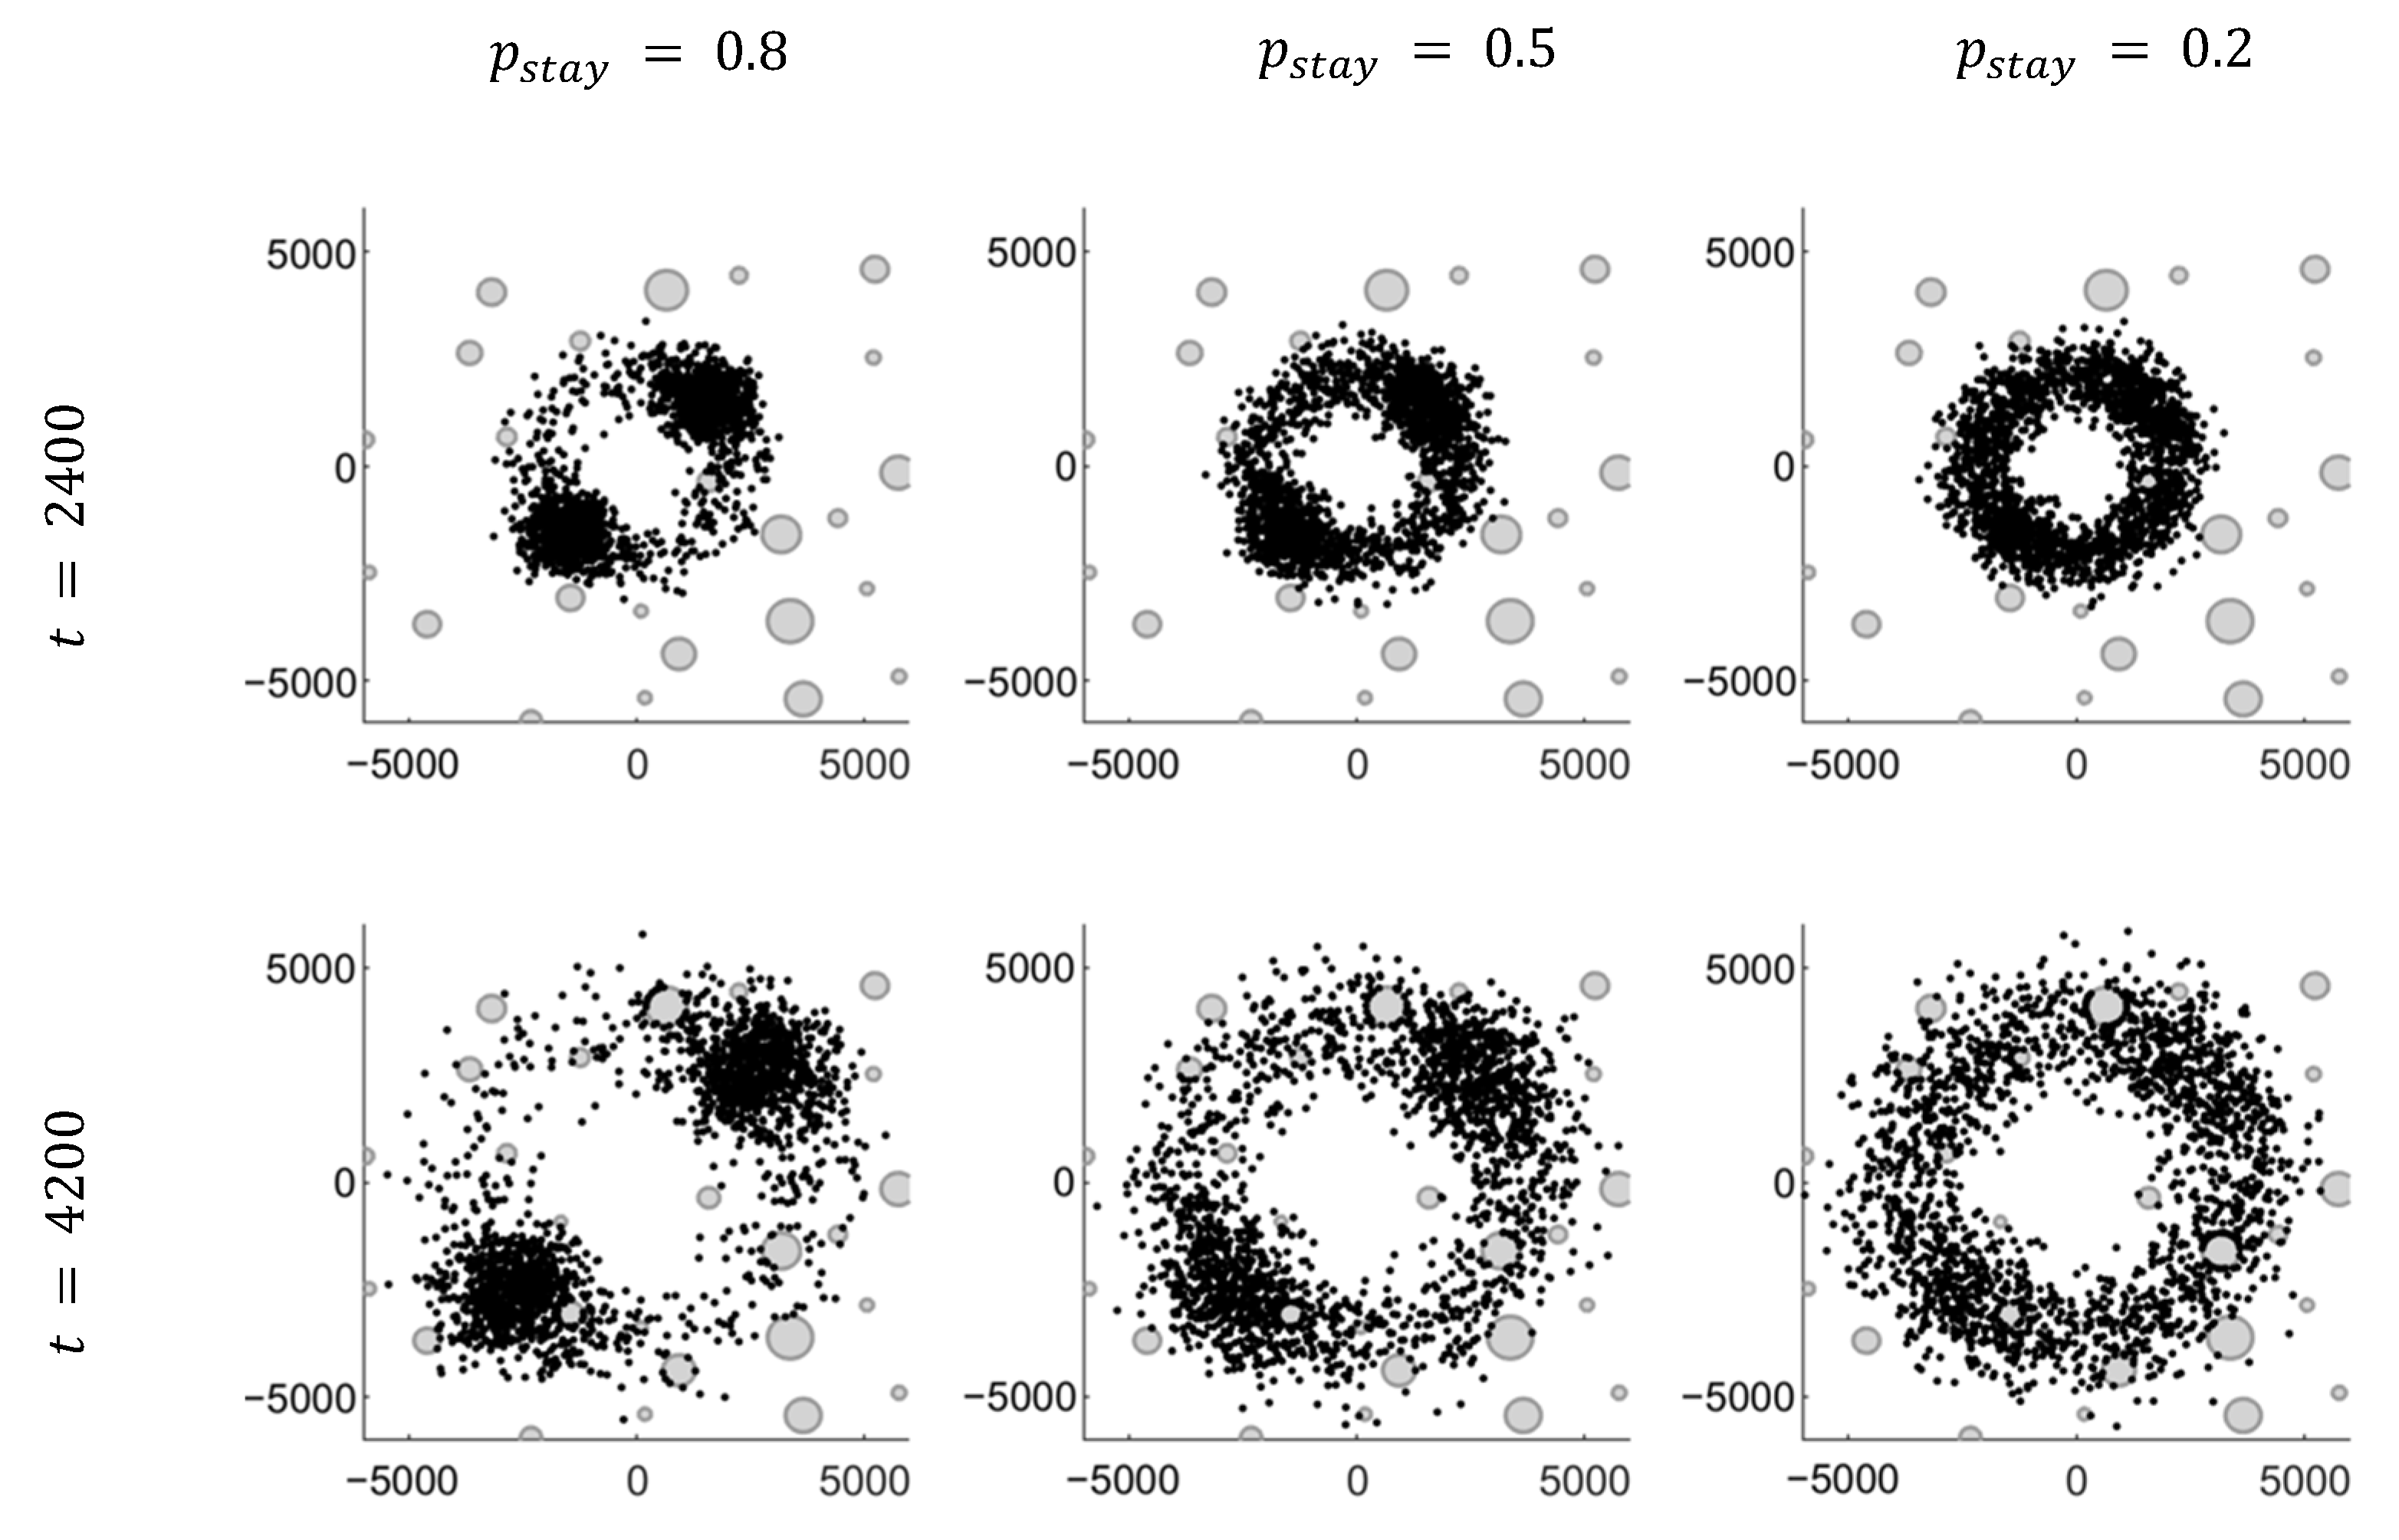
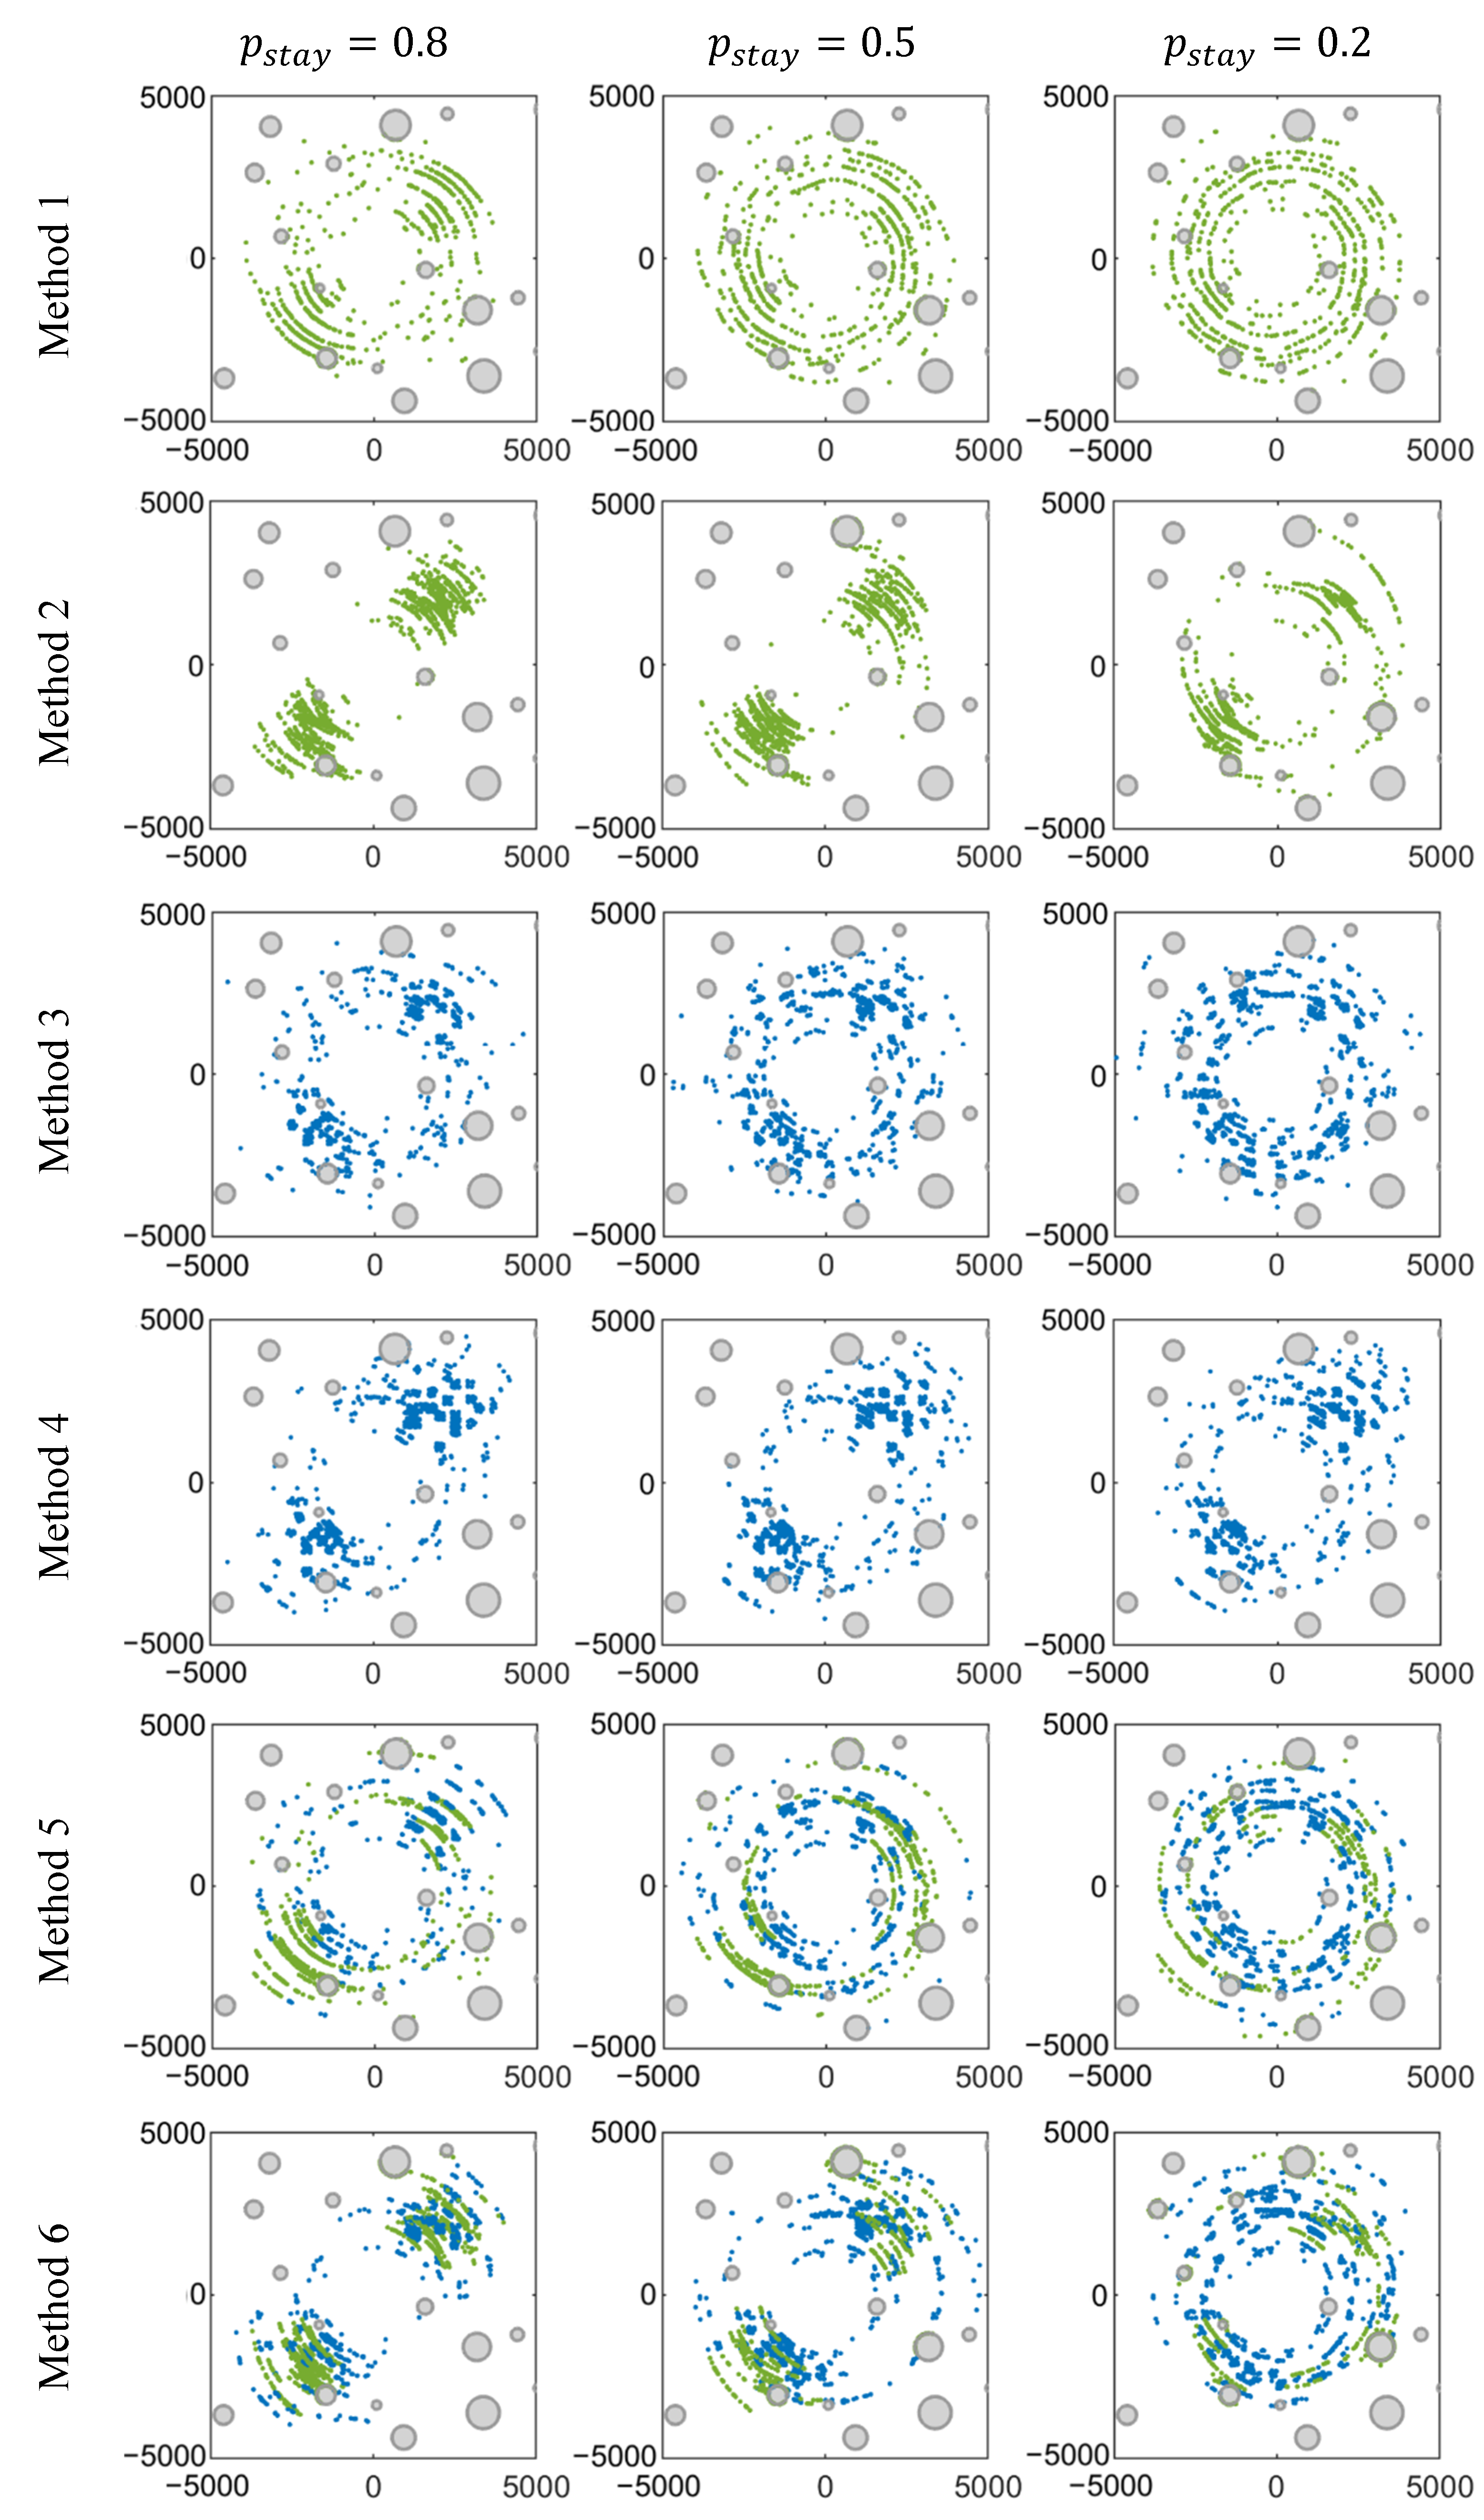
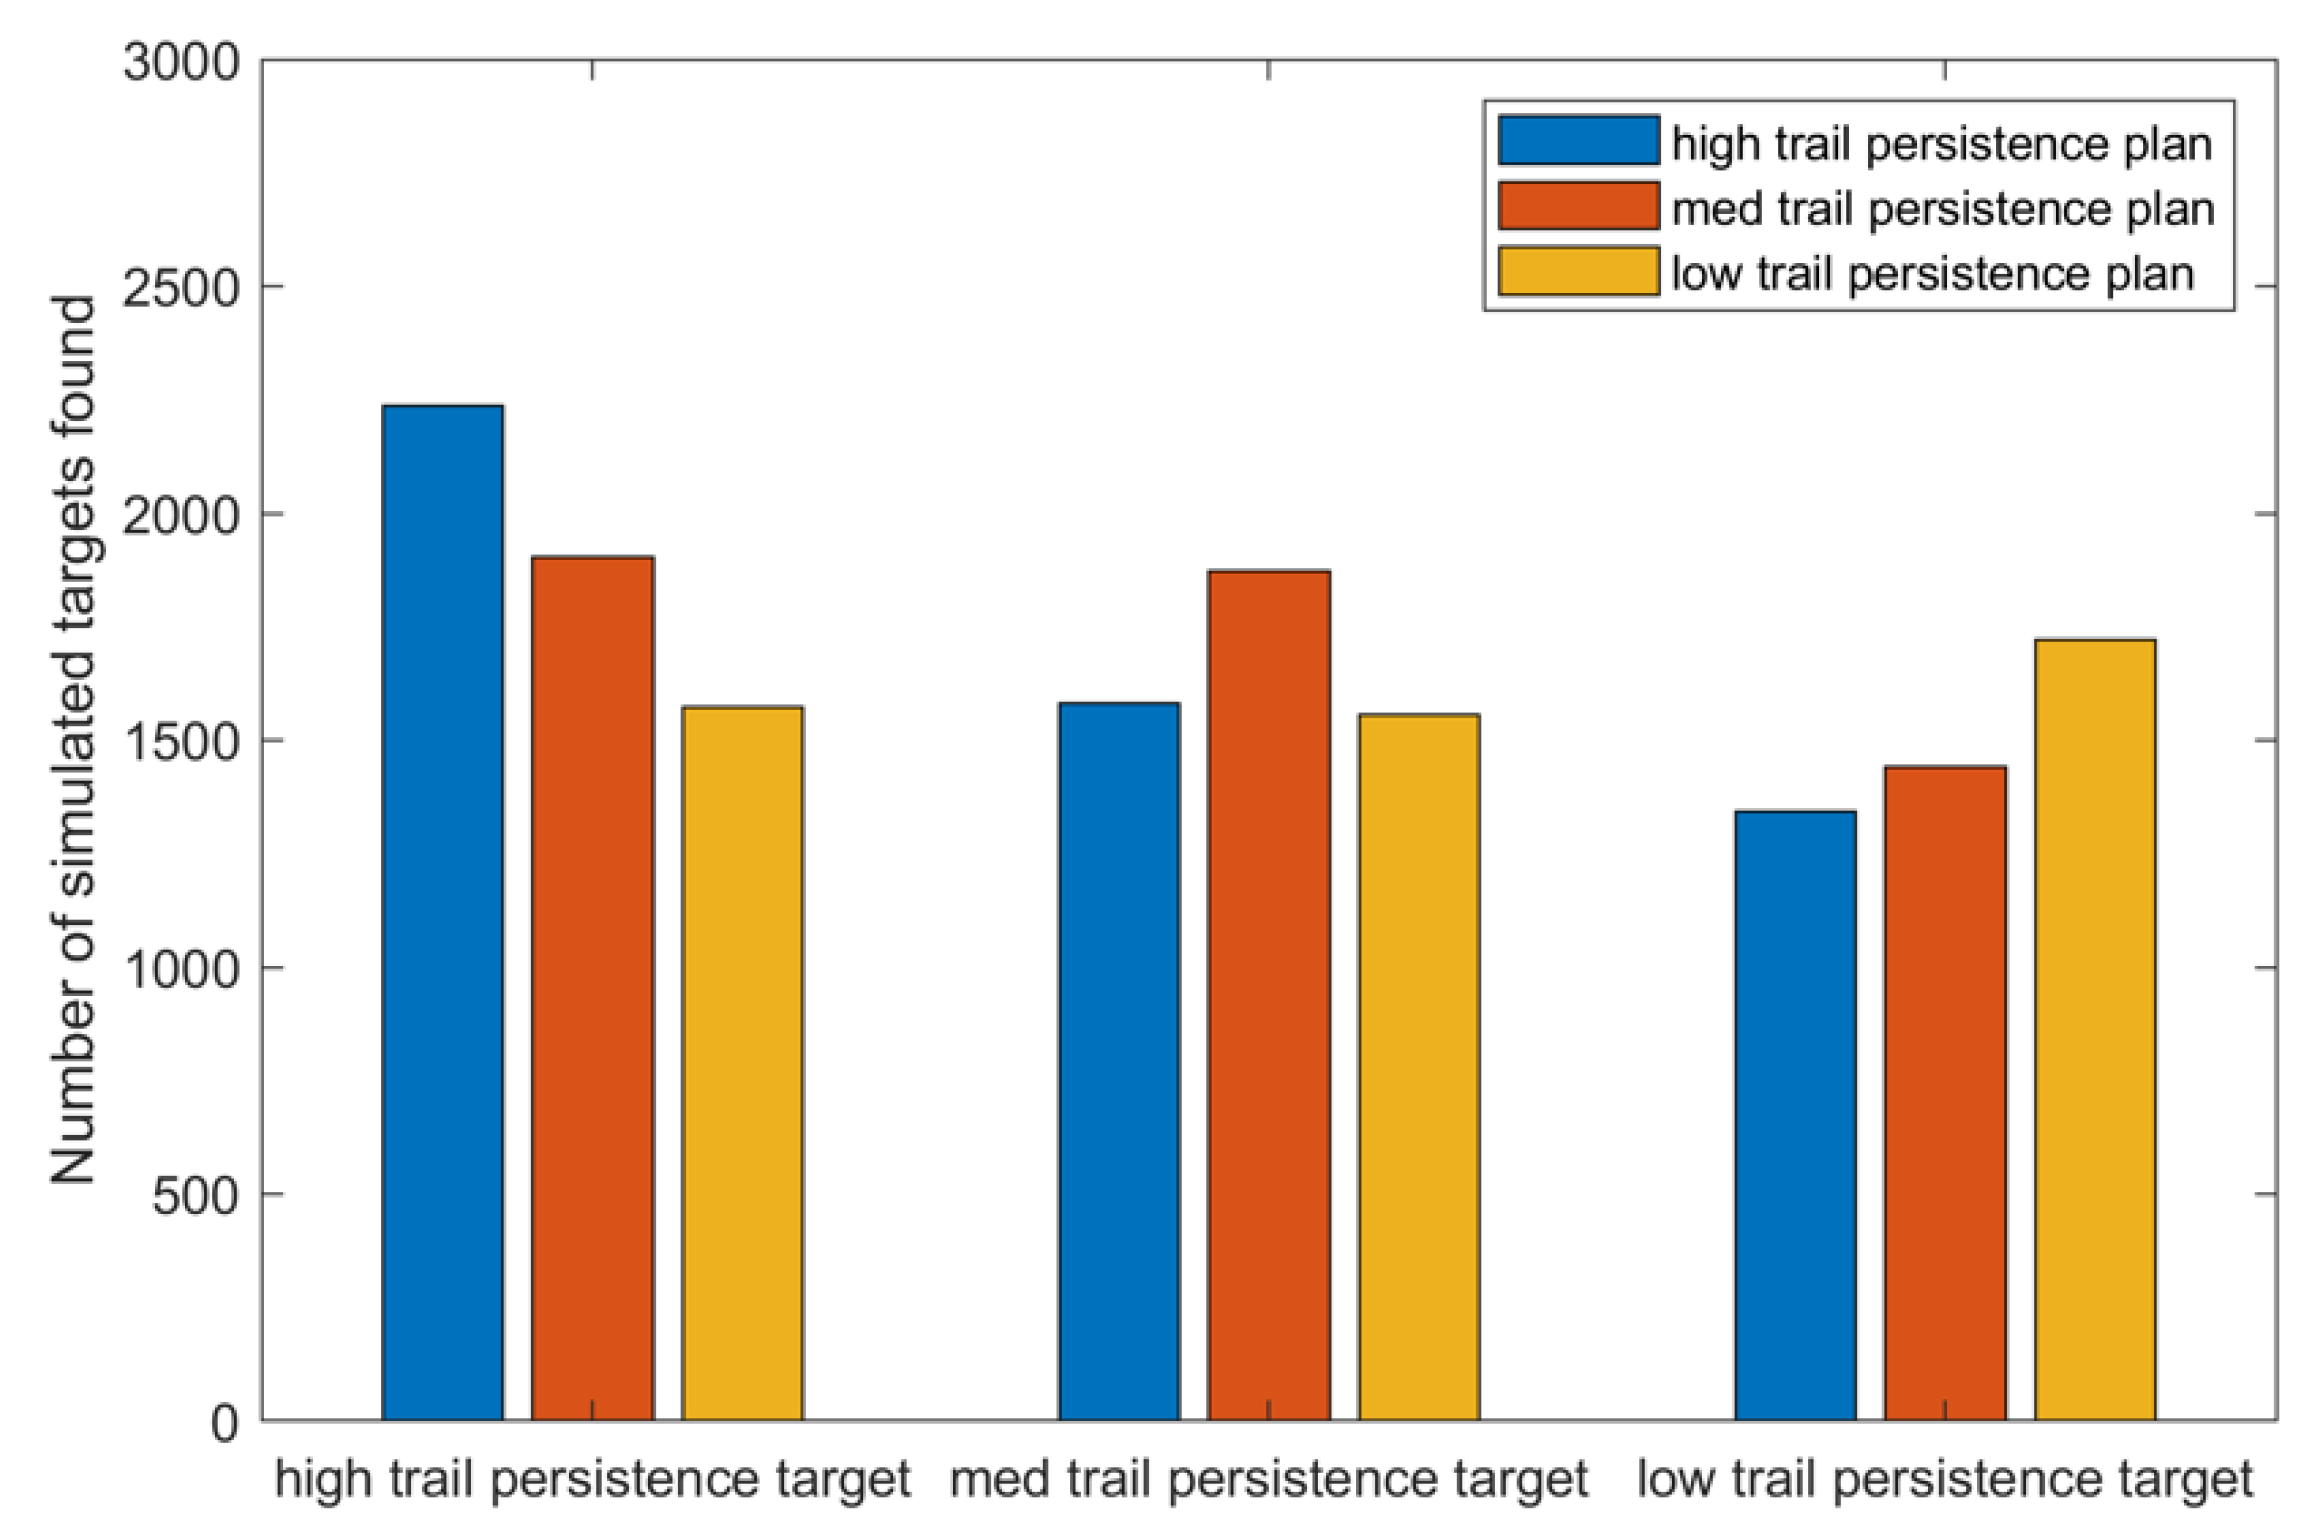
Table 1.
An illustrative example partitioning scheme.
| Partition No. | Lower Bound (%) | Upper Bound (%) | Number of Robots, | Representative Speed, |
|---|---|---|---|---|
| 1 | 0 | 31.9 | 2 | 24.9 |
| 2 | 31.9 | 57.7 | 2 | 21.6 |
| 3 | 57.7 | 80.4 | 2 | 20.9 |
| 4 | 80.4 | 100 | 2 | 19.1 |
Table 2.
Summary of planning methods tested.
| Method No. | Mode Selection | Direction Selection |
|---|---|---|
| 1 | Disabled (terrestrial mode only) | Disabled (cw 1 traversal only) |
| 2 | Disabled (terrestrial mode only) | Enabled |
| 3 | Disabled (aerial mode only) | Disabled (cw 1 traversal only) |
| 4 | Disabled (aerial mode only) | Enabled |
| 5 | Enabled | Disabled (cw 1 traversal only) |
| 6 | Enabled | Enabled |
1 cw: clockwise.
Table 3.
Method comparison results: number of simulated targets found (for 10 runs).
| Method No. | |||
|---|---|---|---|
| 1 | 778/0 | 812/0 | 832/0 |
| 2 | 1307.8/38.4 | 995.1/18.6 | 925.9/39.2 |
| 3 | 955/0 | 1073/0 | 1070/0 |
| 4 | 1584.8/33.6 | 1443.0/15.5 | 1376.2/36.9 |
| 5 | 1538.2/18.4 | 1535.2/22.5 | 1505.6/33.2 |
| 6 | 2194.4/63.9 | 1879.3/42.2 | 1699.6/30.1 |
Table 4.
The 3D iso-probability-curve-based heuristic validation.
| Without 3D Curve Heuristic | With 3D Curve Heuristic | |
|---|---|---|
| Mean | 2070.0 | 2209.8 |
| Std | 59.6 | 49.0 |
Publisher’s Note: MDPI stays neutral with regard to jurisdictional claims in published maps and institutional affiliations. |
© 2022 by the authors. Licensee MDPI, Basel, Switzerland. This article is an open access article distributed under the terms and conditions of the Creative Commons Attribution (CC BY) license (https://creativecommons.org/licenses/by/4.0/).
Share and Cite
MDPI and ACS Style
Ku, S.Y.; Nejat, G.; Benhabib, B. Wilderness Search for Lost Persons Using a Multimodal Aerial-Terrestrial Robot Team. Robotics 2022, 11, 64. https://0-doi-org.brum.beds.ac.uk/10.3390/robotics11030064
AMA Style
Ku SY, Nejat G, Benhabib B. Wilderness Search for Lost Persons Using a Multimodal Aerial-Terrestrial Robot Team. Robotics. 2022; 11(3):64. https://0-doi-org.brum.beds.ac.uk/10.3390/robotics11030064
Chicago/Turabian StyleKu, Shan Yu, Goldie Nejat, and Beno Benhabib. 2022. "Wilderness Search for Lost Persons Using a Multimodal Aerial-Terrestrial Robot Team" Robotics 11, no. 3: 64. https://0-doi-org.brum.beds.ac.uk/10.3390/robotics11030064
Note that from the first issue of 2016, this journal uses article numbers instead of page numbers. See further details here.