Article

Genome-Wide Identification, Genomic Organization, and Characterization of Potassium Transport-Related Genes in Cajanus cajan and Their Role in Abiotic Stress

1
Department of Bioinformatics and Biotechnology, Government College University Faisalabad, Faisalabad 38000, Pakistan
2
Department of Microbiology, Government College University Faisalabad, Faisalabad 38000, Pakistan
3
Sub-Campus Burewala-Vehari, University of Agriculture Faisalabad, Faisalabad 38000, Pakistan
4
Wheat Research Institute, Ayub Agricultural Research Institute, Faisalabad 38000, Pakistan
5
Botany and Microbiology Department, College of Science, King Saud University, P.O. Box. 2460, Riyadh 11451, Saudi Arabia
6
Plant Production Department, College of Food and Agricultural Sciences, King Saud University, P.O. Box. 2460, Riyadh 11451, Saudi Arabia
*
Authors to whom correspondence should be addressed.
Equal Contribution as the first author.
Submission received: 27 August 2021 / Revised: 1 October 2021 / Accepted: 5 October 2021 / Published: 20 October 2021
(This article belongs to the Special Issue Recent Trends in Genomics and Transcriptomics of Field Crops)

Abstract

:
Potassium is the most important and abundant inorganic cation in plants and it can comprise up to 10% of a plant’s dry weight. Plants possess complex systems of transporters and channels for the transport of K+ from soil to numerous parts of plants. Cajanus cajan is cultivated in different regions of the world as an economical source of carbohydrates, fiber, proteins, and fodder for animals. In the current study, 39 K+ transport genes were identified in C. cajan, including 25 K+ transporters (17 carrier-like K+ transporters (KUP/HAK/KTs), 2 high-affinity potassium transporters (HKTs), and 6 K+ efflux transporters (KEAs) and 14 K+ channels (9 shakers and 5 tandem-pore K+ channels (TPKs). Chromosomal mapping indicated that these genes were randomly distributed among 10 chromosomes. A comparative phylogenetic analysis including protein sequences from Glycine max, Arabidopsis thaliana, Oryza sativa, Medicago truncatula Cicer arietinum, and C. cajan suggested vital conservation of K+ transport genes. Gene structure analysis showed that the intron/exon organization of K+ transporter and channel genes is highly conserved in a family-specific manner. In the promoter region, many cis-regulatory elements were identified related to abiotic stress, suggesting their role in abiotic stress response. Abiotic stresses (salt, heat, and drought) adversely affect chlorophyll, carotenoids contents, and total soluble proteins. Furthermore, the activities of catalase, superoxide, and peroxidase were altered in C. cajan leaves under applied stresses. Expression analysis (RNA-seq data and quantitative real-time PCR) revealed that several K+ transport genes were expressed in abiotic stress-responsive manners. The present study provides an in-depth understanding of K+ transport system genes in C. cajan and serves as a basis for further characterization of these genes.

1. Introduction

Potassium (K+) is an essential inorganic macro-element that may comprise at least 10% of a plant’s total dry weight [1]. It is also abundantly present in the cytosol of cells (i.e., 60–150 mM) [2,3]. It plays a significant role in physiological processes, i.e., anionic group electrical neutralization, osmoregulation, and membrane polarization. The water potential and turgor pressure of a plant are also controlled by the uptake/release of K+. Controlling K+ transport in phloem vasculature helps to build up an osmotic gradient that results in driving the flow of sugar sap to sink tissues during the photosynthesis of mature leaves. In xylem vasculature, a plant drives the flow of crude sap from roots to shoots by secreting K+ into vessels, when there is no transpiration [4]. The role of K+ is also important in guard cells’ movement, which regulates stomatal aperture in plants [5]. The storage of K+ in the vacuole is important to maintain the concentration of K+ in the cytosol by its exchange between these two compartments. However, the optimal concentration of K+ must be sustained for the functioning of a cell. In cytoplasm, K+ concentration is correlated with a plant’s tolerance to different stresses such as drought [6] and salinity [7]. Additionally, K+ concentration is crucial for anion neutralization, which maintains and modulates membrane potential [2]. The accumulation of K+ and its movement from soil to other plant parts are followed by the involvement of a complex potassium transport system, which consists of various transporters and channels [8]. Genome-wide identification and characterization studies have revolutionized our understanding of gene families in several plants [8,9,10,11,12,13]. Thirty-five genes previously reported in A. thaliana are now considered K+ transporting proteins [9,10].
K+ channels are multimeric proteins, which are comprised of transmembrane (TM) segments called α- helices; these α-helices are defined on the basis of pore (P) domains. This part of a channel’s conduction pathway is made from the association of multimeric functional proteins with four P domains. A highly conserved motif with the amino acid sequence “GYGD/E” is also present in K+ channels. Topologically, fifteen selective channels of K+ in A. thaliana have been further divided into three subfamilies, including one K+ inward rectifier (Kir-like), five tandem-pore K+ channels (TPK), and nine voltage-gated shaker channels [9,10,11]. In addition, three sub-families of K+ transporters: Trk/HKT family of K+ efflux antiporters (KEA) family (six members), KUP/HAK/KT family of K+ uptake permeases (thirteen members), and high-affinity K+ transporters (one member) are included [9].
Pigeon pea (Cajanus cajan) is considered an important legume crop cultivated across different regions, including South America, South Asia, Africa, and Southeast Asia. India and Myanmar are major producers (>80%) of C. cajan [12]. It is a good source of proteins, carbohydrates, fat, fiber, essential amino acids, and minerals for humans and animals [13]. Farmers use its green part to feed their domestic animals as fodder [14]. In plants, K+ is a vital nutrient that affects the physiological and biochemical processes associated with different stress mechanisms [15,16,17,18,19]. Our understanding (especially in C. cajan) of how K+ plays a role in abiotic stress tolerance is limited. In A. thaliana and O. sativa, different channels and transporters of K+ have been reported previously. However, there is no information available about the role of K+ channels and transporters in C. cajan under abiotic stress. The current study was designed to identify and characterize the K+ transport system genes in C. cajan and to study their possible role in abiotic stress responses.

2. Results

2.1. Identification of K+ Transporters and Channels

In C. cajan, after confirming the motifs, thirty-nine genes for K+ transport system were identified (Table 1). Further analysis was performed to characterize transporters and channels separately. Out of thirty-nine genes, twenty-five were transporters and the remaining fourteen were channels. All the transporters and channels were renamed according to their respective chromosome number on which their gene sequence belonged, except the shaker family, which was named according to the shaker family of model plant A. thaliana (Table 1). Some motifs such as “GYGD”, “TVSS”, and “SPLY” are conserved in a family specific manner, also highlighting some other conserved motifs in K+ transporters and channels of C. cajan (Figure 1). The logos are based on class-specific motifs and are adopted from a previous report [20]. These motifs represent a consensus sequence from respective protein sequences of C. cajan, A. thaliana, and O. sativa. Therefore, they can be used as identification criteria for these proteins (Materials and Methods). The average molecular weight ranged from 128.0696 to 35.9705 kDa, and the isoelectric point varied from 4.97 to 9.43.

2.1.1. Potassium Transporters

KUP/HAK/KT

Different abbreviations are used for this family in different taxa, such as K+ uptake permeases (KUPs) in bacteria and K+ transporters (KT) and high-affinity K+ transporters (HAKs) in fungi [21,22,23]. Seventeen members of this family were identified in C. cajan. This number is greater than A. thaliana (13) and comparatively smaller than O. sativa (25) (Table 1). Protein sequences of KUP/HAK/KT family members were in a range from 706 to 844 amino acids (Table 1). At a genomic level, the number of exons varied from eight to ten. Transmembrane domains (TM) range from 10 to 14 in A. thaliana and O. sativa, apart from OsKUP/HAK/KT3. There are nine to fourteen transmembrane domains in the HAK family of C. cajan and an additional k_trans domain (Table 1). Multiple sequence alignment showed the presence of 12 residue stretches (GGTFALYSLLCR) and a conserved motif of K+ transporters (GVVYGDLGTSPLY) in the HAK family of C. cajan.

Trk/HKT

Two members of this family were identified in C. cajan, named as CcHKT1 and CcHKT2. The HKT family belongs to the Trk superfamily, which has similar topology to K+ channels and is mainly involved in the transport of K+/Na+. Protein sequences of these two proteins were in a range from 507 to 527 amino acids (Table 1). The exon count ranged from one to three. Transmembrane domains (TMs) ranged from nine to ten (Table 1).

KEA Family

Six members of the KEA family have been reported in A. thaliana [24], named as AtKEA1 to AtKEA6. The KEA family of C. cajan also has six members, named CcKEA1 to CcKEA6. The protein sequences of this family ranged from 574 to 1200 amino acids (Table 1). The number of exons varies from nineteen to twenty-one. The transmembrane domain (TM) numbers range from ten to twelve, except KEA5, which has no transmembrane domains.

2.1.2. Potassium Channels

Shaker Family

The shaker family was the first to be studied at the molecular level and nine members of this family have been identified in A. thaliana [25]. Similarly, nine members of shaker family have been identified in C. cajan (Table 1). The length of protein sequences in shaker family members ranges from 622 to 879 amino acids. The number of exons ranges from ten to thirteen. The number of transmembrane domains ranges from four to five. This family is also further classified into four subgroups: SKOR (one member), AKT (four members), KAT (three members), and GORK (one member) (Table 1).

TPK and Kir-Like Family

The TPK family is characterized by the presence of a hydrophobic core, containing four transmembrane domains and two P-loops (also known as KCO-2P); however, the Kir-Like family is characterized by a hydrophobic core comprising a 1P-loop and two transmembrane domains [26,27,28]. In C. cajan, five members of TPK and Kir-Like were identified (Table 1). The length of protein sequences of this family members ranges from 340 to 423 amino acids. At a genomic level, the exon count ranges from two to three. There are five transmembrane domains. A highly conserved motif (GYGD) is present in all TPK and Kir-Like family members, except for CcTPK1, where phenylalanine (F) is substituted by tyrosine (Y). This motif (GYGD) is necessary for selective K+ channels. The occurrence of substitution may affect the function of CcTPK1.

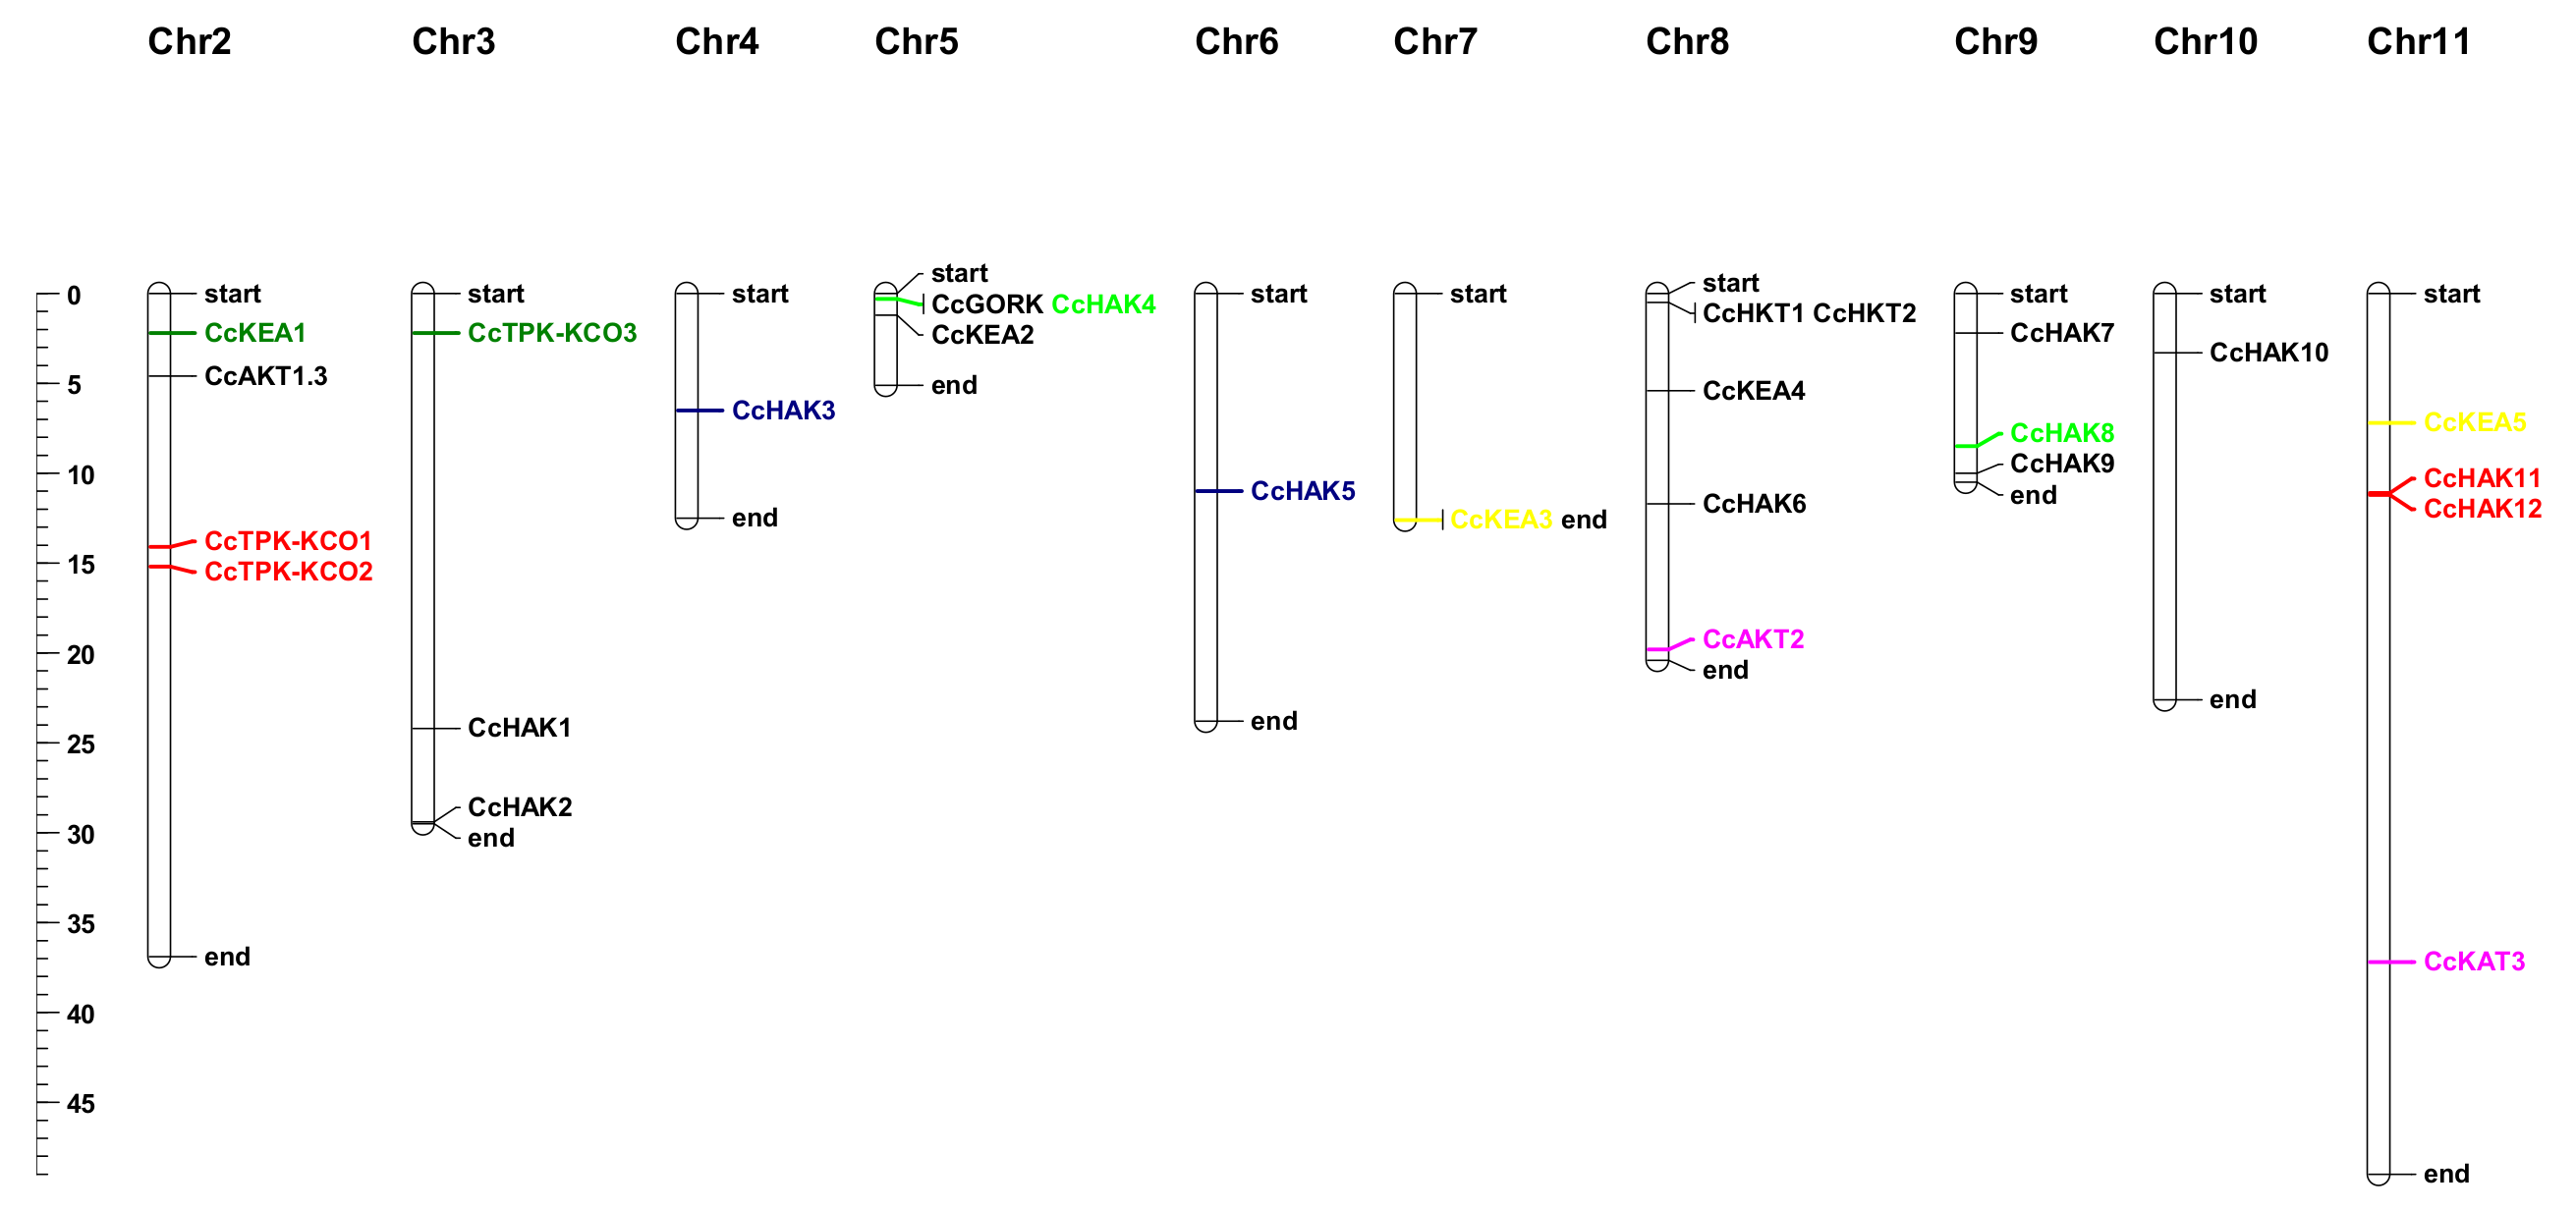
2.2. Gene Structure Analysis and Chromosomal Distribution of Potassium Transport-Related Genes

Over long evolutionary time intervals, exon and intron positions are generally conserved in orthologous genes, whereas intron/exon structure is smaller but sufficiently conserved in paralogous genes [29,30,31,32]. The gene structure was analyzed in K+ transporters and channels of C. cajan to reveal the intron/exon organization and conservation among transporters and channels. Great diversity was observed in exon count (two to twenty-one) and exon length of K+ transporters and channels. It was also observed that members of all five families showed similarities in introns (Figure 2). A significant similarity exists between the intron pattern of the AKT groups of the shaker family, while there is no significant difference in exon length among all AKTs. The exons of CcAKT1.1 and CcAKT1.2 have almost similar lengths, while the exon lengths of CcAKT1.3, CcAKT2, CcAKT1.1, and CcAKT1.2 are different from each other (Figure 2).
In C. cajan 26 out of 39 genes were mapped on 10 chromosomes (Figure 3). The positions of thirteen genes (CcHAK13, CcHAK14, CcHAK15, CcHAK16, CcHAK17, CcKEA6, TPK-KCO4, TPK-KCO, CcSKOR, CcAKT1.2, CcKAT1.1, CcAKT1.1, and CcKAT1.2) were not found, as they were present on the scaffold. They are not represented on the map. Chromosome number eight contains a maximum number of genes (five), four transporters, and one channel. Half of the mapped genes are present on chromosomes two, eight, and eleven, while the remaining half genes are located on the remaining seven chromosomes. Chromosomes three, five, and nine contain three genes each, whereas chromosomes four, six, seven, and ten contain one gene each. There is no gene present on chromosome 1 (Figure 3).
CcTPK-KCO1 and CcTPK-KCO2 are segmental duplicates of each other, and both are located on chromosome two. CcHAK3 and CcHAK5 are tandemly duplicated with each other and are present on chromosome four and chromosome six, respectively. CcKEA3 and CcKEA5 are tandem duplicates and are present on chromosome seven and chromosome eleven, respectively. CcAKT2 and CcKAT3 are tandem duplicates and are present on chromosome number eight and chromosome number eleven, respectively. CcHAK11 and CcHAK12 are segmental duplicates and are present on chromosome eleven. CcHAK8 and CcHAK4 are duplicated by tandem duplication, and both genes are located on chromosomes nine and five, respectively (Figure 3).

2.3. Comparative Phylogenetic Analysis

Protein sequences of K+ channels and transporters of C. cajan, A. thaliana, G. max, C. arietinum, O. sativa, and M. truncatula were used for phylogenetic analysis (Supplementary Figure S1). A phylogenetic tree of K+ transporters and channels of C. cajan, A. thaliana, G. max, C. arietinum, M. truncatula, and O. sativa was constructed to find the evolutionary relationship among them using MEGAX through a maximum likelihood method with 1000 bootstrap replicates. Members of shaker family (CcAKT1.3, CcKAT1.1, CcKAT1.2, CcAKT2,) showed a relationship with members of same (shaker) family of G. max and also shared the same clades. CcAKT1.2 and CcKAT3 are orthologous to members of the shaker family of G. max but do not share the same clades. CcGORK is orthologous to AtGORK. CcSKOR is orthologous to AtSKOR and members of the shaker family of G. max. CcAKT1.1 is orthologous to Medtr4g113530 and CarAKT1.1. No members of the shaker family in C. cajan are paralogous to each other (Supplementary Figure S1). However, CcTPK-KCO2, CcTPK-KCO5, and CcTPK-KCO3 are orthologous to G. max shaker family members and share the same clades, while CcTPK-KCO4 and CcTPK-KCO1 are orthologous to G. max shaker family members but do not share the same clades. This shows that channels of C. cajan have close relationships with their counterparts G. max and M. truncatula (Supplementary Figure S1).
In C. cajan, members of the HAK family (CcHAK8, CcHAK1, CcHAK11, CcHAK4, CcHAK5, CcHAK3, CcHAK6, CcHAK9) showed an orthologous relation with G. max (Figure 2), while CcHAK13, CcHAK16, CcHAK10, CcHAK15, CcHAK12 all have orthologous relations with G. max HAK family members (Supplementary Figure S1). CcHAK7 showed an orthologous relation with Medtr2g008820 and CcHAK14 with Medtr6g007697 (Supplementary Figure S1). CcHAK2 showed an orthologous relation with CarKUP/HAK/KT5. CcHAK17 has an orthologous relation with AtHAK1. It shows that the HAK family of C. cajan has a close relation with its dicot counterparts, i.e., G. max, M. truncatula, and A. thaliana. No members of the HAK family of C. cajan are paralogues to each other (Supplementary Figure S1). CcHKT1 is paralogous to CcHKT2 and shares the same clade (Supplementary Figure S1).

2.4. Promoter Analysis

Cis-regulatory elements (CRE) are linear fragments of non-coding DNA. Cis-regulatory elements provide the binding sites to transcription factors [33]. They have many localizations, orientations, and activities in relation to genes. Analysis of the promoter region for cis-regulatory elements can provide information about the regulatory networks of genes. Promoter regions (1500 bp upstream) of all K+ channels and transporters were searched for CREs to understand the regulatory mechanisms. HKT and shaker families are well characterized in model plants, so selected abiotic stress-related cis-elements were searched in the promoter region of shaker and HKT family members of C. cajan (Table 2).

2.5. Physiological Analysis

2.5.1. Chlorophyll Content

Total chlorophyll content was adversely affected by salt stress compared to heat and drought stress. A significant decrease in total chlorophyll content was observed under salt stress. Higher salt stress for prolonged periods results in adverse effects on total chlorophyll content. Salt stress is one of the major factors affecting the overall growth and yield of plants. The higher decrease in chlorophyll content was observed in salt stress (33.82%) followed by drought stress (23.52%) and heat stress (14.7 %) (Figure 4). The reduction in chlorophyll content leads to a lower rate of photosynthesis, halting the growth and development of plants.

2.5.2. Carotenoid Content

Environmental factors are highly detrimental for carotenoid contents, affecting carotenoids in plants. Most of the carotenoid reduction was observed in plants with salt stress followed by drought and heat stress, as compared to control. Carotenoid content in plants with salt stress treatment was reduced by 35.89% followed by 27.62% in drought stress (Figure 4). Salt and drought stresses are the main factors for reducing carotenoid contents in C. cajan.

2.5.3. Total Soluble Protein Content

Environmental factors such as salt, drought, and heat cause adverse effects on total soluble protein content. These factors adversely affect total soluble protein content. A significant reduction in total soluble protein content was observed in plants of C. cajan, with salt stress showing a reduction of 89.94 %, followed by 62.39 % under heat stress (Figure 4). Salt stress causes damage to protein synthesizing mechanisms and a loss in tertiary structure, leading to the degradation of misfolded proteins. However, this response of plants depends upon the intensity and duration of the stress, plant species, stage of development, and growing season.

2.5.4. Superoxidase Dismutase (SOD), Peroxide (POD), and Catalase Activity (CAT)

Antioxidant activities (POD, SOD, and CAT) were significantly reduced under drought and heat stresses. The antioxidant activity of peroxide was slightly increased under heat stress, while it decreased under drought and salt stresses (Figure 4). The largest POD reduction (44%) was observed in drought stress compared to control. Superoxide dismutase activity was decreased in all three conditions (heat, salt, and drought). The largest reduction was observed in plants treated with heat stress (42.40%), followed by salt (26.63%) and drought stresses (2%). Catalase (CAT) activity was reduced in all three stress treatments, i.e., heat, drought, and salt compared to control. A substantial reduction in catalase activity was observed under heat stress (67.45%), followed by drought (51.73%) and salt stresses (37.13%).

2.6. In Silico Expression Analysis

Comparative expression of K+ transporting genes in the flower-bud of two different cultivars of C. cajan (AKPR303 and AKCMS11) was analyzed. The average for two biological replicates was used for each cultivar. Most of the genes were expressed in both cultivars, except for some genes that showed zero expression. Some HAK family members (HAK-3, -4, -5, -6, -7, -8, -10, -12, -13, -15, -16, -17) and some TPK-KCO family members (KCO-1, -2, -3, and -4) were found to be highly expressed in both cultivars, while other HAK family members, i.e., HAK-9, -11, -14 and KEA family members, i.e., KEA-1, -2, were found slightly expressed in both cultivars. Specifically, CcHAK15 was highly expressed (up to six units). CcHAK2, CcHKT1, and CcKAT3 showed no expression in all three cultivars (Figure 5A).
Various abiotic stresses have adverse effects on plant growth and it has already been reported that K+ transporting genes mediate plant response to salt stress [28] and heat stress [29]. Thus, the already-available RNA-seq data were used to analyze the differential expression of potassium-transporting genes under heat stress at two time points (30 min and 3 h), and under salt stress in two cultivars. Two cultivars of C. cajan were used, one salt-tolerant cultivar and other salt cultivar. Our results revealed that the potassium-transporting system is involved in abiotic stress response.
In the case of heat stress, most of the genes were downregulated at both time points, except CcHAK1, CcHAK11, CcKAT1.1, and CcTPK-KCO2, which were found to be upregulated (Figure 5B).
In the case of salt stress, CcHAK15 and CcTPK-KCO3 were highly upregulated in salt-susceptible cultivars and moderately upregulated in salt-tolerant cultivars, while CcHAK6 was found to be downregulated in salt-tolerant cultivars and upregulated in salt susceptible cultivars. CcGORK, CcHAK1, CcHAK9, and CcHAK11 were upregulated in salt-tolerant cultivars and downregulated in salt-susceptible cultivars. CcHAK6, CcKEA6, and CcSKOR were downregulated in salt-tolerant cultivars and upregulated in salt-susceptible cultivars. CcAKT1.1, CcKEA3, CcHKT2, CcHAK2, CcHAK4, and CcHAK7 were found to be downregulated in both cultivars (Figure 5C). These results indicated the involvement of potassium-transporting genes in the regulation of susceptibility and tolerance of C. cajan.
There was no expression change found in CcKEA1, CcKEA2, CcKAT1.2, CcKAT3, and CcAKT1.3 under both heat and salt stress conditions (Figure 5B,C).

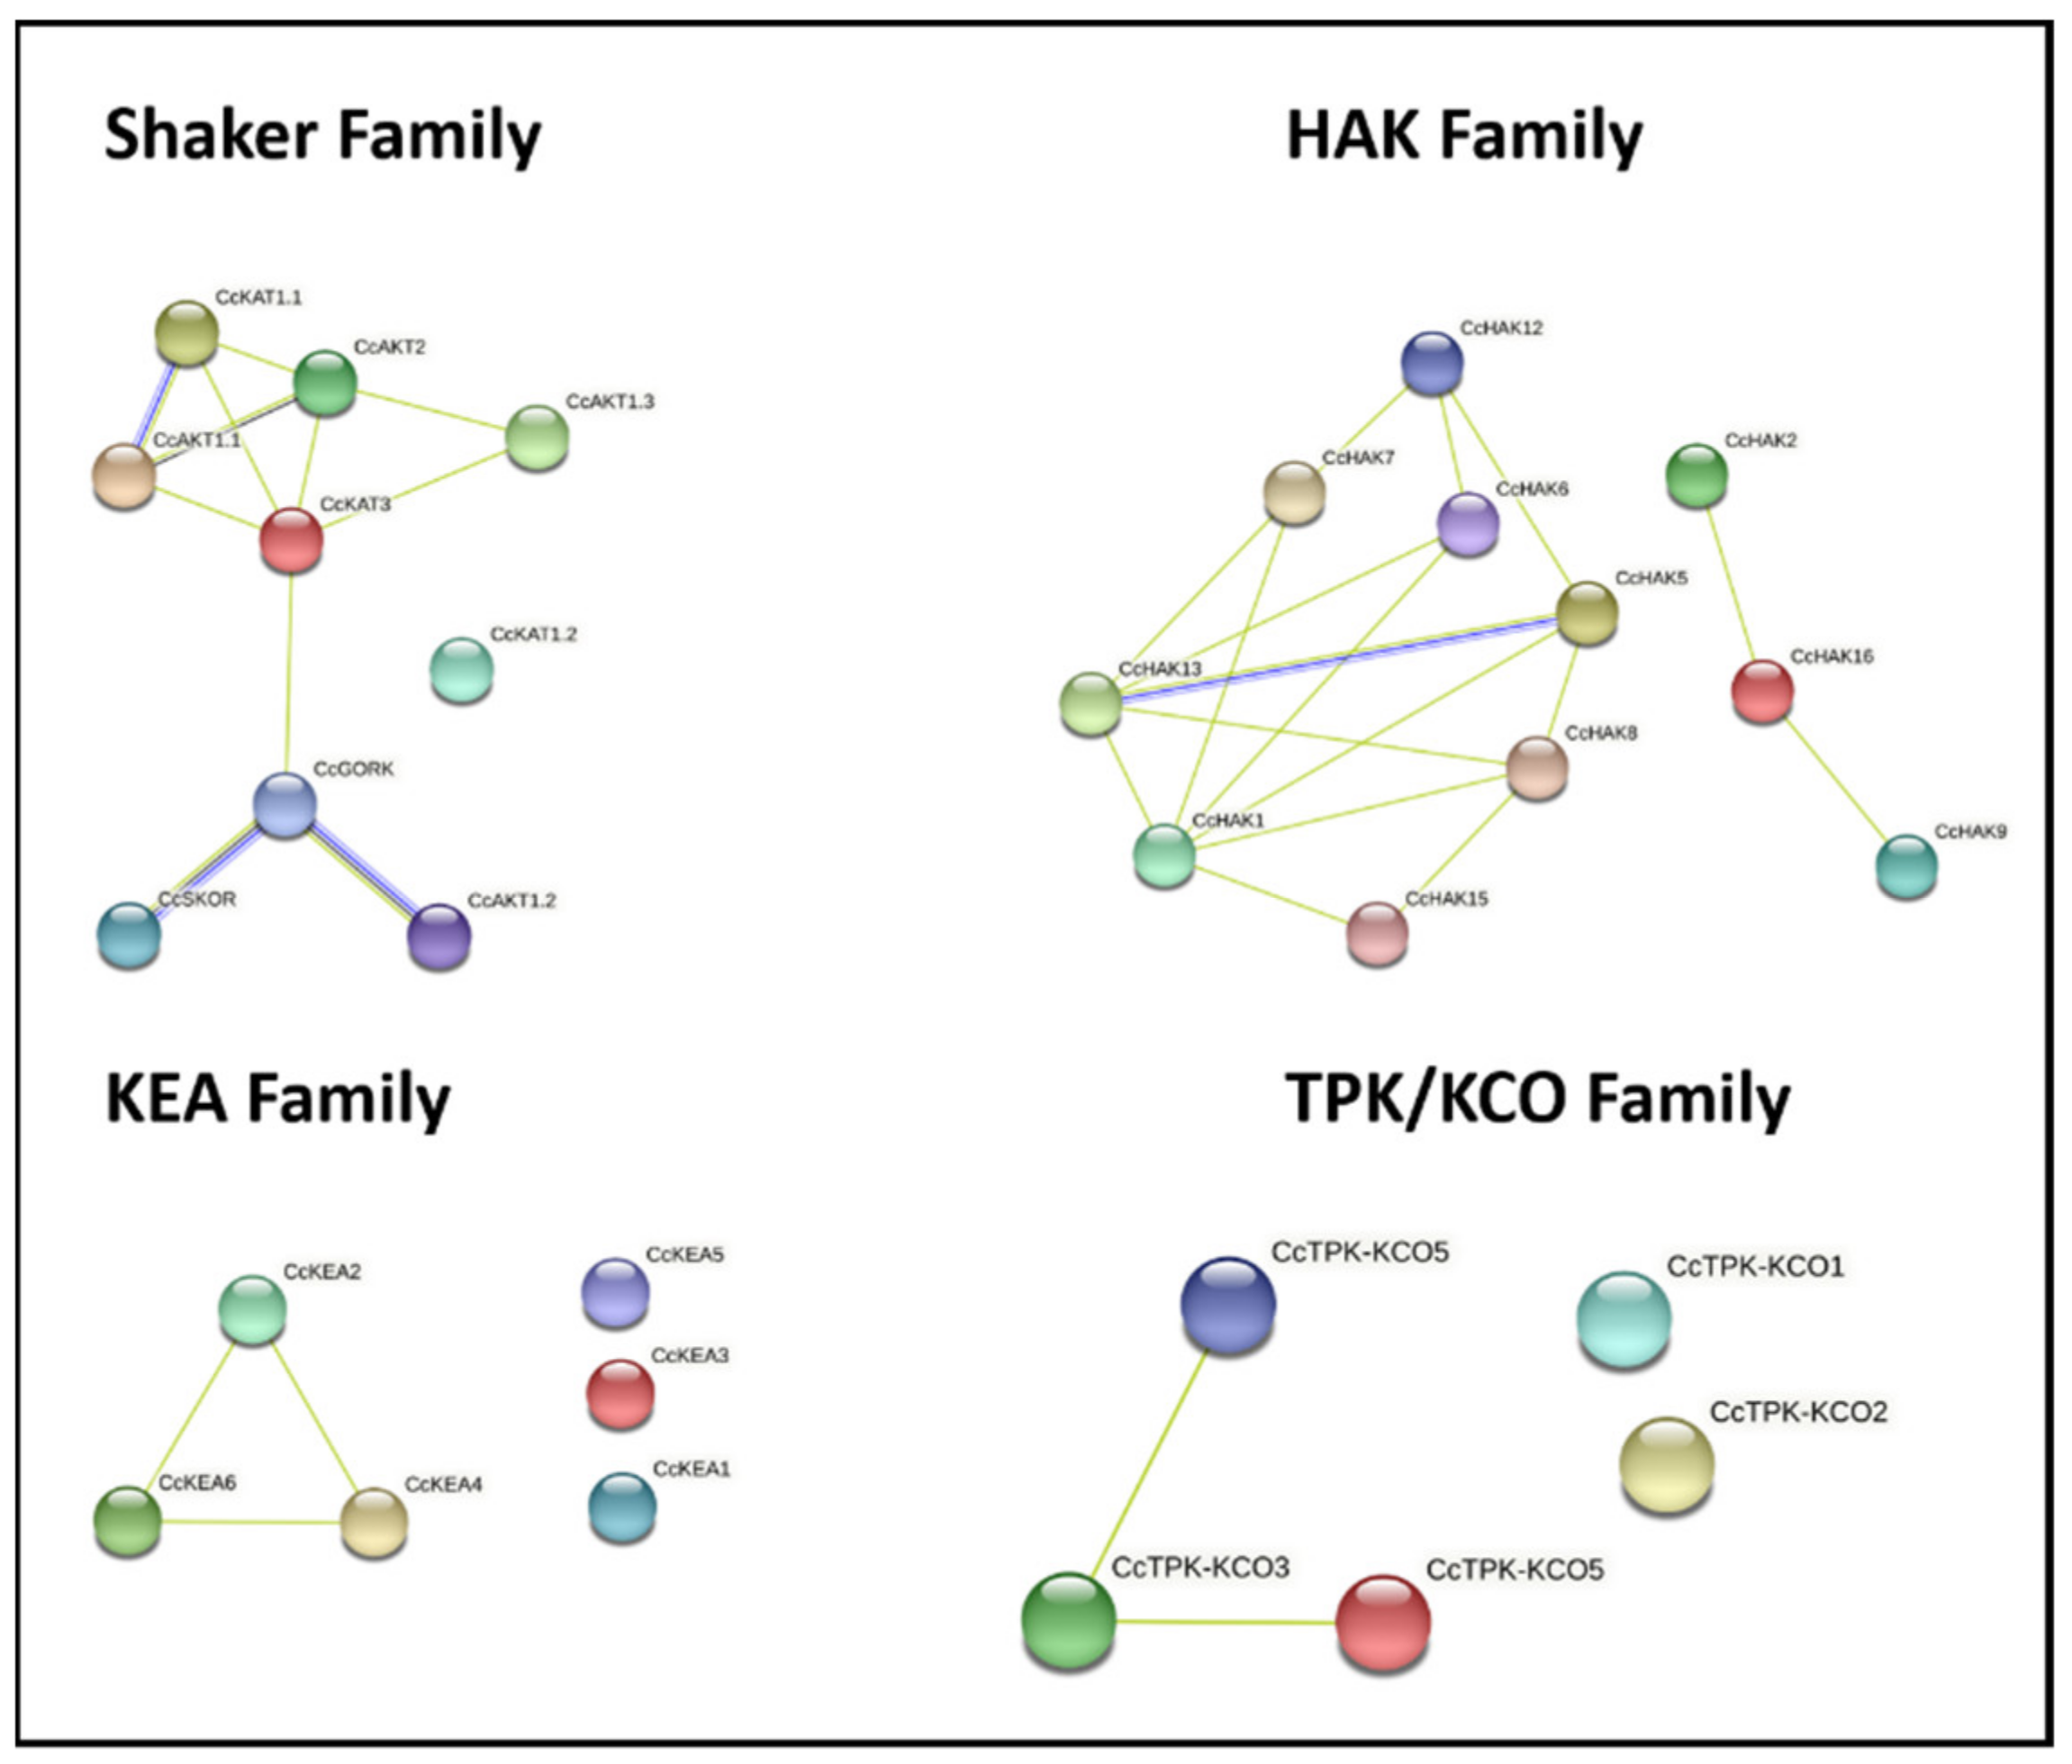
2.7. Protein–Protein Interaction

Protein–protein interaction was predicted using the STRING database (Figure 6). The associations predicted through this tool are meant to be specific and meaningful, i.e., proteins jointly contribute to a shared function; this does not necessarily mean they are physically bound to each other. For shaker family members, it predicted interactions between inward rectifying-like channel proteins (CcAKT1.1, CcAKT1.3, CcKAT1.1), a weak inward-like channel protein (CcAKT2), and a regulatory subunit (CcKAT3). Similarly, CcKAT3 also interacted with an outward rectifying-like channel protein (CcGORK), which further interacted with an outward rectifying-like channel CcSKOR and inward rectifying-like channel protein CcAKT1.2. Similarly, interactions were predicted among members of KEA, HAK, and TPK/KCO families. In the KEA family, CcKEA2, 4, and 6 form a network, while in the TPK/KCO family, CcTPK/KCO 3 and 5 form a network. In the HAK family, there were two networks, one for CcHAK1,5,6,7,812,13, 15 and another for CcHAK2,9,16. No interaction was predicted for CcKAT1.2, KEA1, KEA 3, KEA 5, CcTPK/KCO1, and CcTPK/KCO2. In an overall network, CcHKT1 demonstrated a co-occurrence interaction with CcHAK5.

2.8. Gene Expression Analysis

Real-time amplification (qRT-PCR) was performed to estimate the transcript abundance of selective K+ genes in leaf tissues of C. cajan under applied abiotic stresses, i.e., heat, salt, and drought (Figure 7). Gene expression of K+ transporters and channels was regulated by various abiotic stresses, and changes in expression led to stress tolerance [34]. The shaker family has been widely investigated and studied for its functional characterization and function in abiotic stress response [35]. Based upon RNA-seq data, nine genes including CcAKT1.1, CcKAT3, CcAKT2, CcGORK, CcHKT1, CcHAK4, CcHAK6, CcHAK15, and CcHAK16 were selected for qPCR-based quantification in response to heat, salt, and drought stresses (Figure 6). Expression analysis of shaker family members CcAKT1.1, CcAKT2, CcKAT3, CcGORK, and CcHKT1 was performed under different stress conditions. CcAKT1.1 was differentially regulated under salt, heat, and drought stresses. CcAKT1.1 was found to be highly upregulated (up to five-fold change) in response to drought stress, while, in terms of salt stress and heat stress, it was found to be downregulated. CcAKT2 was observed to be upregulated in response to heat, salt, and drought stresses. CcHKT1 was found to be highly upregulated in response to heat stress (up to seven-fold change), salt stress (up to four-fold change), and drought stress (up to two-fold change). CcKAT3 was found to be highly upregulated in the salt stress condition, while, in drought stress and heat stress conditions, it was found to be moderately upregulated. CcGORK expression was upregulated in drought stress and salt stress conditions, while, in the case of heat stress condition, it was found to be downregulated (Figure 7). GORK expression is associated with closure of stomata and drought tolerance [36]. Among the transports, CcHAK4 was observed to be downregulated, while CcHAK16 was found to be upregulated under the applied stresses. The expression of CcHAK6 and CcHAK15 was reduced under heat stress while it was upregulated in response to salt and drought stresses.

3. Discussion

In plants, K+ takes part in different cellular mechanism such as maintenance of pH, neutralization of protein charges, activation of enzyme, and stabilization of the synthesis of protein. It is also involved in the regulation of turgor pressure, cell enlargement, water potential, movement of stomata, and membrane polarization [37]. For the uptake of K+ from soil to its distribution across the plant body, there is a complex system for K+ transport. This system is comprised of two types of proteins, namely transporters and channels [9,35,38]. In the present study, 39 genes encoding for K+ transport system have been identified in C. cajan. There were nine shaker family genes identified in C. cajan, which is consistent with previously reported results, such as in Vitis vinifera (nine genes) [39], A. thaliana (nine genes) [11], O. sativa (eleven genes) [16], and C. arietinum (eight genes) [29]. Both outward rectifying channel genes (GORK and SKOR) are identified in C. cajan (CcGORK and CcSKOR). The identification of CcGORK in C. cajan shows its important role in stomatal movement and distribution of K+ across various parts of a plant’s body [40]. Shaker family of C. cajan and A. thaliana has same domain pattern. Channels of C. cajan showed a closed homology with dicot plants (G. max, A. thaliana, and M. truncatula), which is opposite to that of monocots (O. sativa). C. cajan channels have a closed homology with G. max compared to M. truncatula and A. thaliana. The results revealed that channels of K+ in C. cajan are conserved functionally as well in different plant species.
In C. cajan, five members of the TPK-KCO family have been identified; this is similar to A. thaliana (five members). The TPK family has a 4TM/2P topology. In addition to A. thaliana, the TPK family is also identified in many other plants such as O. sativa, N. tabacum, H. vulgare, S. tuberosum and C. arietinum [28,41,42,43]. It shows the conservation and importance of this family in K+ transport. The highly conserved motif “GYGD”, which is a hallmark of channels in K+ transport systems, is highly conserved in all TPKs except CcTPK1, where a substitution of phenylalanine (F) occurs in place of tyrosine (Y). The substitution that occurred in CcTPK1 may affect the function of the protein.
In addition to the KUP/HAK/KT family of A. thaliana, various studies have reported the role of the KUP/HAK/KT family in different plants such as L. japonicas [44], V. vinifera [45], P. nigrum, S. lycopersicum [46], M. crystallinum [47], H. vulgare [48], seagrass [49], and C. arietinum [29]. In the C. cajan genome, seventeen members of the HAK family were characterized showing the same pattern of domain as their orthologs in G. max. All of them possess nine to thirteen trans-membranes (TMs) and an additional k_trans domain, which takes part in the transport of K+.
Some transporters, i.e., OsHAK5, OsHAK1, and AtHAK5, are well identified and involved in the uptake of K+ in roots [50,51]. Knockout of OsHK5 showed reduced uptake of K+ influx rate by 80% in 0.1 mM K+ solution [52]. AtHAK5 is the only gene that is involved in the uptake of K+ below 0.01 mM. [53]. The CcHAK1 showed homology with AtHAK5 (55.25% similarity) and OsHAK5 (57.88% similarity) in a phylogenetic tree. This suggests that the CcHAK1 might play a role in helping plants grow in K+-limiting conditions. Compared to AtHAK5 and AtAKT1, AtKUP7 is involved in the uptake of K+ [54]. AtHAK7 shares a phylogenetic cluster with CcHAK7 (88.69% similarity) and CcHAK8 (97.43% similarity). It shows that these proteins share functional properties with AtHAK7.
In C. cajan, two members of the HKT family (CcHKT1 and CcHKT2) are identified. HKT belongs to the superfamily of Trk, which has a similar topology to K+ channels and is primarily involved in K+/Na+ transport. Both members of the HKT family share phylogenetic clusters with OsHAK1.4 and OsHAK1.5, which shows their role in Na+ transport [55].
Physiochemical analysis of C. cajan showed that total chlorophyll, carotenoids, and total soluble proteins content is affected by different abiotic stresses such as salt, heat, and drought. It was observed that salt stress adversely affects total chlorophyll, carotenoids, and total soluble proteins content [45,56]. Higher Na+ accumulation in cytosol results in the damage of the photosystem, causing a substantial reduction in pigment content. Heat and drought stresses also negatively affect the total chlorophyll, carotenoids, and total soluble protein content. Salt stress causes damage to protein-synthesizing mechanisms and proteins undergo accelerated hydrolysis due to the increased activity of protease. This may cause a loss in tertiary structure and the degradation of misfolded proteins by proteasome. Under stress conditions, rubisco is the enzyme reduction activity that reduces protein synthesis and accelerates its degradation. Furthermore, it also interrupts the soluble amino acid and protein ratio in plants. However, this response of plants depends upon the stress duration and intensity, growing season, and developmental stage of plants [57].
Antioxidant activity of superoxide dismutase, superoxide, and catalase was analyzed under abiotic conditions (salt, heat, and drought). Catalase content was greatly decreased under all abiotic stresses; in particular, a higher reduction was observed under heat stress. The antioxidant activity of superoxide dismutase was mostly affected by heat stress followed by salt stress; drought stress showed a smaller effect compared to control conditions. Superoxide content was decreased under drought stress followed by salt stress, while superoxide content was increased under heat stress [58]. Peroxidation of lipids is considered as the major molecular mechanism that causes oxidative injuries to cell structures under abiotic stress. It is further enforced by the production of reactive oxygen species (ROS) such as hydrogen peroxide (H2O2), singlet oxygen (1O2), hydroxyl radical (•OH), and superoxide anion (O2), all of which reduce membrane fluidity. Additionally, it promotes an exchange between the lipid bilayer of two halves in phospholipids that facilitate electrolyte leakage. In recent decades, hydrogen peroxide (H2O2) has gained interest among other ROS because it plays an important role in abiotic stress [59,60].
Under various abiotic stresses, gene expression analysis revealed the role of K+ channels and transporters in the homeostasis of K+. Gene expression analysis of CcGORK, CcAKT1.1, CcKAT3, and CcHKT1 was performed under stress conditions, as described earlier. CcGORK, a drought tolerance-inducing protein, was expressed in guard cells and was upregulated under drought, heat, and salt stresses, confirming its role in stomatal closure to prevent water loss. Anion efflux that depolarizes the guard cells activates GORK expression, and the resultant efflux of K+ prevents stomatal closure and water loss [38]. AKT1 is involved in the uptake and homeostasis of K+ [61]. CcAKT1.1 was upregulated under salt and drought stresses, while, in heat stress, it was slightly downregulated. KAT3 is involved in the influx of K+ along with AKT1 [62]. Gene expression of CcKAT3 was upregulated under salt, heat, and drought stresses. Under drought stress, CcKAT3 was upregulated compared to heat and salt stresses. HKT1 is a K+/Na+ cotransporter [63]. The expression of CcKHT1 under heat stress was highly upregulated. It was also upregulated under salt and drought stresses, thus confirming its role in Na+ uptake and helping plants to reduce the effects of stress.

4. Materials and Methods

4.1. Screening of Potassium Transport System in C. cajan

The protein sequences of already-identified K+ transport genes from A. thaliana and O. sativa were utilized as a query to screen the K+ transporting genes in C. cajan [10,16,17]. An NCBI-BLASTp program was used to retrieve the protein sequences. Raw data were manually curated for the elimination of false-positive results. Furthermore, a selective K+ filter G-Y-G-D was also manually confirmed in the protein sequences and redundant sequences were removed. Subsequently, the remaining sequences were used for further analysis. For this purpose, the identified sequences were searched for following motifs: Four KUP/HAK/KT transporters; (1) G-[S, T]-E-A-[M, I]-[F, V]-D-L-[G, A]-[F, V], (2) G-D-[LV-I]-[S, G]-T-S-P-L-Y, (3) G-[D, V]-G-[V, I]-[L, I]-T-P-A-S, (4) A-[D, N]-N-G-[E, P]-G, Two for HKTs; (1) [S, T, A]-x-[F, Y, V, L, C]-x-[D, N, S]-G, (2) [G, A]-[Y, F]-[G, A]-x-[V, A, I]-G-[L, M, Y, F]-[S, T] and three for channels; (1) [L, M, V]-[T, A, D]-[T, S]-[V, T]-G-Y-G-D (2) [A, S]-[L, M, V]-Y-[W, F]-[S-C-T]-[I, V, M]-T (3) H-[C,F,T,A]-A-[A,G]-C-[F,I]-N-[Y,F]. The variants of all predicted genes were checked manually and only the largest open reading frames (ORF) were selected for further analysis. Subsequently, genes were further analyzed by different databases, i.e., Pfam database (http://pfam.janelia.org/ (accessed on 14 August 2021)), NCBI conserved domain database (http://0-www-ncbi-nlm-nih-gov.brum.beds.ac.uk/Structure/cdd/wrpsb.cgi (accessed on 14 August 2021)), and SMART database (http://smart.embl-heidelberg.de/ (accessed on 14 August 2021)). Highly conserved domains containing genes were selected for further analysis. All the genomic information, protein sequences, chromosomal locations, exon numbers, and protein lengths of K+ transporters and channels were taken from NCBI.

4.2. Motif Recognition and Gene Structure Prediction

MEME (http://meme.sdsc.edu/meme/meme.html (accessed on 14 August 2021)) was used to find conserved motifs in protein sequences and default parameters were used for motif analysis. Weblogo (https://weblogo.berkeley.edu/logo.cgi (accessed on 14 August 2021)) was used to represent the conserved motifs. NCBI was used to retrieve the genomic and coding sequence of all identified genes. Gene Structure Display Server (http://gsds.cbi.pku.edu.cn/ (accessed on 14 August 2021)) was used to schematically represent the exon–intron structure of genes. Analysis of gene structure was performed using selected sequences.

4.3. Multiple Sequence Alignment, Phylogenetic Analysis, and Cis-Regulatory Elements Prediction

ClustalW was used for multiple sequence alignment. Phylogenetic analysis was performed using MEGAX Neighbor-Joining with 1000 bootstrap methods to construct phylogenetic trees. iTOL [18] (https://itol.embl.de (accessed on 14 August 2021)) was used to visualize and modify the phylogenetic tree. Cis-regulatory elements (CREs) were searched from upstream regions (1000–1100 bp) of all characterized genes. The cis-regulatory elements in the promoter region were analyzed by the Plant CARE website (http://bioinformatics.psb.ugent.be/webtools/plantcare/html/ (accessed on 14 August 2021)).

4.4. Gene Duplication, Evolutionary Analysis, and Chromosomal Mapping in Cajanus cajan

Gene duplication events were determined by DNAsp and the Ka/Ks ratio was calculated to determine duplication events. Divergence time was also calculated using the Ks and Ka values to predict the evolutionary events. Genomic Loci of putative K+ channels and transporters were graphically represented by the MapChart program (http://www.biometris.wur.nl/UK/Software/MapChart/download (accessed on 14 August 2021)).

4.5. Plant Growth and Stress Imposition

Seeds of domesticated C. cajan were obtained from a local market of Faisalabad, Pakistan. Plants were grown in plastic pots filled with peat moss in a growth chamber. Pots were kept under the following growth conditions: 22 °C night/25 °C day temperature, 8 h dark and 16 h light period, and 68% humidity. Plants were grown in four different treatments groups: control, heat stress, drought stress, and salt stress, each with three replicates. After 12 days of germination, plants were challenged with heat, drought, and salt stresses. Hoagland solution (10 mL/day) was applied to provide necessary nutrients for plant growth. Drought stress was imposed by limiting the water supply for 7 days, while control was supplied with ample water. Salt stress was imposed by supplying 100 mM NaCl solution for 8 days from the 13th day of germination [52]. Plants were kept at 45 °C for 8 h for heat stress and immediately harvested after treatment. All the treatments were in triplicate and the average values were used for succeeding analysis. The leaves of all treated and control plant samples were dipped in liquid nitrogen and stored at −80 °C for further analysis.

4.6. Physiological Analysis

4.6.1. Chlorophyll Content

Fresh leaves (0.1 g) were taken, ground, and homogenized in 80% methanol for estimation of chlorophyll content. These samples were kept at 4 °C overnight. Subsequently, a spectrophotometer (Shanghai Yoke Instrument Co., Ltd., Shanghai, China) was used to take the absorbance at various wavelengths, i.e., 645 nm and 663 nm. Then, 80% methanol was used as blank to normalize the absorbance value of the solvent. The following formulas were used to measure chlorophyll a, b, total chlorophyll, and chlorophyll a/b ratios:
Chlorophyll a (mg g−1 f.wt) = [12.7 (OD 663) − 2.69 (OD 645)] × V/(1000) × W
Chlorophyll b (mg g−1 f.wt) = [22.9(OD645) − 4.68(OD663)] × V/(1000) × W
Total chlorophyll = chlorophyll a + chlorophyll b
Chlorophyll a/b ratio = Chlorophyll a/chlorophyll b
V = volume of the extract (mL)
W = weight of fresh leaf tissue (g)

4.6.2. Carotenoid Contents

For estimation of carotenoid contents, fresh leaves (0.1 g) were ground and homogenized in 80% methanol. Samples were centrifuged for 15 min and the supernatant was used to measure the carotenoid contents at 480 nm. The following formula was used to measure total carotenoid content:
C = (1000A480 − 1.63Ca − 104.96Cb)/221
A = absorbance
Ca = alpha-carotene
Cb = beta-carotene

4.6.3. Biochemical Studies

The activity of biochemical entities (superoxide dismutase, superoxide, catalase, and total soluble proteins) was determined by following protocols reported in different studies. Superoxide dismutase activity was measured by following [64]. Peroxidase activity was determined according to [65]. Catalase activity was assayed as described by [65]. The total soluble proteins were determined by the following [66].

4.7. In Silico Expression Profiling and PPI Analysis of Potassium Transport Genes

The expression pattern of K+ transport genes was analyzed in two different cultivars of C. cajan (AKPR303, AKCMS11, TTB7). For this purpose, RNA-seq data (SRR6780151, SRR6780152, SRR6780153, SRR6780154, SRR6785590, SRR6785591) were downloaded from NCBI-SRA (https://0-www-ncbi-nlm-nih-gov.brum.beds.ac.uk/sra (accessed on 14 August 2021)). Moreover, to analyze the expression pattern of potassium-transporting genes in C. cajan under heat stress at different time points (30 min, 03 h) and salt stress in ICP7: salt-tolerant and ICP1071: salt susceptible, data (heat: SRR11856663 SRR11856664, SRR11856665, salt: SRR5451688, SRR5451689, SRR5451690, SRR5451691) were downloaded from the NCBI-SRA database. These paired-end clean reads were mapped to the C. cajan genome. C. cajan genome was downloaded from NCBI and indexes were built using bowtie2. The cufflinks program was used to calculate the expression level of annotated genes in the reference genome using the GFF format of the genome. The normalized FPKM value was used to construct a heatmap using TBtools. Furthermore, these identified potassium transporters and channels were subjected to STRING v11.0 (https://string-db.org/ (accessed on 14 August 2021)) to analyze network of protein–protein interactions (PPIs). The minimum required interaction score was 0.400, corresponding to medium confidence.

4.8. RNA Isolation, Reverse Transcriptase PCR, and Quantitative Real-Time PCR (qRT-PCR)

Total RNA was extracted from leaf samples of C. cajan by Trizol method and quantified by Thermo Nanodrop 2000 (Thermo Fisher Scientific, Waltham, MA, USA). One mg of RNA was used for the synthesis of cDNA using the First-Strand Synthesis kit. cDNA was stored at −20 °C for further analysis. qRT-PCR was performed for expression analysis of transcripts level using a qRT-PCR detection system (CFX96 Touch™ Real-Time PCR Detection System, Bio-Rad laboratories, Hercules, CA, USA) with iTaq Universal SYBR Green SuperMix. The “Oligo Calculator”, an online tool (http://mcb.berkeley.edu/labs/krantz/tools/oligocalc.html (accessed on 14 August 2021)), was used to design gene-specific primers, which were further verified by the NCBI-primer BLAST program (https://0-www-ncbi-nlm-nih-gov.brum.beds.ac.uk/tools/primer-blast/ (accessed on 14 August 2021)). The expression analysis was triplicated for each of the genes and the GAPDH gene was considered as the housekeeping gene [67].

5. Conclusions

In plants, K+ is one of the major nutrients (NPK), yet it has attracted very little attention from farmers and researchers. C. cajan is cultivated on soils that have low nutrients. Various studies have reported on growth and development by K+ transport systems in plants. Therefore, a comprehensive investigation into K+ homeostasis mechanisms is required in C. cajan to understand their influence on plant development, growth, and stress response. The present research focused on revealing K+-transporting genes in C. cajan. In this study, 39 genes of the K+ transport system were identified, comprising K+ transporters (25 genes) and K+ channels (14 genes), in C. cajan on the basis of their sequence and structure similarity with A. thaliana. Evolutionary conservation of K+ transport system genes in monocots/dicots and legumes/non-legumes was also observed by gene structure and phylogenetic analysis. Gene promoter analysis provided significant information about the importance of K+ transport-related genes in response to abiotic stress in C. cajan. Physio-chemical analysis provided insights about the contrary effects of abiotic stresses on C. cajans under different physiological parameters such as chlorophyll, carotenoids, and total soluble protein and antioxidant activities, i.e., SOD, POD, and CAT under heat, salt, and drought. The antioxidant activity of these compounds was increased under applied stress conditions; catalase activity was significantly decreased under all three stresses. This study provides initial insight into the C. cajan K+ transport system, which is helpful for further studies hoping to explore all-genes function in different biological processes and under different stress conditions.

Supplementary Materials

The following are available online at https://0-www-mdpi-com.brum.beds.ac.uk/article/10.3390/plants10112238/s1, Figure S1: The evolutionary history was inferred by using the Maximum Likelihood method based on the JTT matrix-based model tree with the highest log likelihood (-119897.9497) is shown. Initial tree(s) for the heuristic search were obtained automatically by applying Neighbor-Join and BioNJ algorithms to a matrix of pairwise distances estimated using a JTT model, and then selecting the topology with superior log likelihood value. The tree is drawn to scale, with branch lengths measured in the number of substitutions per site. Evolutionary analyses were conducted in MEGAX. Visualization of phylogenetic tree was carried out through iTOL webserver.

Author Contributions

Conceptualization, M.H.S. and F.A.; methodology, N.I.B., R.Z. and S.M.; software, R.Z.; validation, N.N., U.I. and A.M.; formal analysis, R.Z., F.A. and M.N.; investigation, F.A. and M.H.S.; data curation, M.H.S.; writing—original draft preparation, M.H.S. and M.A.R.R.; writing—review and editing, M.A.R.R., A.H., E.F.A. and F.A.; funding acquisition, A.H. and E.F.A. All authors have read and agreed to the published version of the manuscript.

Funding

The authors would like to extend their sincere appreciation to the Researchers Supporting Project Number (RSP-2021/356), King Saud University, Riyadh, Saudi Arabia.

Institutional Review Board Statement

Not applicable.

Informed Consent Statement

Not applicable.

Data Availability Statement

Data is contained within the article and Supplementary Materials.

Acknowledgments

The authors would like to extend their sincere appreciation to the Researchers Supporting Project Number (RSP-2021/356) of King Saud University, Riyadh, Saudi Arabia.

Conflicts of Interest

The authors declare no conflict of interest.

References

  1. Clarkson, D.T.; Hanson, J.B. The Mineral Nutrition of Higher Plants. Annu. Rev. Plant Physiol. 1980, 31, 239–298. [Google Scholar] [CrossRef]
  2. Leigh, R.A. Potassium homeostasis and membrane transport. J. Plant Nutr. Soil Sci. 2001, 164, 193–198. [Google Scholar] [CrossRef]
  3. Walker, D.J.; Leigh, R.A.; Miller, A.J. Potassium homeostasis in vacuolate plant cells. Proc. Natl. Acad. Sci. USA 1996, 93, 10510–10514. [Google Scholar] [CrossRef] [PubMed] [Green Version]
  4. Lemoine, R.; La Camera, S.; Atanassova, R.; Dédaldéchamp, F.; Allario, T.; Pourtau, N.; Bonnemain, J.-L.; Laloi, M.; Coutos-Thévenot, P.; Maurousset, L.; et al. Source-to-sink transport of sugar and regulation by environmental factors. Front. Plant Sci. 2013, 4, 272. [Google Scholar] [CrossRef] [Green Version]
  5. Shi, H.; Ishitani, M.; Kim, C.; Zhu, J.-K. The Arabidopsis thaliana salt tolerance gene SOS1 encodes a putative Na+/H+ antiporter. Proc. Natl. Acad. Sci. USA 2000, 97, 6896–6901. [Google Scholar] [CrossRef] [Green Version]
  6. Gupta, A.S.; Berkowitz, G.A.; Pier, P.A. Maintenance of photosynthesis at low leaf water potential in wheat: Role of potassium status and irrigation history. Plant Physiol. 1989, 89, 1358–1365. [Google Scholar] [CrossRef] [Green Version]
  7. Maathuis, F.J.M. Physiological functions of mineral macronutrients. Curr. Opin. Plant Biol. 2009, 12, 250–258. [Google Scholar] [CrossRef]
  8. Kumar, M.; Kherawat, B.; Dey, P.; Saha, D.; Singh, A.; Bhatia, S.; Ghodake, G.; Kadam, A.; Kim, H.-U.; Manorama, C.; et al. Genome-Wide Identification and Characterization of PIN-FORMED (PIN) Gene Family Reveals Role in Developmental and Various Stress Conditions in Triticum aestivum L. Int. J. Mol. Sci. 2021, 22, 7396. [Google Scholar] [CrossRef]
  9. Jiang, M.; Chen, H.; Liu, J.; Du, Q.; Lu, S.; Liu, C. Genome-wide identification and functional characterization of natural antisense transcripts in Salvia miltiorrhiza. Sci. Rep. 2021, 11, 1–14. [Google Scholar] [CrossRef]
  10. Tong, T.; Fang, Y.-X.; Zhang, Z.; Zheng, J.; Zhang, X.; Li, J.; Niu, C.; Xue, D.; Zhang, X. Genome-wide identification and expression pattern analysis of the KCS gene family in barley. Plant Growth Regul. 2021, 93, 89–103. [Google Scholar] [CrossRef]
  11. Baruah, P.M.; Krishnatreya, D.B.; Bordoloi, K.S.; Gill, S.S.; Agarwala, N. Genome wide identification and characterization of abiotic stress responsive lncRNAs in Capsicum annuum. Plant Physiol. Biochem. 2021, 162, 221–236. [Google Scholar] [CrossRef]
  12. Kesawat, M.S.; Kherawat, B.S.; Singh, A.; Dey, P.; Kabi, M.; Debnath, D.; Saha, D.; Khandual, A.; Rout, S.; Manorama, C.; et al. Genome-Wide Identification and Characterization of the Brassinazole-resistant (BZR) Gene Family and Its Expression in the Various Developmental Stage and Stress Conditions in Wheat (Triticum aestivum L.). Int. J. Mol. Sci. 2021, 22, 8743. [Google Scholar] [CrossRef]
  13. Wang, M.; Chen, B.; Zhou, W.; Xie, L.; Wang, L.; Zhang, Y.; Zhang, Q. Genome-wide identification and expression analysis of the AT-hook Motif Nuclear Localized gene family in soybean. BMC Genom. 2021, 22, 1–26. [Google Scholar] [CrossRef]
  14. Mäser, P.; Thomine, S.; Schroeder, J.I.; Ward, J.M.; Hirschi, K.; Sze, H.; Talke, I.N.; Amtmann, A.; Maathuis, F.J.; Sanders, D.; et al. Phylogenetic relationships within cation transporter families of Arabidopsis. Plant Physiol. 2001, 126, 1646–1667. [Google Scholar] [CrossRef] [Green Version]
  15. Véry, A.-A.; Sentenac, H. Molecular mechanisms and regulation of K+ transport in higher plants. Annu. Rev. Plant Biol. 2003, 54, 575–603. [Google Scholar] [CrossRef]
  16. Lebaudy, A.; Véry, A.-A.; Sentenac, H. K+ channel activity in plants: Genes, regulations and functions. FEBS Lett. 2007, 581, 2357–2366. [Google Scholar] [CrossRef]
  17. Saxena, K.B.; Kumar, R.V.; Rao, P.V. Pigeonpea Nutrition and Its Improvement. J. Crops Prod. 2002, 5, 227–260. [Google Scholar] [CrossRef] [Green Version]
  18. Bohra, A.; Saxena, K.B.; Varshney, R.K.; Saxena, R.K. Genomics-assisted breeding for pigeonpea improvement. Theor. Appl. Genet. 2020, 133, 1721–1737. [Google Scholar] [CrossRef]
  19. Wang, M.; Zheng, Q.; Shen, Q.; Guo, S. The critical role of potassium in plant stress response. Int. J. Mol. Sci. 2013, 14, 7370–7390. [Google Scholar] [CrossRef] [Green Version]
  20. Gomez-Porras, J.L.; Riaño-Pachón, D.M.; Benito, B.; Haro, R.; Sklodowski, K.; Rodríguez-Navarro, A.; Dreyer, I. Phylogenetic Analysis of K+ Transporters in Bryophytes, Lycophytes, and Flowering Plants Indicates a Specialization of Vascular Plants. Front. Plant Sci. 2012, 3, 167. [Google Scholar] [CrossRef] [Green Version]
  21. Munro, A.W.; Ritchie, G.Y.; Lamb, A.J.; Douglas, R.M.; Booth, I.R. The cloning and DNA sequence of the gene for the glutathione-regulated potassium-efflux system KefC of Escherichia coli. Mol. Microbiol. 1991, 5, 607–616. [Google Scholar] [CrossRef]
  22. Pilot, G.; Gaymard, F.; Mouline, K.; Chérel, I.; Sentenac, H. Regulated expression of Arabidopsis shaker K+ channel genes involved in K+ uptake and distribution in the plant. Plant Mol. Biol. 2003, 51, 773–787. [Google Scholar] [CrossRef]
  23. Hedrich, R. Ion channels in plants. Physiol. Rev. 2012, 92, 1777–1811. [Google Scholar] [CrossRef]
  24. Moshelion, M.; Becker, D.; Czempinski, K.; Mueller-Roeber, B.; Attali, B.; Hedrich, R.; Moran, N. Diurnal and circadian regulation of putative potassium channels in a leaf moving organ. Plant Physiol. 2002, 128, 634–642. [Google Scholar] [CrossRef] [PubMed]
  25. Li, W.; Liu, B.; Yu, L.; Feng, D.; Wang, H.; Wang, J. Phylogenetic analysis, structural evolution and functional divergence of the 12-oxo-phytodienoate acid reductase gene family in plants. BMC Evol. Biol. 2009, 9, 90. [Google Scholar] [CrossRef] [Green Version]
  26. Li, W.Y.; Wang, X.; Li, R.; Li, W.Q.; Chen, K.M. Genome-wide analysis of the NADK gene family in plants. PLoS ONE 2014, 9, e101051. [Google Scholar] [CrossRef] [Green Version]
  27. Jones, D.M.; Vandepoele, K. Identification and evolution of gene regulatory networks: Insights from comparative studies in plants. Curr. Opin. Plant Biol. 2020, 54, 42–48. [Google Scholar] [CrossRef] [PubMed]
  28. Azeem, F.; Hussain, M.; Hussain, S.; Zubair, M.; Nadeem, H.; Ali, M.A.; Afzal, M.; Siddique, M.H. Genome-wide analysis and expression profiling of potassium transport related genes in Solanum tuberosum. Pak. J. Agric. Sci. 2021, 58, 81–94. [Google Scholar]
  29. Azeem, F.; Ahmad, B.; Atif, R.M.; Ali, M.A.; Nadeem, H.; Hussain, S.; Manzoor, H.; Azeem, M.; Afzal, M. Genome-Wide Analysis of Potassium Transport-Related Genes in Chickpea (Cicer arietinum L.) and Their Role in Abiotic Stress Responses. Plant Mol. Biol. Rep. 2018, 36, 451–468. [Google Scholar] [CrossRef]
  30. Lim, C.W.; Kim, S.H.; Choi, H.W.; Luan, S.; Lee, S.C. The Shaker type potassium channel, GORK, regulates abscisic acid signaling in arabidopsis. Plant Pathol. J. 2019, 35, 684–691. [Google Scholar] [CrossRef]
  31. Dreyer, I.; Uozumi, N. Potassium channels in plant cells. FEBS J. 2011, 278, 4293–4303. [Google Scholar] [CrossRef] [PubMed]
  32. Wang, F.; Chen, Z.-H.; Liu, X.; Colmer, T.D.; Shabala, L.; Salih, A.; Zhou, M.; Shabala, S. Revealing the roles of GORK channels and NADPH oxidase in acclimation to hypoxia in Arabidopsis. J. Exp. Bot. 2016, 68, 3191–3204. [Google Scholar] [CrossRef] [PubMed] [Green Version]
  33. Ijaz, U.; Pervaiz, T.; Ahmed, T.; Seemab, R.; Shahid, M.; Noman, M.; Nadeem, M.; Azeem, F. Plant Cis-regulatory elements: Methods of identification and applications. Asian J. Agric. Biol. 2020, 8, 207–222. [Google Scholar] [CrossRef]
  34. Ward, J.M.; Mäser, P.; Schroeder, J.I. Plant ion channels: Gene families, physiology, and functional genomics analyses. Annu. Rev. Physiol. 2009, 71, 59–82. [Google Scholar] [CrossRef] [PubMed] [Green Version]
  35. Cuéllar, T.; Pascaud, F.; Verdeil, J.-L.; Torregrosa, L.; Adam-Blondon, A.-F.; Thibaud, J.-B.; Sentenac, H.; Gaillard, I. A grapevine Shaker inward K(+) channel activated by the calcineurin B-like calcium sensor 1-protein kinase CIPK23 network is expressed in grape berries under drought stress conditions. Plant J. 2010, 61, 58–69. [Google Scholar] [CrossRef]
  36. Amrutha, R.N.; Sekhar, P.N.; Varshney, R.K.; Kishor, P.B.K. Genome-wide analysis and identification of genes related to potassium transporter families in rice (Oryza sativa L.). Plant Sci. 2007, 172, 708–721. [Google Scholar] [CrossRef] [Green Version]
  37. Hosy, E.; Vavasseur, A.; Mouline, K.; Dreyer, I.; Gaymard, F.; Poree, F.; Boucherez, J.; Lebaudy, A.; Bouchez, D.; Very, A.A.; et al. The Arabidopsis outward K+ channel GORK is involved in regulation of stomatal movements and plant transpiration. Proc. Natl. Acad. Sci. USA 2003, 100, 5549–5554. [Google Scholar] [CrossRef] [Green Version]
  38. Hamamoto, S.; Marui, J.; Matsuoka, K.; Higashi, K.; Igarashi, K.; Nakagawa, T.; Kuroda, T.; Mori, Y.; Murata, Y.; Nakanishi, Y.; et al. Characterization of a tobacco TPK-type K+ channel as a novel tonoplast K+ channel using yeast tonoplasts. J. Biol. Chem. 2008, 283, 1911–1920. [Google Scholar] [CrossRef] [PubMed] [Green Version]
  39. Isayenkov, S.; Isner, J.-C.; Maathuis, F.J.M. Rice two-pore K+ channels are expressed in different types of vacuoles. Plant Cell 2011, 23, 756–768. [Google Scholar] [CrossRef] [PubMed] [Green Version]
  40. Davies, C.; Shin, R.; Liu, W.; Thomas, M.R.; Schachtman, D.P. Transporters expressed during grape berry (Vitis vinifera L.) development are associated with an increase in berry size and berry potassium accumulation. J. Exp. Bot. 2006, 57, 3209–3216. [Google Scholar] [CrossRef] [PubMed] [Green Version]
  41. Desbrosses, G.; Kopka, C.; Ott, T.; Udvardi, M.K. Lotus japonicus LjKUP is induced late during nodule development and encodes a potassium transporter of the plasma membrane. Mol. Plant-Microbe Interact. 2004, 17, 789–797. [Google Scholar] [CrossRef] [Green Version]
  42. Wang, Y.-H.; Garvin, D.F.; Kochian, L.V. Rapid induction of regulatory and transporter genes in response to phosphorus, potassium, and iron deficiencies in tomato roots. Evidence for cross talk and root/rhizosphere-mediated signals. Plant Physiol. 2002, 130, 1361–1370. [Google Scholar] [CrossRef] [Green Version]
  43. Su, H.; Golldack, D.; Zhao, C.; Bohnert, H.J. The expression of HAK-type K(+) transporters is regulated in response to salinity stress in common ice plant. Plant Physiol. 2002, 129, 1482–1493. [Google Scholar] [CrossRef] [PubMed] [Green Version]
  44. Senn, M.E.; Rubio, F.; Bañuelos, M.A.; Rodríguez-Navarro, A. Comparative Functional Features of Plant Potassium HvHAK1 and HvHAK2 Transporters. J. Biol. Chem. 2001, 276, 44563–44569. [Google Scholar] [CrossRef] [PubMed] [Green Version]
  45. Garciadeblas, B.; Benito, B.; Rodríguez-Navarro, A. Molecular cloning and functional expression in bacteria of the potassium transporters CnHAK1 and CnHAK2 of the seagrass Cymodocea nodosa. Plant Mol. Biol. 2002, 50, 623–633. [Google Scholar] [CrossRef] [PubMed]
  46. Bañuelos, M.A.; Garciadeblas, B.; Cubero, B.; Rodríguez-Navarro, A. Inventory and functional characterization of the HAK potassium transporters of rice. Plant Physiol. 2002, 130, 784–795. [Google Scholar] [CrossRef] [Green Version]
  47. Rubio, F.; Guillermo, S.M.; Rodríguez-Navarro, A. Cloning of Arabidopsis and barley cDNAs encoding HAK potassium transporters in root and shoot cells. Physiol. Plant. 2000, 109, 34–43. [Google Scholar] [CrossRef]
  48. Yang, T.; Zhang, S.; Hu, Y.; Wu, F.; Hu, Q.; Chen, G.; Cai, J.; Wu, T.; Moran, N.; Yu, L.; et al. The role of a potassium transporter oshak5 in potassium acquisition and transport from roots to shoots in rice at low potassium supply levels. Plant Physiol. 2014, 166, 945–959. [Google Scholar] [CrossRef] [Green Version]
  49. Rubio, F.; Alemán, F.; Nieves-Cordones, M.; Martínez, V. Studies on Arabidopsis athak5, atakt1 double mutants disclose the range of concentrations at which AtHAK5, AtAKT1 and unknown systems mediate K+ uptake. Physiol. Plant. 2010, 139, 220–228. [Google Scholar] [CrossRef]
  50. Nieves-Cordones, M.; Martínez, V.; Benito, B.; Rubio, F. Comparison between Arabidopsis and Rice for Main Pathways of K+ and Na+ Uptake by Roots. Front. Plant Sci. 2016, 7, 992. [Google Scholar] [CrossRef] [Green Version]
  51. Platten, J.D.; Cotsaftis, O.; Berthomieu, P.; Bohnert, H.; Davenport, R.J.; Fairbairn, D.J.; Horie, T.; Leigh, R.A.; Lin, H.-X.; Luan, S.; et al. Nomenclature for HKT transporters, key determinants of plant salinity tolerance. Trends Plant Sci. 2006, 11, 372–374. [Google Scholar] [CrossRef]
  52. Awana, M.; Jain, N.; Samota, M.K.; Rani, K.; Kumar, A.; Ray, M.; Gaikwad, K.; Praveen, S.; Singh, N.K.; Singh, A. Protein and gene integration analysis through proteome and transcriptome brings new insight into salt stress tolerance in pigeonpea (Cajanus cajan L.). Int. J. Biol. Macromol. 2020, 164, 3589–3602. [Google Scholar] [CrossRef] [PubMed]
  53. Tayyab; Azeem, M.; Qasim, M.; Ahmed, N.; Ahmad, R. Salt stress responses of pigeon pea (Cajanus cajan) on growth, yield and some biochemical attributes. Pak. J. Bot. 2016, 48, 1353–1360. [Google Scholar]
  54. Kosová, K.; Vítámvás, P.; Urban, M.O.; Prášil, I.T.; Renaut, J. Plant abiotic stress proteomics: The major factors determining alterations in cellular proteome. Front. Plant Sci. 2018, 9, 122. [Google Scholar] [CrossRef] [PubMed] [Green Version]
  55. Taie, H.A.A.; El-Yazal, M.A.S.; Ahmed, S.M.A.; Rady, M.M. Polyamines modulate growth, antioxidant activity, and genomic DNA in heavy metal–stressed wheat plant. Environ. Sci. Pollut. Res. 2019, 26, 22338–22350. [Google Scholar] [CrossRef]
  56. Jambunathan, N. Determination and detection of reactive oxygen species (ROS), lipid peroxidation, and electrolyte leakage in plants. Methods Mol. Biol. 2010, 639, 292–298. [Google Scholar] [CrossRef]
  57. Li, L.; Yi, H. Effect of sulfur dioxide on ROS production, gene expression and antioxidant enzyme activity in Arabidopsis plants. Plant Physiol. Biochem. 2012, 58, 46–53. [Google Scholar] [CrossRef] [PubMed]
  58. Nieves-Cordones, M.; Caballero, F.; Martínez, V.; Rubio, F. Disruption of the Arabidopsis thaliana inward-rectifier K+ channel AKT1 improves plant responses to water stress. Plant Cell Physiol. 2012, 53, 423–432. [Google Scholar] [CrossRef]
  59. Reintanz, B.; Szyroki, A.; Ivashikina, N.; Ache, P.; Godde, M.; Becker, D.; Palme, K.; Hedrich, R. AtKC1, a silent Arabidopsis potassium channel α-subunit modulates root hair K+ influx. Proc. Natl. Acad. Sci. USA 2002, 99, 4079–4084. [Google Scholar] [CrossRef] [Green Version]
  60. Rubio, F.; Gassmann, W.; Schroeder, J.I. Sodium-Driven Potassium Uptake by the Plant Potassium Transporter HKT1 and Mutations Conferring Salt Tolerance. Science 1995, 270, 1660–1663. [Google Scholar] [CrossRef] [PubMed]
  61. Véry, A.-A.; Nieves-Cordones, M.; Daly, M.; Khan, I.; Fizames, C.; Sentenac, H. Molecular biology of K+ transport across the plant cell membrane: What do we learn from comparison between plant species? J. Plant Physiol. 2014, 171, 748–769. [Google Scholar] [CrossRef] [PubMed]
  62. Kumar, S.; Stecher, G.; Tamura, K. MEGA7: Molecular Evolutionary Genetics Analysis Version 7.0 for Bigger Datasets. Mol. Biol. Evol. 2016, 33, 1870–1874. [Google Scholar] [CrossRef] [Green Version]
  63. Beyer, W.F.; Fridovich, I. Assaying for superoxide dismutase activity: Some large consequences of minor changes in conditions. Anal. Biochem. 1987, 161, 559–566. [Google Scholar] [CrossRef]
  64. Chance, B.; Maehly, A.C. Assay of catalases and peroxidases. Methods Enzymol. 1955, 2, 764–775. [Google Scholar] [CrossRef]
  65. Kar, M.; Mishra, D. Catalase, Peroxidase, and Polyphenoloxidase Activities during Rice Leaf Senescence. Plant Physiol. 1976, 57, 315–319. [Google Scholar] [CrossRef] [Green Version]
  66. Bradford, M.M. A rapid and sensitive method for the quantitation of microgram quantities of protein utilizing the principle of protein-dye binding. Anal. Biochem. 1976, 72, 248–254. [Google Scholar] [CrossRef]
  67. Sinha, P.; Singh, V.K.; Suryanarayana, V.; Krishnamurthy, L.; Saxena, R.K.; Varshney, R.K. Evaluation and validation of housekeeping genes as reference for gene expression studies in pigeonpea (Cajanus cajan) under drought stress conditions. PLoS ONE 2015, 10, e0122847. [Google Scholar] [CrossRef] [PubMed]
Figure 1. Conserved motif analysis. Sequence logo showing the conserved amino acids of channel and transporter protein sequences from C. cajan, A. thaliana, and O. sativa.
Plants 10 02238 g001
Figure 2. Gene structure of K+ transporters and channels of C. cajan: yellow boxes show the exons, black lines represent the introns, and blue boxes show untranslated regions (UTRs).
Plants 10 02238 g002
Figure 3. Chromosomal mapping of K+ transport system-related genes in C. cajan and gene duplication. Segmental duplication is illustrated by red color and tandem duplication is illustrated by multiple colors.
Plants 10 02238 g003
Figure 4. Effect of environmental stresses on different physiochemical parameters of C. cajan evaluated by triplicated pot experiments; the average value was used each reading. The standard error is indicated with error bars on each column. * Indicates the significant (p < 0.05), while ** indicates the highly significant (p < 0.001) differences between environmental stresses and the control for physiochemical parameters.
Plants 10 02238 g004
Figure 5. In silico gene expression analysis of potassium transporting genes: (A) expression in flower-bud of two cultivars of C. cajan, cultivar-I: AKPR303, and cultivar-II: AKCMS11. Red color represents the presence of a gene, while blue color represents an absence of the gene. (B) Differential expression from leaf of C. cajan against heat stress response at two time points (30 min and 3 h). (C) Differential expression from root of salt-tolerant and salt-susceptible cultivars of C. cajan against salt stress response. Red color represents the upregulation of genes while blue color represents the downregulation of genes.
Plants 10 02238 g005
Figure 6. Schematic representation of protein–protein interaction (PPI) networks between potassium transporters and channels from C. cajan. Nodes of different colors indicate different proteins.
Plants 10 02238 g006
Figure 7. Relative qRT-PCR assay of K+ channel/transporter genes under abiotic (heat, drought, and salt) stresses. The experiment was triplicated to obtain an unbiased average value. The default expression value for each gene was one in non-treated plants. Standard error has been indicated as bars on each column. * Indicates the significant (p < 0.05), while ** indicates the highly significant (p < 0.001) differences between environmental stresses and the control for physiochemical parameters.
Plants 10 02238 g007
Table 1. Nomenclature and properties of K+ channels and transporters in C. cajan.
Sr.#Gene Name* Protein IDTM DomainsDomainsProtein LengthChromosome NumberExonsIsoelectric PointMolecular Weight (kDa)
1CcHAK1XP 02021342512K_trans784388.5687.6626
2CcHAK2XP 02021286212K_trans8043108.8389.3791
3CcHAK3XP 02021435512PLN00148784498.7987.4835
4CcHAK4XP 0291272809K_trans7065108.6978.7490
5CcHAK5XP 02021807913K_trans778688.4586.9579
6CcHAK6XP 02022043014K_trans792897.6388.4431
7CcHAK7XP 02022240113PLN001518419106.9393.4439
8CcHAK8XP 02022225713PLN001518449105.9793.9803
9CcHAK9XP 02022260012K_trans713988.9379.5610
10CcHAK10XP 02022337410K_trans7901099.3088.1669
11CcHAK11XP 02022558412K_trans7731188.7986.3152
12CcHAK12XP 02022610212PLN0015184111108.5093.5142
13CcHAK13XP 02913010514K_trans/790Unknown88.1388.5552
14CcHAK14XP 02020768713PLN00149773Unknown87.2986.9488
15CcHAK15XP 02023213712PLN00149781Unknown87.0987.4695
16CcHAK16XP 02023488311K_trans760Unknown96.2484.7841
17CcHAK17XP 02023648112K_trans776Unknown96.8986.3213
18CcHKT 1XP 02022042210TrkG527849.3559.3970
19CcHKT2XP 0202220389N/A507839.4357.4761
20CcKEA1XP 02022726112Na_H_Exchanger6382217.2369.2591
21CcKEA2XP 02021552011Na_H_Exchanger5865215.9063.0490
22CcKEA3XP 02021858810SMC_N- PRK0356211937214.97128.0696
23CcKEA4XP 02022060610Na_H_Exchanger5748206.3362.3534
24CcKEA5XP 0202255480PRK0356281511205.7588.8492
25CcKEA6XP 02023314410PRK03562 -1200Unknown214.98129.4016
26CcSKORXP 0202025675ANK-Ank_2837Unknown136.6895.9104
27CcAKT1.2XP 0202054535ANK-Ank_2879Unknown126.0299.3995
28CcKAT1.1XP 0202084185Ank_2717Unknown117.0283.3877
29CcGORKXP 0202156365ANK/Ank_28085118.7192.3245
30Cc AKT2XP 0202208775ANK/Ank_28258116.9694.5856
31CcKAT3XP 0202255775KHA/Ank_262211137.0271.5766
32CcAKT1.3XP 0202279005N/A8642136.5097.5863
33CcAKT1.1XP 0202316295ANK/Ank_2878Unknown126.7787.5007
34CcKAT1.2XP 0291252344Ank_2759Unknown118.5699.6863
35CcTPK- KCO1XP 0202051065Dockerin_like/
Ion_trans_2
359228.7940.0668
36CcTPK- KCO2XP 0202226845Ion_trans_2-EFh_CREC348245.9138.8132
37CcTPK- KCO3XP 0291269565Ion_trans324329.3935.9705
38CcTPK- KCO4XP 0202329595Ion_trans423Unknown38.7246.8026
39CcTPK- KCO5XP 0202307255Ion_trans_2340Unknown35.4038.1138
* Proteins are ordered and grouped according to “Domain” category. Subcellular localization (reliability) was observed in plasma membrane for all proteins.
Table 2. Promoter analysis of selected K+ channels and transporters.
Regulatory ElementCore SequenceCcAKT1.1CcAKT1.2CcAKT1.3CcAKT2CcKAT1.1CcKAT1.2CcKAT3CcGORKCcHKT1CcHKT2Function
ABRECACGTG1 1 11 Response to Abscisic acid signals
ACGTG1 21 33 1
MYBTAACCA 2424222 Response to drought stress and ABA signals
CAACCA 111 21221
MYCCATTTG 222323323Response to drought, ABA, and cold signals
W-boxTTGACC 1 11 Response to SA, GA, and pathogenesis signals
GT-1 motifGGTTAA11134111 Light responsive element
G-boxCACGTG1 3 331 Involved in light response
GARETCTGTTG 1 Gibberellin-responsive element
MBSCAACTG 12 Involved in drought-inducibility
AREAAACCA 1111 41 Essential for the anaerobic induction
TCA-elementCCATCTTTTT211 1 Response to salicylic acid
TC-rich repeatsATTCTCTAAC 22 2Involved in defense and stress response
Publisher’s Note: MDPI stays neutral with regard to jurisdictional claims in published maps and institutional affiliations.

