
Arnica montana Cell Culture Establishment, and Assessment of Its Cytotoxic, Antibacterial, α-Amylase Inhibitor, and Antioxidant In Vitro Bioactivities

 ,
,  , , , ,
  ,
, 
Abstract
:1. Introduction
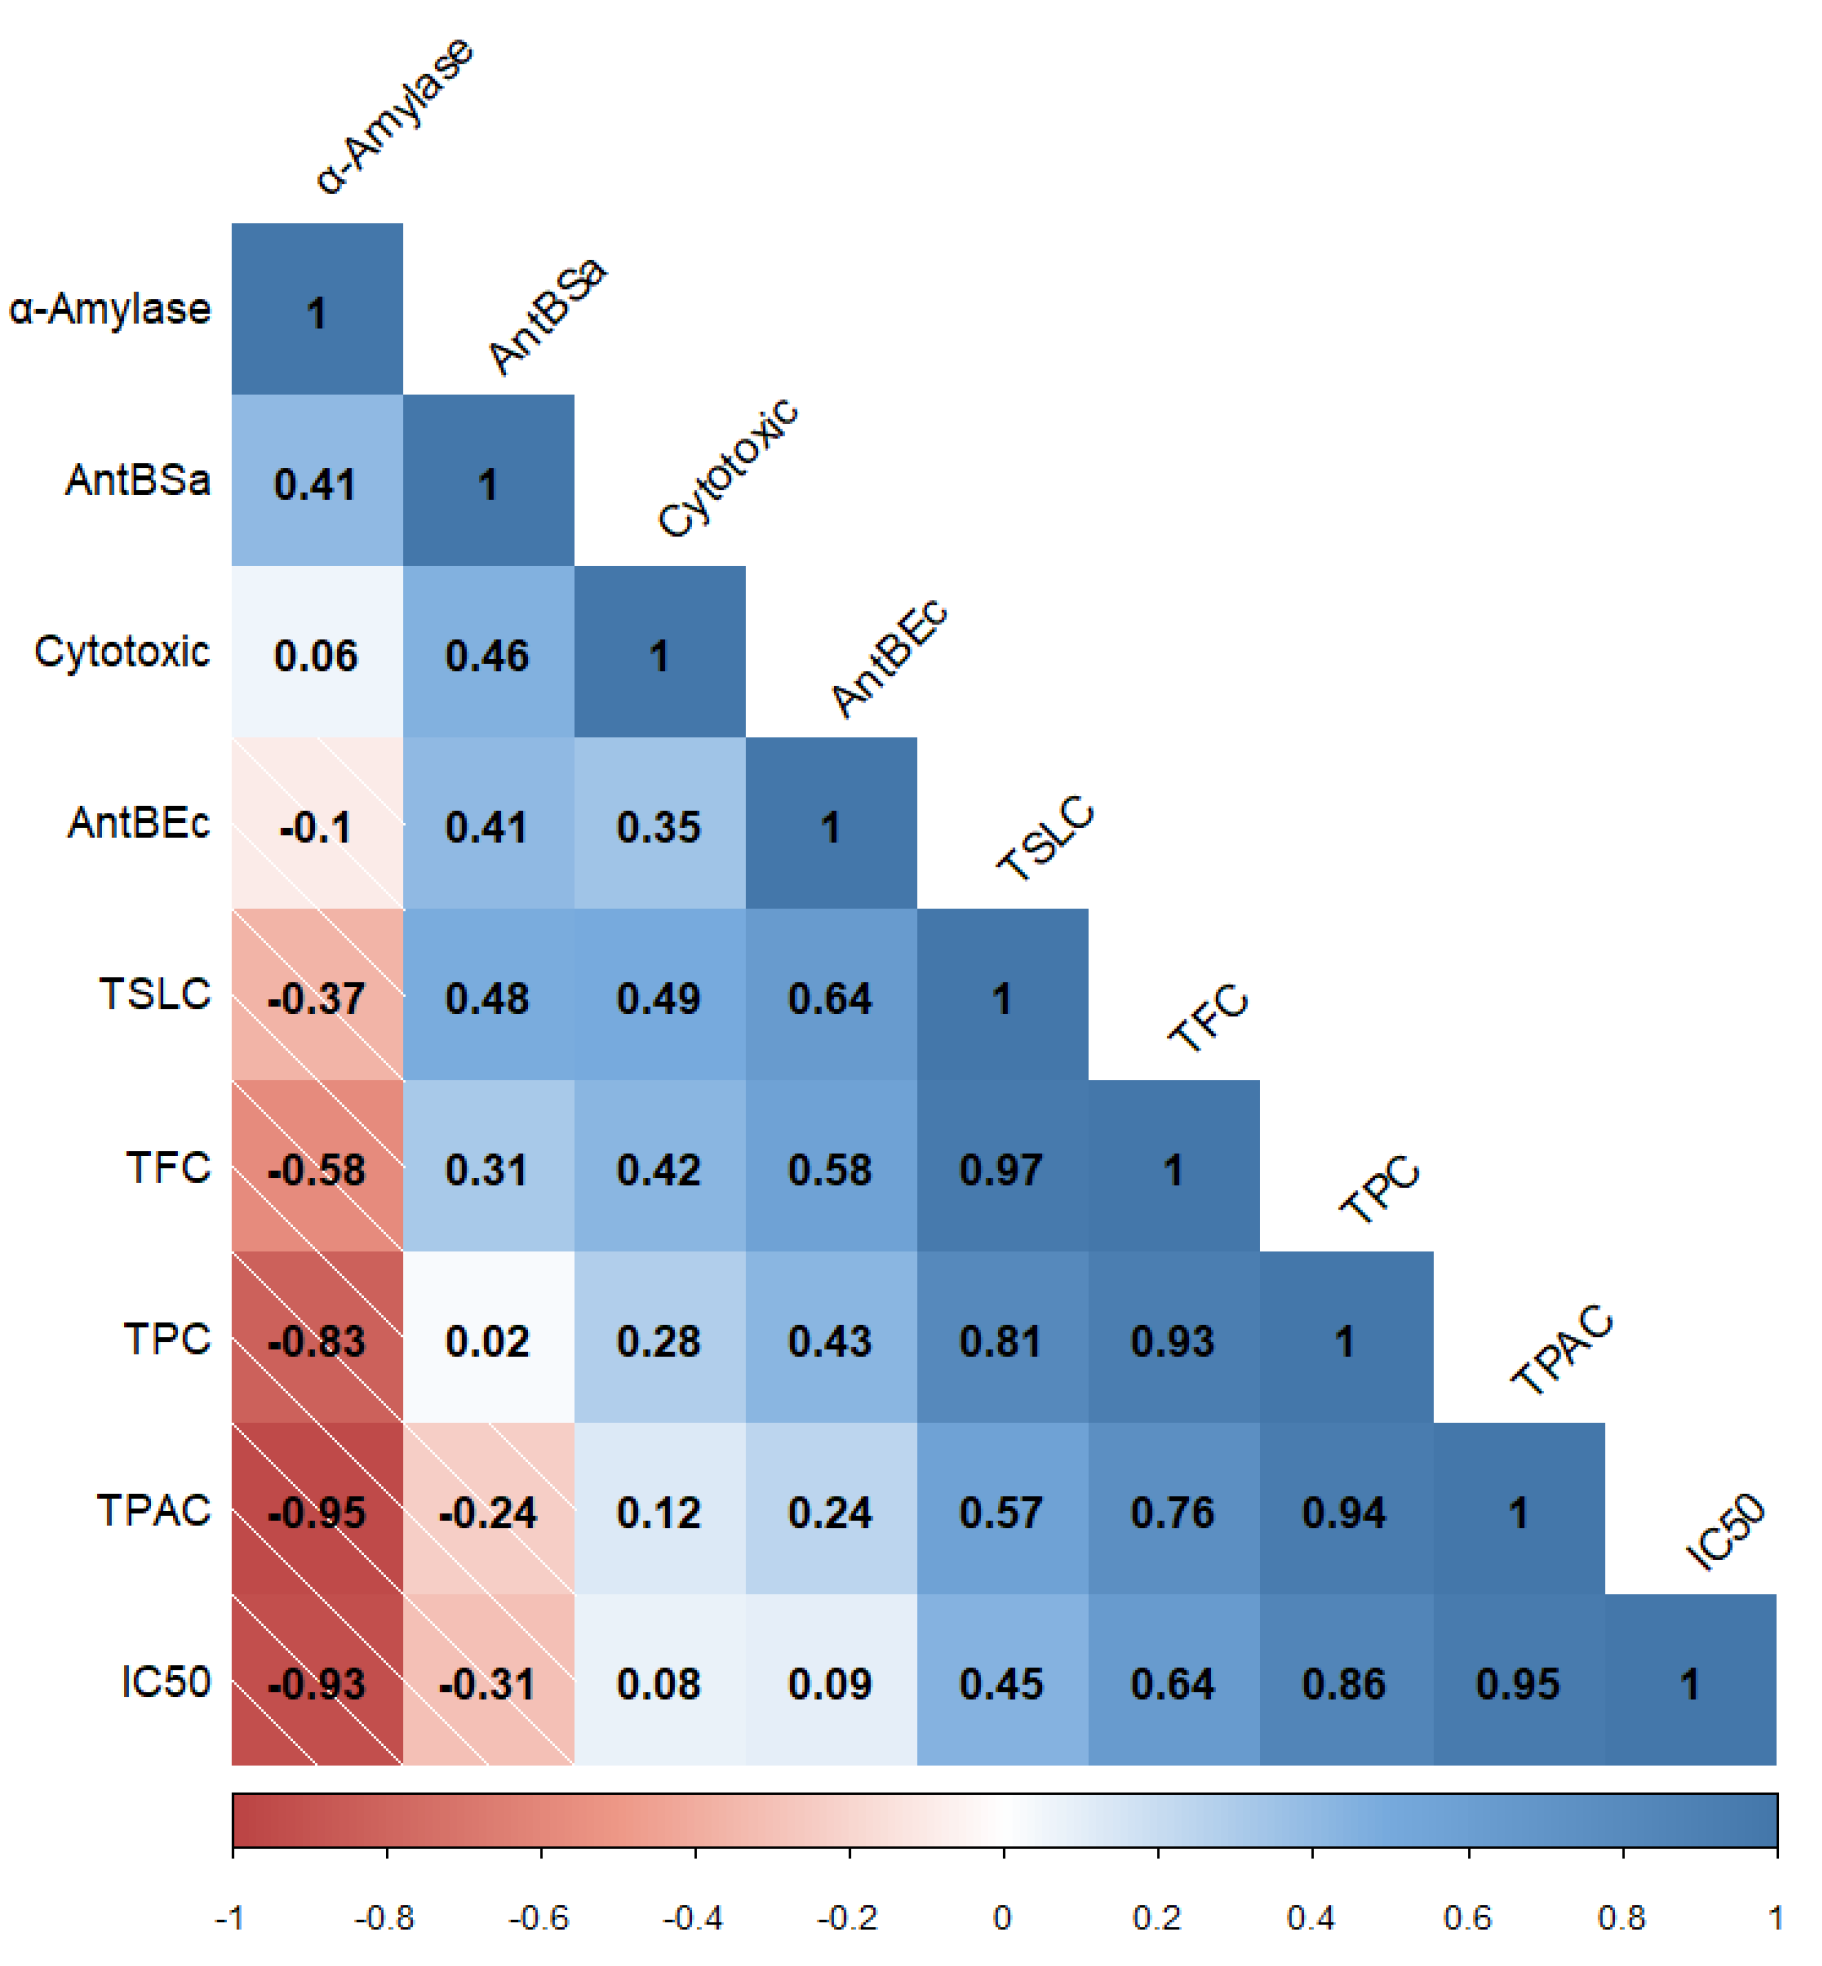
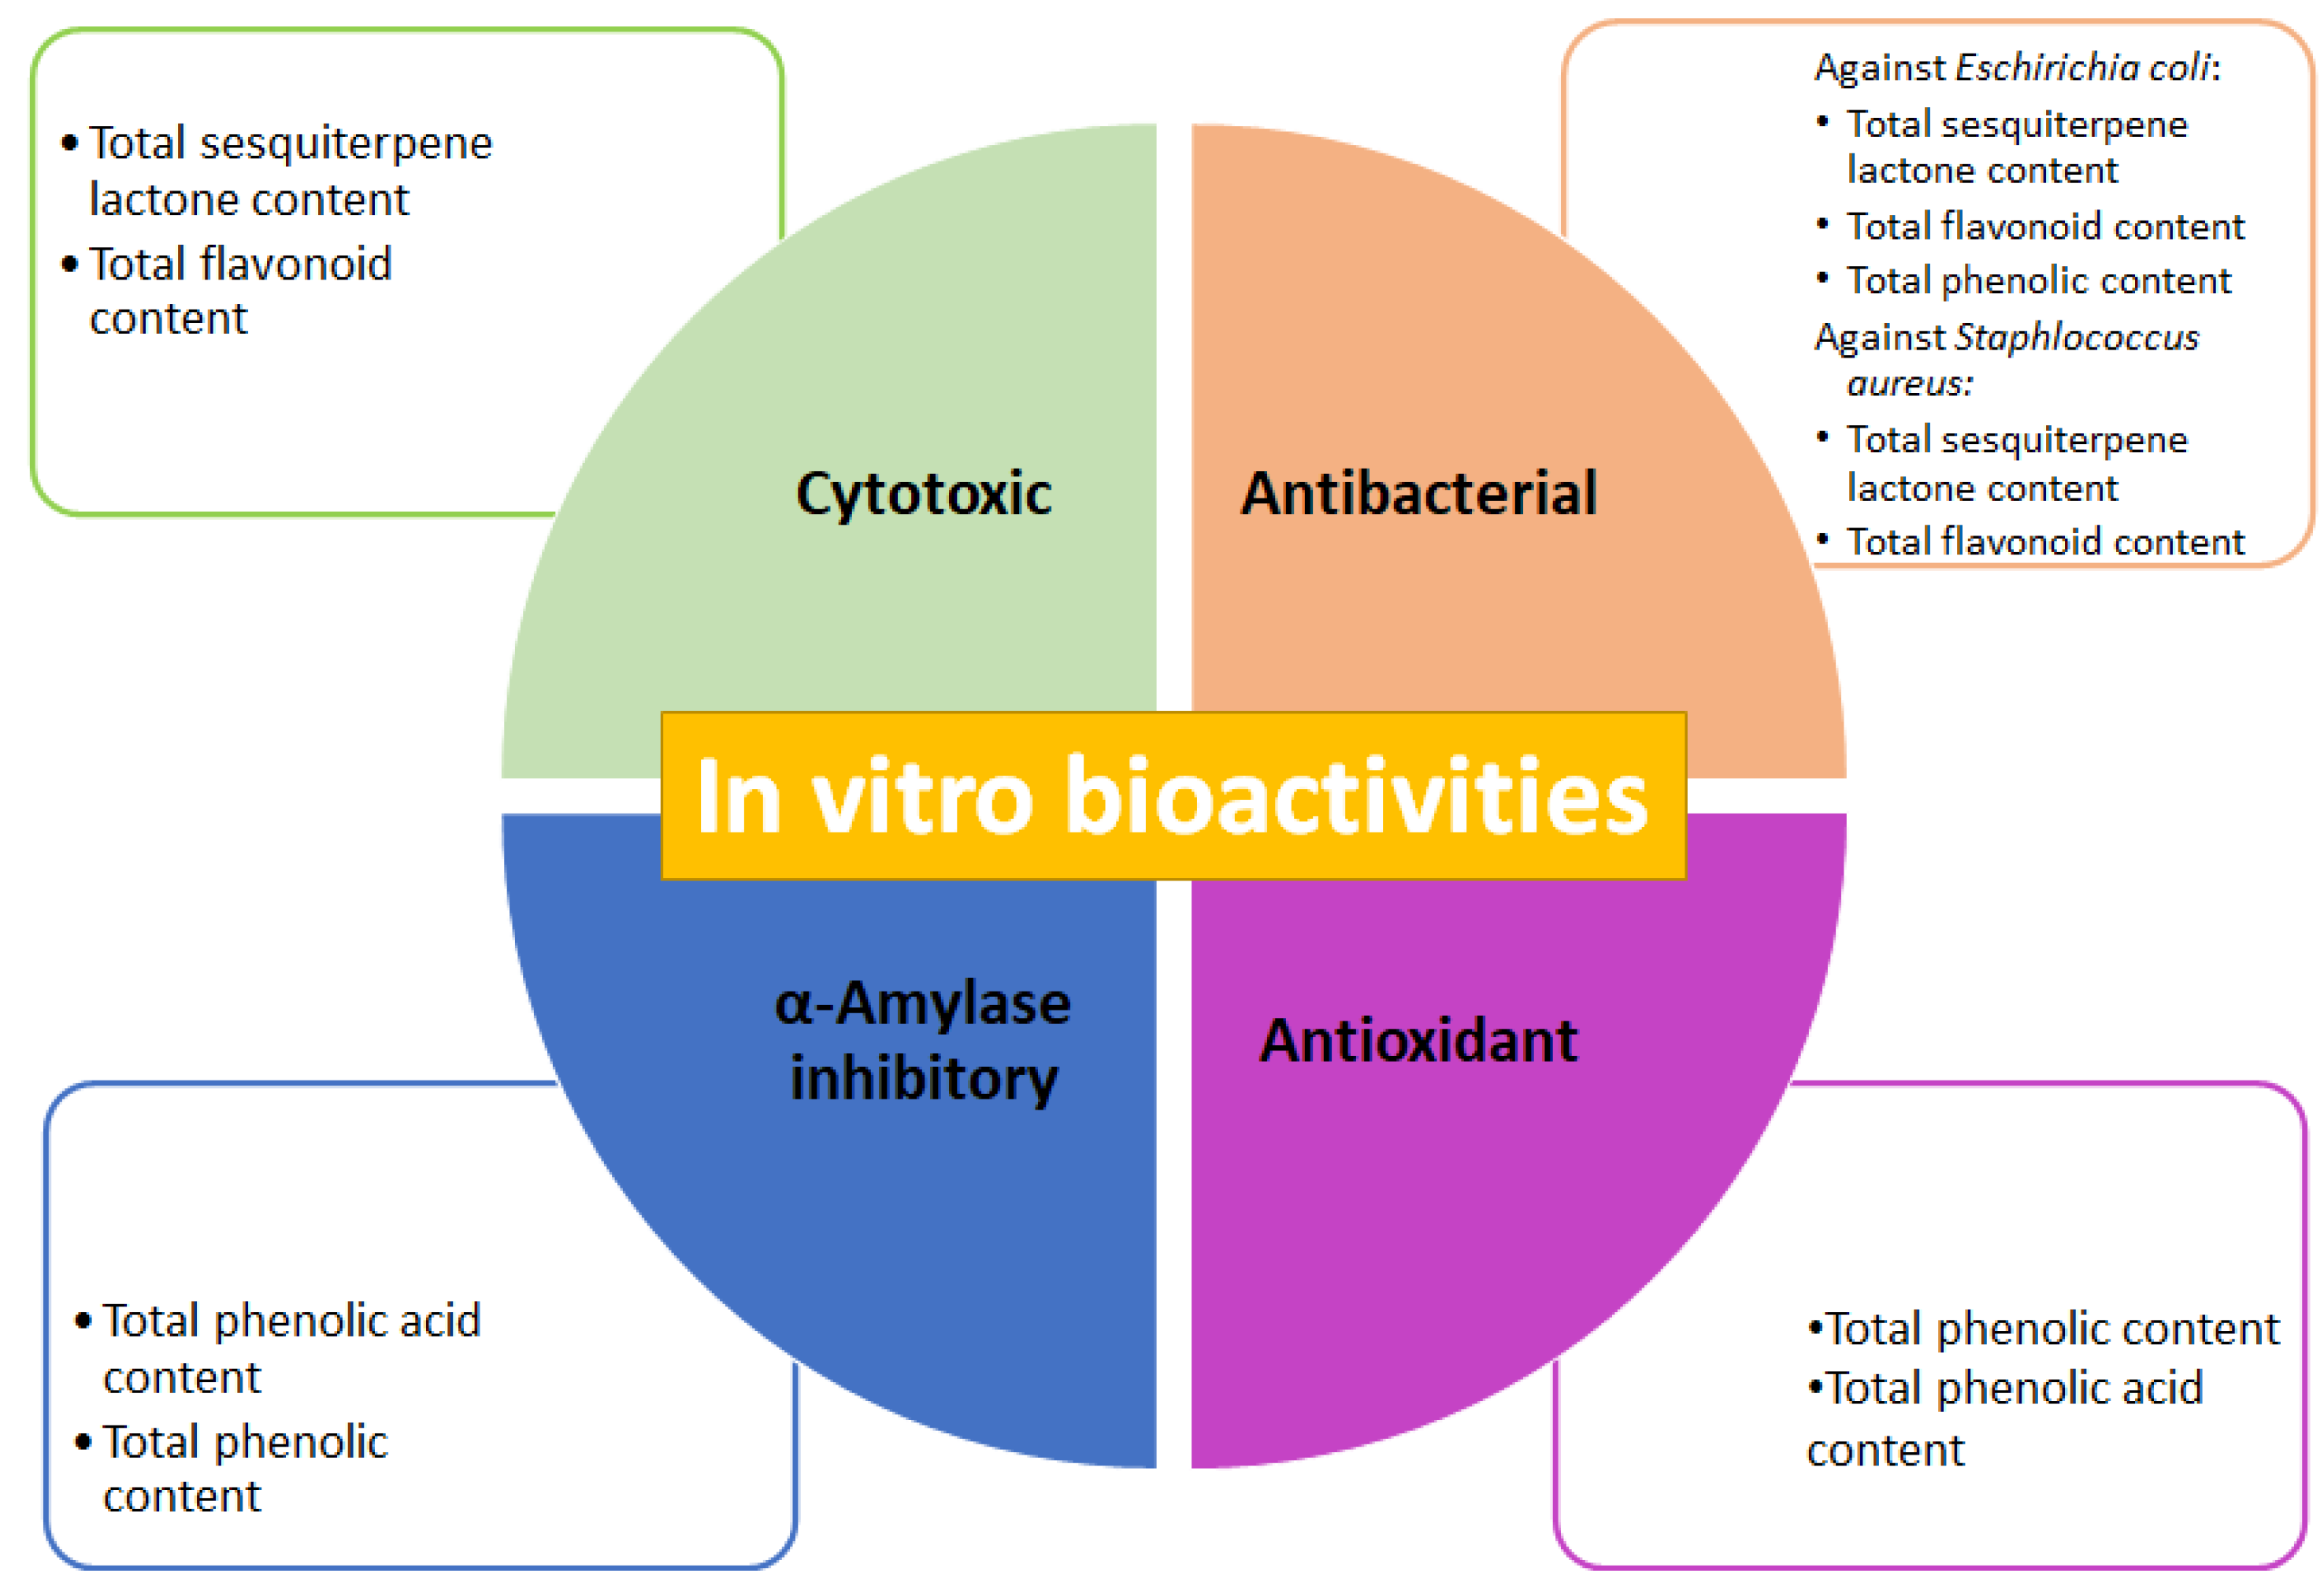
2. Results
2.1. Establishment of Arnica montana Suspension Cell Culture
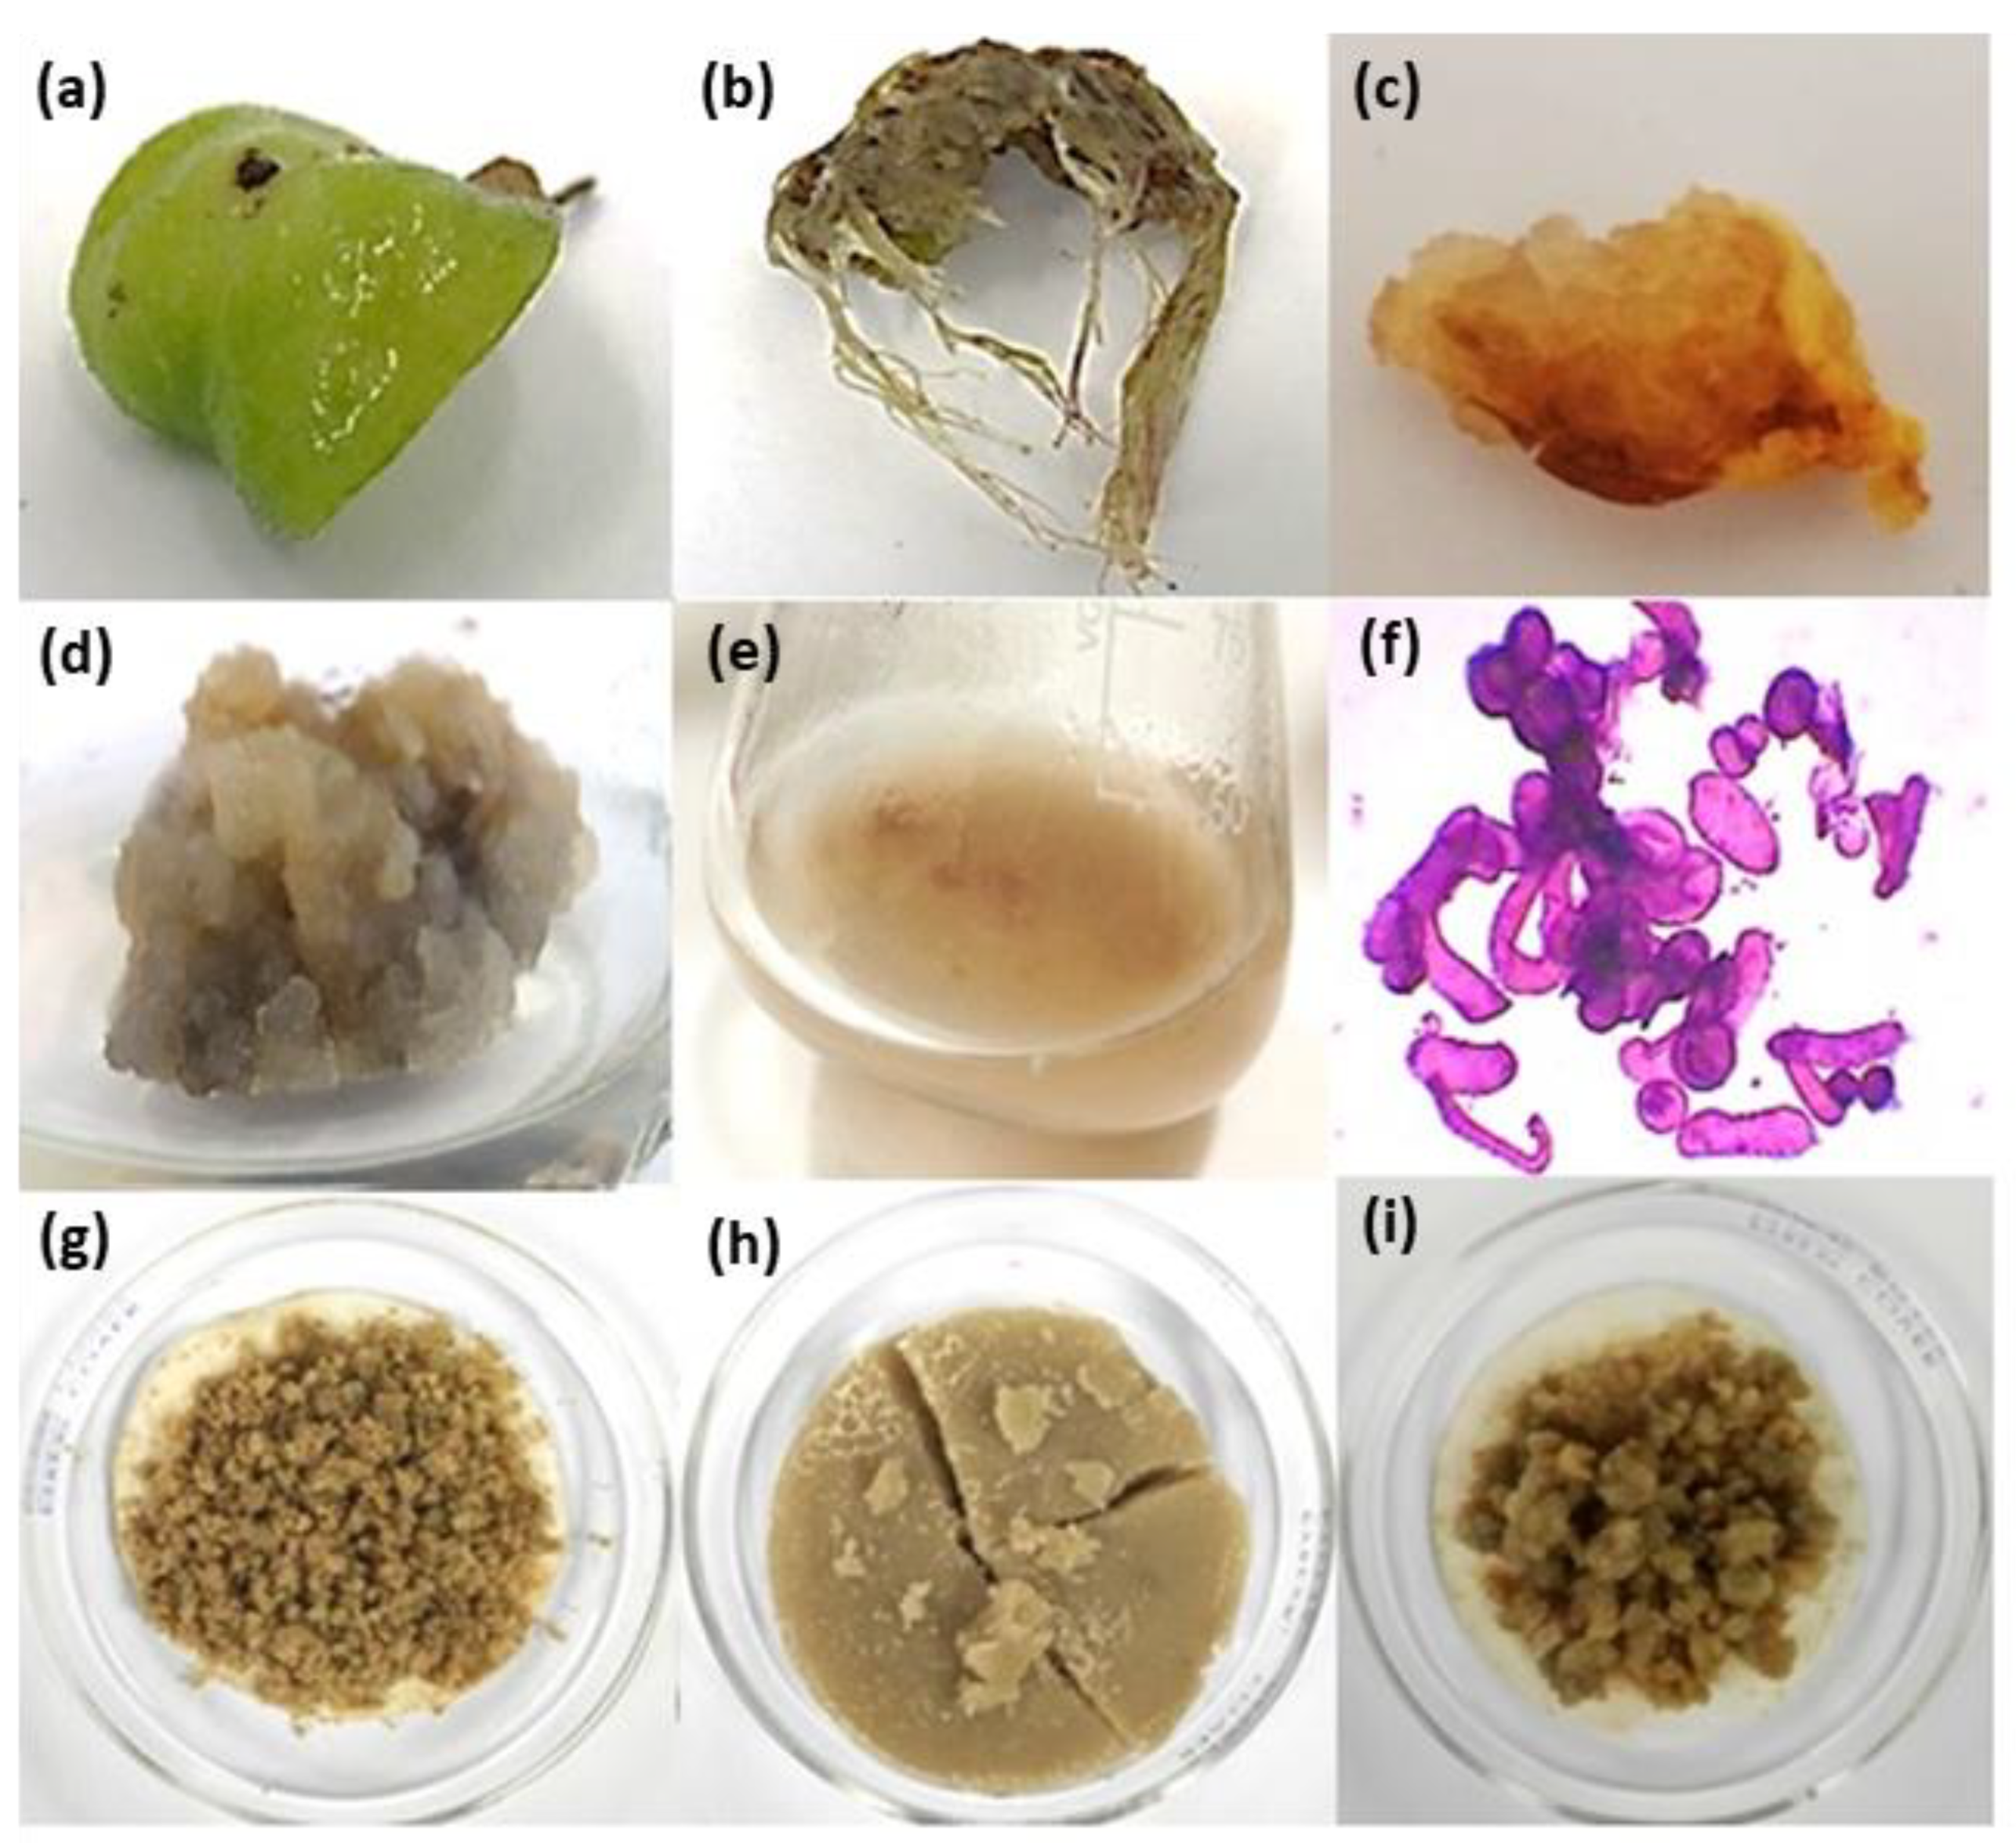
2.1.1. Plant Growth Regulators Induced Callus and Root Formation in Foliar Explants of A. montana
2.1.2. Growth and Secondary Metabolite Total Content Characterization of Cell Suspension Culture
2.2. Total Secondary Metabolite Contents in Fractions from Methanolic Extract
2.2.1. Cytotoxic and Antibacterial Activities of Fractions
2.2.2. Antioxidant Activity and α-Amylase Inhibition of Fractions
3. Discussion
4. Materials and Methods
4.1. Plant Material and Aseptic Culture
4.2. Culture Medium and Incubation Conditions
4.3. Effect of PGRs in Foliar Explants and Callus Proliferation
4.4. Cell Suspension Culture Establishment and Growth Kinetics
4.5. Analysis of Secondary Metabolites’ Production
4.5.1. Obtaining Methanolic Extract from Cell Biomass
4.5.2. Quantification of Phenolic Compounds and Sesquiterpene Lactones
4.5.3. Determination of Antioxidant Activity
4.6. Fractionation of Methanolic Extract and Phytochemical Analysis of Resulting Fractions
4.7. In Vitro Bioactivities of Fractions
4.7.1. Cytotoxicity Assay
4.7.2. Antibacterial Activity Assay of Fractions
4.7.3. α-Amylase Inhibitory Activity
4.8. Statistical Analysis
5. Conclusions
Author Contributions
Funding
Institutional Review Board Statement
Informed Consent Statement
Data Availability Statement
Acknowledgments
Conflicts of Interest
References
- Zheleva-Dimitrova, D.; Balabanova, V. Antioxidant and acetylcholinesterase inhibitory potential of Arnica montana cultivated in Bulgaria. Turk. J. Biol. 2012, 36, 732–737. [Google Scholar] [CrossRef]
- Sugier, D.; Sugier, P.; Gawlik-Dziki, U. Propagation and introduction of Arnica montana L. into cultivation: A step to reduce the pressure on endangered and high-valued medicinal plant species. Sci. World J. 2013, 2013, 1–11. [Google Scholar] [CrossRef] [PubMed]
- Kriplani, P.; Guarve, K.; Baghael, U.S. Arnica montana L.—A plant of healing: Review. J. Pharm. Pharmacol. 2017, 69, 925–945. [Google Scholar] [CrossRef] [PubMed] [Green Version]
- Petrova, M.; Zayova, E.; Vassilevska-Ivanova, R.; Vlahova, M. Biotechnological approaches for cultivation and enhancement of secondary metabolites in Arnica montana L. Acta Physiol. Plant. 2012, 34, 1597–1606. [Google Scholar] [CrossRef]
- Lou, Z.; Wang, H.; Zhu, S.; Ma, C.; Wang, Z. Antibacterial activity and mechanism of action of chlorogenic acid. J. Food Sci. 2011, 76, 398–403. [Google Scholar] [CrossRef] [PubMed]
- Lima, V.N.; Oliveira-Tintino, C.D.; Santos, E.S.; Morais, L.P.; Tintino, S.R.; Freitas, T.S.; Geraldo, Y.S.; Pereira, R.L.; Cruz, R.P.; Menezes, I.R.; et al. Antimicrobial and enhancement of the antibacterial activity by phenolic compounds: Gallic acid, caffeic acid and pyrogallol. Microb. Pathog. 2016, 99, 56–61. [Google Scholar] [CrossRef] [PubMed]
- Borges, A.; Ferreira, C.; Saavedra, M.J.; Simões, M. Antibacterial activity and mode of action of ferulic and gallic acids against pathogenic bacteria. Microb. Drug Resist. 2013, 19, 256–265. [Google Scholar] [CrossRef]
- Lou, Z.; Wang, H.; Rao, S.; Sun, J.; Ma, C.; Li, J. p-coumaric acid kills bacteria through dual damage mechanisms. Food Control 2012, 25, 550–554. [Google Scholar] [CrossRef]
- Cushinie, T.P.T.; Lamb, A.J. Antimicrobial activity of flavonoids. Int. J. Antimicrob. Agents 2005, 26, 343–356. [Google Scholar] [CrossRef]
- Sugier, P.; Sugier, D.; Sozinov, O.; Kołos, A.; Wołkowycki, D.; Plak, A.; Budnik, O. Characteristics of plant communities, populations feature, and edaphic conditions of Arnica montana L. populations in pine forest of mid-Eastern Europe. Acta Soc. Bot. Pol. 2019, 88, 1–13. [Google Scholar] [CrossRef]
- Dinman, S. Arnica. Plast. Surg. Nurs. 2007, 27, 52–53. [Google Scholar] [CrossRef]
- Todorova, M.; Trendafilova, A.; Vitkova, A.; Petrova, M.; Zayova, E.; Antonova, D. Developmental and environmental effects on sesquiterpene lactones in cultivated Arnica montana L. Chem. Biodivers. 2016, 13, 1–6. [Google Scholar] [CrossRef]
- Waizel-Bucay, J.; Cruz-Juárez, M.D.L. Arnica montana L., relevant European medicinal plant. Rev. Mex. Cien. For. 2014, 5, 98–109. [Google Scholar]
- Grigoriadou, K.; Krigas, N.; Sarropoulou, V.; Papanastasi, K.; Tsoktouridis, G.; Maloupa, E. In vitro propagation of medicinal and aromatic plants: The case of selected Greek species with conservation priority. In Vitro Cell. Dev. Biol. Plant. 2019, 55, 635–646. [Google Scholar] [CrossRef]
- Cardoso, J.C.; Oliveira, M.E.B.S.; Cardoso, F.C.I. Advances and challenges on the in vitro production of secondary metabolites from medicinal plants. Hortic. Bras. 2019, 37, 124–132. [Google Scholar] [CrossRef] [Green Version]
- Marchev, A.S.; Yordanova, Z.P.; Georgiev, M.I. Green (cell) factories for advanced production of plant secondary metabolites. Crit. Rev. Biotechnol. 2020, 40, 443–458. [Google Scholar] [CrossRef]
- Petrova, M.; Zayova, E.; Todorova, M.; Stanilova, M. Enhancement of Arnica montana in-vitro shoot multiplication and sesquiterpene lactones production using temporary immersion system. Int. J. Pharm. Sci. Res. 2014, 5, 5170–5176. [Google Scholar] [CrossRef]
- Surmackz-Magdziak, A.; Sugier, D. In vitro propagation of Arnica montana L.: An endangered herbal species of great importance to medicine. Acta Sci. Pol. Hortorum Cultus. 2012, 11, 127–140. [Google Scholar]
- Pljevljakušić, D.; Janković, T.; Jelačić, S.; Novaković, M.; Menković, N.; Beatović, D.; Dajić-Stevanović, Z. Morphological and chemical characterization of Arnica montana L. under different cultivation models. Ind. Crops Prod. 2014, 52, 233–244. [Google Scholar] [CrossRef]
- Petrova, M.; Zayova, E.; Yankova, E.; Baldzhiev, G. Plant regeneration from callus culture of Arnica montana. Rom. Biotech. Lett. 2011, 16, 92–97. [Google Scholar]
- Weremczuk-Jeżyna, I.; Kisiel, W.; Wysokińska, H. Thymol derivatives from hairy roots of Arnica montana. Plant Cell Rep. 2006, 25, 993–996. [Google Scholar] [CrossRef] [PubMed]
- Petrova, M.; Sayova, E.; Dincheva, I.; Badjakov, I.; Vlahova, M. Influence of carbon sources on growth and GC-MS based metabolite profiling of Arnica montana L. hairy roots. Turk. J. Biol. 2015, 39, 469–478. [Google Scholar] [CrossRef]
- Clauser, M.; Aiello, N.; Scartezzini, F.; Innocenti, G.; Dall´Acqua, S. Differences in the chemical composition of Arnica montana flowers from wild populations of North Italy. Nat. Prod. Commun. 2014, 9, 3–6. [Google Scholar] [CrossRef] [Green Version]
- Ganzera, M.; Egger, C.; Zidorn, C.; Stuppner, H. Quantitative analysis of flavonoids and phenolic acids in Arnica montana L. by micellar electrokinetic capillary chromatography. Anal. Chim. Acta. 2008, 614, 196–200. [Google Scholar] [CrossRef] [PubMed]
- Kowalczyk, T.; Wieczfinska, J.; Skała, E.; Śliwińki, T.; Sitarek, P. Transgenesis as a tool for the efficient production of selected secondary metabolites from plant in vitro cultures. Plants 2020, 9, 132. [Google Scholar] [CrossRef] [Green Version]
- Phillips, G.C.; Garda, M. Plant tissue culture media and practices: An overview. In Vitro Cell. Dev. Biol. Plant. 2019, 55, 242–257. [Google Scholar] [CrossRef]
- Oseni, O.M.; Pande, V.; Nailwal, T.K. A review of plant tissue culture, a technique for propagation and conservation of endangered plant species. Int. J. Curr. Microbiol. App. Sci. 2018, 7, 3778–3786. [Google Scholar] [CrossRef]
- Wybouw, B.; De Rybel, B. Cytokinin-A developing story. Trends Plant Sci. 2019, 24, 177–185. [Google Scholar] [CrossRef] [PubMed]
- Malarz, J.; Stojakowska, A.; Dohnal, B.; Kisiel, W. Helenalin acetate in in vitro propagated plants of Arnica montana. Planta Med. 1993, 59, 51–53. [Google Scholar] [CrossRef]
- Petrova, M.; Zayova, E.; Vlahova, M. Induction for callus cultures in Arnica montana L. Genet. Breed. 2008, 37, 37–44. [Google Scholar]
- Schaler, G.E.; Bishopp, A.; Kieber, J.J. The ying-yang of hormones: Cytokinin and auxin interactions in plant development. Plant Cell. 2015, 27, 44–63. [Google Scholar] [CrossRef] [Green Version]
- Ma, C.; Zhou, D.; Wang, H.; Han, D.; Wang, Y.; Yan, X. Elicitation of Jerusalem artichoke (Helianthus tuberosus L.) cell suspension culture for enhancement of inulin production and altered degree of polymerisation. J. Sci. Food Agric. 2017, 97, 88–94. [Google Scholar] [CrossRef] [PubMed]
- Ali, M.; Abbasi, B.H. Production of commercially important secondary metabolites and antioxidant activity in cell suspension cultures of Artemisia absinthium L. Ind. Crops Prod. 2013, 49, 400–406. [Google Scholar] [CrossRef]
- Sánchez-Ramos, M.; Alvarez, L.; Romero-Estrada, A.; Bernabé-Antonio, A.; Marquina-Bahena, S.; Cruz-Sosa, F. Establishment of a cell suspension culture of Ageratina pichinchensis (Kunth) for the improved production of anti-inflammatory compounds. Plants 2020, 9, 1398. [Google Scholar] [CrossRef] [PubMed]
- Achika, J.I.; Arthur, D.E.; Gerald, I.; Adedayo, A. A review on the phytoconstituents and related medicinal properties of plants in the Asteraceae family. J. Appl. Chem. 2014, 7, 1–8. [Google Scholar] [CrossRef]
- Naikoo, M.I.; Dar, M.I.; Raghib, F.; Jaleel, H.; Ahmad, B.; Raina, A.; Khan, F.A.; Naushin, F. Chapter 9: Role and regulation of plant phenolics in abiotic stress tolerance: An overview. In Plant Signaling Molecules, 2nd ed.; Khan, M.I.R., Reddy, P.S., Ferrante, A., Khan, N.A., Eds.; Woodhead Publishing: Cambridge, UK, 2019; Volume 1, pp. 157–168. [Google Scholar] [CrossRef]
- Sharma, A.; Shahzad, B.; Rehman, A.; Bhardwaj, R.; Landi, M.; Zheng, B. Response of phenylpropanoid pathway in the role of polyphenols in plants under abiotic stress. Molecules 2019, 24, 2452. [Google Scholar] [CrossRef] [PubMed] [Green Version]
- Ghasemzadeh, A.; Ghasemzadeh, N. Flavonoids and phenolic acids: Role and biochemical activity in plants and human. J. Med. Plants Res. 2011, 5, 6697–6703. [Google Scholar] [CrossRef]
- Karunanithi, P.S.; Zerbe, P. Terpene synthases as metabolic gatekeepers in the evolution of plant terpenoid chemical diversity. Front. Plant Sci. 2019, 10, 1–23. [Google Scholar] [CrossRef] [PubMed] [Green Version]
- Nagegowda, D.A.; Gupta, D. Advances in biosynthesis, regulation, and metabolic engineering of plant specialized terpenoids. Plant Sci. 2020, 294, 1–14. [Google Scholar] [CrossRef]
- Li, Y.; Kong, D.; Fu, Y.; Sussman, M.R.; Wu, H. The effect of developmental and environmental factors on secondary metabolites in medicinal plants. Plant Physiol. Biochem. 2020, 148, 80–89. [Google Scholar] [CrossRef]
- Woerdenbag, H.J.; Merfot, I.; Paβreiter, C.M.; Schmidt, T.J.; Willuhn, G.; van Uden, W.; Pras, N.; Kampinga, H.H.; Konings, A.W.T. Cytotoxicity of flavonoids and sesquiterpene lactones from Arnica species against the GLC4 and the COLO 320 cell lines. Planta Med. 1994, 60, 434–437. [Google Scholar] [CrossRef] [PubMed]
- Woerdenbag, H.J.; Merfot, I.; Schmidt, T.J.; Passreiter, C.M.; Willuhn, G.; van Uden, W.; Pras, N.; Konings, A.W.T. Decreased helenalin-induced cytotoxicity by flavonoids from Arnica as studied in a human lung carcinoma cell line. Phytomedicine 1995, 2, 127–132. [Google Scholar] [CrossRef]
- Sugier, D.; Sugier, P.; Jakubowicz-Gil, J.; Winiarczyk, K.; Kowalski, R. Essential oil from Arnica montana L. achenes: Chemical characteristics and anticancer activity. Molecules 2019, 24, 4158. [Google Scholar] [CrossRef] [PubMed] [Green Version]
- Sugier, P.; Jakubowicz-Gil, J.; Sugier, D.; Kowalski, R.; Gawlik-Dziki, U.; Kołodziej, B.; Dziki, D. Chemical characteristics and anticancer activity of essential oil from Arnica montana L. rhizomes and roots. Molecules 2020, 25, 1284. [Google Scholar] [CrossRef] [Green Version]
- Garg, A.K.; Buchholz, T.A.; Aggarwal, B.B. Chemosensitization and radiosensititization of tumors by plant polyphenols. Antioxid. Redox Signal. 2005, 7, 1630–1647. [Google Scholar] [CrossRef]
- Ahn, H.-J.; Song, I.-S. Screening for chemosensitizers from natural plant extracts through the inhibition mechanism of P-glycoprotein. J. Pharm. Investig. 2010, 40, 269–275. [Google Scholar] [CrossRef]
- Butturini, E.; Carcereri de Patri, A.; Boriero, D.; Mariotto, S. Natural sesquiterpene lactones enhance chemosensitivity of tumor cells through redox regulation of STAT3 signaling. Oxid. Med. Cell. Longev. 2019, 2019, 1–16. [Google Scholar] [CrossRef] [PubMed]
- Hamed, A.R.; Abdel-Azim, N.S.; Shams, K.A.; Hammouda, F.M. Targeting multidrug resistance in cancer by natural chemosensitizers. Bull. Natl. Res. Cent. 2019, 43, 1–14. [Google Scholar] [CrossRef] [Green Version]
- Brantner, A.; Grein, E. Antibacterial activity of plant extracts used externally in traditional medicine. J. Ethnopharmacol. 1994, 44, 35–40. [Google Scholar] [CrossRef]
- Kryvtsova, M.V.; Trush, K.; Koščová, J.; Eftimova, J. Antimicrobial, antioxidant and some biochemical properties of Arnica montana L. Biol. Bull. Russ. Acad. Sci. 2019, 3, 268–273. [Google Scholar] [CrossRef]
- Kryvtsova, M.V.; Koščová, J. Antibiofilm-forming and antimicrobial activity of extracts of Arnica montana L., Achillea millefolium L. on Staphylococcus genus bacteria. Bioctechnol. Acta 2020, 13, 30–37. [Google Scholar] [CrossRef]
- Olennikov, D.N.; Chirikova, N.N.; Kashchenko, N.I.; Nikolaev, V.M.; Kim, S.-W.; Vennos, C. Bioactive phenolics of the genus Artemisia (Asteraceae) HPLC-DAD-ESI-TQ-MS/MS profile of the Siberian species and their inhibitory potential against α-amylase and α-glucosidase. Front. Pharmacol. 2018, 9, 756. [Google Scholar] [CrossRef] [PubMed]
- Rana, Z.H.; Alam, M.K.; Akhtaruzzaman, M. Nutritional composition, total phenolic content, antioxidant and α-amylase inhibitory activities of different fractions of selected wild edible plants. Antioxidants 2019, 8, 203. [Google Scholar] [CrossRef] [Green Version]
- Özek, G.; Özbek, M.U.; Yur, S.; Göger, F.; Arslan, M.; Özek, T. Assessment of endemic Cota fulvida (Asteraceae) for phytochemical composition and inhibitory activities against oxidation, α-amylase, lipoxygenase, xanthine oxidase and tyrosinase enzymes. Rec. Nat. Prod. 2019, 13, 333–345. [Google Scholar] [CrossRef]
- Pollini, L.; Riccio, A.; Juan, C.; Trianganiello, C.; Ianni, F.; Blasi, F.; Mañes, J.; Macchiarulo, A.; Cossignani, L. Phenolic acids from Lycium barbarum leaves: in vitro and in silico studies of the inhibitory activity against porcine pancreatic α-amylase. Processes 2020, 8, 1388. [Google Scholar] [CrossRef]
- Jaradat, N.; Qneibi, M.; Hawash, M.; Sawalha, A.; Qtaishat, S.; Hussein, F.; Issa, L. Chemical composition, antioxidant, antiobesity, and antidiabetic effects of Helichrysum sanguineum (L.) Kostel. from Palestine. Arab. J. Sci. Eng. 2020, 46, 41–51. [Google Scholar] [CrossRef]
- Khalid, M.; Bilal, M.; Huang, D.F. Role of flavonoids in plant interactions with the environment and against human pathogens—A review. J. Integr. Agric. 2019, 18, 211–230. [Google Scholar] [CrossRef]
- Nabavi, S.M.; Samec, D.; Tomczyk, M.; Milella, L.; Russo, D.; Habtemariam, S.; Suntar, I.; Rastrelli, L.; Daglia, M.; Xiao, J.; et al. Flavonoid biosynthetic pathways in plants: Versatile target of metabolic engineering. Biotechnol. Adv. 2020, 38, 1–12. [Google Scholar] [CrossRef]
- Gaspar, A.; Craciunescu, O.; Trif, M.; Moisei, M.; Moldovan, L. Antioxidant and anti-inflammatory properties of active compounds from Arnica montana L. Rom. Biotechnol. Lett. 2014, 19, 9353–9365. [Google Scholar]
- Sharma, R.; KArunambigai, A.; Gupta, S.; Arumugam, N. Evaluation of biologically active secondary metabolites isolated from the toothache plant Acmella ciliate (Asteraceae). Adv. Tradit. Med. 2021. [Google Scholar] [CrossRef]
- Nikolova, M.; Petrova, M.; Zayova, E.; Vitkova, A.; Evstatieva, L. Comparative study of in vitro, ex vitro and in viphenvo grown plants of Arnica montana- polyphenols and free radical scavenging activity. Acta Bot. Croat. 2013, 72, 13–22. [Google Scholar] [CrossRef]
- Murashige, T.; Skoog, F. A revised medium for rapid growth and bioassays with tobacco tissue cultures. Physiol. Plant. 1962, 15, 473–497. [Google Scholar] [CrossRef]
- Dubois, M.; Gilles, K.A.; Hamilton, J.K.; Rebers, P.A.; Smith, F. Colorimetric method for determination sugars and related substances. Anal. Chem. 1956, 28, 350–356. [Google Scholar] [CrossRef]
- Arano-Varela, H.; Fernández, F.J.; Estrada-Zúñiga, M.E.; Cruz-Sosa, F. Verbascoside production in long-term Buddleja cordata Kunth cell suspension cultures. 3 Biotech. 2020, 10, 245. [Google Scholar] [CrossRef] [PubMed]
- Vazquez-Marquez, A.M.; Zepeda-Gómez, C.; Burrola-Aguilar, C.; Bernabé-Antonio, B.; Nieto-Trujillo, A.; Cruz-Sosa, F.; Rodríguez-Monroy, M.; Estrada-Zúñiga, M.E. Effect of stirring speed on the production of phenolic secondary metabolites and growth of Buddleja cordata cells cultured in mechanically agitated bioreactor. Plant Cell Tissue Organ Cult. 2019, 139, 155–166. [Google Scholar] [CrossRef]
- Nair, C.N.; Sheela, D. Quantification of secondary metabolites and antioxidant potential of selected members of the tribe Heliantheae. J. Pharmacog. Phytochem. 2016, 5, 163–166. [Google Scholar]
- Khan, T.; Khan, T.; Hano, C.; Abbasi, B.H. Effects of chitosan and salicylic acid on the production of pharmacologically attractive secondary metabolites in callus cultures of Fagonia indica. Ind. Crops Prod. 2019, 129, 525–535. [Google Scholar] [CrossRef]
- Acquavia, M.A.; Pascale, R.; Foti, L.; Carlucci, G.; Scrano, L.; Martelli, G.; Brienza, M.; Coviello, D.; Bianco, G.; Lelario, F. Analytical methods for extraction and identificatión of primary and secondary metabolites of apple (Malus domestica) fruits: A review. Separation 2021, 8, 91. [Google Scholar] [CrossRef]
- Salapovic, H.; Geier, J.; Reznicek, G. Quantification of sesquiterpene lactones in Asteraceae plant extracts: Evaluation of their allergenic potential. Sci. Pharm. 2013, 81, 807–818. [Google Scholar] [CrossRef] [Green Version]
- Molyneux, P. The use of the stable free radical diphenylpicrylhydrazyl (DPPH) for estimating antioxidant activity. Songklanakarin J. Sci. Technol. 2004, 26, 211–219. [Google Scholar]
- Domínguez, X.A. Métodos de Investigación Fitoquímica; Editorial Limusa: Guadalajara, México, 1998; p. 281. [Google Scholar]
- Echeverría, M.M.F.; Alaba, A.P.; Estrada-Zuñiga, M.E.; Velázquez-Ordoñez, V.; Barbabosa-Pliego, A.; Salem, M.Z.M.; Alonso-Fresán, M.M.U.; Camacho-Díaz, L.M.; Salem, A.Z.M. Anti-staphylococcal properties of four plant extracts against sensitive and multi-resistant bacterial strains isolated from cattle and rabbits. Microb. Pathog. 2017, 113, 286–294. [Google Scholar] [CrossRef]
- Jimoh, T. Enzymes inhibitory and radical scavenging potentials of two selected tropical vegetable (Moringa oleifera and Telfairia occidentalis) leaves relevant to type 2 diabetes mellitus. Rev. Bras. Farmacogn. 2018, 28, 73–79. [Google Scholar] [CrossRef]

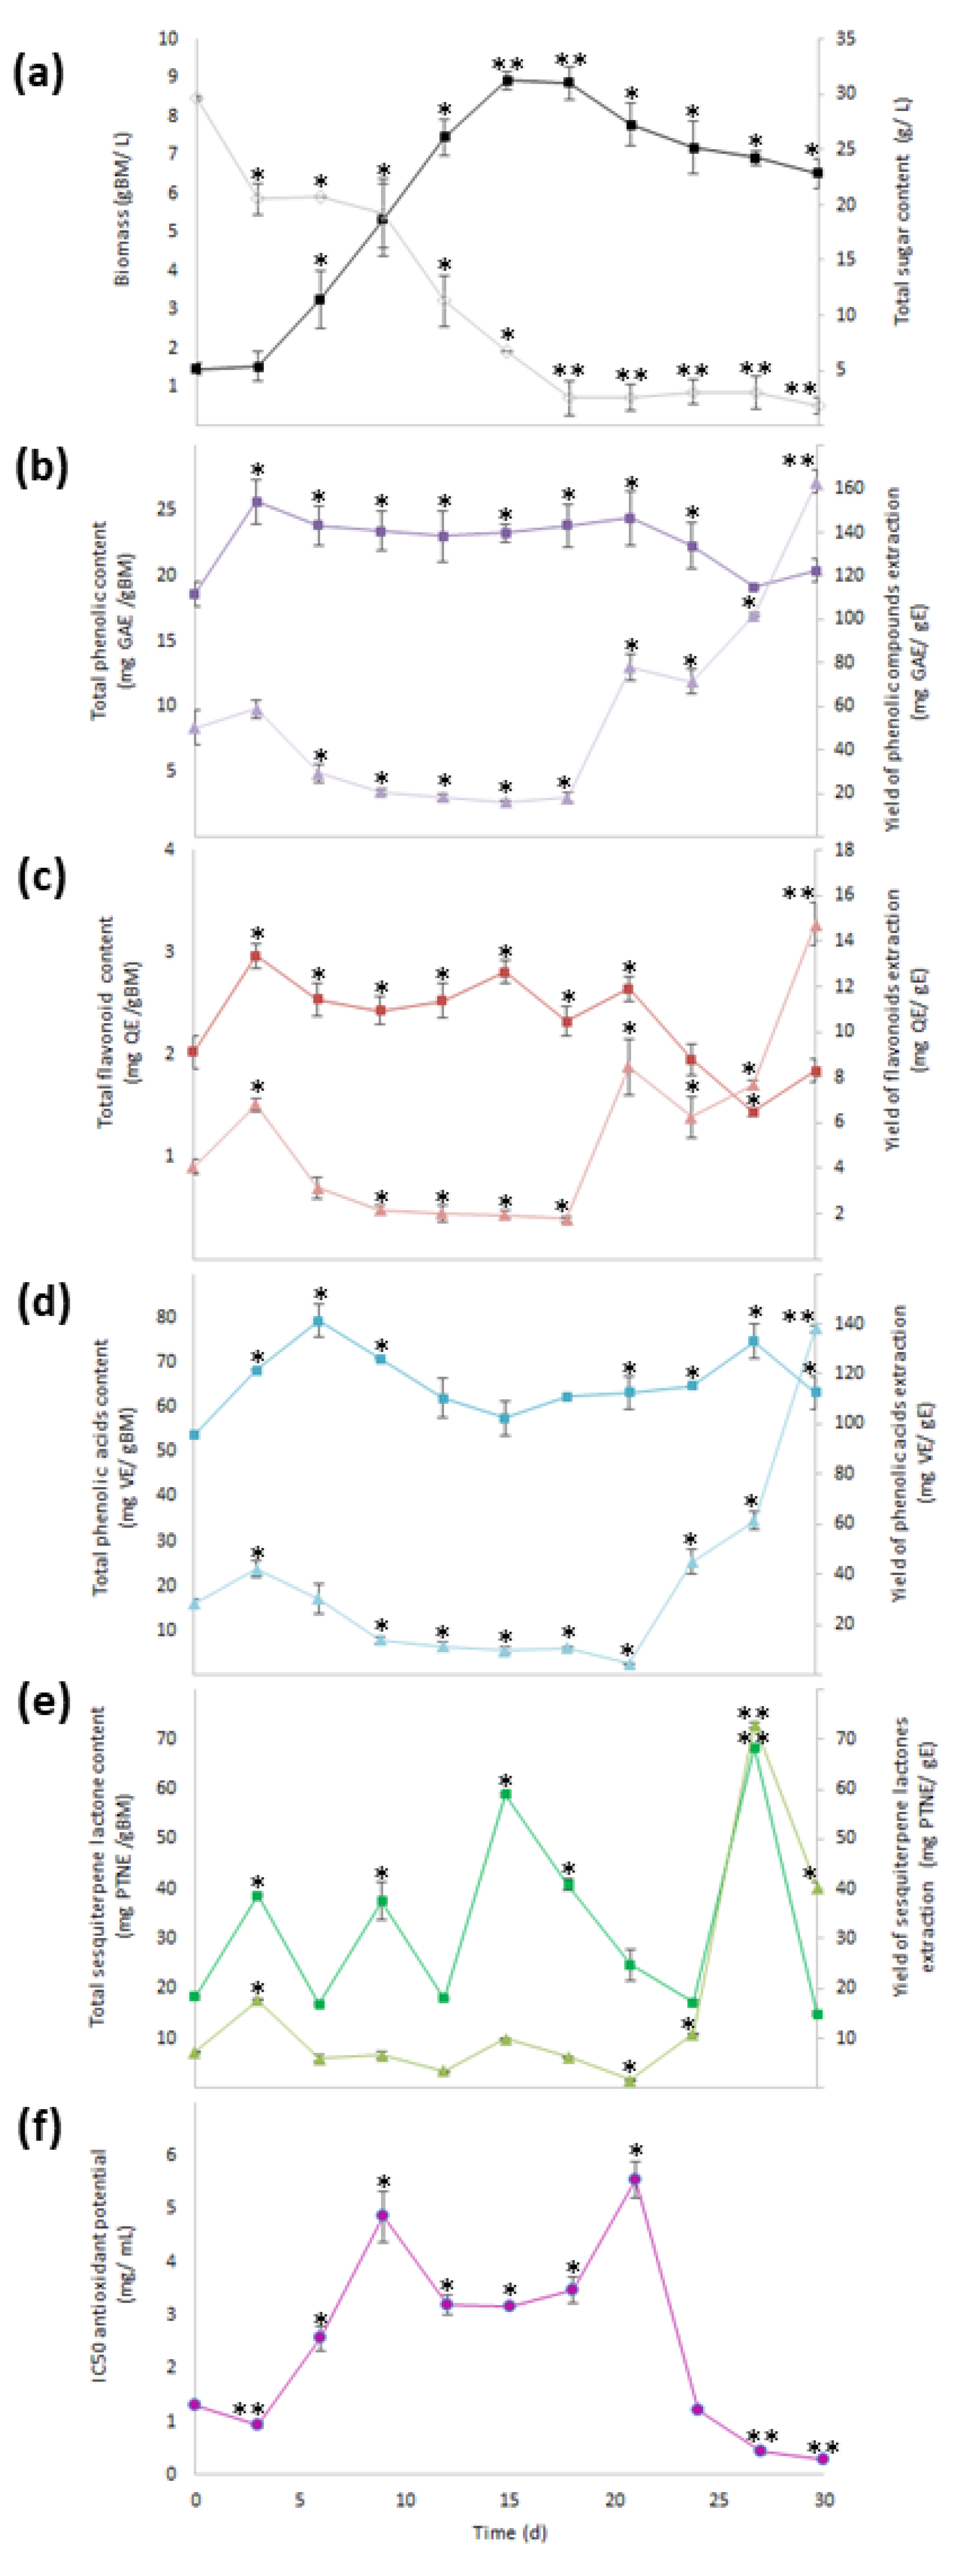
 ) and total sugar content (
  ), (b) total phenolic content (
  ) and yield of phenolics’ extraction (
  ), (c) total flavonoid content (TFC,
  ) and yield of flavonoids’ extraction (
  ), (d) total phenolic acid content (
  ) and yield of phenolic acids’ extraction (
  ), (e) total sesquiterpene lactone content (
  ) and yield of sesquiterpene lactones’ extraction (YSL/E:
  ), and (f) antioxidant activity (IC50:
  ). Within every line tendency, data show mean ± SD followed by *, which indicates statistical differences at the 5% level of probability regarding time culture at day 0, while ** indicates those treatments showing the highest production of biomass, total phenolic content, total flavonoid content, total phenolic acid content, total sesquiterpene lactone content, yield of phenolics’ extraction, yield of flavonoids’ extraction, yield of phenolic acids’ extraction, and yield of sesquiterpene lactones’ extraction. ** Indicates lowest values for total sugar content and antioxidant activity. All the results regarding yield of SM’s extraction were estimated with regard the corresponding total SM content per gram of extract.
) and total sugar content ( ), (b) total phenolic content ( ) and yield of phenolics’ extraction ( ), (c) total flavonoid content (TFC, ) and yield of flavonoids’ extraction ( ), (d) total phenolic acid content ( ) and yield of phenolic acids’ extraction ( ), (e) total sesquiterpene lactone content ( ) and yield of sesquiterpene lactones’ extraction (YSL/E: ), and (f) antioxidant activity (IC50: ). Within every line tendency, data show mean ± SD followed by *, which indicates statistical differences at the 5% level of probability regarding time culture at day 0, while ** indicates those treatments showing the highest production of biomass, total phenolic content, total flavonoid content, total phenolic acid content, total sesquiterpene lactone content, yield of phenolics’ extraction, yield of flavonoids’ extraction, yield of phenolic acids’ extraction, and yield of sesquiterpene lactones’ extraction. ** Indicates lowest values for total sugar content and antioxidant activity. All the results regarding yield of SM’s extraction were estimated with regard the corresponding total SM content per gram of extract.
). Within every line tendency, data show mean ± SD followed by *, which indicates statistical differences at the 5% level of probability regarding time culture at day 0, while ** indicates those treatments showing the highest production of biomass, total phenolic content, total flavonoid content, total phenolic acid content, total sesquiterpene lactone content, yield of phenolics’ extraction, yield of flavonoids’ extraction, yield of phenolic acids’ extraction, and yield of sesquiterpene lactones’ extraction. ** Indicates lowest values for total sugar content and antioxidant activity. All the results regarding yield of SM’s extraction were estimated with regard the corresponding total SM content per gram of extract.
) and total sugar content ( ), (b) total phenolic content ( ) and yield of phenolics’ extraction ( ), (c) total flavonoid content (TFC, ) and yield of flavonoids’ extraction ( ), (d) total phenolic acid content ( ) and yield of phenolic acids’ extraction ( ), (e) total sesquiterpene lactone content ( ) and yield of sesquiterpene lactones’ extraction (YSL/E: ), and (f) antioxidant activity (IC50: ). Within every line tendency, data show mean ± SD followed by *, which indicates statistical differences at the 5% level of probability regarding time culture at day 0, while ** indicates those treatments showing the highest production of biomass, total phenolic content, total flavonoid content, total phenolic acid content, total sesquiterpene lactone content, yield of phenolics’ extraction, yield of flavonoids’ extraction, yield of phenolic acids’ extraction, and yield of sesquiterpene lactones’ extraction. ** Indicates lowest values for total sugar content and antioxidant activity. All the results regarding yield of SM’s extraction were estimated with regard the corresponding total SM content per gram of extract.
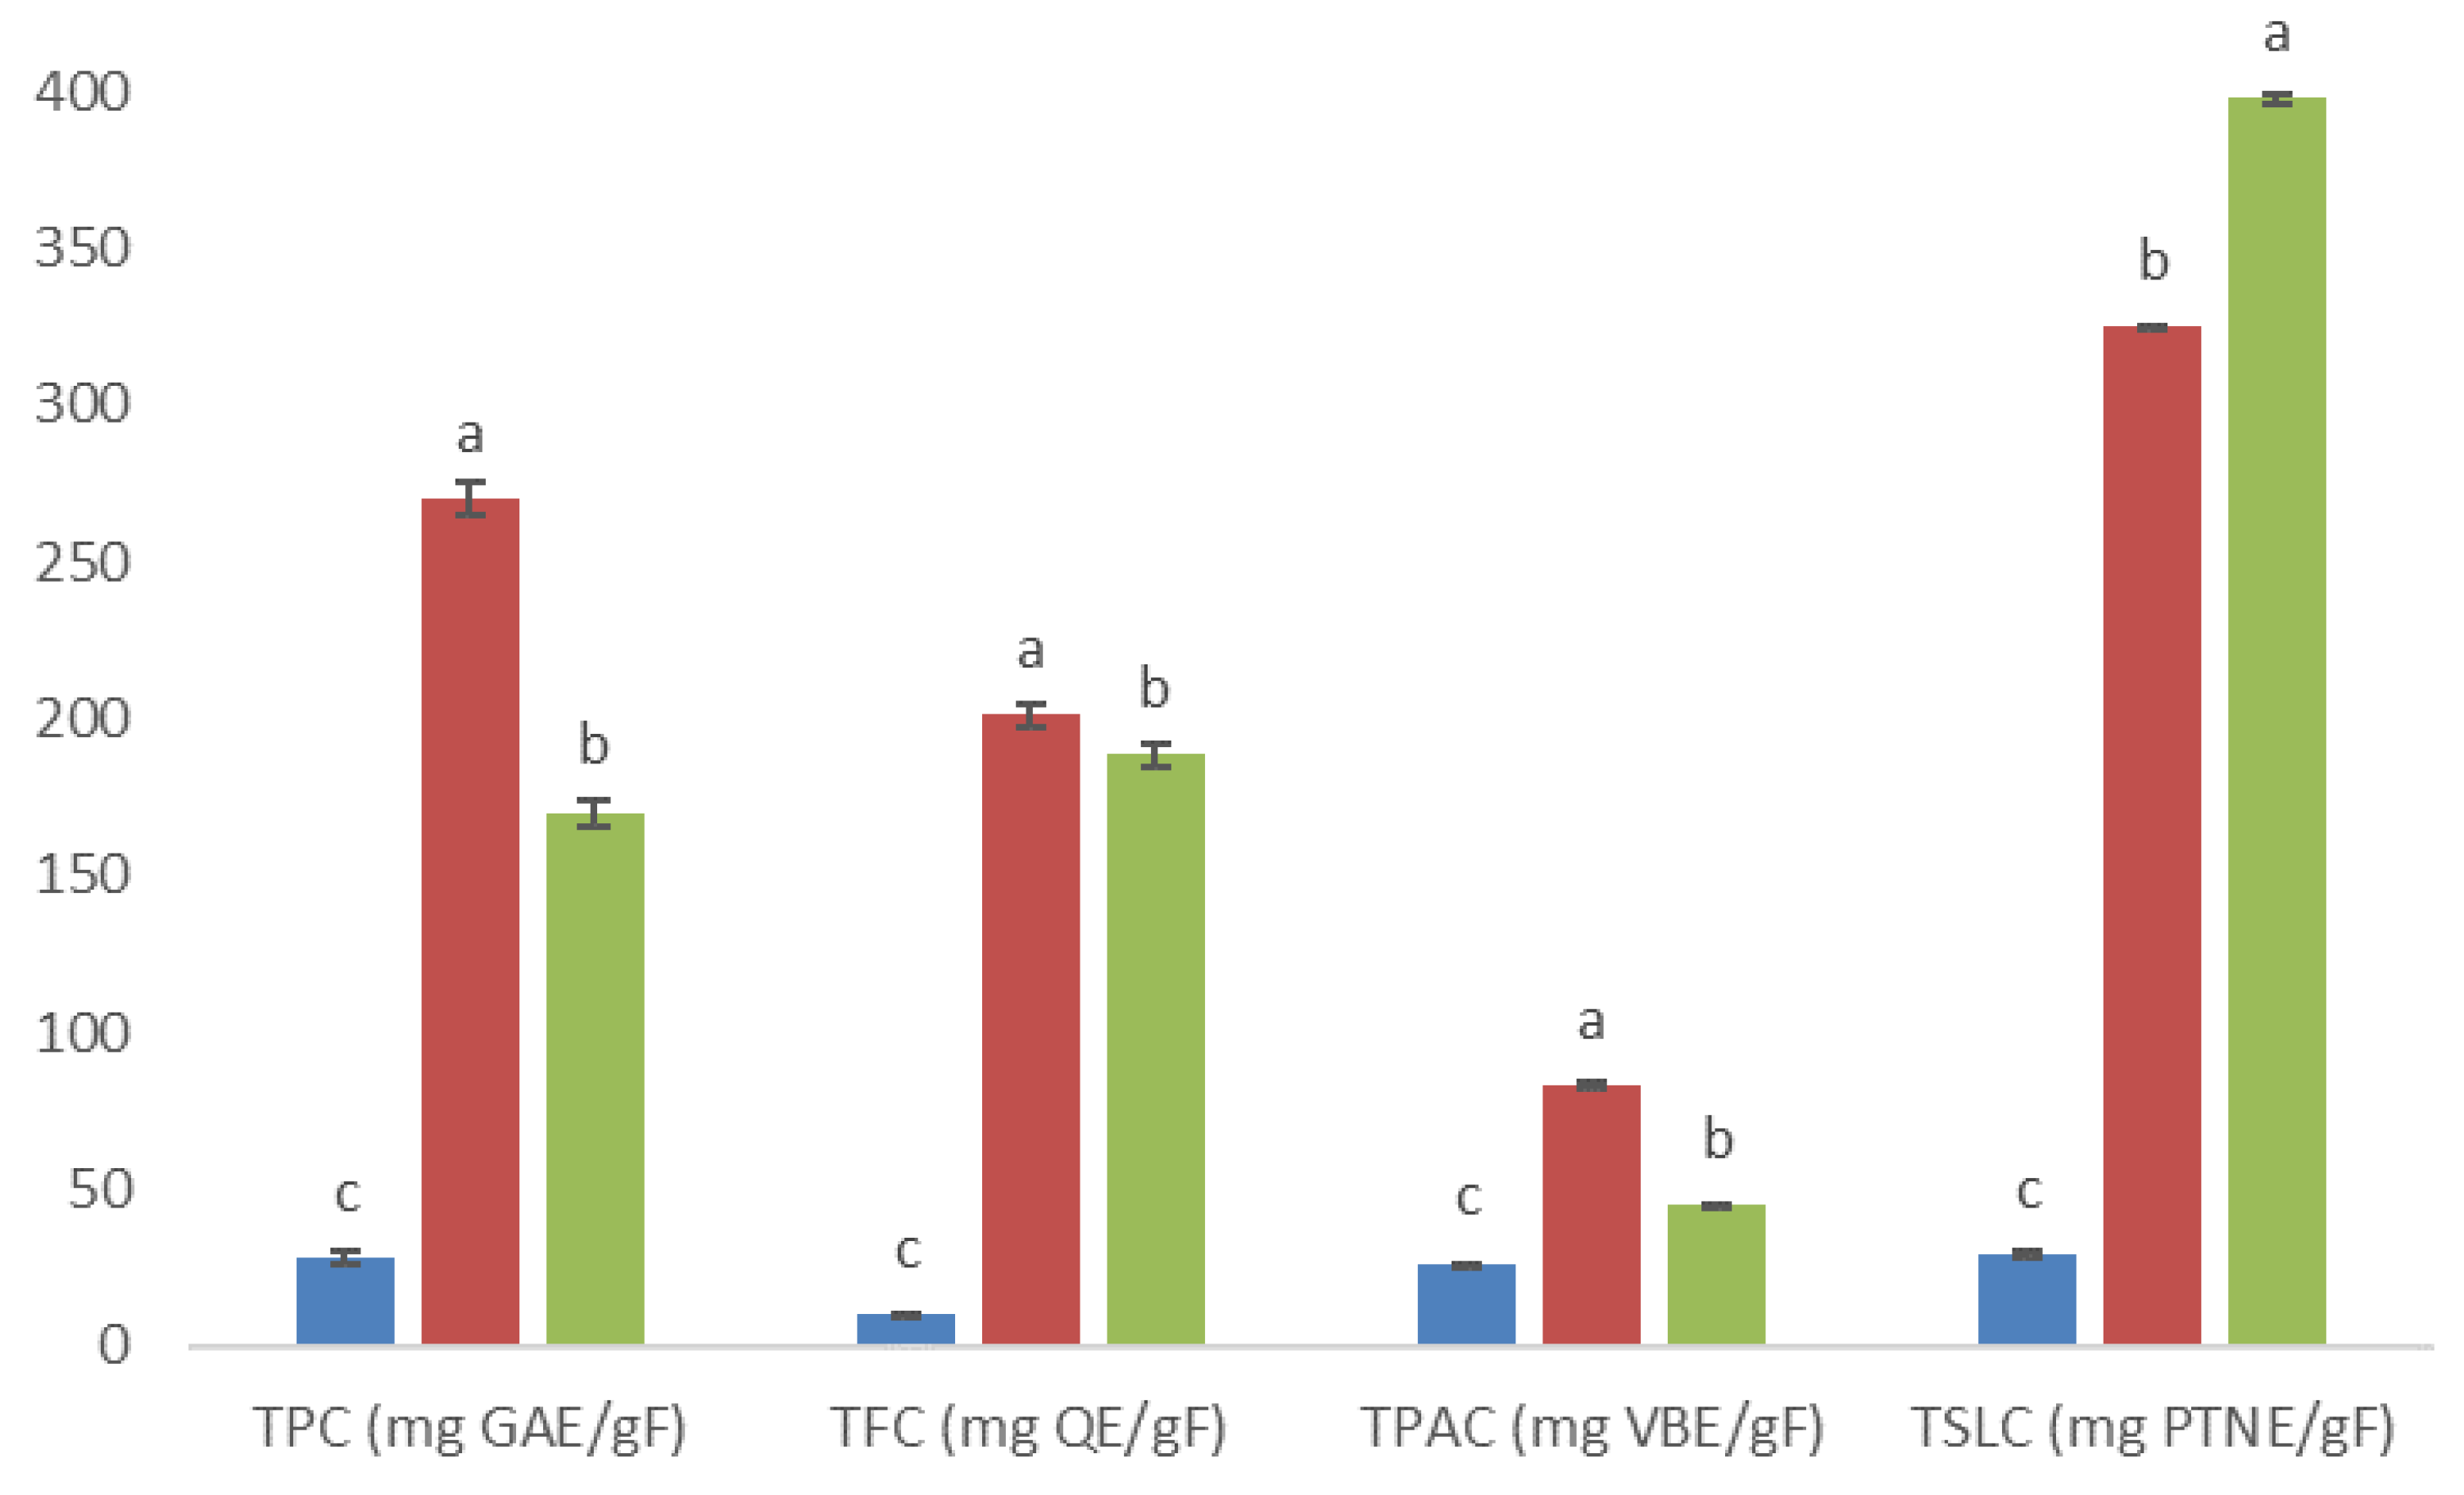
 ), 5AM (
  ), and 6AM (
  ) fractions obtained from a methanolic extract of cell biomass of A. montana. Between every secondary metabolite content, data show means ± SD followed by letters that indicate statistical differences at the 5% level of significance.
), 5AM ( ), and 6AM ( ) fractions obtained from a methanolic extract of cell biomass of A. montana. Between every secondary metabolite content, data show means ± SD followed by letters that indicate statistical differences at the 5% level of significance.
) fractions obtained from a methanolic extract of cell biomass of A. montana. Between every secondary metabolite content, data show means ± SD followed by letters that indicate statistical differences at the 5% level of significance.
), 5AM ( ), and 6AM ( ) fractions obtained from a methanolic extract of cell biomass of A. montana. Between every secondary metabolite content, data show means ± SD followed by letters that indicate statistical differences at the 5% level of significance.
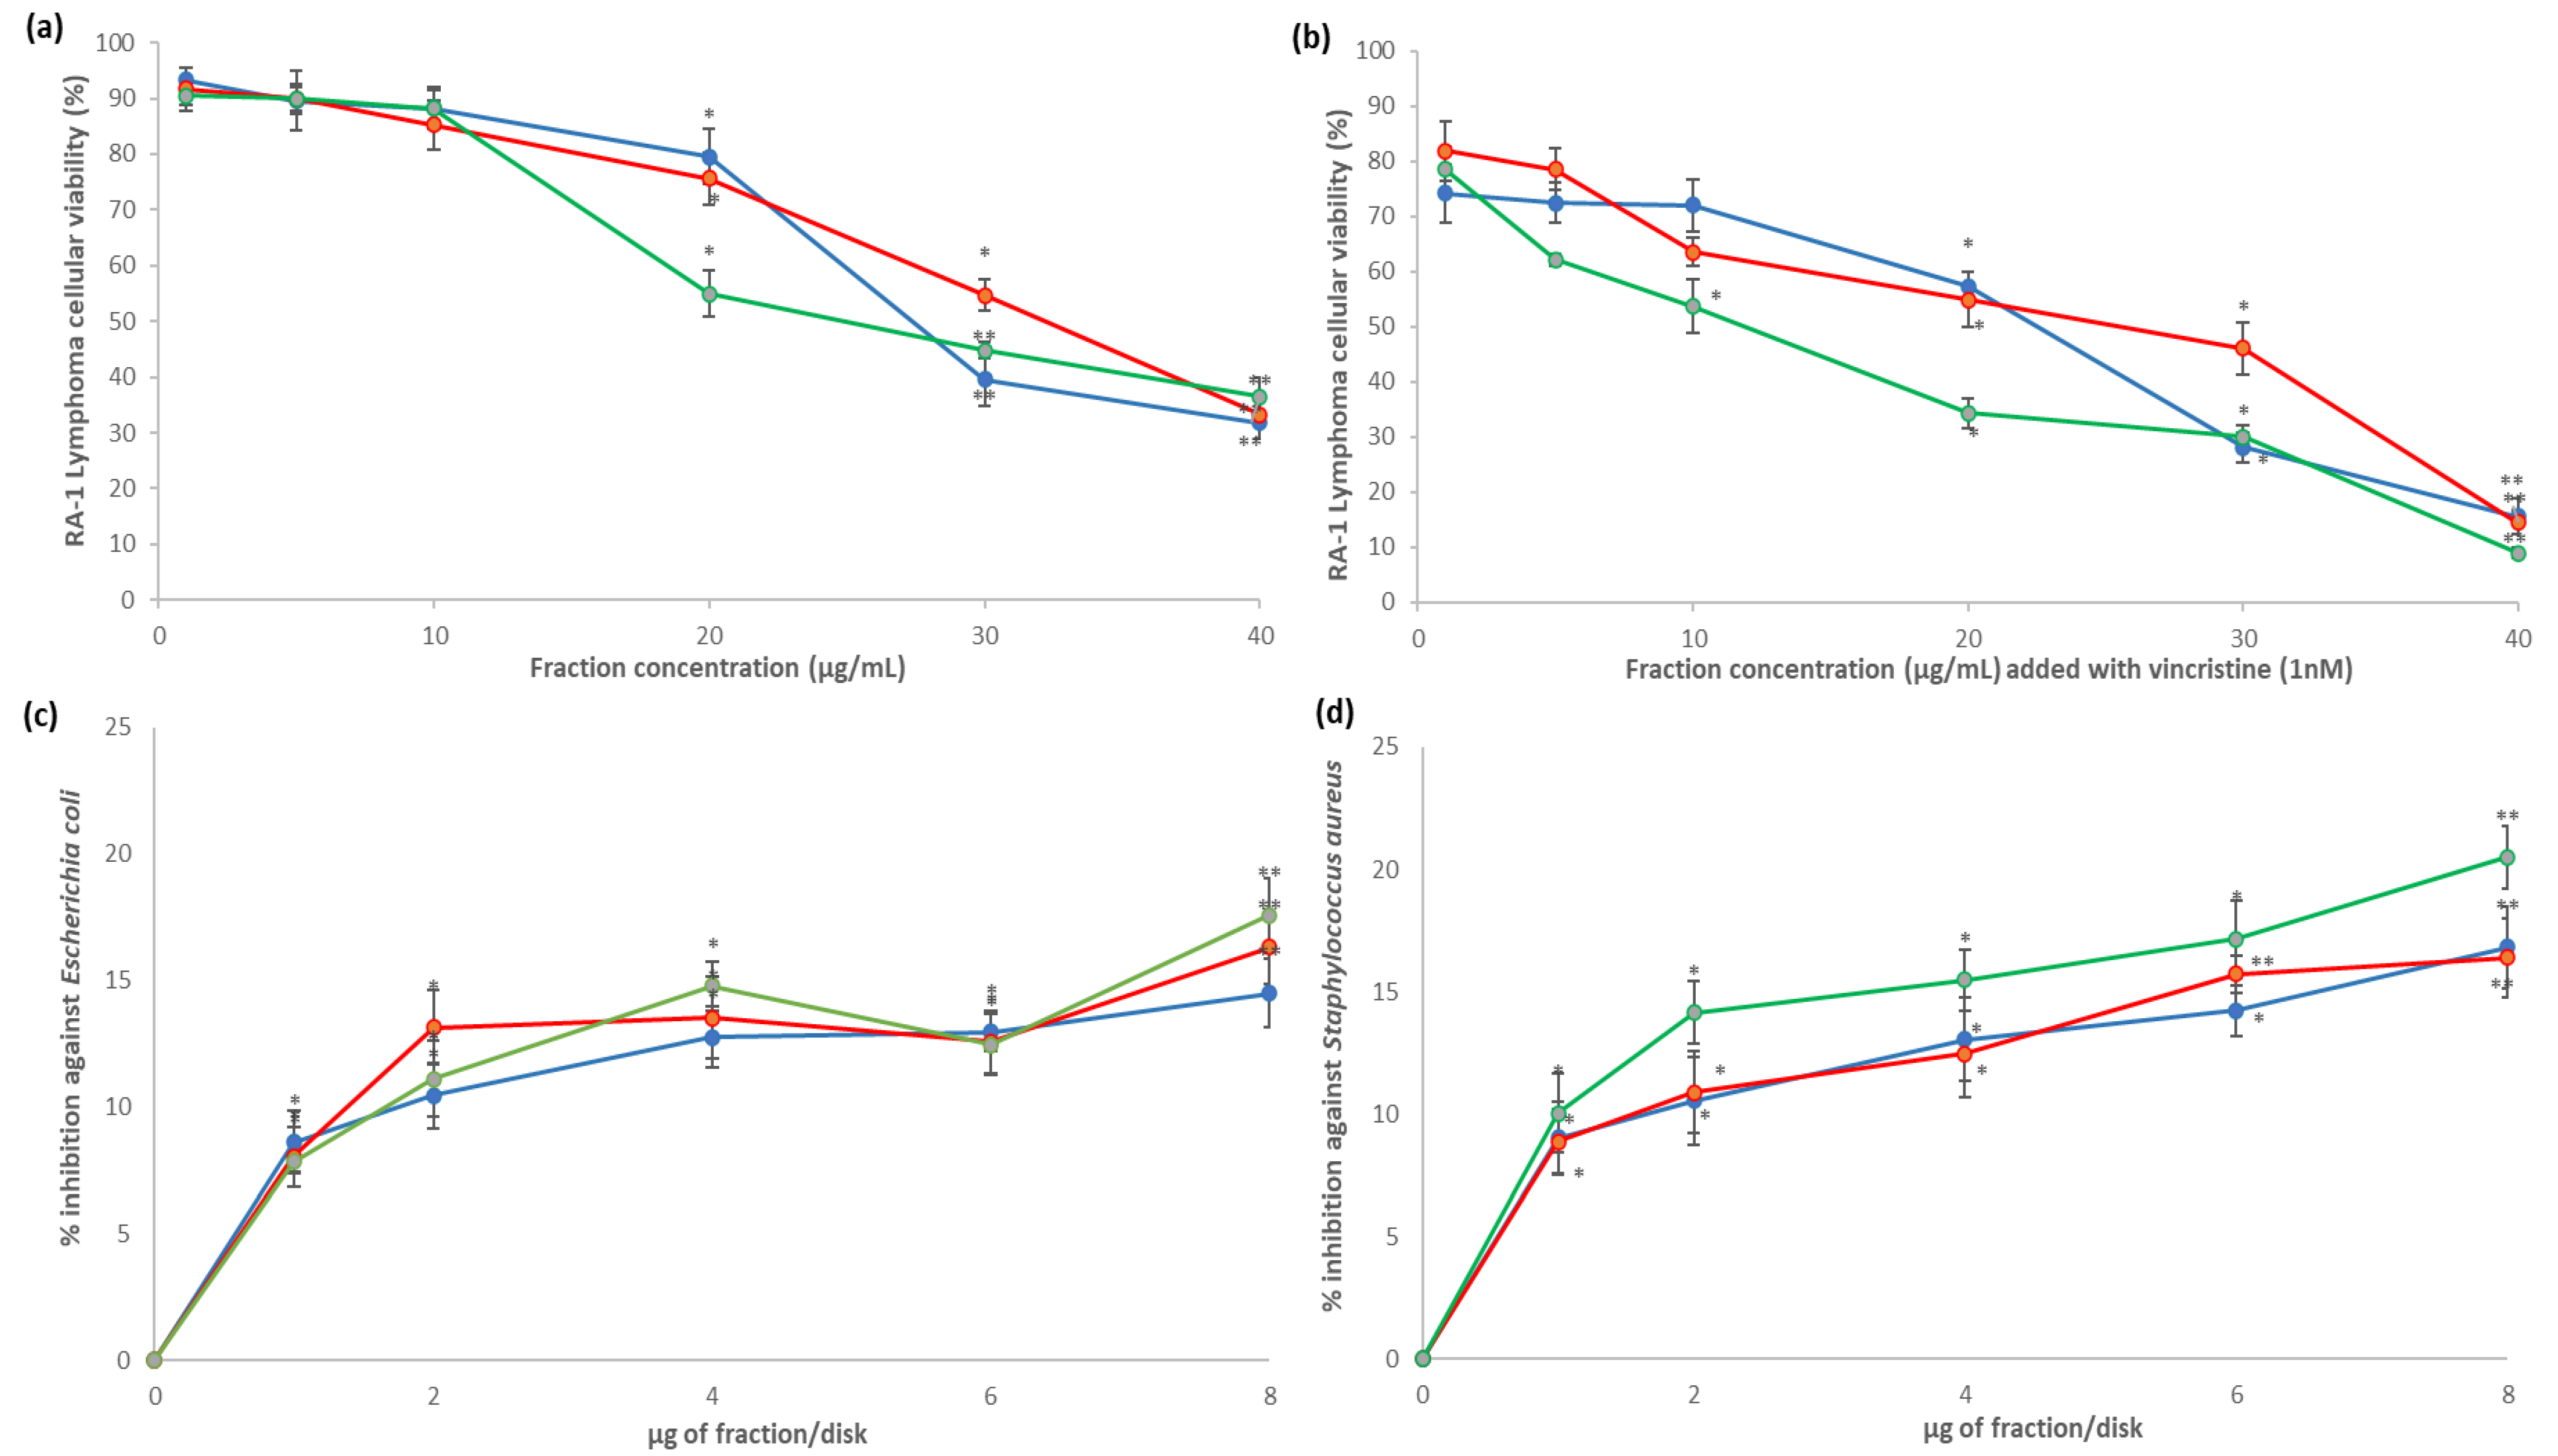
 ), 5AM (
  ), and 6AM (
  ) fractions showed cytotoxic effect against Ramos RA-1 lymphoma cell line (a) alone and (b) combined with 1 nM of vincristine. Antibacterial effect against (c) E. coli and (d) S. aureus. Data show means ± SD. * Indicates statistical differences at the 5% level of significance compared to the negative control, and ** indicates those treatments showing the lowest values for cellular viability of RA-1 lymphoma cells or the highest % of inhibition of bacterial growth. In cytotoxic Ramos RA-1 lymphoma cell assays, a negative control was the culture medium (which induced cellular viability of 94.71% ± 1.5%), while 1 nM of vincristine was used as a positive control (reducing cellular viability of 72.61% ± 1.45%). In the antibacterial assay against E. coli, the negative control was 3% DMSO, and the positive control was 1 µg chloramphenicol/disk. In the antibacterial assay against S. aureus, the negative control was 3% DMSO, and the positive control was 1 µg vancomycin/disk. For both antibacterial assays, data are shown as % of inhibition.
), 5AM ( ), and 6AM ( ) fractions showed cytotoxic effect against Ramos RA-1 lymphoma cell line (a) alone and (b) combined with 1 nM of vincristine. Antibacterial effect against (c) E. coli and (d) S. aureus. Data show means ± SD. * Indicates statistical differences at the 5% level of significance compared to the negative control, and ** indicates those treatments showing the lowest values for cellular viability of RA-1 lymphoma cells or the highest % of inhibition of bacterial growth. In cytotoxic Ramos RA-1 lymphoma cell assays, a negative control was the culture medium (which induced cellular viability of 94.71% ± 1.5%), while 1 nM of vincristine was used as a positive control (reducing cellular viability of 72.61% ± 1.45%). In the antibacterial assay against E. coli, the negative control was 3% DMSO, and the positive control was 1 µg chloramphenicol/disk. In the antibacterial assay against S. aureus, the negative control was 3% DMSO, and the positive control was 1 µg vancomycin/disk. For both antibacterial assays, data are shown as % of inhibition.
) fractions showed cytotoxic effect against Ramos RA-1 lymphoma cell line (a) alone and (b) combined with 1 nM of vincristine. Antibacterial effect against (c) E. coli and (d) S. aureus. Data show means ± SD. * Indicates statistical differences at the 5% level of significance compared to the negative control, and ** indicates those treatments showing the lowest values for cellular viability of RA-1 lymphoma cells or the highest % of inhibition of bacterial growth. In cytotoxic Ramos RA-1 lymphoma cell assays, a negative control was the culture medium (which induced cellular viability of 94.71% ± 1.5%), while 1 nM of vincristine was used as a positive control (reducing cellular viability of 72.61% ± 1.45%). In the antibacterial assay against E. coli, the negative control was 3% DMSO, and the positive control was 1 µg chloramphenicol/disk. In the antibacterial assay against S. aureus, the negative control was 3% DMSO, and the positive control was 1 µg vancomycin/disk. For both antibacterial assays, data are shown as % of inhibition.
), 5AM ( ), and 6AM ( ) fractions showed cytotoxic effect against Ramos RA-1 lymphoma cell line (a) alone and (b) combined with 1 nM of vincristine. Antibacterial effect against (c) E. coli and (d) S. aureus. Data show means ± SD. * Indicates statistical differences at the 5% level of significance compared to the negative control, and ** indicates those treatments showing the lowest values for cellular viability of RA-1 lymphoma cells or the highest % of inhibition of bacterial growth. In cytotoxic Ramos RA-1 lymphoma cell assays, a negative control was the culture medium (which induced cellular viability of 94.71% ± 1.5%), while 1 nM of vincristine was used as a positive control (reducing cellular viability of 72.61% ± 1.45%). In the antibacterial assay against E. coli, the negative control was 3% DMSO, and the positive control was 1 µg chloramphenicol/disk. In the antibacterial assay against S. aureus, the negative control was 3% DMSO, and the positive control was 1 µg vancomycin/disk. For both antibacterial assays, data are shown as % of inhibition.
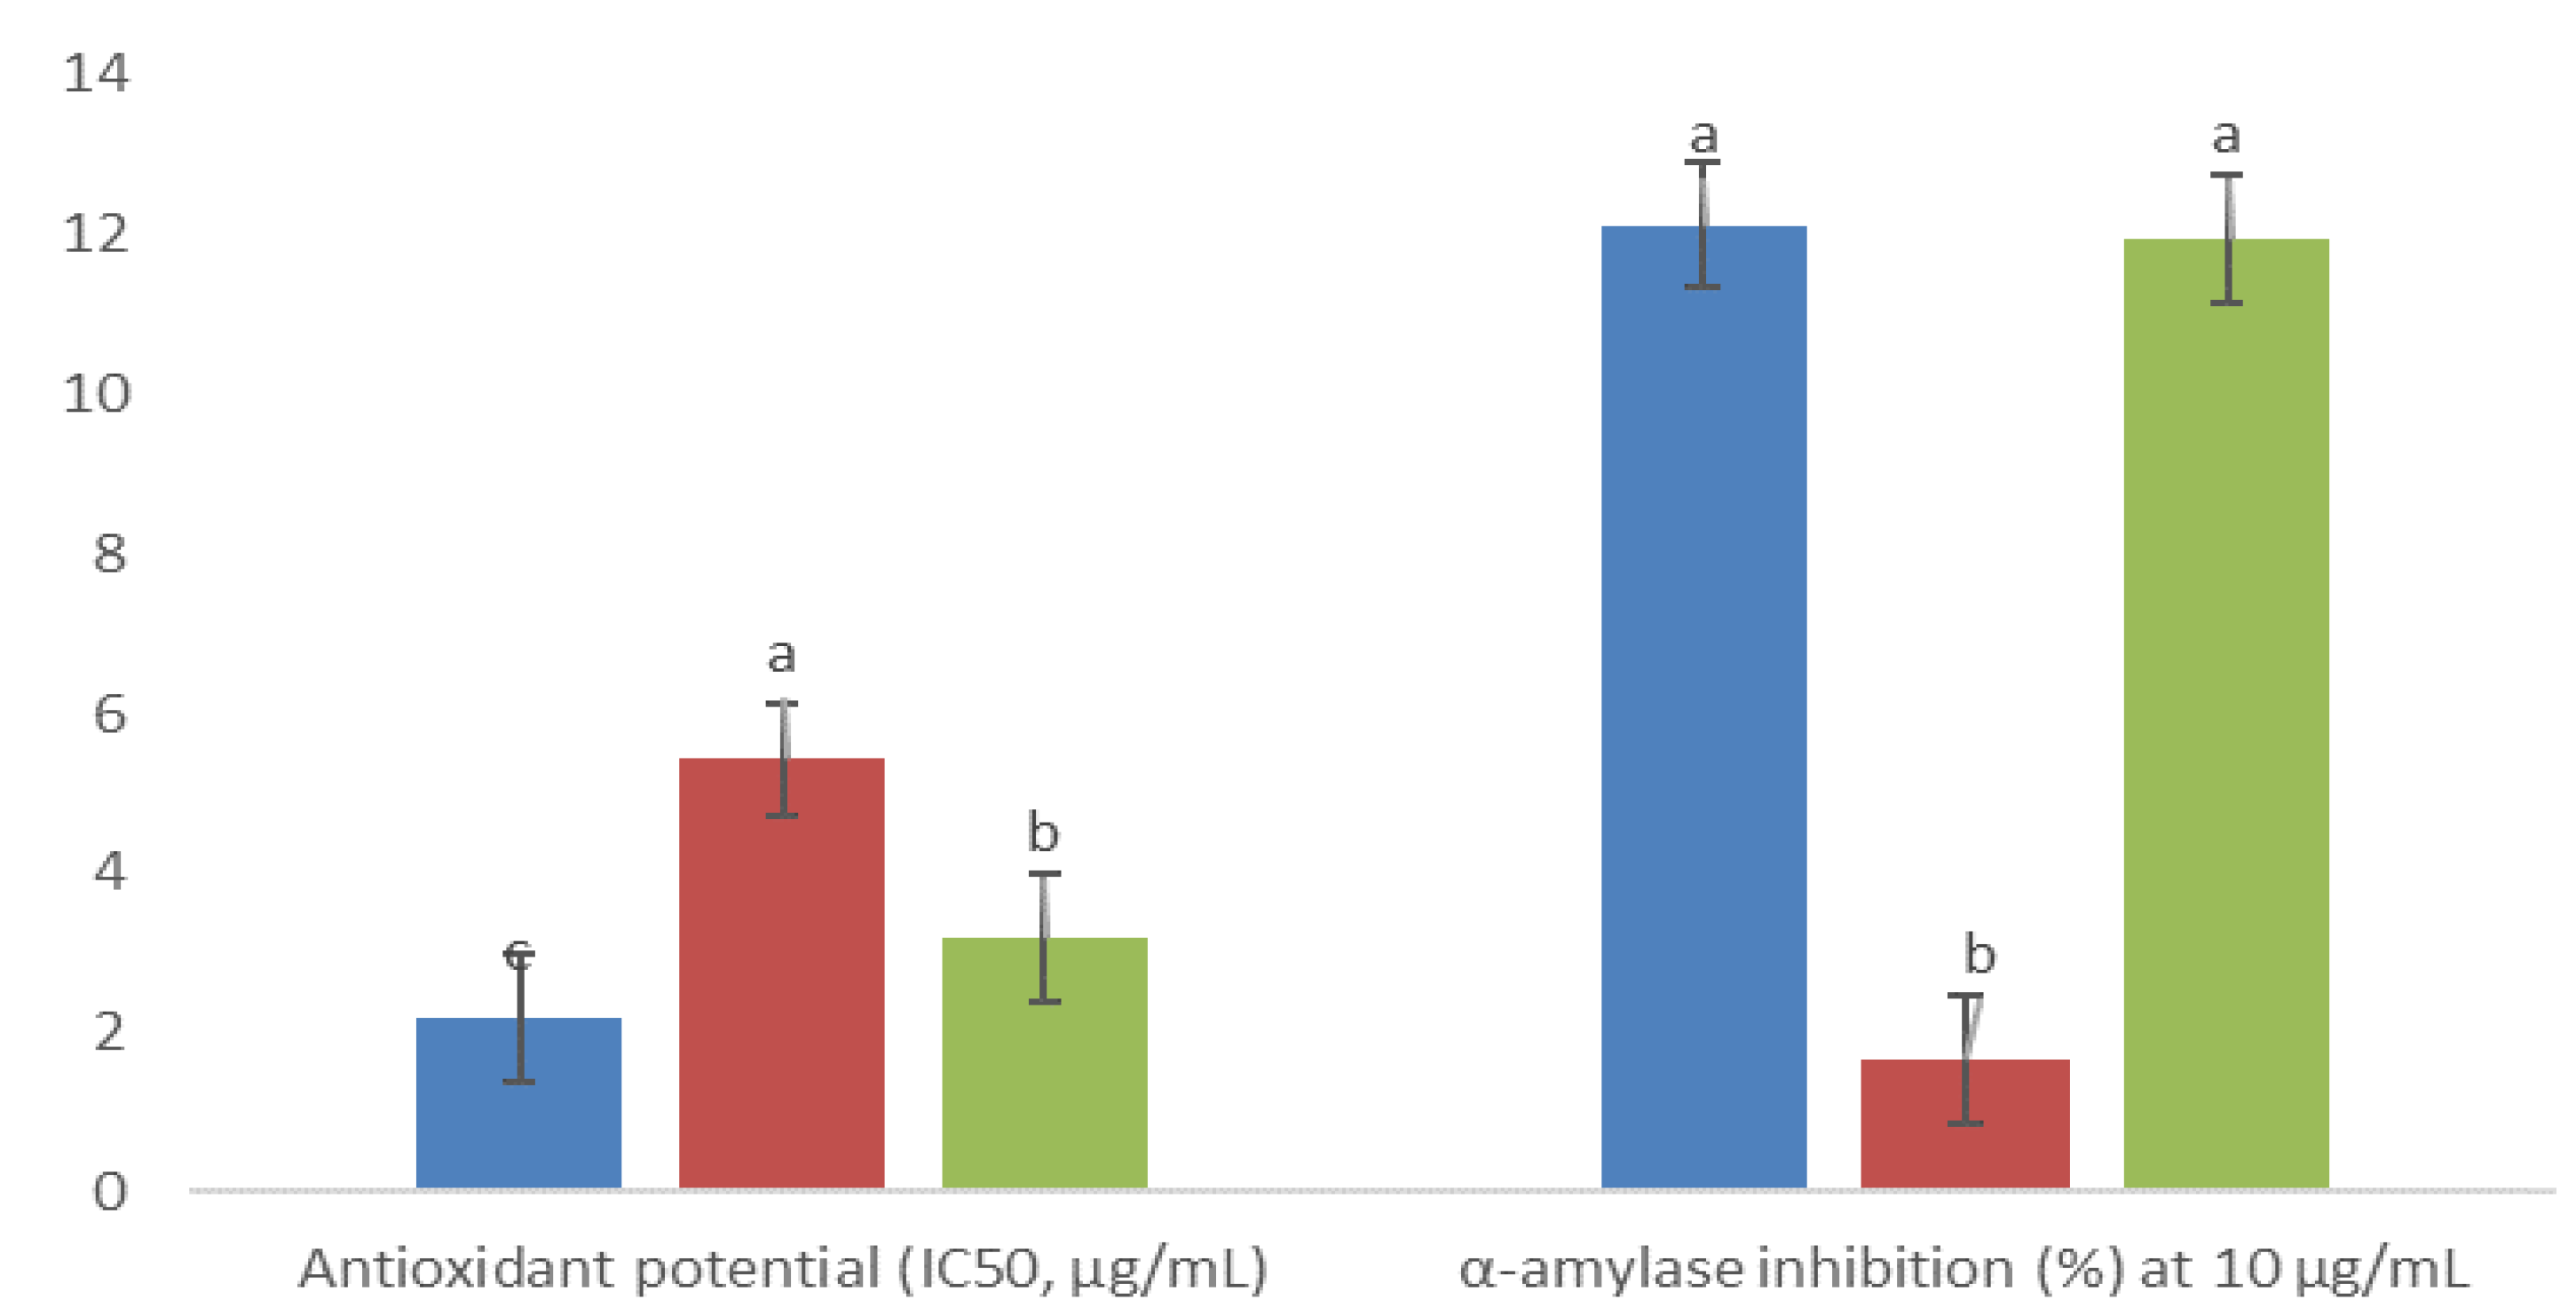
 ), 5AM (
  ), and 6AM (
  ). Between every effect, data show the means ± SD, and letters indicate statistical differences at the 5% level of probability.
), 5AM ( ), and 6AM ( ). Between every effect, data show the means ± SD, and letters indicate statistical differences at the 5% level of probability.
). Between every effect, data show the means ± SD, and letters indicate statistical differences at the 5% level of probability.
), 5AM ( ), and 6AM ( ). Between every effect, data show the means ± SD, and letters indicate statistical differences at the 5% level of probability.


| Type of Plant Growth Regulator (PGR) (mg/L) | Type of Induced Response | ||||||||||
|---|---|---|---|---|---|---|---|---|---|---|---|
| Callus | Root | ||||||||||
| Auxin | Cytokinin | Induction (%) | Phenotypic Characteristics | Induction (%) | |||||||
| PIC | 2,4-D | NAA | IBA | IAA | BAP | KIN | Texture | Color | Growth | ||
| Control treatment (without PGRs) | 0 ± 0 a | 0 ± 0 a | |||||||||
| 0.5 | 100 ± 0 f | F | W; PY | +++ | 0 ± 0 a | ||||||
| 1 | 100 ± 0 f | F | W; PY | ++ | 0 ± 0 a | ||||||
| 2.5 | 100 ± 0 f | F | W; PY | ++ | 0 ± 0 a | ||||||
| 5 | 100 ± 0 f | F | W; PY | + | 0 ± 0 a | ||||||
| 1 | 78 ± 0 e | C | B | + | 0 ± 0 a | ||||||
| 1 | 0 ± 0 a | 100 ± 0 e | |||||||||
| 2.5 | 50 ± 0 c | F | G | ++ | 50 ± 0 c | ||||||
| 5 | 75 ± 0 e | F | W | + | 25 ± 0 b | ||||||
| 1 | 0 ± 0 a | 100 ± 0 e | |||||||||
| 2.5 | 0 ± 0 a | 100 ± 0 e | |||||||||
| 5 | 0 ± 0 a | 78 ± 0 d | |||||||||
| 0.5 | 0 ± 0 a | 25 ± 0 b | |||||||||
| 0.5 | 0.5 | 100 ± 0 f | F | Y | ++ | 0 ± 0 a | |||||
| 1 | 0.5 | 100 ± 0 f | F | Y | +++ | 0 ± 0 a | |||||
| 0.5 | 1 | 100 ± 0 f | F | Y | ++ | 0 ± 0 a | |||||
| 1 | 1 | 100 ± 0 f | F | W | + | 0 ± 0 a | |||||
| 2.5 | 2.5 | 56 ± 19 cd | C | W | + | 0 ± 0 a | |||||
| 0.5 | 0.5 | 100 ± 0 f | F | Y | ++ | 0 ± 0 a | |||||
| 1 | 0.5 | 100 ± 0 f | F | Y | +++ | 0 ± 0 a | |||||
| 0.5 | 1 | 100 ± 0 f | F | Y | ++ | 0 ± 0 a | |||||
| 1 | 1 | 78 ± 19 e | C | W | + | 0 ± 0 a | |||||
| 2.5 | 2.5 | 33 ± 0 b | C | W | + | 0 ± 0 a | |||||
| 1 | 1 | 100 ± 0 f | F | PB | + | 0 ± 0 a | |||||
| 1 | 1 | 100 ± 0 f | F | B | + | 0 ± 0 a | |||||
| 1 | 1 | 56 ± 19 cd | F | PG | + | 56 ± 19 c | |||||
| 2.5 | 2.5 | 33 ± 0 b | F | PG | ++ | 78 ± 19 d | |||||
| 5 | 5 | 56 ± 19 cd | C | PB | + | 33 ± 0 b | |||||
| 1 | 1 | 0 ± 0 a | 56 ± 19 c | ||||||||
| 2.5 | 2.5 | 0 ± 0 a | 56 ± 19 c | ||||||||
| 5 | 5 | 0 ± 0 a | 56 ± 19 c | ||||||||
| 0.5 | 0.5 | 0 ± 0 a | 100 ± 0 e | ||||||||
| 1 | 0.5 | 78 ± 19 e | C | PY | + | 33 ± 0 b | |||||
| 0.5 | 1 | 100 ± 0 f | C | Y | ++ | 0 ± 0 a | |||||
| 1 | 1 | 44 ± 19 bc | C | Y | +++ | 33 ± 0 b | |||||
| 0.5 | 0.5 | 56 ± 19 cd | C | PB | + | 33 ± 0 b | |||||
| 1 | 0.5 | 0 ± 0 a | 100 ± 0 e | ||||||||
| 0.5 | 1 | 0 ± 0 a | 100 ± 0 e | ||||||||
| 1 | 1 | 0 ± 0 a | 100 ± 0 e | ||||||||
| 2.5 | 2.5 | 0 ± 0 a | 100 ± 0 e | ||||||||
| 5 | 5 | 33 ± 0 b | C | B | ++ | 33 ± 0 b | |||||
| 1 | 1 | 33 ± 0 b | C | DB | + | 33 ± 0 b | |||||
| 2.5 | 2.5 | 44 ± 19 bc | C | G | + | 0 ± 0 a | |||||
| 1 | 1 | 33 ± 0 b | C | DG | + | 33 ± 0 b | |||||
| 2.5 | 2.5 | 0 ± 0 a | 33 ± 0 b | ||||||||
| 5 | 5 | 0 ± 0 a | 78 ± 19 d | ||||||||
Publisher’s Note: MDPI stays neutral with regard to jurisdictional claims in published maps and institutional affiliations. |
© 2021 by the authors. Licensee MDPI, Basel, Switzerland. This article is an open access article distributed under the terms and conditions of the Creative Commons Attribution (CC BY) license (https://creativecommons.org/licenses/by/4.0/).
Share and Cite
Nieto-Trujillo, A.; Cruz-Sosa, F.; Luria-Pérez, R.; Gutiérrez-Rebolledo, G.A.; Román-Guerrero, A.; Burrola-Aguilar, C.; Zepeda-Gómez, C.; Estrada-Zúñiga, M.E. Arnica montana Cell Culture Establishment, and Assessment of Its Cytotoxic, Antibacterial, α-Amylase Inhibitor, and Antioxidant In Vitro Bioactivities. Plants 2021, 10, 2300. https://0-doi-org.brum.beds.ac.uk/10.3390/plants10112300
Nieto-Trujillo A, Cruz-Sosa F, Luria-Pérez R, Gutiérrez-Rebolledo GA, Román-Guerrero A, Burrola-Aguilar C, Zepeda-Gómez C, Estrada-Zúñiga ME. Arnica montana Cell Culture Establishment, and Assessment of Its Cytotoxic, Antibacterial, α-Amylase Inhibitor, and Antioxidant In Vitro Bioactivities. Plants. 2021; 10(11):2300. https://0-doi-org.brum.beds.ac.uk/10.3390/plants10112300
Chicago/Turabian StyleNieto-Trujillo, Aurelio, Francisco Cruz-Sosa, Rosendo Luria-Pérez, Gabriel Alfonso Gutiérrez-Rebolledo, Angélica Román-Guerrero, Cristina Burrola-Aguilar, Carmen Zepeda-Gómez, and María Elena Estrada-Zúñiga. 2021. "Arnica montana Cell Culture Establishment, and Assessment of Its Cytotoxic, Antibacterial, α-Amylase Inhibitor, and Antioxidant In Vitro Bioactivities" Plants 10, no. 11: 2300. https://0-doi-org.brum.beds.ac.uk/10.3390/plants10112300