
Understanding the Relationship between Water Availability and Biosilica Accumulation in Selected C4 Crop Leaves: An Experimental Approach

 , , , and
Abstract
:1. Introduction
2. Results
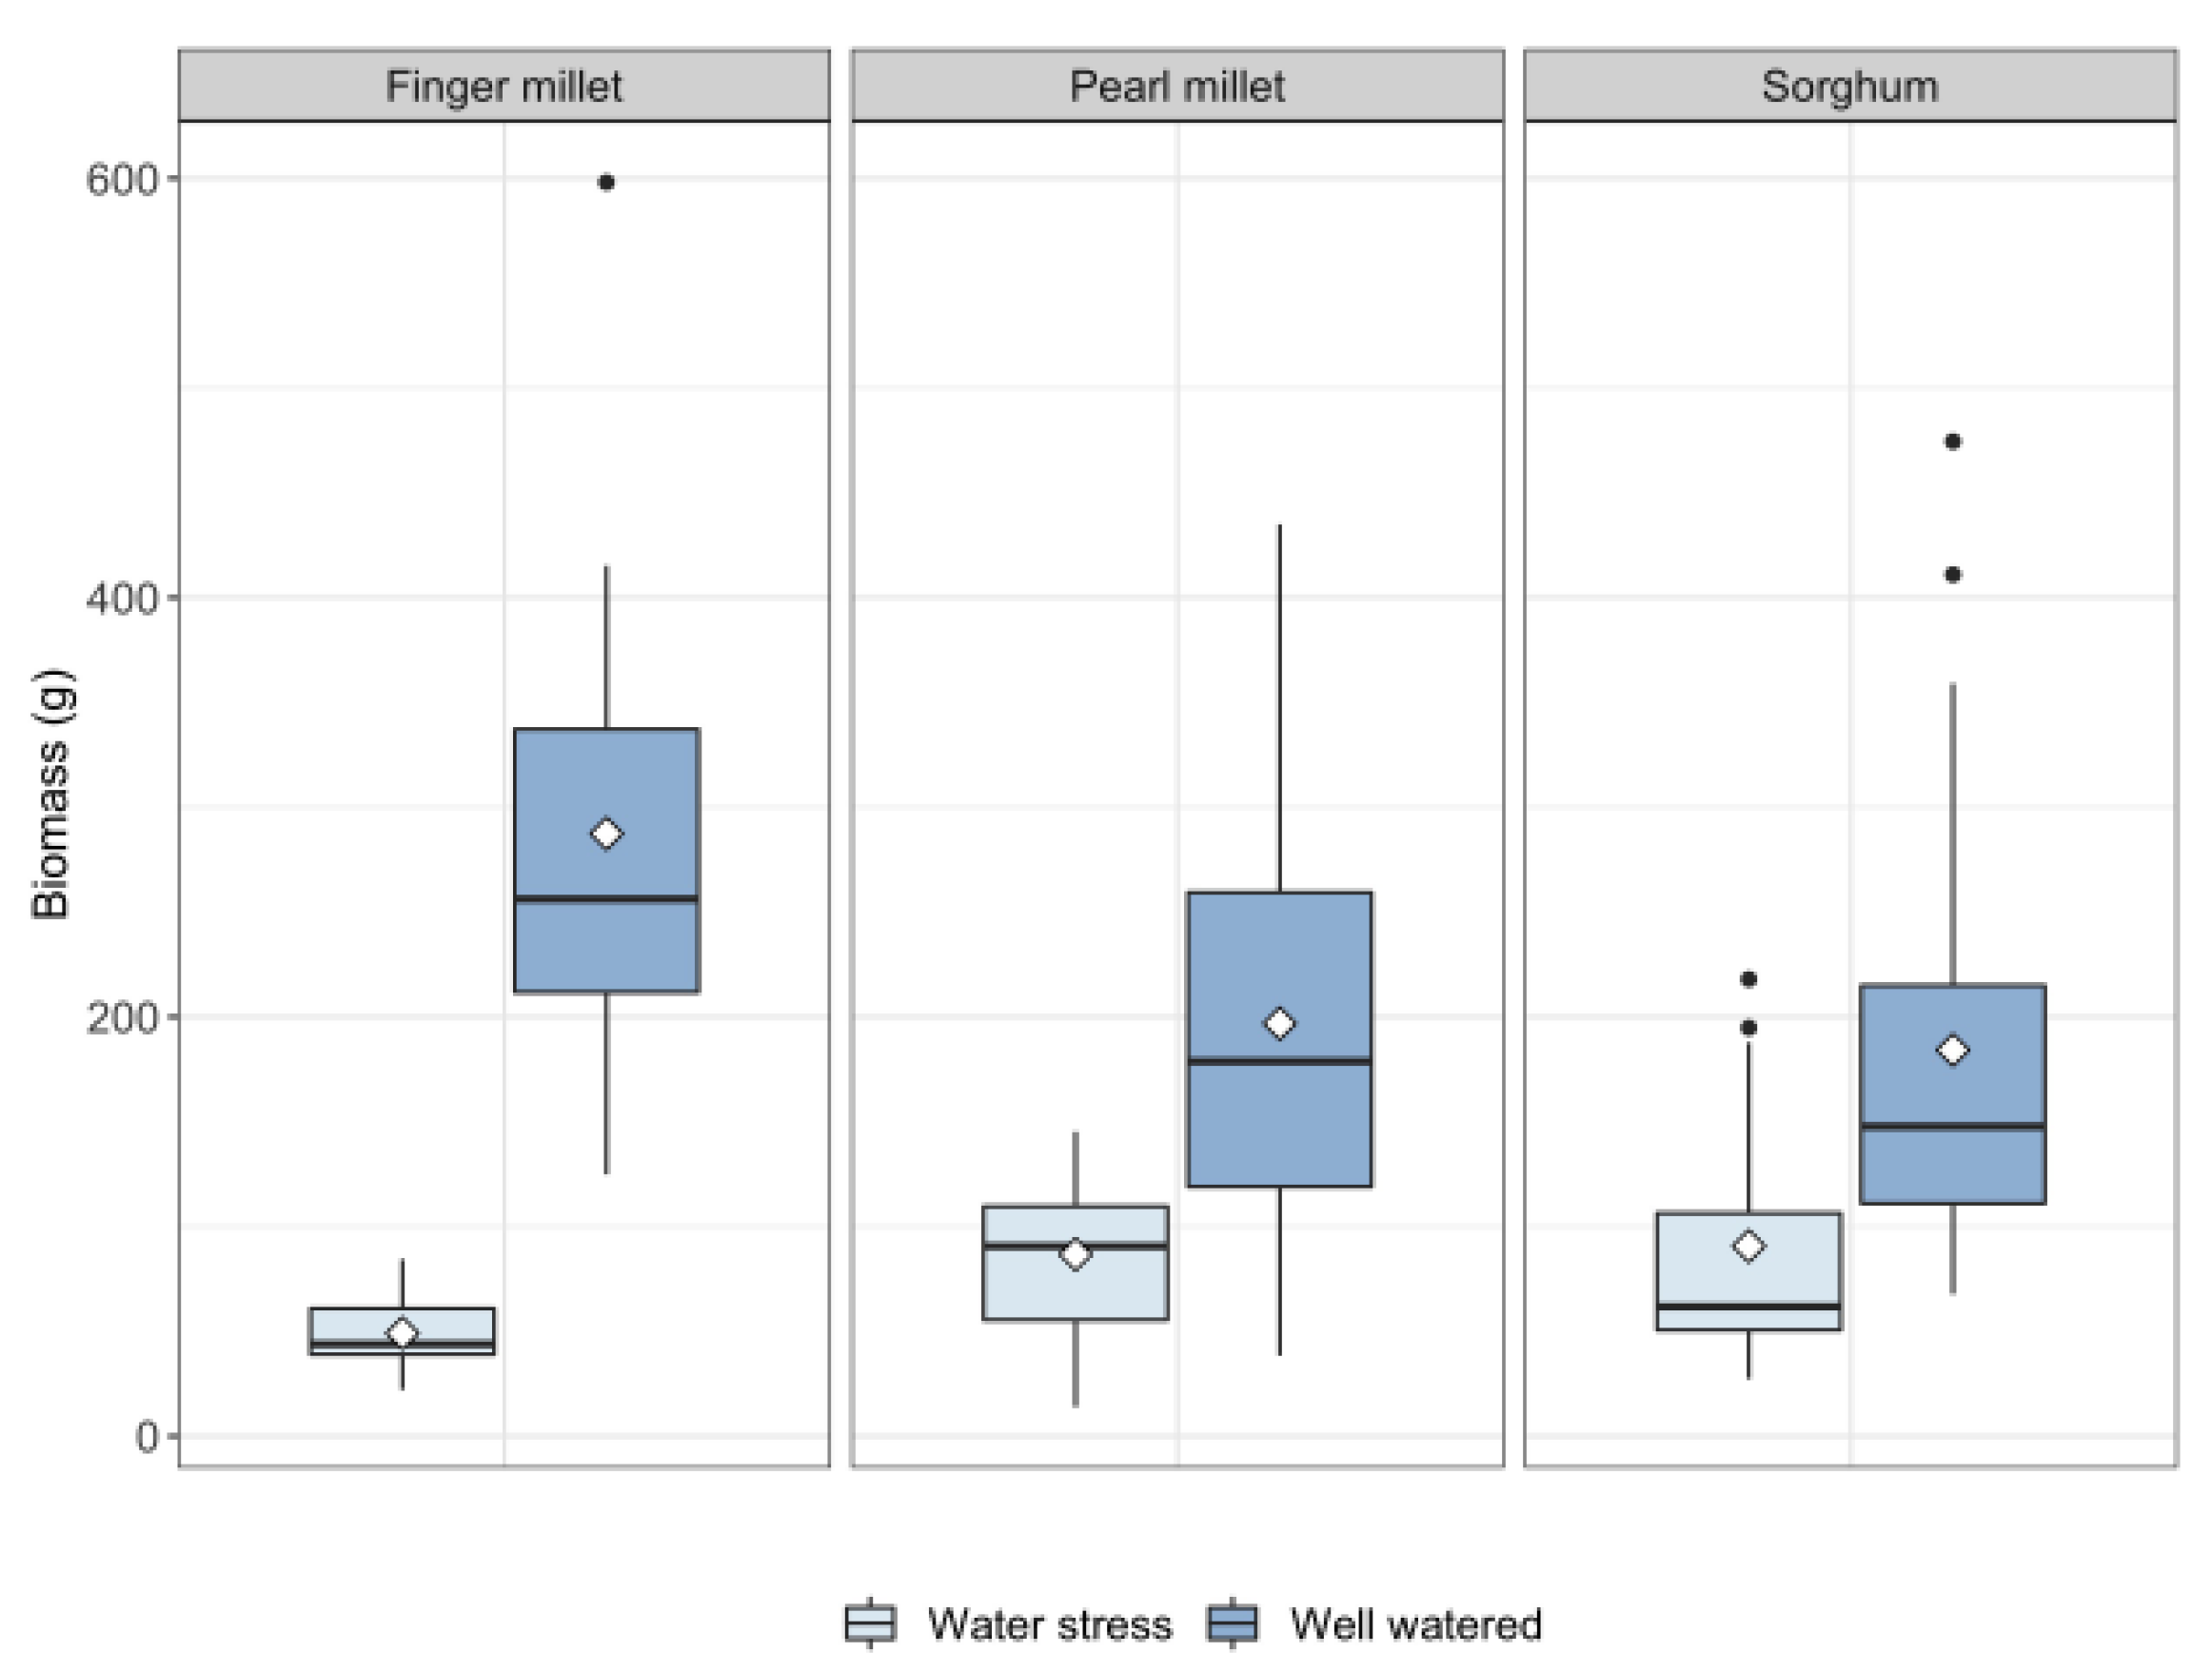
2.1. Plant Growth
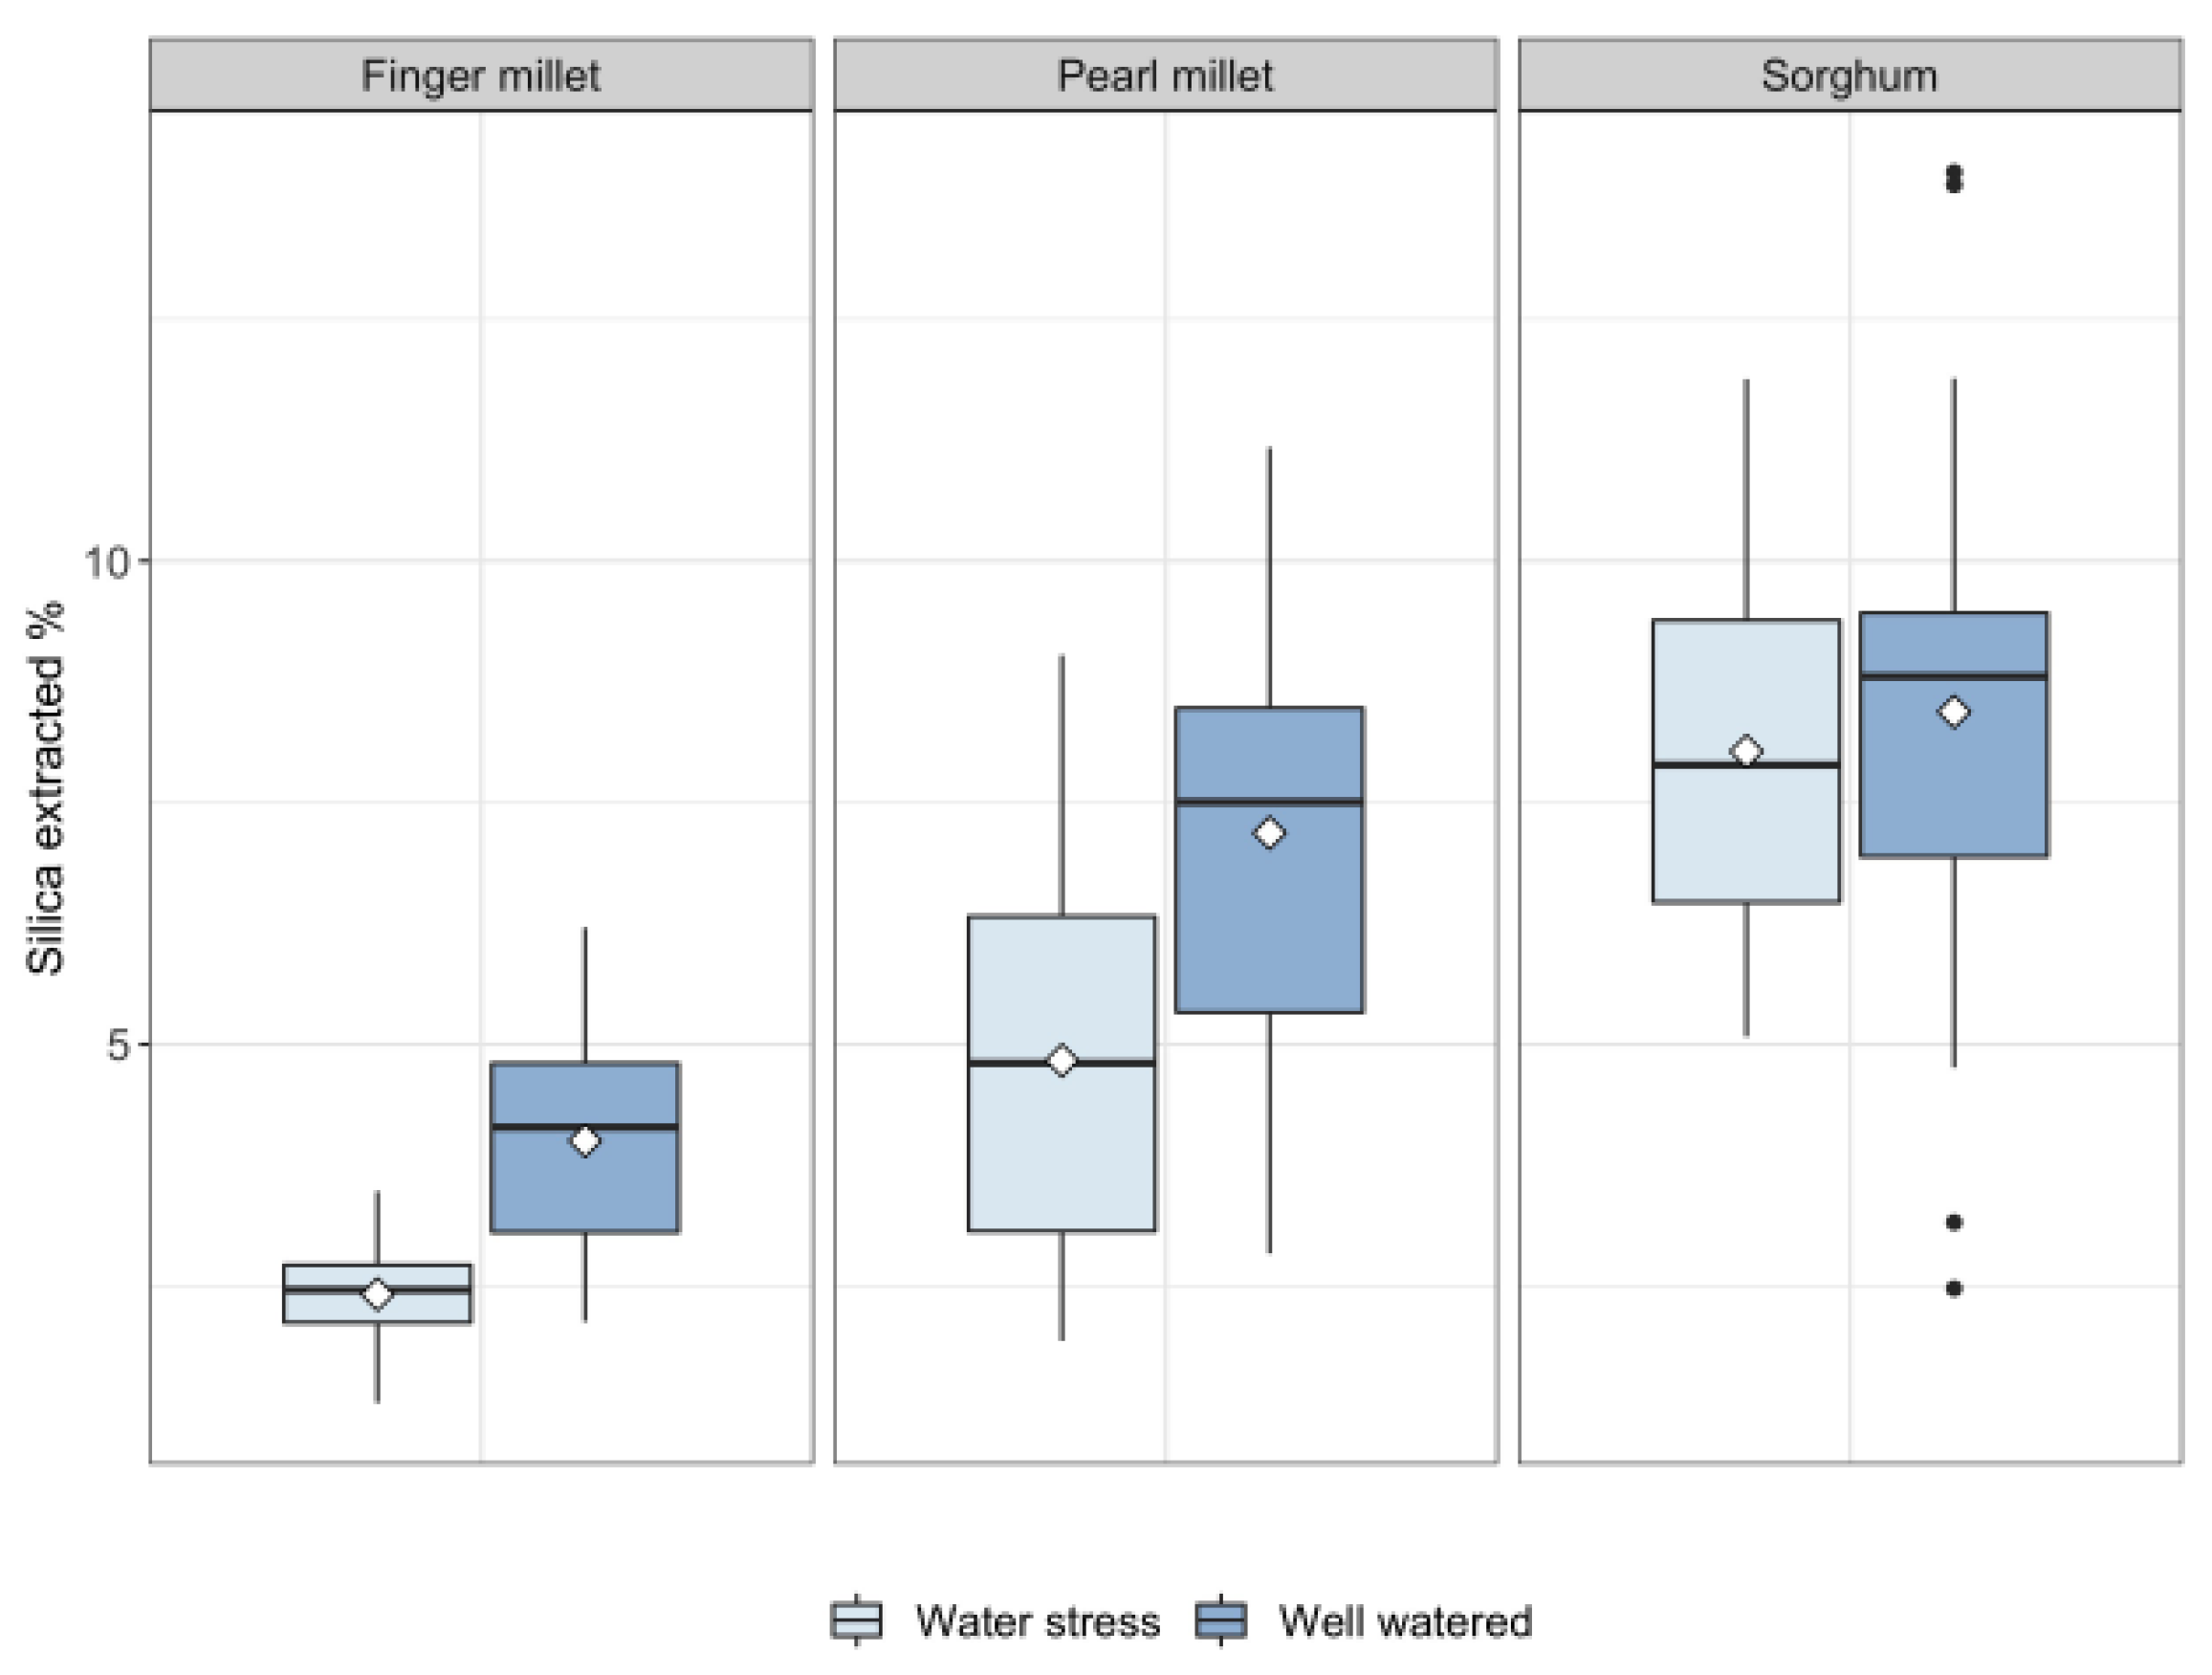
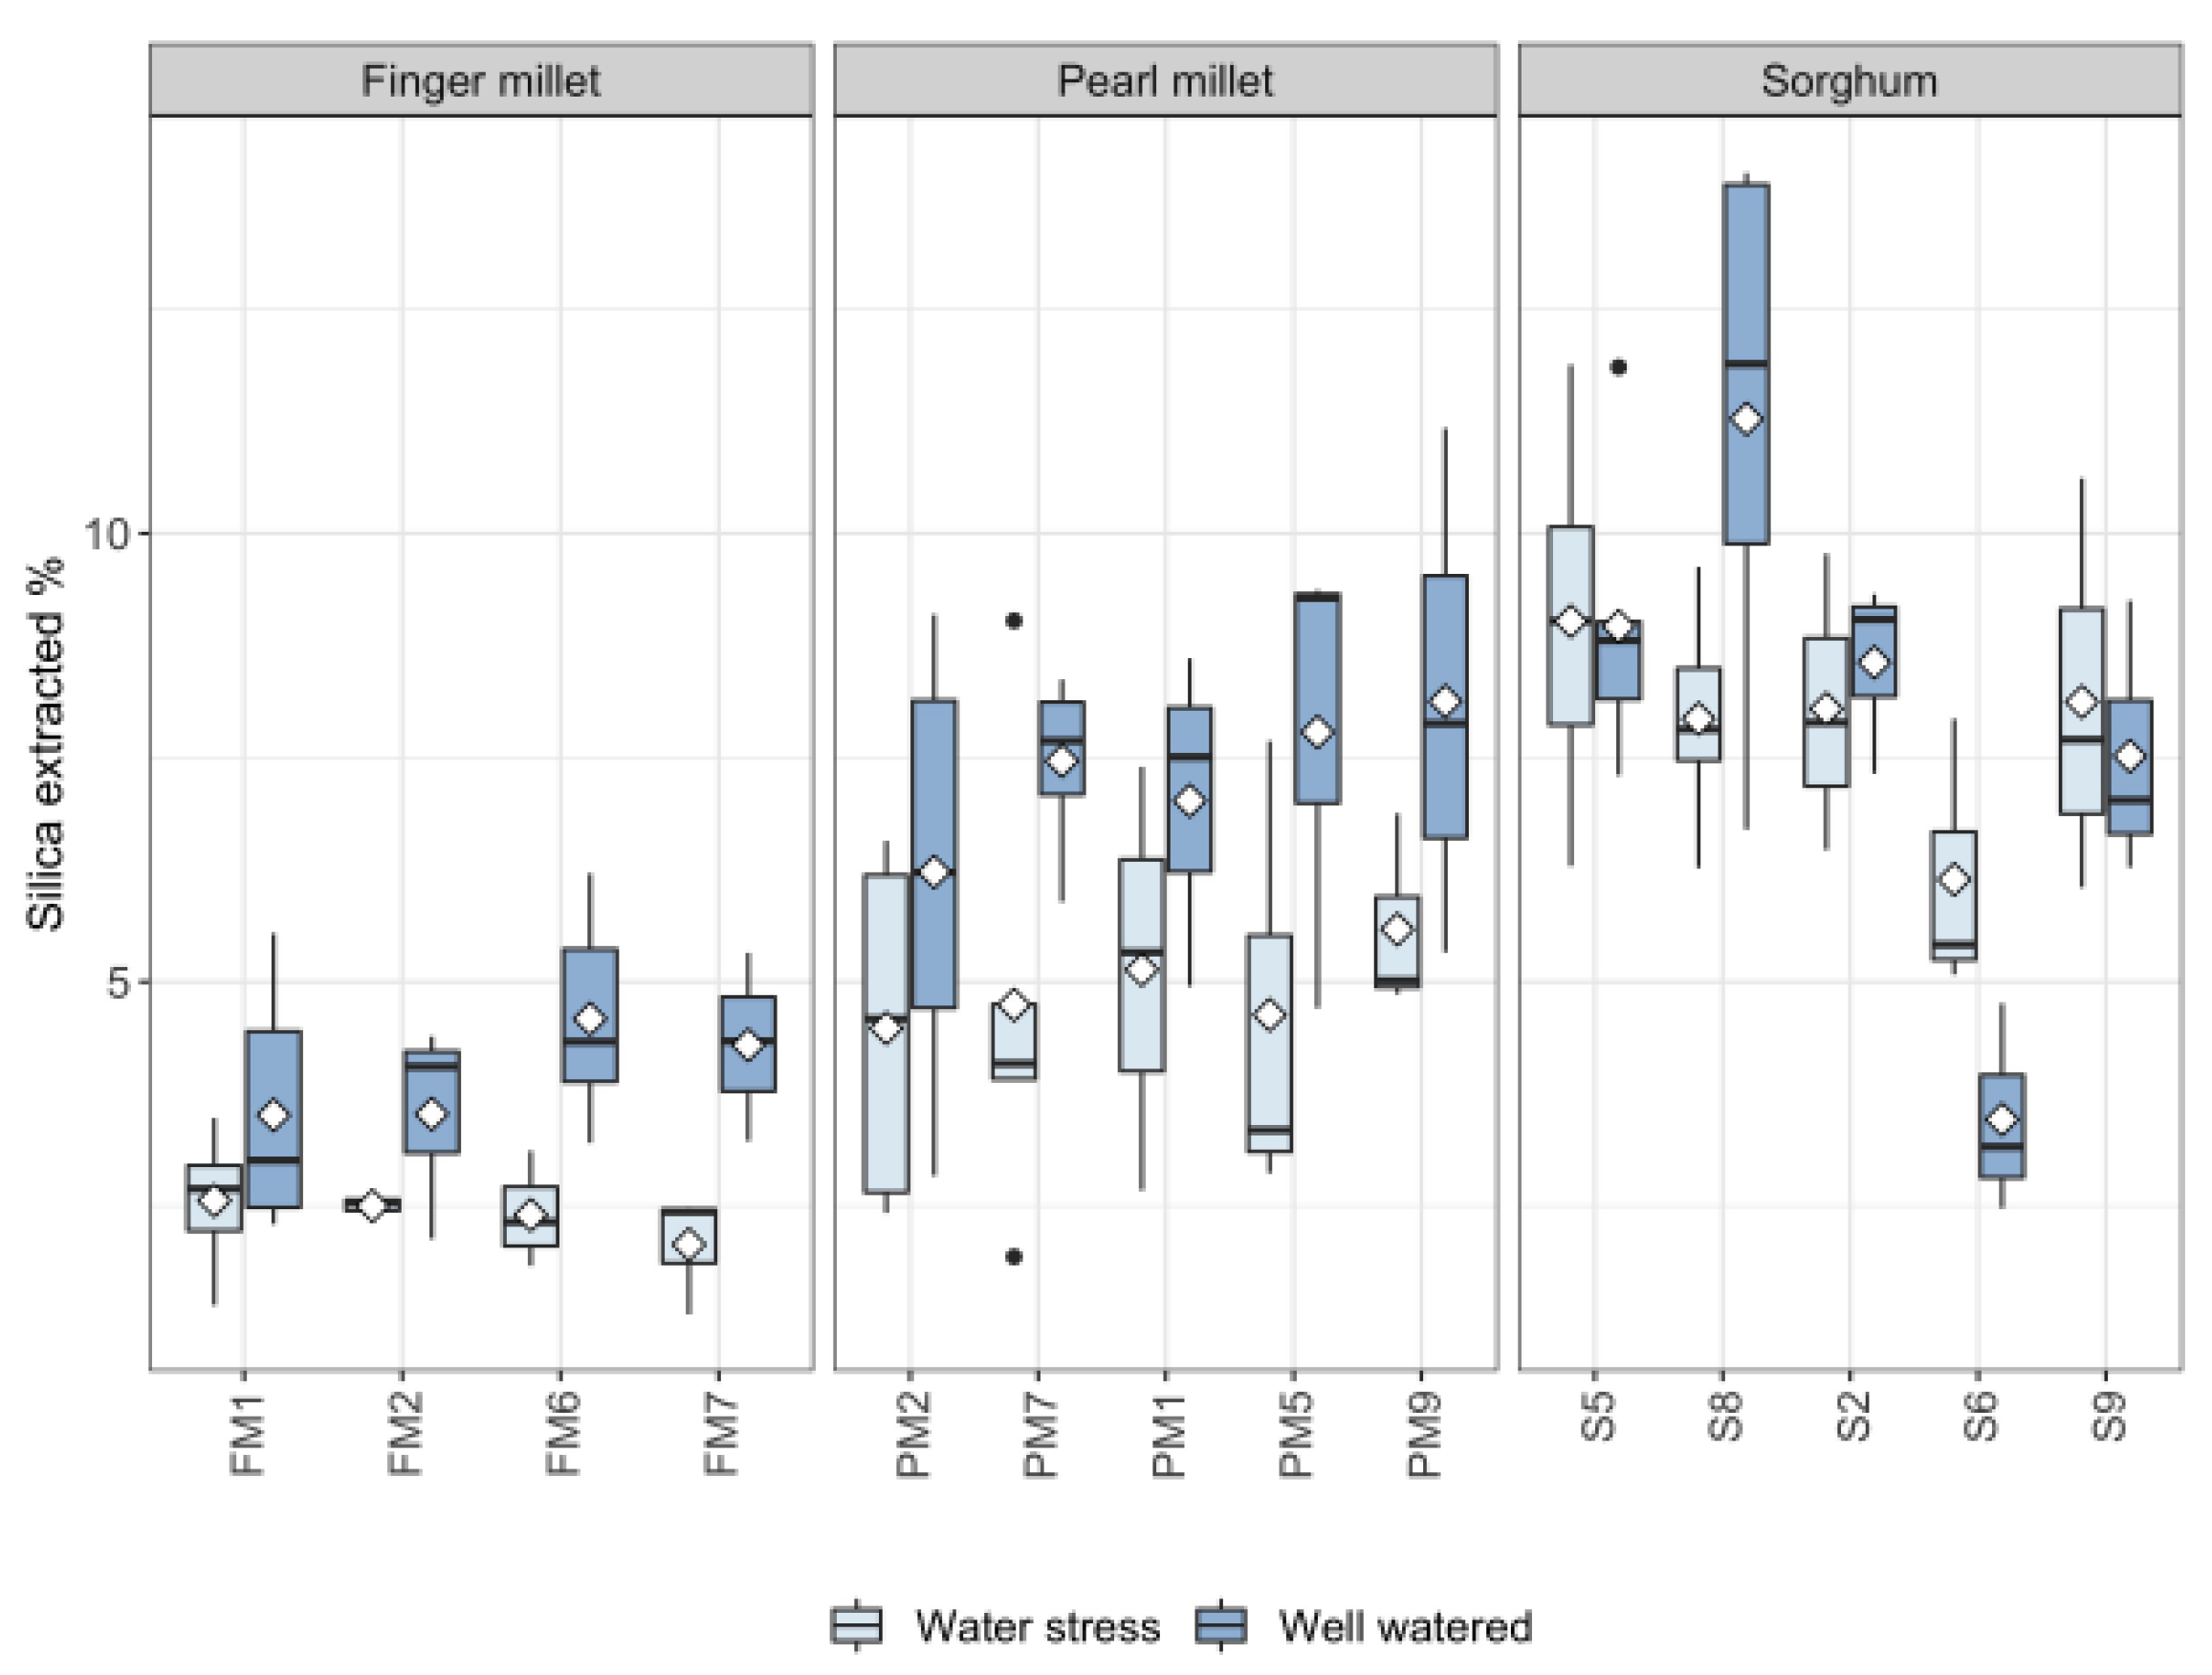
2.2. Silica in Leaves
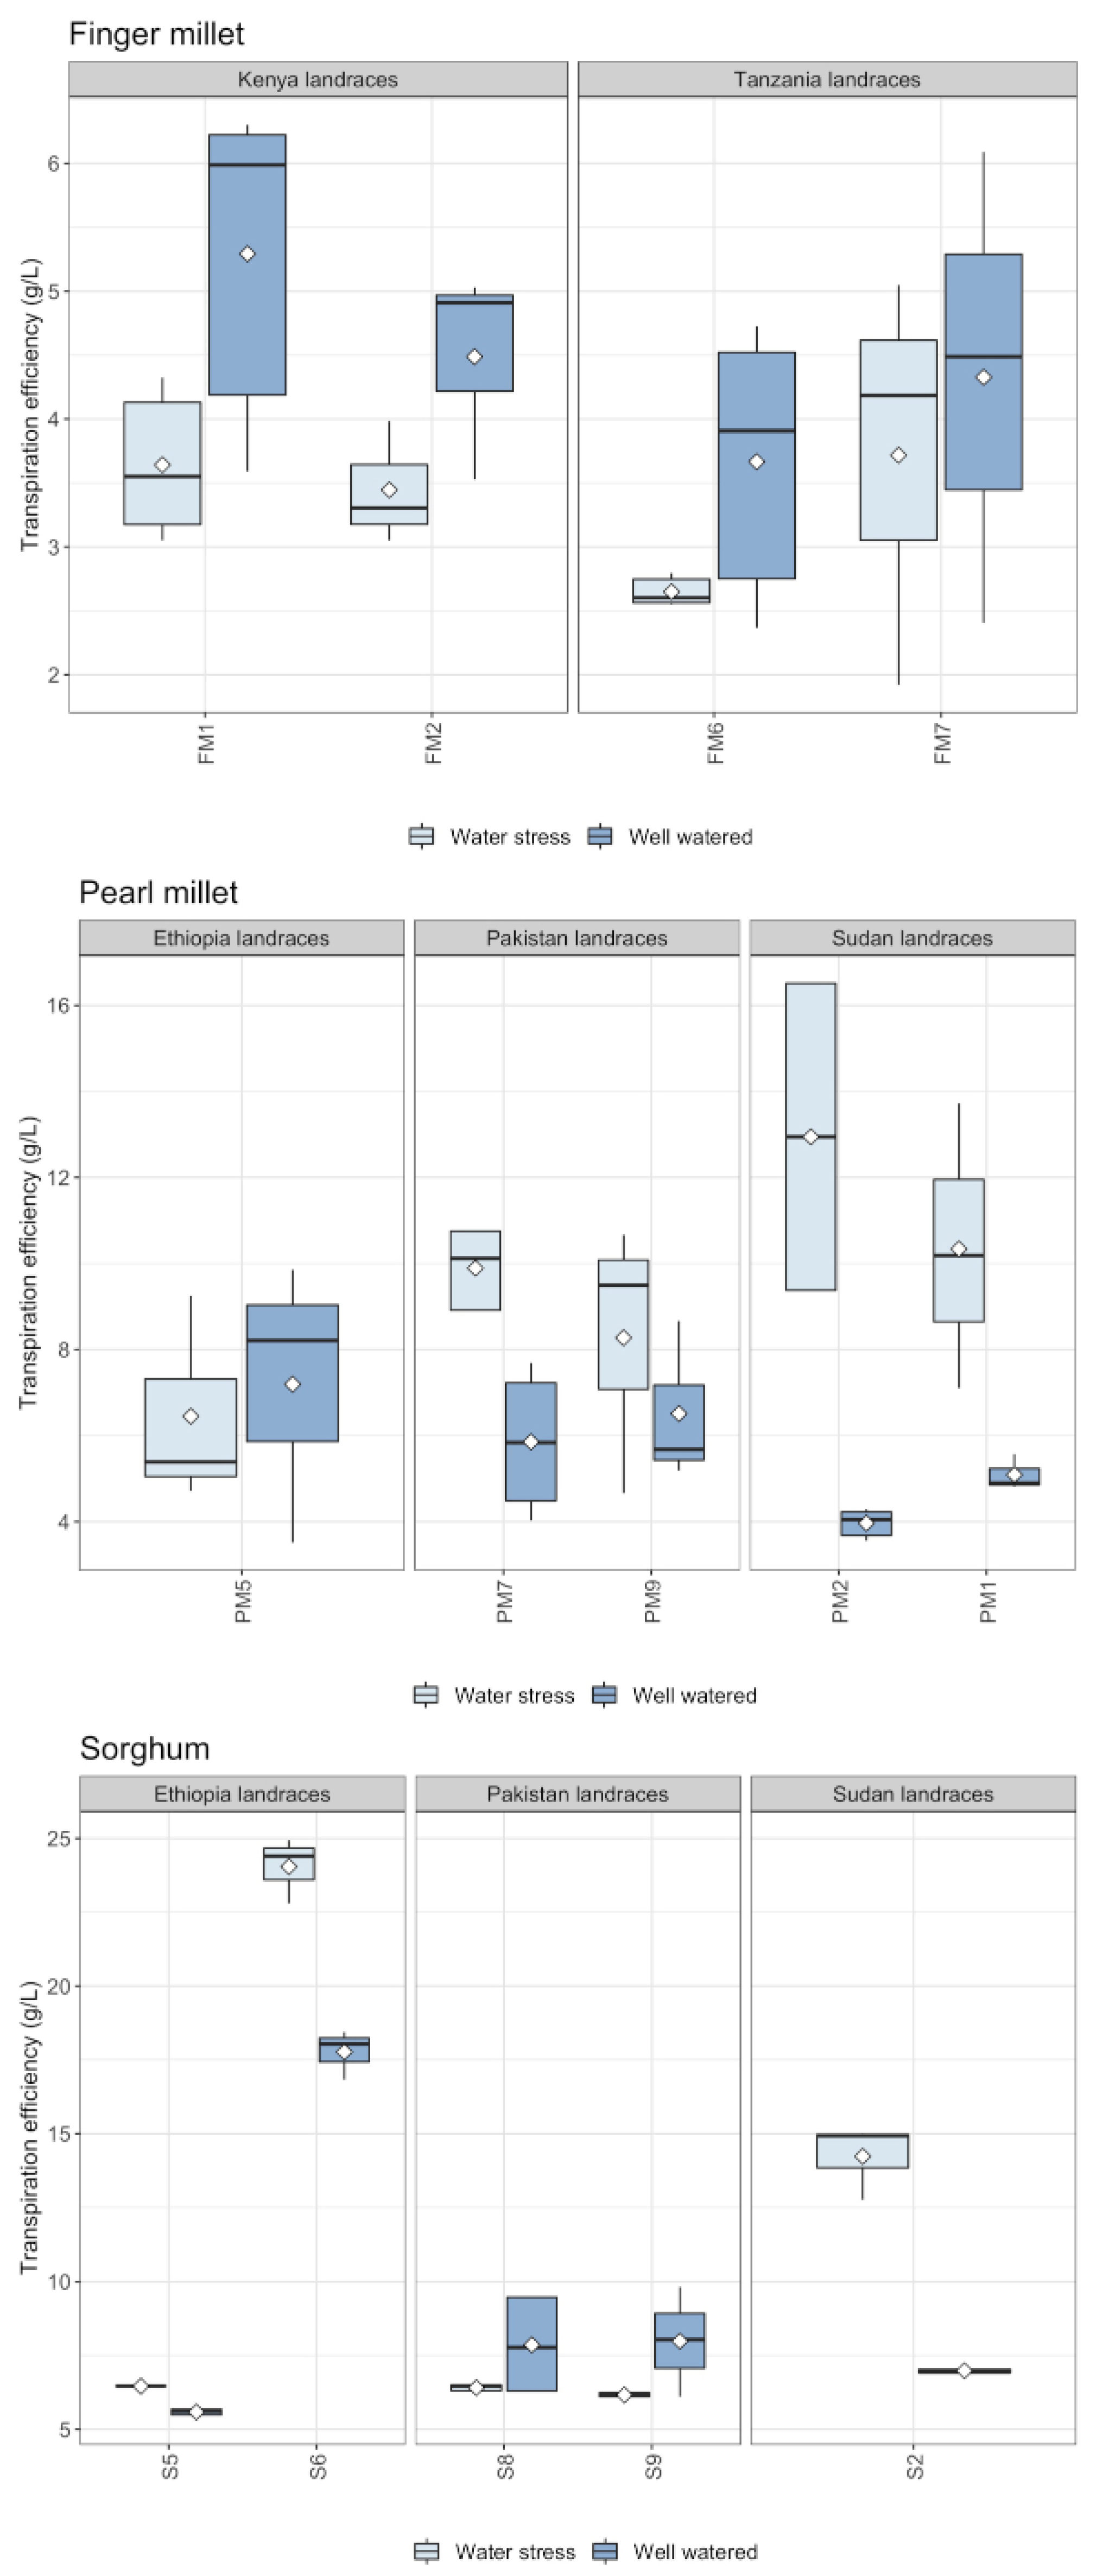
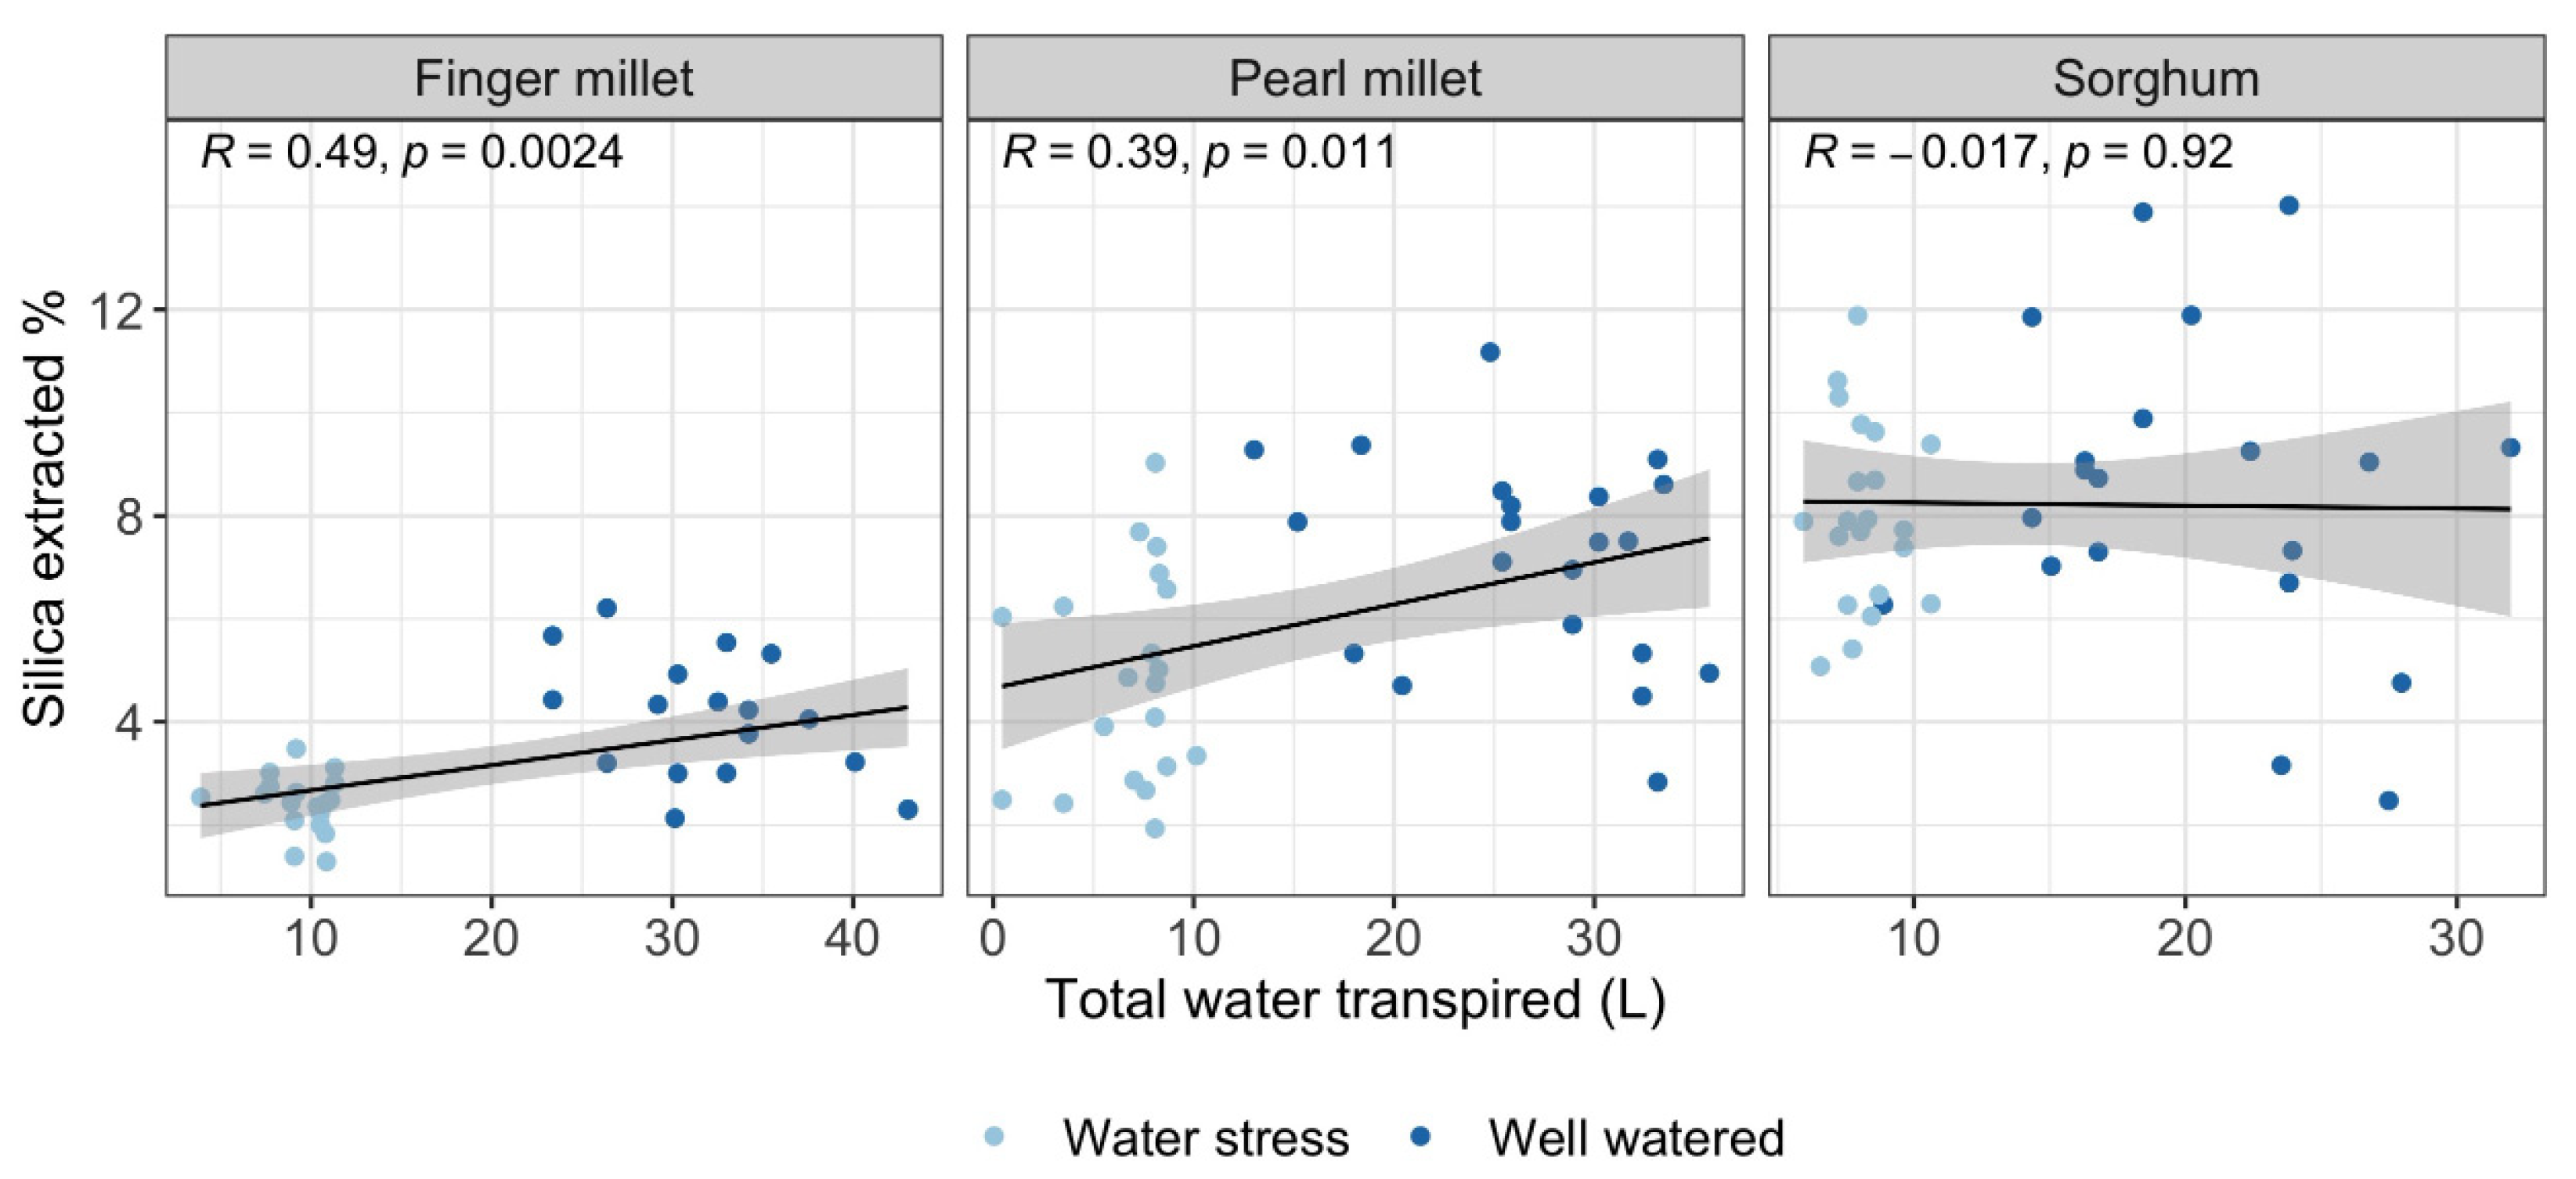
2.3. Silica Extracted and Physiological Parameters
3. Discussion
3.1. Biosilica Accumulation, Transpiration and Water Availability
3.2. Biosilica Accumulation and Genotypic Variation
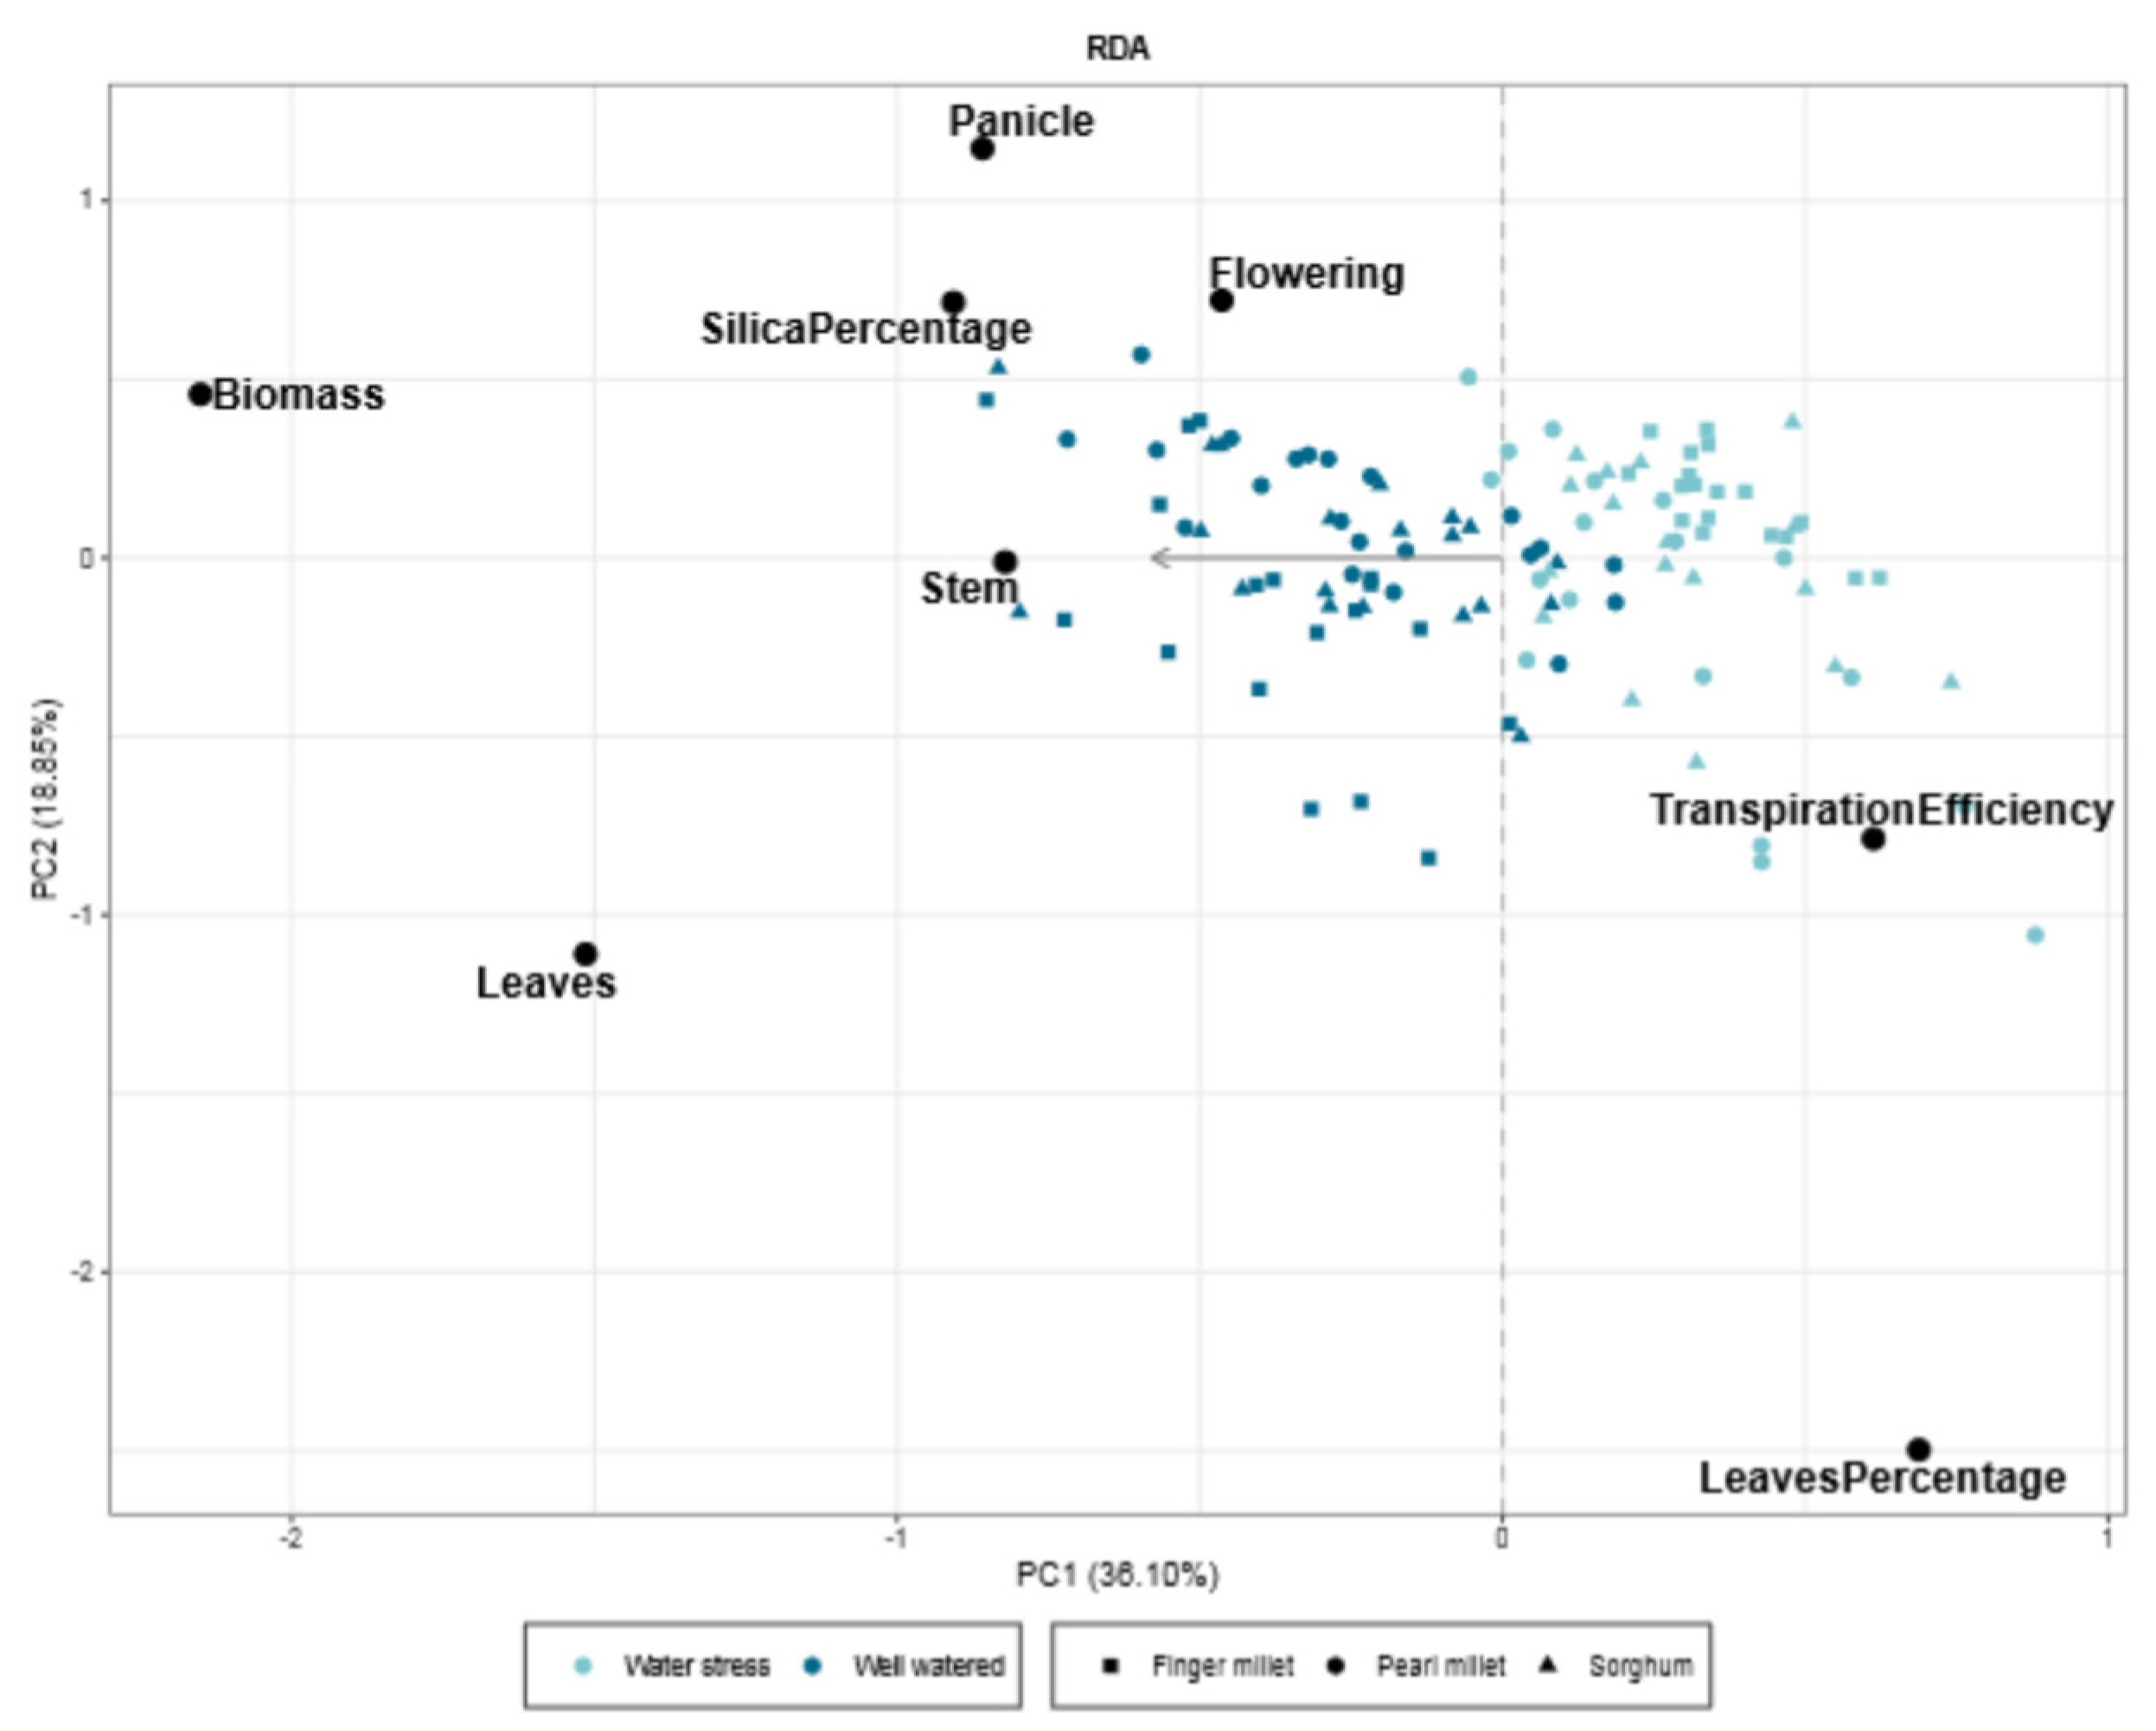
3.3. Biosilica Accumulation and Plant Physiology
4. Materials and Methods
4.1. Selection of Landraces
4.2. Experimental Cultivation in Lysimeters
4.3. Extraction Method from Leaf Samples
4.4. Statistical Analysis
5. Conclusions
- Water availability plays a fundamental role in determining biosilica accumulation in finger millet and pearl millet, which seem to be passive accumulators where transpiration-driven biosilica production prevails over genetic-mediated silica deposition. Therefore, we maintain that biosilica accumulation in finger millet and pearl millets is a good proxy for water availability;
- Based on the results obtained, different sorghum genotypes absorbed and accumulated silica differently. The relatively high magnitude of variability in response to water treatment suggests that biosilica accumulation in sorghum is not a good proxy for plant water availability. Indeed, sorghum is seemingly characterized by a transporter-governed mechanism, which possibly determines a high variability among genotypes. In the literature, the topic is rather controversial. The results of this paper lead to new perspectives, highlighting that not all the sorghum genotypes respond equally to biosilica accumulation;
- Both environmental conditions and genetic variability play distinct roles in biosilica accumulation, even within the same species.
Supplementary Materials
Author Contributions
Funding
Institutional Review Board Statement
Informed Consent Statement
Data Availability Statement
Acknowledgments
Conflicts of Interest
Sample Availability
References
- Sahebi, M.; Hanafi, M.M.; Siti Nor Akmar, A.; Rafii, M.Y.; Azizi, P.; Tengoua, F.F.; Nurul Mayzaitul Azwa, J.; Shabanimofrad, M. Importance of Silicon and Mechanisms of Biosilica Formation in Plants. Biomed Res. Int. 2014, 2015, 396010. [Google Scholar] [CrossRef] [PubMed]
- Ma, J.F.; Goto, S.; Tamai, K.; Ichii, M. Role of Root Hairs and Lateral Roots in Silicon Uptake by Rice. Plant Physiol. 2001, 127, 1773–1780. [Google Scholar] [CrossRef] [PubMed]
- Deshmukh, R.K.; Sonah, H.; Bélanger, R.R. Plant Aquaporins: Genome-Wide Identification, Transcriptomics, Proteomics, and Advanced Analytical Tools. Front. Plant Sci. 2016, 7, 1896. [Google Scholar] [CrossRef] [Green Version]
- Ma, J.F.; Yamaji, N. Silicon uptake and accumulation in higher plants. Trends Plant Sci. 2006, 11, 392–397. [Google Scholar] [CrossRef] [PubMed]
- Gaur, S.; Kumar, J.; Kumar, D.; Chauhan, D.K.; Prasad, S.M.; Srivastava, P.K. Fascinating impact of silicon and silicon transporters in plants: A review. Ecotoxicol. Environ. Saf. 2020, 202, 110885. [Google Scholar] [CrossRef] [PubMed]
- Nawaz, M.A.; Zakharenko, A.M.; Zemchenko, I.V.; Haider, M.S.; Ali, M.A.; Imtiaz, M.; Chung, G.; Tsatsakis, A.; Sun, S.; Golokhvast, K.S. Phytolith Formation in Plants: From Soil to Cell. Plants 2019, 8, 249. [Google Scholar] [CrossRef] [PubMed] [Green Version]
- Mitani, N.; Yamaji, N.; Ma, J.F. Identification of Maize Silicon Influx Transporters. Plant Cell Physiol. 2009, 50, 5–12. [Google Scholar] [CrossRef] [Green Version]
- Mitani, N.; Yamaji, N.; Ago, Y.; Iwasaki, K.; Ma, J.F. Isolation and functional characterization of an influx silicon transporter in two pumpkin cultivars contrasting in silicon accumulation: Pumpkin silicon transporter. Plant J. 2011, 66, 231–240. [Google Scholar] [CrossRef]
- Sun, H.; Guo, J.; Duan, Y.; Zhang, T.; Huo, H.; Gong, H. Isolation and functional characterization of CsLsi1, a silicon transporter gene in Cucumis sativus. Physiol. Plant. 2017, 159, 201–214. [Google Scholar] [CrossRef]
- Hodson, M.J. The Relative Importance of Cell Wall and Lumen Phytoliths in Carbon Sequestration in Soil: A Hypothesis. Front. Earth Sci. 2019, 7, 167. [Google Scholar] [CrossRef]
- Pearsall, D.M. Paleoethnobotany—A Handbook of Procedures, 3rd ed.; Routledge Taylor & Francis Group: New York, NY, USA, 2016. [Google Scholar]
- Kumar, S.; Soukup, M.; Elbaum, R. Silicification in Grasses: Variation between Different Cell Types. Front. Plant Sci. 2017, 8, 438. [Google Scholar] [CrossRef] [PubMed] [Green Version]
- Schaller, J.; Brackhage, C.; Paasch, S.; Brunner, E.; Bäucker, E.; Dudel, E.G. Silica uptake from nanoparticles and silica condensation state in different tissues of Phragmites australis. Sci. Total Environ. 2013, 442, 6–9. [Google Scholar] [CrossRef] [PubMed]
- Euliss, K.; Dorsey, B.; Benke, K.; Banks, M.; Schwab, A. The use of plant tissue silica content for estimating transpiration. Ecol. Eng. 2005, 25, 343–348. [Google Scholar] [CrossRef]
- Lux, A.; Luxova, M.; Hattori, T.; Inanaga, S.; Sugimoto, Y. Silicification in sorghum (Sorghum bicolor) cultivars with different drought tolerance. Physiol. Plant. 2002, 115, 87–92. [Google Scholar] [CrossRef] [PubMed]
- Motomura, H.; Mita, N.; Suzuki, M. Silica Accumulation in Long-lived Leaves of Sasa veitchii (Carrière) Rehder (Poaceae–Bambusoideae). Ann. Bot. 2002, 90, 149–152. [Google Scholar] [CrossRef] [PubMed]
- Katz, O. Silicon content is a plant functional trait: Implications in a changing world. Flora 2019, 254, 88–94. [Google Scholar] [CrossRef]
- Cornelis, J.; Delvaux, B. Soil processes drive the biological silicon feedback loop. Funct. Ecol. 2016, 30, 1298–1310. [Google Scholar] [CrossRef]
- Coskun, D.; Deshmukh, R.; Sonah, H.; Menzies, J.G.; Reynolds, O.; Ma, J.F.; Kronzucker, H.J.; Bélanger, R.R. The controversies of silicon’s role in plant biology. New Phytol. 2019, 221, 67–85. [Google Scholar] [CrossRef]
- Hosseini, S.A.; Maillard, A.; Hajirezaei, M.R.; Ali, N.; Schwarzenberg, A.; Jamois, F.; Yvin, J.C. Induction of Barley Silicon Transporter HvLsi1 and HvLsi2, increased silicon concentration in the shoot and regulated Starch and ABA Homeostasis under Osmotic stress and Concomitant Potassium Deficiency. Front. Plant Sci. 2017, 8, 1358. [Google Scholar] [CrossRef] [Green Version]
- Rodrigues, F.; Vale, F.; Korndörfer, G.; Prabhu, A.; Datnoff, L.; Oliveira, A.; Zambolim, L. Influence of silicon on sheath blight of rice in Brazil. Crop Prot. 2003, 22, 23–29. [Google Scholar] [CrossRef]
- Meunier, J.D.; Barboni, D.; Anwar-ul-Haq, M.; Levard, C.; Chaurand, P.; Vidal, V.; Grauby, O.; Huc, R.; Laffont-Schwob, I.; Rabier, J.; et al. Effect of phytoliths for mitigating water stress in durum wheat. New Phytol. 2017, 215, 229–239. [Google Scholar] [CrossRef] [PubMed] [Green Version]
- Cooke, J.; Leishman, M.R. Consistent alleviation of abiotic stress with silicon addition: A meta-analysis. Funct. Ecol. 2016, 30, 1340–1357. [Google Scholar] [CrossRef]
- Goto, M.; Ehara, H.; Karita, S.; Takabe, K.; Ogawa, N.; Yamada, Y.; Ogawa, S.; Yahaya, M.S.; Morita, O. Protective effect of silicon on phenolic biosynthesis and ultraviolet spectral stress in rice crop. Plant Sci. 2003, 164, 349–356. [Google Scholar] [CrossRef]
- Yoshida, S.; Ohnishi, Y.; Kitagishi, K. Histochemistry of Silicon in Rice Plant: III. The Presence of Cuticle-Silica Double Layer in the Epidermal Tissue. Soil Sci. Plant Nutr. 1962, 8, 1–5. [Google Scholar] [CrossRef]
- Gao, G.; Li, D.; Jie, D.; Li, N.; Liu, L.; Liu, H.; Wang, J.; Niu, H.; Meng, M.; Liu, Y.; et al. Application of soil phytoliths to the quantitative characterization of temperate grassland ecosystems: A case study in Northeast China. Plant Soil 2020, 459, 329–342. [Google Scholar] [CrossRef]
- Daoud, A.; Hemada, M.; Saber, N.; El-Araby, A.; Moussa, L. Effect of Silicon on the Tolerance of Wheat (Triticum aestivum L.) to Salt Stress at Different Growth Stages: Case Study for the Management of Irrigation Water. Plants 2018, 7, 29. [Google Scholar] [CrossRef] [Green Version]
- Mateos-Naranjo, E.; Andrades-Moreno, L.; Davy, A.J. Silicon alleviates deleterious effects of high salinity on the halophytic grass Spartina densiflora. Plant Physiol. Biochem. 2013, 63, 115–121. [Google Scholar] [CrossRef]
- Fauteux, F.; Rémus-Borel, W.; Menzies, J.G.; Bélanger, R.R. Silicon and plant disease resistance against pathogenic fungi. FEMS Microbiol. Lett. 2005, 249, 1–6. [Google Scholar] [CrossRef] [Green Version]
- Oliva, K.M.E.; da Silva, F.B.V.; Araújo, P.R.M.; de Oliveira, E.C.A.; do Nascimento, C.W.A. Amorphous Silica-Based Fertilizer Increases Stalks and Sugar Yield and Resistance to Stalk Borer in Sugarcane Grown Under Field Conditions. J. Soil Sci. Plant Nutr. 2021, 21, 2518–2529. [Google Scholar] [CrossRef]
- Jenkins, E.; Jamjoum, K.; Nuimat, S.; Stafford, R.; Nortcliff, S.; Mithen, S. Identifying ancient water availability through phytolith analysis: An experimental approach. J. Archaeol. Sci. 2016, 73, 82–93. [Google Scholar] [CrossRef] [Green Version]
- Madella, M.; Jones, M.; Echlin, P.; Powers-Jones, A.; Moore, M. Plant water availability and analytical microscopy of phytoliths: Implications for ancient irrigation in arid zones. Quat. Int. 2009, 193, 32–40. [Google Scholar] [CrossRef]
- Sage, R.F.; Zhu, X.G. Exploiting the engine of C4 photosynthesis. J. Exp. Bot. 2011, 62, 2989–3000. [Google Scholar] [CrossRef] [PubMed] [Green Version]
- Bräutigam, A.; Schliesky, S.; Külahoglu, C.; Osborne, C.P.; Weber, A.P. Towards an integrative model of C4 photosynthetic subtypes: Insights from comparative transcriptome analysis of NAD-ME, NADP-ME, and PEP-CK C4 species. J. Exp. Bot. 2014, 65, 3579–3593. [Google Scholar] [CrossRef] [PubMed] [Green Version]
- Furbank, R.T. Walking the C4 pathway: Past, present, and future. J. Exp. Bot. 2017, 68, 4057–4066. [Google Scholar] [CrossRef] [Green Version]
- Olsen, J.T.; Caudle, K.L.; Johnson, L.C.; Baer, S.G.; Maricle, B.R. Environmental and genetic variation in leaf anatomy among populations of (Poaceae) along a precipitation gradient. Am. J. Bot. 2013, 100, 1957–1968. [Google Scholar] [CrossRef] [Green Version]
- Flohr, P.; Jenkins, E.; Williams, H.R.S.; Jamjoum, K.; Nuimat, S.; Müldner, G. What can crop stable isotopes ever do for us? An experimental perspective on using cereal carbon stable isotope values for reconstructing water availability in semi-arid and arid environments. Veg. Hist. Archaeobotany 2019, 28, 497–512. [Google Scholar] [CrossRef] [Green Version]
- Lancelotti, C.; Biagetti, S.; Zerboni, A.; Usai, D.; Madella, M. The archaeology and ethnoarchaeology of rain-fed cultivation in arid and hyper-arid North Africa. Antiquity 2019, 93, 1026–1039. [Google Scholar] [CrossRef]
- Weisskopf, A.; Qin, L.; Ding, J.; Ding, P.; Sun, G.; Fuller, D.Q. Phytoliths and rice: From wet to dry and back again in the Neolithic Lower Yangtze. Antiquity 2015, 89, 1051–1063. [Google Scholar] [CrossRef] [Green Version]
- Hattori, T.; Inanaga, S.; Araki, H.; An, P.; Morita, S.; Luxova, M.; Lux, A. Application of silicon enhanced drought tolerance in Sorghum bicolor. Physiol. Plant. 2005, 123, 459–466. [Google Scholar] [CrossRef]
- Liang, Y.; Wong, J.; Wei, L. Silicon-mediated enhancement of cadmium tolerance in maize (Zea mays L.) grown in cadmium contaminated soil. Chemosphere 2005, 58, 475–483. [Google Scholar] [CrossRef]
- Li, X.; Siddique, K.H. (Eds.) Future Smart Food: Rediscovering Hidden Treasures of Neglected and Underutilized Species for Zero Hunger in Asia; UN: Bangkok, Thailand, 2018. [Google Scholar] [CrossRef]
- Saleem, S.; Ul Mushtaq, N.; Hafiz Shah, W.; Rasool, A.; Rehman Hakeem, K.; Ul Rehman, R. Morpho-Physiological, Biochemical and Molecular Adaptation of Millets to Abiotic Stresses: A Review. Phyton 2021, 90, 1363–1385. [Google Scholar] [CrossRef]
- Cousins, A.B.; Badger, M.R.; von Caemmerer, S. C4 photosynthetic isotope exchange in NAD-ME- and NADP-ME-type grasses. J. Exp. Bot. 2008, 59, 1695–1703. [Google Scholar] [CrossRef] [PubMed]
- Rao, X.; Dixon, R.A. The Differences between NAD-ME and NADP-ME Subtypes of C4 Photosynthesis: More than Decarboxylating Enzymes. Front. Plant Sci. 2016, 7, 1525. [Google Scholar] [CrossRef] [PubMed] [Green Version]
- Vatansever, R.; Ozyigit, I.I.; Filiz, E.; Gozukara, N. Genome-wide exploration of silicon (Si) transporter genes, Lsi1 and Lsi2 in plants; insights into Si-accumulation status/capacity of plants. BioMetals 2017, 30, 185–200. [Google Scholar] [CrossRef]
- Nikièma, M.P.; Ouédraogo, N.; Traoré, H.; Sawadogo, M.; Jankuloski, L.; Abdelbagi, M.A.G.; Yonli, D. Sorghum mutation breeding for tolerance to water deficit under climate change. J. Plant Breed. Crop Sci. 2020, 12, 192–199. [Google Scholar]
- Katz, O.; Puppe, D.; Kaczorek, D.; Prakash, N.B.; Schaller, J. Silicon in the Soil–Plant Continuum: Intricate Feedback Mechanisms within Ecosystems. Plants 2021, 10, 652. [Google Scholar] [CrossRef]
- Gao, C.; Wang, M.; Ding, L.; Chen, Y.; Lu, Z.; Hu, J.; Guo, S. High water uptake ability was associated with root aerenchyma formation in rice: Evidence from local ammonium supply under osmotic stress conditions. Plant Physiol. Biochem. 2020, 150, 171–179. [Google Scholar] [CrossRef]
- Faisal, S.; Callis, K.L.; Slot, M.; Kitajima, K. Transpiration-dependent passive silica accumulation in cucumber (Cucumis sativus) under varying soil silicon availability. Botany 2012, 90, 1058–1064. [Google Scholar] [CrossRef] [Green Version]
- Jenkins, E.; Predanich, L.; Nuimat, S.; Jamjoum, K.; Stafford, R. Assessing past water availability using phytoliths fro the C4 plant Sorghum bicolor: An experimental approah. J. Archaeol. Sci. 2020, 33, 102460. [Google Scholar] [CrossRef]
- Verma, K.K.; Song, X.P.; Lin, B.; Guo, D.J.; Singh, M.; Rajput, V.D.; Singh, R.K.; Singh, P.; Sharma, A.; Malviya, M.K.; et al. Silicon Induced Drought Tolerance in Crop Plants: Physiological Adaptation Strategies. Silicon 2021, 22, 1–15. [Google Scholar] [CrossRef]
- Hodson, M.J.; White, P.J.; Mead, A.; Broadley, M.R. Phylogenetic Variation in the Silicon Composition of Plants. Ann. Bot. 2005, 96, 1027–1046. [Google Scholar] [CrossRef] [PubMed] [Green Version]
- Li, Z.; Guo, F.; Cornelis, J.T.; Song, Z.; Wang, X.; Delvaux, B. Combined Silicon-Phosphorus Fertilization Affects the Biomass and Phytolith Stock of Rice Plants. Front. Plant Sci. 2020, 11, 67. [Google Scholar] [CrossRef] [PubMed] [Green Version]
- Nawaz, M.A.; Azeem, F.; Zakharenko, A.M.; Lin, X.; Atif, R.M.; Baloch, F.S.; Chan, T.F.; Chung, G.; Ham, J.; Sun, S.; et al. In-silico Exploration of Channel Type and Efflux Silicon Transporters and Silicification Proteins in 80 Sequenced Viridiplantae Genomes. Plants 2020, 9, 1612. [Google Scholar] [CrossRef] [PubMed]
- Mandlik, R.; Thakral, V.; Raturi, G.; Shinde, S.; Nikolić, M.; Tripathi, D.K.; Sonah, H.; Deshmukh, R. Significance of Silicon Uptake, Transport, and Deposition in plants. J. Exp. Bot. 2020, 71, 6703–6718. [Google Scholar] [CrossRef]
- Van Bel, M.; Diels, T.; Vancaester, E.; Kreft, L.; Botzki, A.; Van de Peer, Y.; Coppens, F.; Vandepoele, K. PLAZA 4.0: An integrative resource for functional, evolutionary and comparative plant genomics. Nucleic Acids Res. 2018, 46, D1190–D1196. [Google Scholar] [CrossRef]
- Coskun, D.; Deshmukh, R.; Shivaraj, S.M.; Isenring, P.; Bélanger, R.R. Lsi2: A black box in plant silicon transport. Plant Soil 2021, 466, 1–20. [Google Scholar] [CrossRef]
- Markovich, O.; Kumar, S.; Cohen, D.; Addadi, S.; Fridman, E.; Elbaum, R. Silicification in Leaves of Sorghum Mutant with Low Silicon Accumulation. Silicon 2019, 11, 2385–2391. [Google Scholar] [CrossRef]
- Jadhao, K.R.; Bansal, A.; Rout, G.R. Silicon amendment induces synergistic plant defense mechanism against pink stem borer (Sesamia inferens Walker.) in finger millet (Eleusine coracana Gaertn.). Sci. Rep. 2020, 10, 4229. [Google Scholar] [CrossRef] [Green Version]
- Khan, I.; Awan, S.A.; Rizwan, M.; Ali, S.; Hassan, M.J.; Brestic, M.; Zhang, X.; Huang, L. Effects of silicon on heavy metal uptake at the soil-plant interphase: A review. Ecotoxicol. Environ. Saf. 2021, 222, 112510. [Google Scholar] [CrossRef]
- Majumdar, S.; Prakash, N.B. An Overview on the Potential of Silicon in Promoting Defence Against Biotic and Abiotic Stresses in Sugarcane. J. Soil Sci. Plant Nutr. 2020, 20, 1969–1998. [Google Scholar] [CrossRef]
- Sacala, E. Role of Silicon in Plant Resistance to Water Stress. J. Elementol. 2009, 14, 619–630. [Google Scholar] [CrossRef]
- Vaculík, M.; Lukačová, Z.; Bokor, B.; Martinka, M.; Tripathi, D.K.; Lux, A. Alleviation mechanisms of metal(loid) stress in plants by silicon: A review. J. Exp. Bot. 2020, 71, 6744–6757. [Google Scholar] [CrossRef] [PubMed]
- Mitani, N.; Ma, J.F. Uptake system of silicon in different plant species. J. Exp. Bot. 2005, 56, 1255–1261. [Google Scholar] [CrossRef] [PubMed] [Green Version]
- Harris, I.; Jones, P.; Osborn, T.; Lister, D. Updated high-resolution grids of monthly climatic observations—The CRU TS3.10 Dataset. Int. J. Climatol. 2013, 34, 623–642. [Google Scholar] [CrossRef] [Green Version]
- Vadez, V. Stay-green quantitative trait loci’s effects on water extraction, transpiration efficiency and seed yield depend on recipient parent background. Funct. Plant Biol. 2011, 38, 553–566. [Google Scholar] [CrossRef] [Green Version]
- Vadez, V. Yield, transpiration efficiency, and water-use variations and their interrelationships in the sorghum reference collection. Crop Pasture Sci. 2011, 62, 645–655. [Google Scholar] [CrossRef] [Green Version]
- Poorter, H.; Bühler, J.; van Dusschoten, D.; Climent, J.; Postma, J.A. Pot size matters: A meta-analysis of the effects of rooting volume on plant growth. Funct. Plant Biol. 2012, 39, 839–850. [Google Scholar] [CrossRef] [Green Version]
- Lightfoot, E.; Ustunkaya, M.C.; Przelomska, N.; O’Connell, T.C.; Hunt, H.V.; Jones, M.K.; Petrie, C.A. Carbon and nitrogen isotopic variability in foxtail millet (Setaria italica) with watering regime. Rapid Commun. Mass Spectrom. 2019, 34, e8615. [Google Scholar] [CrossRef] [Green Version]
- Oddo, E.; D’Asaro, G.; Monti, E.; Signa, G.; Vizzini, S.; Sajeva, M. Carbon and nitrogen isotopic values in Lithops aucampiae during leaf development. Plant Physiol. Biochem. 2021, 165, 196–199. [Google Scholar] [CrossRef]
- Portmann, F.T.; Siebert, S.; Döll, P. MIRCA2000-Global monthly irrigated and rainfed crop areas around the year 2000: A new high-resolution data set for agricultural and hydrological modeling. Glob. Biogeochem. Cycles 2010, 24, 1–24. [Google Scholar] [CrossRef]
- Vadez, V.; Choudhary, S.; Kholova, J.; Hash, C.T.; Srivastava, R.; Kumar, A.A.; Prandavada, A.; Anjaiah, M. Transpiration efficiency: Further insights from C4 cereals species comparison. J. Exp. Bot. 2021, 72, 5221–5234. [Google Scholar] [CrossRef] [PubMed]
- Vadez, V. Small temporal differences in water uptake among varieties of pearl millet (Pennisetum glaucum (L.) R. Br.) are critical for grain yield under terminal drought. Plant Soil 2013, 371, 447–462. [Google Scholar] [CrossRef] [Green Version]
- Schuster, A.C.; Burghardt, M.; Alfarhan, A.; Bueno, A.; Hedrich, R.; Leide, J.; Thomas, J.; Riederer, M. Effectiveness of cuticular transpiration barriers in a desert plant at controlling water loss at high temperatures. AoB Plants 2016, 8, plw027. [Google Scholar] [CrossRef] [PubMed]
- Schuster, A.C.; Burghardt, M.; Riederer, M. The ecophysiology of leaf cuticular transpiration: Are cuticular water permeabilities adapted to ecological conditions? J. Exp. Bot. 2017, 68, 5271–5279. [Google Scholar] [CrossRef] [Green Version]
- Greenacre, M. Compositional Data Analysis in Practice; Chapman and Hall/CRC: New York, NY, USA, 2018. [Google Scholar]
- Zuur, A.F.; Ieno, E.N.; Smith, G.M. Analysing Ecological Data; Statistics for Biology and Health; Springer: New York, NY, USA, 2007. [Google Scholar]
- Legendre, P.; Gallagher, E.D. Ecologically meaningful transformations for ordination of species data. Oecologia 2001, 129, 271–280. [Google Scholar] [CrossRef]
- Legendre, P.; Legendre, L. Numerical Ecology; Elsevier: Amsterdam, The Netherlands, 2012. [Google Scholar]
- Wickham, H. ggplot2: Elegant Graphics for Data Analysis; Springer: New York, NY, USA, 2016. [Google Scholar]
- Oksanen, J.; Blanchet, F.G.; Friendly, M.; Kindt, R.; Legendre, P.; McGlinn, D.; Minchin, P.R.; O’Hara, R.B.; Simpson, G.L.; Solymos, P.; et al. Vegan: Community Ecology Package, R Package Version 2.5-7. 2020.


| Total Water Transpired | Total Biomass | Leaf Biomass | |
|---|---|---|---|
| Sorghum | WW: 20.38 ± 5.77 L WS: 8.19 ± 1.19 L | WW: 184.22 ± 112.63 g WS: 90.66 ± 60.70 g | WW: 24.02 ± 19.97 g WS: 14.75 ± 11.84 g |
| Pearl millet | WW: 26.78 ± 6.51 L WS: 6.72 ± 2.68 L | WW: 196.84 ± 100.57 g WS: 86.71 ± 38.81 g | WW: 10.76 ± 5.42 g WS: 8.03 ± 6.04 g |
| Finger millet | WW: 32.52 ± 5.88 L WS: 9.42 ± 1.87 L | WW: 287.42 ± 111.90 g WS: 49.10 ± 16.56 g | WW: 31.31 ± 11.38 g WS: 5.56 ± 1.71 g |
| Model Predictors | Adjusted R-Squared |
|---|---|
| Water treatment | 0.050 |
| Species | 0.475 |
| Genotype | 0.540 |
| Water treatment + Genotype | 0.608 |
| Water treatment × Genotype | 0.635 |
| Sudan | Ethiopia | Pakistan | Kenya | Tanzania | |
|---|---|---|---|---|---|
| Climatic data Mean temperature Average sun hours Precipitation Rainy days Humidity | 32.79 °C 10.9 h 70 mm 13 days 25.16% | 27.63 °C 10.5 h 519 mm 60 days 37.16% | 27.34 °C 10.7 h 152 mm 15 days 44.66% | 30.03 °C 10.5 h 213 mm 25 days 47.91% | 24.89 °C 10.3 h 602 mm 63 days 49.33% |
| Sorghum | S2: IS23075 | S5: IS11061 S6: IS38025 | S8: IS35215 S9: IS35216 | ||
| Pearl millet | PM1:IP13327 PM2: IP9859 | PM5: IP2367 | PM7: IP18019 PM9: IP18021 | ||
| Finger millet | FM1: IE2511 FM2: IE3476 | FM6: IE4450 FM7: IE4456 |
Publisher’s Note: MDPI stays neutral with regard to jurisdictional claims in published maps and institutional affiliations. |
© 2022 by the authors. Licensee MDPI, Basel, Switzerland. This article is an open access article distributed under the terms and conditions of the Creative Commons Attribution (CC BY) license (https://creativecommons.org/licenses/by/4.0/).
Share and Cite
D’Agostini, F.; Vadez, V.; Kholova, J.; Ruiz-Pérez, J.; Madella, M.; Lancelotti, C. Understanding the Relationship between Water Availability and Biosilica Accumulation in Selected C4 Crop Leaves: An Experimental Approach. Plants 2022, 11, 1019. https://0-doi-org.brum.beds.ac.uk/10.3390/plants11081019
D’Agostini F, Vadez V, Kholova J, Ruiz-Pérez J, Madella M, Lancelotti C. Understanding the Relationship between Water Availability and Biosilica Accumulation in Selected C4 Crop Leaves: An Experimental Approach. Plants. 2022; 11(8):1019. https://0-doi-org.brum.beds.ac.uk/10.3390/plants11081019
Chicago/Turabian StyleD’Agostini, Francesca, Vincent Vadez, Jana Kholova, Javier Ruiz-Pérez, Marco Madella, and Carla Lancelotti. 2022. "Understanding the Relationship between Water Availability and Biosilica Accumulation in Selected C4 Crop Leaves: An Experimental Approach" Plants 11, no. 8: 1019. https://0-doi-org.brum.beds.ac.uk/10.3390/plants11081019