Article

Genetic Control of Reproductive Traits under Different Temperature Regimes in Inbred Line Populations Derived from Crosses between S. pimpinellifolium and S. lycopersicum Accessions

by
Maria Jose Gonzalo
1,
Luciano Carlos da Maia
1,2,
Inmaculada Nájera
3,
Carlos Baixauli
3,
Giovanni Giuliano
4,
Paola Ferrante
4,
Antonio Granell
1,
Maria Jose Asins
5 and
Antonio Jose Monforte
1,*
1
Instituto de Biología Molecular y Celular de Plantas, Universitat Politècnica de València-Consejo Superior de Investigaciones Científicas, 46010 Valencia, Spain
2
Plant Genomics and Breeding Center, Faculdade de Agronomia Eliseu Maciel, Universidade Federal de Pelotas, Pelotas 96010-610, RS, Brazil
3
Centro de Experiencias de Cajamar en Paiporta, 46200 Paiporta, Spain
4
Agenzia Nazionale Per Le Nuove Tecnologie, L’energia e Lo Sviluppo Economico Sostenibile (ENEA), Casaccia Research Centre, Via Anguillarese 301, 00123 Rome, Italy
5
Instituto Valenciano de Investigaciones Agrarias (IVIA), Carretera Moncada-Náquera, Km 4.5, Moncada, 46113 Valencia, Spain
*
Author to whom correspondence should be addressed.
Submission received: 22 March 2022 / Revised: 8 April 2022 / Accepted: 11 April 2022 / Published: 14 April 2022
(This article belongs to the Special Issue Response of Tomato Genotypes to High Temperature)

Abstract

:
In the present work, we study the genetic control of reproductive traits under different heat stress conditions in two populations of inbred lines derived from crosses between two S. pimpinellifolium accessions and two tomato cultivars (E9×L5 and E6203×LA1589). The temperature increase affected the reproductive traits, especially at extremely high temperatures, where only a few lines were able to set fruits. Even though a relative modest number of QTLs was identified, two clusters of QTLs involved in the responses of reproductive traits to heat stress were detected in both populations on chromosomes 1 and 2. Interestingly, several epistatic interactions were detected in the E9×L5 population, which were classified into three classes based on the allelic interaction: dominant (one locus suppressed the allelic effects of a second locus), co-adaptive (the double-homozygous alleles from the same parent alleles showed a higher phenotypic value than the combination of homozygous alleles from alternative parents) and transgressive (the combination of double-homozygous alleles from different parents showed better performance than double-homozygous alleles from the same parents). These results reinforce the important role of non-additive genetic variance in the response to heat stress and the potential of the new allelic combinations that arise after wide crosses.

1. Introduction

The Intergovernmental Panel on Climate Change (IPCC) estimates an increase in average temperatures from 2 to 4.5 °C within the 21st century [1]. In this scenario of global warming, agriculture is expected to be one of the most affected sectors [2], with negative impacts on crop productivity due to the effects of high temperatures on plant development [3,4]. The major losses due to heat stress are expected to occur in low-latitude regions (temperate and tropical areas), with temperatures exceeding even the most extreme seasonal temperatures recorded to date [5]. In fact, yield reductions due to heat stress have already been documented in many crops from these geographical areas, such as wheat, rice, barley, sorghum, maize, chickpea, canola and more [6,7,8].
Tomato (Solanum lycopersicum L.) is one of the most extensively cultivated crops in temperate regions worldwide [9]. The cultivation of this crop is affected by high temperature, which can cause different physiological or morphological injuries, such as reductions in plant growth and development or damage to reproductive organs and pollen [10,11,12,13]. As a consequence, agronomic yield reductions have already been reported due to heat stress [6].
Thus, there is an urgent need to increase the knowledge of the genetic responses to heat stress, considering that heat tolerance is a complex trait affected by numerous factors [14], and to develop plant breeding strategies to face this problem. Reproductive traits have been commonly used to study the responses to heat stress in tomato plants. The flower number per inflorescence decreases due to heat stress [15,16], and the ability of plants to set fruit after the exposure to high temperatures is the most commonly studied trait. This trait is quite complex, involving physiology, biochemistry and gene regulation pathways [3], affecting aspects ranging from the pollen viability [12,14,17], photosynthesis and respiration [18] to activation or silencing of genes [19,20]. Additionally, the fruit set is directly correlated with the final agronomic yield. Therefore, the fruit set at high temperature is considered a good indicator of heat tolerance in tomatoes, and it has been widely studied in previous works [14,16,21,22,23]. Only a very limited number of cultivated varieties or accessions have been identified as heat-tolerant [10,23,24]. On the other hand, several wild Solanum spp. are well adapted to marginal environments, being more tolerant to biotic and abiotic stresses than cultivated varieties [25], which could be potential sources of tolerance. In tomatoes, the use of these wild relative species has been extensively exploited in plant breeding strategies for different characteristics [26], including biotic stress [25] or abiotic stress, such as salinity tolerance [27,28,29]. Regarding heat tolerance, accessions from wild Solanum spp. such as S. pimpinellifolium, L., S. pennellii L., S. habrochaites L. and S. chmielewskii L. have been found to be tolerant to high temperatures [14,17,23,30,31,32,33,34], confirming the value of the wild germplasm as a source of thermotolerance.
Currently, our understanding of the genetic control of the heat tolerance in tomatoes is still very limited, with few reports addressing this topic. Quantitative trait loci (QTLs) involved in heat tolerance have been previously identified in tomatoes [22,24,35,36,37,38,39]. In most of these studies, the identification of QTLs associated with heat tolerant traits in tomatoes was achieved using simple mapping populations (F2), with a limited sample size or without a dense marker coverage. Therefore, the number of reported QTLs involved in heat tolerance is relatively low, and the stability of their effects still needs to be verified. More recently, powerful mapping populations such as recombinant inbred lines (RILs), introgression lines (ILs) [22], multiparent advanced generation intercross (MAGIC) panels and genome-wide association study (GWAS) panels [39] have been used to dissect the genetic control of heat tolerance, providing the foundation for marker-assisted selection programs for the development of tolerant cultivars.
Along with the temperature, other environmental factors such as salinity and drought affect plant growth [40]. Furthermore, in real field conditions, the occurrence of different stresses is common. The response to the combination of stresses is specific and independent of the individual response to each stress [41], although cross-tolerance can occur [42]. For example, the effect of heat stress has been reported to increase tolerance to various abiotic stresses [43]. In the current climate change scenario, the concurrence of various stresses simultaneously is expected. Thus, the search for plants with tolerance to different stresses will be a target in plant breeding programs. In the same way, increased knowledge of the genetic control of tolerance to high temperature has become necessary, together with the development of new varieties of tomato tolerant to heat and to different abiotic stresses. Therefore, taking these perspectives into account, the main objective of the present work is the identification of QTLs that are mainly related to reproductive traits involved in the responses to different temperatures. Two very different populations of inbred lines from independent crosses between tomato accessions (fresh market and processing tomato cultivars) and two S. pimpinellifolium accessions were studied to expand the genetic variability, and to genetically analyze the responses of reproductive traits to heat stress.

2. Results

2.1. E9×L5 Population

2.1.1. Phenotypic Variations in Reproductive Traits at Different Temperatures

Trait distributions for each temperature regime and year are represented in Figure 1. Means, standard deviations and ranges are also depicted in Supplementary Table S1. FLN means and distributions were similar between T1 and T2, with a relatively modest mean decrease under T3 (Figure 1A). In the case of FRN, a more severe reduction in fruit number concomitant with the temperature increase was observed, with the distribution dramatically skewed to low values under T3 (Figure 1B). Similarly, the FRS distribution was skewed to low values under T3 (Figure 1C).
Therefore, the FRN and particularly FRS were the traits most affected by the temperature increases, especially under T3. It is noteworthy that FRS showed a wide range, with several RILs capable of setting fruit, even at extremely high temperatures, suggesting the presence of a genetic variability for setting fruit under heat stress in this population.
Additionally, to confirm the consistency of the results, the correlations within and between years in the three temperature regimes were analyzed for all reproductive traits. Correlations within years and between years for FLN were highly significant and positive in every temperature regime (Table 1A). For the FRN values, the correlations between years were positive and highly significant under T1 and T2 regimes, and lower but still significant under T3. Correlations within years were highly significant in 2019, but in 2018 the only significant correlation was observed between T1 and T2 (Table 1B). The correlations between years for FRS were not significant under T1 and T2, whereas a low and positive correlation was observed under T3 for this population. Moreover, FRS correlations between temperature regimes were only significant in 2019 (Table 1C).
Moreover, the repeatability of each trait was calculated as an estimator of broad-sense heritability [44]. This analysis of repeatability showed higher repeatability for the optimal temperature T1, but it decreased as the temperature increased. The coefficient of repeatability for both non-transformed and log-transformed data also suggested that the traits with the highest broad-sense heritability were FLN and FRN under T1 and T2. The FLN also presented a high repeatability under T3 (Table 2). On the other hand, plasticity indexes showed low repeatability, indicating low heritability for these traits.

2.1.2. Identification of QTL in the RIL Population E9×L5

The multi-environmental QTL analysis results are shown in Table 3, while Supplementary Table S2 contains the QTLs detected separately each year. The multi-environment QTL analysis was also divided into the three categories (non-transformed data, log-transformed data and plasticity indexes). Thus, a total of 31 QTLs involved in the reproductive traits at different temperatures were identified (15 for non-transformed data, 11 for log-transformed data and 5 for plasticity indexes) (Table 3).
Among the 15 QTLs identified using the non-transformed data, six were detected for FLN (three under T1 and three under T2), with the L5 allele increased the flower number. Nine QTLs were detected for FRN, seven of them under T1, distributed in five linkage groups, with two of them under T2. These two QTLs under T2 co-localized with QTLs identified for FLN and FRN under T1. FRN QTL frn1.1_T2_2E, localized in chromosome 1 at around 48 cM with the L5 allele, increasing the fruit number and co-segregated with QTLS involved in FLN and FRN under T1, with the last ones being the QTLs with the highest effects (R2 > 20%). Moreover, frn2.1_T2_2E also co-segregated with the FLN QTL fln2.1_T2_2E (Table 3; Supplementary Figure S1). No significant QTLs were detected under T3 nor at any other temperature for FRS.
Next, the QTL analysis was implemented with log-transformed data to mitigate the effects of the non-normal distribution on the QTL mapping. A total of eleven QTLs were identified: five for LogFLN, four for LogFRN and two for LogFRS (Table 3; Supplementary Figure S1); six of them were not detected with the non-transformed data. The QTLs with the higher effects were detected in chromosomes 1 and 2 (flnlog1.1_T1_2E, flnlog2.1_T2_2E, R2 > 15%). Interestingly, the same region on chromosome 2 harbored QTLs for LogFLN and LogFRN at different temperature regimes, along with L5 allele increasing the traits. Moreover, the log transformation allowed the identification of QTLs at extremely high temperature: flnlog6.1_T3_2E with L5 increasing the trait and R2 = 7.16. Finally, two QTLs in chromosome 5 were detected for LogFRS: frslog5.1_T3_2E at 16 cM, with R2 = 8.47 and the E9 allele increasing the trait, and frslog5.2_T3_2E at 55 cM, with R2 = 6 and the L5 allele increasing the trait (Table 3).
Five QTLs were found for plasticity traits. Four of them corresponded to plasticity between temperatures T1 and T3 for FLN and FRN. Moreover, the plasticity QTLs pfln1.1_T31_2E and pfln6.1_T31_2E co-localized with fln1.1_T1_2E and flnlog6.1_T3_2E (Table 3; Supplementary Figure S1), likely reflecting the variation in those QTL effects due to the changes in temperature conditions.
The QTL analysis performed independently in each trial identified a total of 41 QTLs. Twenty-three QTLs were detected using non-transformed data. Fourteen were for FLN (9 in 2018 and 5 in 2019). The QTLs with more stable effects were localized in chromosome 2 at around 53–59 cM in 2018 and 2019 under T1 and T2, with the L5 allele increasing FLN. QTLs identified under T3 for FLN were exclusive of the temperature regime and were detected only in 2018, with fln5.2_T3_18 in chromosome 5 explaining the highest level of phenotypic variance of 14.39% and the E9 allele increasing the trait. Seven QTLs were identified for FRN under T1 (in both years) and T2 (in 2019). For T2 in 2019, a QTL in chromosome 2, at the same position as for FLN, was identified, with the allele of L5 increasing the FRN and explaining 12.71% of the phenotypic variance for this trait. The number of QTLs identified for the FRS was low, with only two QTLs localized in chromosomes 9 and 7 in 2018 under T1 and T2, respectively. A QTL explaining 14.06% of the phenotypic variance was detected in chromosome 7, with the allele of L5 increasing the fruit set for the mild heat stress temperature T2 (Supplementary Table S2). Most of the QTLs detected independently for each year were also identified in the multi-environmental QTL analysis, except for the QTLs involved in FLN under T3, fln9.1_T1_18, fln9.1_T1_18 and fln1.1_T2_19, while the QTLs associated with FRS were only detected in the independent analysis (Supplementary Table S2).
The QTLs detected in chromosomes 1, 2 and 5 were also identified with the log-transformed data. In addition, a new QTL affecting the FLN under T3 was detected in chromosome 6. Additionally, four new QTLs for FRN located in chromosomes 1, 2 and 5 were identified (Supplementary Table S2). Only three QTLs, flnlog1.1_T2_19, frslog1.1_T3_19 and frslog2.1_T3_19, were detected exclusively in the single-year analysis. The rest of QTLs matched with those detected in the multi-environmental QTL analysis.
Five plasticity QTLs were detected for pFLN and pFRN (Supplementary Table S2). All of them were identified in the multi-environmental analysis as well.
Twenty-four QTLs (Supplementary Table S3) were detected by MQM analysis using MapQTL software for non-transformed data, analyzing each year separately. Eleven QTLs were detected in genomic regions previously associated with QTLs via ICIMaping analysis (Supplementary Table S3 and Supplementary Figure S2). However, 12 QTLs were detected exclusively with MapQTL, including three for FRS. Additionally, the allele effect QTL frn11.1_T1_18 showed different directions between the two analyses.

2.1.3. Epistatic Interactions in the RIL Population E9×L5

The epistatic analysis using the non-transformed data revealed fourteen pairs of significant epistatic QTLs (Table 4, Supplementary Table S4). For FLN and FRN, interactions were detected under T1, T2 and T3, while for FRS, interactions were detected only under T1. Six epistatic interactions were detected with the log-transformed data in the three temperatures regimes. Regarding the plasticity indexes, four interactions were detected, two for pFLN and two for pFRS (Table 4).
Four main effect QTLs mapped closely to epistatic genome regions, which could indicate that those QTLs were involved in the epistatic interactions, while for most of the epistatic regions, no QTLs were detected (Supplementary Figure S1). Interestingly, relatively high proportions of interaction for FRN and FRS were observed in the genomic region of 75–95 cM for chromosome 9, close to QTLs frs9.1_T2_18, BCfln9.1_T1_2E and BCfln9.1_T2_2E (Supplementary Table S4 and Supplementary Figure S3).
A two-way ANOVA was performed to verify the interactions and to obtain a biological interpretation of the epistasis [45]. All epistatic interactions detected were significant according to the ANOVA in at least one of the years in which the experiments were carried out, except for the interaction between regions, between chromosomes 1 and 2 for FLN_T1. Three types of epistasis were observed: dominant epistasis (one locus suppressed the allelic effects of a second locus; Figure 2A), co-adaptive epistasis (the double-homozygous alleles from the same parent showed a higher phenotypic value than the combination of homozygous alleles from alternative parents; Figure 2B) and transgressive epistasis (combination of double-homozygous alleles for alleles from different parents showed better performance than double-homozygous alleles from the same parent; Figure 2C). We have defined the last one as transgressive epistasis, because this type of interaction could be involved in the transgressive segregation in segregant populations. Dominant and transgressive epistases were the most common patterns (Supplementary Figure S3).

2.2. Inbred Backcross Line (IBL) Population E6203×LA1589

2.2.1. Phenotypic Variations for Reproductive Traits at Different Temperatures

Trait distributions for each temperature regime and year are represented in Figure 3. Means, standard deviations and ranges are described in Supplementary Table S1. The distribution of the reproductive traits was normal under T1 and T2, while a skewed distribution was observed under T3. FLN means and distributions under T1 and T2 were similar, with only a slight decrease in FLN under T2. At T3, the FLN decrease was most severe, with a reduction of 50% of the T3 FLN mean as compared with the T1 FLN mean, although most of the individuals in the population were able to generate flowers (Figure 3A).
For FRN, normal distributions were observed under T1 and T2. At T3, the fruit number was skewed to low values with a drastic FRN decrease (Figure 3B). Similarly, FRS was adversely affected by temperature, with an increasing reduction rate under T2 and T3 and a skewed distribution to low values under T3 (Figure 3C). The performances of the three traits were similar in both years.
Similarly to the observations in the E9×L5 population, the FRS trait showed a stronger decrease with the temperature increase. Nevertheless, high phenotypic variability was found in all traits and temperatures, suggesting that genetic variability may exist in this population for the heat stress response.
The correlation within and between years was analyzed for all reproductive traits. For FLN, the correlation was positive and highly significant at every temperature regime for both years (Table 5A). In 2018, no correlation was found for FRN under T1 or T2. However, a strong positive correlation was observed between T2 and T3 for this trait. In 2019, the correlation for FRN was significant and positive for the three temperatures regimes. The correlation between years showed a positive and significant correlation for all the temperatures as well (Table 5B).
For FRS, no correlation was observed either in 2018 or 2019 between temperatures, except under T1 and T2 in 2019, where a positive correlation was found. Moreover, FRS was not correlated between years for any of the temperature regimes (Table 5C).
The repeatability was higher under T1 for FLN, FRN and FRS for both non-transformed and log-transformed data (Table 6). Moreover, the values were similar for all three temperature regimes for FLN. However, the coefficient of repeatability decreased along with the temperature for the other traits. In general, the plasticity indexes showed low repeatability.

2.2.2. Genetic Map

A total of 173,064 SNPs were obtained from the SPET genotyping procedure. After filtering, 4208 SNPs and 84 RILs were retained. Additionally, 177 markers with distorted segregation were excluded, with 4031 markers remaining for the linkage map generation (Supplementary Table S5). Linkage analysis identified 3297 SNPs (81.79%) with a recombination frequency equal to zero (0), while 68 SNPs (1.68%) not linked to any linkage group (LOD = 5.0) after the calculation of the first map. Thus, 3480 SNPs were excluded from the map (Supplementary Table S5), with 551 markers remaining for the generation of the final map.
The definitive map was constructed with only the 551 informative SNPs (45.9 SNPs/chromosome), resulting in a linkage map that spanned 1502 cM, with an average of 125 cM by linkage group, 1.6 SNPs/Mb, 0.4 SNPs/cM and 2.8 cM/SNP (Supplementary Table S5). The average distance between markers was 1581.0 kb, while the greatest distance between markers was 36,318.8 kb (Supplementary Figure S4). The marker order and distances on the map were as expected, with only 69 (1.71%) of the markers not collinear between their physical and genetic position. The specific information by chromosome is shown on Supplementary Tables S5 and S6.

2.2.3. Identification of QTL in the IBL Population E6203×LA1589

In the multi-environment QTL analysis, a total of 16 QTLs were identified (Table 7). Seven QTLs were detected with the non-transformed data, four of which were for FLN under T1, T2 and T3. The BCfln2.1_T3_2E explained 15.27 % of the phenotypic variance, while the E6203 allele that increased the trait was identified under T3. QTLs for FRN and FRS were detected only under T1 (Table 7).
Six QTLs were detected with the log-transformed data, most of them also under T1. Interestingly, two QTLs were detected under T3 in chromosome 2, with the E6203 allele increasing the traits—BCflnlog2.1_T3_2E for LogFLN with R2 = 19.14%, coinciding with BCfln2.1_T3_2E and BCfrnlog2.1_T3_2E for LogFRN with R2 = 20.14%, which were not detected with the non-transformed data (Table 7).
Finally, three QTLs were identified for the plasticity indexes, two for pFLN and one for pFRS (Table 7). Here, pBCfln2.1_T31_2E co-localized with BCfln2.1_T3_2E, which may reflect the variation in genetics effects of this QTL induced by the temperature increase. The other two plasticity QTLs did not co-localize with any of the main effect QTLs.
The QTL analyses performed independently each year identified 13 QTLs for the non-transformed (7 QTLs), log-transformed data (3 QTLs, and plasticity indexes (3 QTLs) (Supplementary Table S7). Most of them coincided with the QTLs detected by multi-environmental analysis. Among them, BCfln2.1_T3_19 for FLN under T3 explained 14.71% of the phenotypic variance, with the E6203 allele increasing the trait at the extremely high temperature.

2.3. Comparison between E9×L5 and E6203×LA1589 Populations

2.3.1. Repeatability

In both populations, the coefficient of repeatability for the non-transformed data showed that the traits with the highest broad-sense heritability were FLN and FRN under T1 and T2. The FLN also presented high repeatability under T3 (Table S2 and Table 6), in agreement with the data obtained in the correlation analysis (Table 1 and Table 5). The repeatability of plasticity indexes was low in general.

2.3.2. QTL Analysis

More QTLs were detected in the E9×L5 RIL population than in the E6203×LA1589 IBL population, which may have been due to differences in genetic diversity for the studied traits between populations, but also due to differences in population size and genetic structure. Most of the QTLs identified in this work were exclusive of the population. Two FLN QTLs located in chromosome 2 (flnlog2.1_T2_2E and BCflnlog2.1_T1_2E) were identified in similar positions in both populations at different temperature regimes. However, the L5 allele of flnlog2.1_T2_2E increased the trait, while the E6203 allele increased for BCflnlog2.1_T1_2E. Additionally, two QTLs were detected in a similar genomic region on chromosome 10 in both populations (flnlog10.1_T2_2E and BCflnlog10.1_T1_2E), with the wild parent allele (L5 or LA1589) increasing the trait in both cases.
A FRN QTL located in chromosome 2 in a position between 41,605,351 bp and 47,650,959 bp was detected in both populations using both non-transformed (frn2.1_T2_2E under T2; R2 = 6 and BCfrn2.1_T1_2E; R2 = 18.97) and log-transformed data (frnlog2.1_T1_2E and frnlog2.1_T2_2E, explaining 8.56% and 9.62% of the phenotypic variation, respectively, as well as BCfrnlog2.1_T1_2E with R2 = 30.43). The wild relative allele increased the trait in the E9×L5 population, while the cultivated allele did so in the E6203×LA1589 population.
Very few QTLs were detected for FRS under T3. Consequently, no common QTLs were found. Regarding plasticity indexes, only pfln1.1_T31_2E and pBCfln1.1_T21_2E mapped closely in their respective populations.

3. Discussion

The threat of climate change has resulted in the urgent need to understand the genetic control of abiotic stress responses in order to overcome the effects of environmental changes. Identifying sources of genetic diversity for heat tolerance may contribute towards the development of new varieties that are better adapted to the new environmental conditions by offering novel solutions to the problem. In the present study, we studied the genetic control of reproductive traits under different temperature regimes in two tomato inbred line populations derived from crosses between cultivated and wild relative accessions to search for genetic variability that may be useful for the development of new cultivars that might adapt to changing environmental conditions.
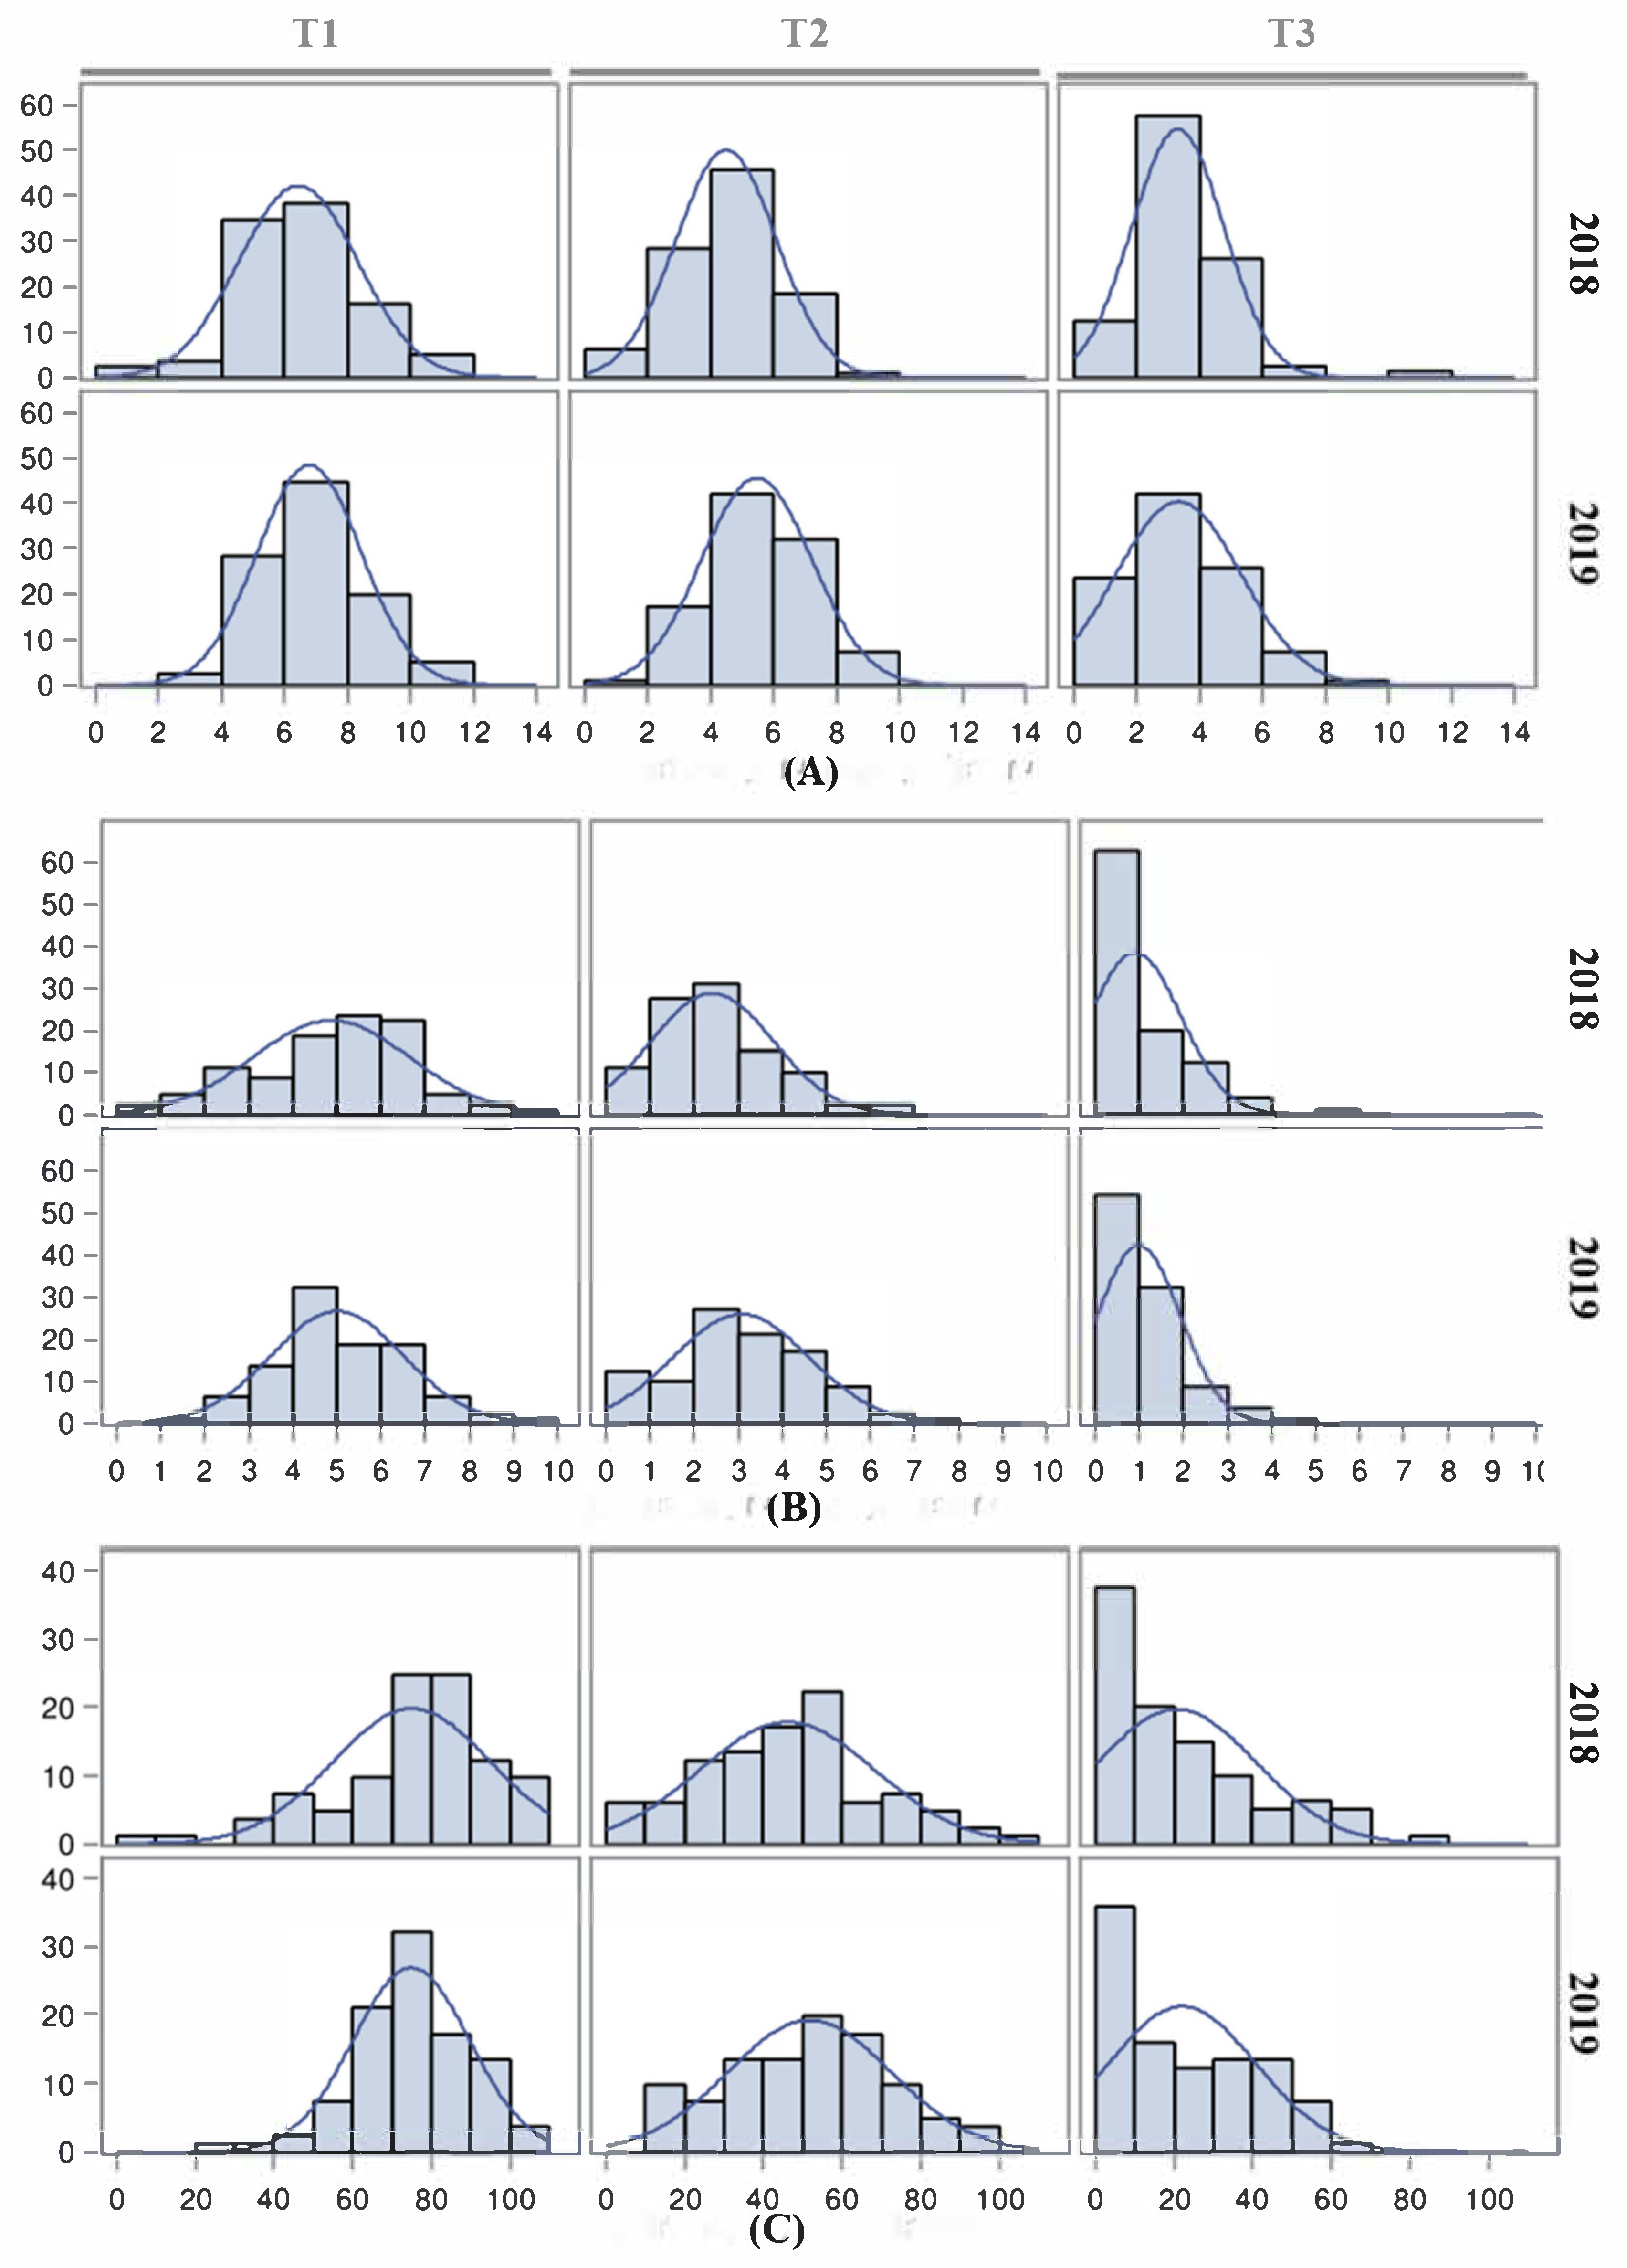
The effect of high temperatures on reproductive traits is evident when night temperatures are maintained over 25 °C [46], which may be frequently reached in the Mediterranean basin fields during summer. Thus, both inbred line populations were subjected to three temperature regimes (control T1, moderate stress T2 and extreme stress T3) to evaluate their responses to temperature changes and to identify QTLs involved in these responses. The effect of heat stress on FLN was more evident under T3, although the magnitude was not as drastic as reported previously [22,23,24,46,47], especially in the E9×L5 population, suggesting a better performance of this population under heat stress for this trait.
In general, both populations showed a good response to moderate heat stress under T2, with an average FRS close to 50% but with a wider range compared with T1. However, FRS was dramatically reduced under T3, with a low proportion of inbred lines being capable of setting fruits at this temperature, as reported previously [21,22,23,24,46,47,48]. The current results confirm that the heat stress mostly affects the fertility of the flowers and not their production. The lack of parents, due to different agronomical problems, made the confirmation of transgressive segregation impossible, although the wide range of values obtained under T2 and the extreme values under T3 suggest the existence of transgressive phenotypes, which are commonly reported in crosses of cultivated tomatoes with exotic germplasm [49,50,51]. The variability of responses under heat stress observed in both populations confirmed the complexity of the trait.
The strong and positive correlations, and the relatively high repeatability observed for FLN and FRN between the 2018 and 2019 under T1 and T2 experiments, indicated a significant hereditability of the tolerance under moderate heat stress. The correlation and repeatability of FLN and FRN under T3 were in general low and non-significant, suggesting no or low genetic variance for these traits at that heat stress. On the other hand, the low repeatability for FRS indicates a low genetic variability for this trait in the studied populations.
The genetic map generated for the E6203×LA1589 population had a total length of 1502 cM, similar to other published maps for this species, ranging from 1091 cM [52] to 2023 cM [53]. Moreover, the collinearity between the physical and genetic maps was very high, validating the robustness of the map to be used in QTL analysis.
Most of the detected QTLs were associated with FLN and FRN under T1 and T2 temperature regimes, coinciding with the heritability estimated in those trait and temperature regime combinations. Therefore, the results obtained in the current report may have impacted those conditions. On the other hand, additional QTLs were detected using log-transformed data or MQM analysis, which were remarkable for FRS under T3 in the E9×L5 population. This observation reinforces the need to optimize the data analysis for such complex traits to obtain the maximum information and to not miss potentially valuable QTLs such as frslog5.2_T3_2E. This low QTL detection, as well as the modest single QTL effects at high temperature regimes, was concomitant with the low genetic variability estimated via repeatability analysis, as found in previous studies [21,22,24,37,38,39], reflecting the genetic complexity of the response to heat stress. Even though an important proportion of the QTLs were population-specific, as previously found [39], some genomic regions contained QTLs clusters detected in several studies. Thus, FRN QTLs were detected in both E9×L5 and E6203×LA1589 at the bottom of chromosome 1. Additionally, IL SP_1–4, which harbors an introgression from the S. pimpinellifolium TO-937 accession on the same genomic region in the genetic background of the Moneymaker cultivar, very consistently showed high FRS and FRN under T3 in previous works [22], while a plasticity QTL for FRN also mapped to that region [39]. Another interesting QTL cluster was found at the bottom of chromosome 2, whereby BCfln2.1_T3_2E and FLN plasticity QTLs (in the population E6203×LA1589) co-located with FLN QTLs were detected in the Moneymaker×TO937 RIL population [22], GWAS studies [24,54] and MAGIC populations [39]. Another QTL cluster was found in the central region of chromosome 2, with QTLs involved in reproductive traits in several populations, for example, fln2.1_T2_2E (E9×L5), BCfrn2.1_T1_2E (E6203×LA1589), fln2.1_T3_2E (Moneymaker×TO-937, [22]), nflw2.2, nflw2.3 (GWAS panel, [39]) and nflw2 (MAGIC, [39]). These results suggest that those genomic regions are strong candidates for harboring useful genetic diversity for the study of the responses of reproductive traits under different temperature regimes. Other examples of co-localization include flnlog6.1_T3_2E and flnlog10.1_T2_2E, with QTLs identified in Moneymaker×TO-937 [22], fln5.1_T2_2E with nflw5.1 in the MAGIC population [39] and fln2.1_T2_2E, pfln6.1_T31_2E and BCfln9.1_T2_2E with associations from a GWAS panel [39]. Furthermore, the unexpected differences found in the QTL detection depending on the software could be due to differences in sensitivity to deviations from normality, as well as in the tools and algorithms used in each software for the selection of cofactors during multiple QTL mapping or composite interval mapping procedures, although simulation studies are needed for confirmation. In any case, the IciMapping software allows for multi-environmental QTL analysis, and in fact was able to detect 6 QTLs that were not detected at all when analyzing the years separately.
Bineau et al. [39] demonstrated the power of multiple parent populations in tomato plants to identify QTLs involved in response to heat stress. Compared with bi-parental population experiments (the current study and [22]), some similar conclusions can be drawn, i.e., a large proportion of the QTLs were population-specific, and the individual effects of the QTLs were usually modest. Nevertheless, some QTLs seem to be mapped in the same regions among populations, which could represent major adaptation QTLs and targets for further investigations. Thus, these results confirm the need to continuously search for new genetic variability for stress tolerance to obtain a global picture of the QTLs involved in heat stress to identify those with robust effects that could be integrated efficiently in breeding programs and to identify the underlying genes.
Alleles from both parents were found to be associated with tolerance to heat stress in the current and previous studies [22,37,38]. In the current report, wild alleles usually increased the traits in the E9×L5 population, while in the E6203×LA1589 population cultivated alleles were more frequently associated with a tolerant response in the reproductive trait. This variation in the direction of the additive effects, even within populations, might indicate that most of the studied accessions included alleles that may induce a positive response to heat stress, complementary to the alleles included in other accessions.
Interestingly, a relatively large number of epistatic interactions were detected in the E9×L5 population. Most of the interactions occurred in genomic regions that did not include any main effect QTL. The detection of epistatic interaction between QTLs is truly a challenge due to the low statistical power of the common experimental designs to detect these interactions [55]. The E9×L5 population had a balanced allelic frequency (f(L5) = f(E9) = 0.5), whereas in the E6203×LA1589 population, the allelic frequencies were unbalanced (f(E6203) = 0.875, f(LA1589) = 0.125). The power to detect epistasis is maximal in balanced populations, and the unbalanced allele was certainly a factor that made the detection of interactions difficult in the E6203×LA1589 population. Thus, the possibility that the lack of detection was due to low statistical power in this population cannot be ruled out. Nevertheless, the high number of epistatic interactions in the E9×L5 population contrasts with the low number of detected main effect QTLs. Remarkably, epistatic interactions were detected under T3 for FRN, but no main effect QTLs were detected at this temperature regime. This result suggests that an important proportion of the genetic variability for response to heat stress is non-additive in the E9×L5 population. This may also explain the relatively low number of detected QTLs under high temperature regimes, as the effects of the QTL alleles would depend on the allelic state of another locus at different chromosomes, so the main QTL effects may seem low or null when estimating single QTL effects, especially in cross-interactions, reinforcing the role of QTL interactions in important agronomic traits. Different types of epistasis were found, and transgressive epitasis, defined when the combination of double-homozygous alleles from different parents showed better performance than double-homozygous alleles from the same parent alleles (Figure 2C and Supplementary Figure S3), was interestingly frequent. This kind of interaction could be explained at the molecular level as interactions involving repressors or negative regulators that do not fit between species.
In summary, a low number of QTLs was found for each temperature regime and reproductive trait in both RIL populations. Among them, QTLs involved in FLN and FRN under optimal and moderate–high temperature regimes (T1 and T2) were mainly detected, meaning research must subscribe to these conditions. Low QTL detection rates in studies on heat tolerance of tomato were observed in previous works [22,24,37,38], corroborating the genetic complexity of heat tolerance in this crop. Studies involving multiple parent populations have been demonstrated to be very powerful for the detection of a larger number of QTLs, although the individual contribution of each QTL is relatively modest [39]. The search for new sources of tolerance is still needed to enhance our knowledge on the genetic control of this abiotic stress. In the current report, the role of non-additive genetic variability was reinforced, undoubtedly complicating the practical application of the scientific results. Despite the low number of QTLs, four genomic regions presented common QTLs among the two studied populations. One region on chromosome 1 and two regions on chromosome 2 were also previously associated with heat tolerance [22,24,39,54], while two others on chromosomes 6 and 10 were also validated in [22]. The concurrent identification of QTLs associated with reproductive traits under heat stress in the same localization area in different studies reinforces the importance of these regions in the adaptive response of reproductive traits to high temperatures in tomato plants.

4. Materials and Methods

4.1. Plant Material and Growing Conditions

Two populations of inbred lines were studied: E9×L5 consisting of 128 RILs (Recombinant Inbred Lines) derived by single-seed descent from the cross between Solanum lycopersicum var. cerasiforme line E9 × S. pimpinellifolium line L5, used extensively for salt tolerance analysis [56,57], and E6203×LA1589, consisting of 91 inbred backcross lines (IBLs) originated via single-seed descent to create a set of homozygous BC2F6 lines from the cross S. lycopersicum E6203 (processing tomato) × S. pimpinellifolium LA1589 [58]. The set of 91 BILs was a selection of the original set of 196 BILs used to maximize recombination frequency and mapping resolution. The 91 BILs were obtained from the Tomato Genetics Resource Center (Davis, USA). Three of the BILs did not germinate, so the final mapping population consisted of 88 BILs.
Both populations were cultivated in a glasshouse under semi-controlled temperature conditions in the Centro de Experiencias Cajamar (FCCV; Paiporta, Spain) facilities during 2018 and 2019. One replicate with three plants per RIL (in the same grow bag, only one RIL per bag) were randomly distributed in the greenhouse. Plants were grown with stepwise temperature increases according to [22] under three temperature regimes: T1: 25 °C day/20 °C night; T2: 30 °C day/25 °C night; T3: 35 °C day/30 °C night. Seedlings were transplanted to the greenhouse with 2–3 true leaves after about a month in the nursery. Plants were cultivated on hydroponic grow bags with controlled fertirrigation. After two weeks of acclimation, the temperature regime was set to T1. The numbers of flowers and fruits assessed over four weeks under T1 were recorded in the second and third truss areas (see below). Then, flowers, and fruits were pruned and the T2 regime was applied for 4 weeks. Again, plants were pruned prior to applying the T3 regime.

4.2. Phenotypic Evaluation

Phenotypic evaluations were performed in the same plants in the three temperature regimes after pruning prior to a regime change (see above). During the third week of each temperature regime, the number of flowers (FLN) was recorded in the corresponding second and third truss areas developed after the temperature regime change. The number of set fruit (FRN) was recorded on the fourth week. The fruit set (FRS) was calculated as FRS = 100 *FRN/FLN. All data were transformed using the logarithmic function to reduce the skewness. Phenotypic plasticity, i.e., the ability of a genotype to express a different phenotype depending on environmental variability, was also studied among different temperature regimes with the phenotypic plasticity indexes [39]: pT21 = ((T2 value − T1 value)/T1); pT31= ((T3 value − T1 value)/T1); pT32= ((T3value − T2 value)/T2).

4.3. Statistical Analysis

The basic statistics (mean, standard deviation, maximum and minimum values) and Pearson correlations were calculated with the JMP 12.1.0 software package (SAS Institute, Cary, NC, USA) [59]. Trait distributions were calculated with the R statistical software.
The repeatability of a trait was estimated as the correlation between two or more measures of that character in the same individual. In this case, the repeatability set an upper limit to the degree of genetic determination (broad sense heritability) and to the heritability (narrow sense heritability) [44]. Here, the repeatability coefficient, estimated for the values of each trait at the two consecutive years, was obtained from the ANOVA with two sources of variation (genotype and environment (years)) and calculated according to the following model:
Yijk = µ + αi + βj +εij
where Yij is the phenotypic trait value from ith genotype in jth environment; µ is the general average; αi is the effect of the first variation source (genotype); βj is the effect of the second variation source (environment = year); εij is the experimental error:
  ρ = σ P 2 σ P 2 + σ e s 2 = σ g 2 + σ e g 2 ( σ g 2 + σ e g 2 ) + σ e s 2 = σ a 2 + σ d 2 + σ e g 2 ( σ a 2 + σ d 2 + σ e g 2 ) + σ e s 2   ~   H 2
  σ p 2   = MSgen   MSerror n .   years   σ e s 2   =   MSerror
ρ = σ P 2 σ P 2 + σ e s 2
where σ g 2 is the genetic variance between genotypes; σ e g 2 is the general environmental variance (permanent effect) because there is an intrinsic environmental effect on each genotype, which occurs in the year or cultivated environment (source of variance between genotypes in population); and σ e s 2 is the special environmental variance (variance for time or location effect), defined as an effect intrinsic to the environmental fluctuation conditions between years or different environments (sources of variance in the same genotypes between years/environments). The phenotypic variance ( σ p 2 ), which is the sum of σ g 2 + σ e g 2 , was obtained from the mean squares from the ANOVA according to Equation (1), and was calculated using (MSgenotype − MSerror)/number of years, Equation (2)). A special environmental variance ( σ e s 2 ) corresponds to MSerror. Then, the repeatability (ρ) was calculated as the ratio of the phenotypic variance to the sum of phenotypic variance and the special environmental variance (Equation (3)) [44,60,61].

4.4. Genetic Map

The E9×L5 RIL map was previously generated in [62] using the SolCAP tomato panel [63] and contained 1901 SNPs. The E6203×LA1589 map was generated de novo. DNA samples from young leaves of BCRIL were obtained according to [64], with slight modifications for extraction in 96-well plates [65]. IBLs were genotyped with the GP2SOL SNP array using Single Primer Enrichment Technology (SPET) [66] by IGA Technology Services (Udine, Italy). The initial SNP matrix was filtered using the TASSEL v. 5 software [67], discarding loci with minor allele frequency (MAF) ≤ 0.05 and missing data higher than 10%, genotypes with missing data ≥ 30% and loci with missing data or that were heterozygous in any of the parent genotypes. Moreover, segregation distortion was assessed via Chi-square test from the expected 0.875:0.125 ratio (for E6203 and LA1589 alleles, respectively) appropriate for BC2F7 generation at F7. The Bonferroni correction was used to adjust the p-values, resulting in an overall α level of 0.05/total SNPs [68].
The software QTL IciMapping Version 4 was used for map construction [69]. For linkage mapping, the software parameters “Mapping Population Type 11” and “Marker Space Type 1 for Intervals” (P1BC2RIL) were selected, with the genotypic frequency model A/B (0.8750:0.1250). The analyses were carried out separately by chromosome, as the physical position of each marker was previously known after alignment of SNPs using the SL2.5 version of the tomato genome as the reference. The linkage was analyzed with an LOD threshold of 3.0 and a recombination frequency threshold of 0.30. The RECORD (The Recombination Counting and Ordering) option was used for marker ordering, and to ripple the marker order, the SAD (sum of adjacent criterion) parameter was implemented [70]. In a second stage, after excluding SNPs according to the criteria mentioned above, a new map assembly was performed by changing the marker ordering parameter to “nnTwoOpt” and the LOD threshold to 5.0. Mapping distances were calculated with the Kosambi function [71]. The linkage map figure was plotted using the R [72] package LinkageMapView [73] and the QTL map using MapChart v. 2.3 [74].

4.5. QTL Analysis

The QTL analysis was conducted with non-transformed data, the logarithmically transformed data and relative variables. The multi-environment QTL analysis was performed with QTL IciMapping [69], with the ICIM-ADD procedure (Inclusive Composite Interval Mapping of Additive QTL). The LOD threshold was determined via a permutation test with 1000 resamplings with a type I error of 0.05. Likewise, the epistatic analysis was performed with ICIM-EPI by 1000 permutations and a type I error of 0.05. The interactions between chromosome regions were double-checked with a two-way ANOVA for marker pairs with significant interactions according to the IciMapping (ICIM) analysis. The analysis was performed with JMP 12.1.0 (SAS Institute, Cary, NC, USA).
Additionally, QTL analysis was performed independently each year by also using QTL IciMapping with the ICIM-ADD procedure (Inclusive Composite Interval Mapping of Additive (and Dominant) QTLs). QTLs for single experiments were named using an abbreviation of the trait, followed by the chromosome number, the QTL number within the chromosome and the temperature regime (T1, T2 or T3), adding a suffix with the experiment year. Moreover, the multiple-QTL mapping (MQM) procedure was carried out using the MapQTL® 6 software [75]. A 5% genome-wide significance level was assessed via permutation tests. The corresponding critical LOD values ranged from 3.2 to 3.4 depending on the trait.
Multi-environment QTLs were named using an abbreviation of the trait, followed by the chromosome number, the QTL number within chromosome, the temperature regime (T1, T2 or T3) and the suffix _2E (indicating two years). QTLs for the E6203×LA1589 population were preceded by the BC abbreviation to differentiate them from the rest of the population.
The QTL positions were represented graphically using MapChart v. 2.3 [74].

Supplementary Materials

The following are available online at https://0-www-mdpi-com.brum.beds.ac.uk/article/10.3390/plants11081069/s1, Figure S1: Map position of QTLs for non-transformed data, log-transformed data and plasticity indexes identified in E9×L5 and E6203×LA1589 populations by ICIMapping and MapQTL® 6 software. Additionally, QTLs identified in another RIL population from the cross between MoneyMaker × TO-937 [22] and the position of the epistatic interactions are indicated. Figure S2: Comparison of QTLs detected in E5xL9 and E6203×LA1589 populations using IciMapping for the two years combined (E9×L5 and E6203×LA1589), and using IciMapping and MapQTL software in the RIL population for each year separately (IcIE9×L5 and MapQTLE9×L5). The color of each QTL name indicates the type of QTL analysis. The chromosome, the physical position of QTL peaks in Mbp, additive values (add) and LOD scores are specified. Figure S3: Epistatic interactions for the (A) non-transformed data (B), log-transformed data and (C) plasticity indexes for flower number (FLN), fruit number (FRN) and fruit set (FRS) parameters under different temperature regimes (T1: 25 °C day/20 °C night; T2: 30 °C day/25 °C night; T3: 35 °C day/30 °C night). Supplementary Figure S4: Genetic linkage map of tomato plants, constructed based on the E6203×LA1589 IBL population with 551 SNPs. Table S1: Mean values, standard deviation and the maximum and minimum values for reproductive traits under three temperature regimes (T1: 25 °C day/20 °C night; T2: 30 °C day/25 °C night; T3: 35 °C day/30 °C night) in 2018 and 2019 for the E9×L5 and E6203×LA1589 populations. Table S2: QTLs detected in the E9×L5 population for the flower number (FLN), fruit number (FRN), and fruit set (FRS) reproductive traits, using non-transformed data, log-transformed data and the plasticity indexes under different temperature regimes (T1: 25 °C day/20 °C night; T2: 30 °C day/25 °C night; T3: 35 °C day/30 °C night) in two experiments (2018 and 2019) in an independent QTL analysis assessed by year with ICIMapping. QTLs are named using the trait abbreviation, followed by the chromosome number, the number of QTLs within the chromosome, the temperature regime and the experiment year. Plasticity QTLs are indicated by the p prefix. The estimates for each QTL include: maximum LOD score for genetic effects (LOD), phenotypic variance explained by the QTL (PVE) and the additive value (Add), being negative when L5 alleles increased the trait and positive when E9 alleles increased it. Common QTLs between independent analysis by year and multi-environment QTL analysis are highlighted in blue. Table S3: QTLs detected in the E9×L5 population for the reproductive traits flower number (FLN), fruit number (FRN) and fruit set (FRS) under different temperature regimes (T1: 25 °C day/20 °C night; T2: 30 °C day/25 °C night; T3: 35 °C day/30 °C night) in two experiments (2018 and 2019) via MQM analysis. QTLs detected exclusively with this analysis are highlighted in yellow. The statistical estimates for each QTL include: the chromosome position in the genetic map (cM) Maximum LOD score (LOD), percentage of phenotypic variance explained by the QTL (PVE) and the additive value (Add), being negative when L5 alleles increased the trait and positive when E9 increased it. Table S4: (A) Epistatic interaction in the E9×L5 population for the non-transformed data and log-transformed data for FLN, FRN and FRS and plasticity indexes. (B) Physical distances of the epistatic interactions. Table S5: Statistics for the genetic map from the E6203×LA1589 IBL population. Table S6: Name, position and characteristics of the SNPs used for the map generation. Table S7: QTLs detected in the E6203×LA1589 population for the flower number (FLN), fruit number (FRN) and fruit set (FRS) reproductive traits from non-transformed data, log-transformed data and the plasticity indexes under different temperature regimes (T1: 25 °C day/20 °C night; T2: 30 °C day/25 °C night; T3: 35 °C day/30 °C night) in two experiments (2018 and 2019) in an independent QTL analysis by year with ICIMapping. QTLs are named using the trait abbreviation, followed by the chromosome number, the number of QTLs within the chromosome, the temperature regime and the experiment year. Plasticity QTLs are indicated by the p prefix. The estimates for each QTL include: maximum LOD score for genetic effects (LOD), phenotypic variance explained by the QTL (PVE) and the additive value (Add), being negative when L5 alleles increased the trait and positive when E9 alleles increased it. Common QTLs between independent analysis by year and multi-environment QTL analysis are highlighted in blue.

Author Contributions

Conceptualization, M.J.A., A.G. and A.J.M.; methodology, M.J.G., L.C.d.M., I.N., C.B., G.G. and P.F.; software, formal analysis and data curation, M.J.A., M.J.G. and L.C.d.M.; writing—original draft preparation, M.J.G. and L.C.d.M.; writing—review and editing, A.J.M. and M.J.A.; supervision, A.J.M.; funding acquisition, A.G. and A.J.M. All authors have read and agreed to the published version of the manuscript.

Funding

This research was funded by the European Commission H2020 Research and Innovation Program through the TomGEM project, grant agreement no. 679796; HARNESSTOM, grant agreement no. 101000716; G2P-SOL, grant agreement no. 677379. L.C.d.M. was supported by the Visiting Professor scholarship 88881.173041/2018-01 from the Coordination for the Improvement of Higher Education Personnel (CAPES), Ministry of Education of Brazil.

Data Availability Statement

Data used for QTL analysis in the current report is available at https://0-doi-org.brum.beds.ac.uk/10.5281/zenodo.6457630, accessed on 22 March 2022.

Acknowledgments

We thank Soledad Casal and all FCCV staff for their technical support, as well as the Tomato Genetic Resources Center (TGRC), University of California, Davis (USA), for providing the E6023xLA1589 RILs.

Conflicts of Interest

The authors declare no conflict of interest.

References

  1. IPCC. Climatic Change: Mitigation of Climate Change. Contribution of Working Group III to the Fifth Assessment Report of the Intergovernmental Panel of Climate Change; Edenhofer, O., Pichs-Madruga, R., Sokona, Y., Farahani, E., Kadner, S., Seyboth, K., Adler, A., Baum, I., Brunner, S., Eickemeier, P., et al., Eds.; Cambridge University Press: Cambridge, UK, 2014. [Google Scholar]
  2. Mendelsohn, R. The Impact of Climate Change on Agriculture in Developing Countries. J. Nat. Resour. Policy Res. 2008, 1, 5–19. [Google Scholar] [CrossRef] [Green Version]
  3. Bita, C.E.; Gerats, T. Plant tolerance to high temperature in a changing environment: Scientific fundamentals and production of heat stress-tolerant crops. Front. Plant Sci. 2013, 4, 273. [Google Scholar] [CrossRef] [PubMed] [Green Version]
  4. Jarvis, A.; Ramirez, J.; Anderson, B.; Leibing, C.; Aggarwal, P.K. Scenarios of climate change within the context of agriculture. In Climate Change and Crop Production; Reynolds, M.P., Ed.; CAB International: Wallingford, UK, 2010; pp. 9–37. [Google Scholar]
  5. Battisti, D.S.; Naylor, R.L. Historical Warnings of Future Food Insecurity with Unprecedented Seasonal Heat. Science 2009, 323, 240–244. [Google Scholar] [CrossRef] [PubMed] [Green Version]
  6. Alsamir, M.; Ahmand, N.; Ariel, V.; Mahmood, T.; Trethiwan, R. Phenotypic diversity and marker-trait association under heat stress in tomato (Solanum lycopersicum L.). Aust. J. Crop Sci. 2019, 13, 578–587. [Google Scholar] [CrossRef]
  7. Challinor, A.J.; Watson, J.; Lobell, D.B.; Howden, S.M.; Smith, D.R.; Chhetri, N. A meta-analysis of crop yield under climate change and adaptation. Nat. Clim. Chang. 2014, 4, 287–291. [Google Scholar] [CrossRef]
  8. Hasanuzzaman, M.; Nahar, K.; Alam, M.; Roychowdhury, R.; Fujita, M. Physiological, Biochemical, and Molecular Mechanisms of Heat Stress Tolerance in Plants. Int. J. Mol. Sci. 2013, 14, 9643–9684. [Google Scholar] [CrossRef]
  9. FAOSTAT 2019: Agriculture Organization of the United Nations Database. The Agricultural Production. Available online: http://www.fao.org/faostat/en/ (accessed on 1 May 2021).
  10. Bhattarai, S.; Harvey, J.; Djidonou, D.; Leskovar, D. Exploring Morpho-Physiological Variation for Heat Stress Tolerance in Tomato. Plants 2021, 10, 347. [Google Scholar] [CrossRef]
  11. Camejo, D.; Rodríguez, P.; Morales, M.A.; Dell’Amico, J.M.; Torrecillas, A.; Alarcón, J.J. High temperature effects on photosynthetic activity of two tomato cultivars with different heat susceptibility. J. Plant Physiol. 2005, 162, 281–289. [Google Scholar] [CrossRef]
  12. Dane, F.; Hunter, A.G.; Chambliss, O.L. Fruit Set, Pollen Fertility, and Combining Ability of Selected Tomato Genotypes under High-temperature Field Conditions. J. Am. Soc. Hortic. Sci. 1991, 116, 906–910. [Google Scholar] [CrossRef]
  13. Hazra, P.; Ansary, S.H. Genetics of heat tolerance for floral and fruit set to high temperature stress in tomato (Lycopersicon esculentum Mill.). SABRAO J. Breed. Genet. 2008, 40, 117–125. [Google Scholar]
  14. Driedonks, N.; Wolters-Arts, M.; Huber, H.; De Boer, G.-J.; Vriezen, W.; Mariani, C.; Rieu, I. Exploring the natural variation for reproductive thermotolerance in wild tomato species. Euphytica 2018, 214, 67. [Google Scholar] [CrossRef] [Green Version]
  15. Charles, W.B.; Harris, R.E. Tomato fruit-set at high and low temperatures. Can. J. Plant Sci. 1972, 52, 497–506. [Google Scholar] [CrossRef]
  16. Lohar, D.; Peat, W. Floral characteristics of heat-tolerant and heat-sensitive tomato (Lycopersicon esculentum Mill.) cultivars at high temperature. Sci. Hortic. 1998, 73, 53–60. [Google Scholar] [CrossRef]
  17. Paupière, M.J.; Van Haperen, P.; Rieu, I.; Visser, R.G.F.; Tikunov, Y.M.; Bovy, A.G. Screening for pollen tolerance to high temperatures in tomato. Euphytica 2017, 213, 130. [Google Scholar] [CrossRef]
  18. Barnabás, B.; Jäger, K.; Fehér, A. The effect of drought and heat stress on reproductive processes in cereals. Plant Cell Environ. 2008, 31, 11–38. [Google Scholar] [CrossRef] [PubMed]
  19. Lang-Mladek, C.; Popova, O.; Kiok, K.; Berlinger, M.; Rakic, B.; Aufsatz, W.; Jonak, C.; Hauser, M.-T.; Luschnig, C. Transgenerational Inheritance and Resetting of Stress-Induced Loss of Epigenetic Gene Silencing in Arabidopsis. Mol. Plant 2010, 3, 594–602. [Google Scholar] [CrossRef]
  20. Pecinka, A.; Dinh, H.; Baubec, T.; Rosa, M.; Lettner, N.; Scheid, O.M. Epigenetic Regulation of Repetitive Elements Is Attenuated by Prolonged Heat Stress in Arabidopsis. Plant Cell 2010, 22, 3118–3129. [Google Scholar] [CrossRef] [Green Version]
  21. Ayenan, M.A.T.; Danquah, A.; Hanson, P.; Ampomah-Dwamena, C.; Sodedji, F.A.K.; Asante, I.K.; Danquah, E.Y. Accelerating Breeding for Heat Tolerance in Tomato (Solanum lycopersicum L.): An Integrated Approach. Agronomy 2019, 9, 720. [Google Scholar] [CrossRef] [Green Version]
  22. Gonzalo, M.J.; Li, Y.-C.; Chen, K.-Y.; Gil, D.; Montoro, T.; Nájera, I.; Baixauli, C.; Granell, A.; Monforte, A.J. Genetic Control of Reproductive Traits in Tomatoes Under High Temperature. Front. Plant Sci. 2020, 11, 326. [Google Scholar] [CrossRef]
  23. Gonzalo, M.J.; Nájera, I.; Baixauli, C.; Gil, D.; Montoro, T.; Soriano, V.; Olivieri, F.; Rigano, M.M.; Ganeva, D.; Grozeva-Tileva, S.; et al. Identification of tomato accessions as source of new genes for improving heat tolerance: From controlled experiments to field. BMC Plant Biol. 2021, 21, 345. [Google Scholar] [CrossRef]
  24. Ruggieri, V.; Calafiore, R.; Schettini, C.; Rigano, M.M.; Olivieri, F.; Frusciante, L.; Barone, A. Exploiting Genetic and Genomic Resources to Enhance Heat-Tolerance in Tomatoes. Agronomy 2019, 9, 22. [Google Scholar] [CrossRef] [Green Version]
  25. Ebert, A.W.; Schafleitner, R. Utilization of wild Relatives in the breeding of tomato and other major vegetables. In Crop Wild Relatives and Climate Change; John Wiley & Sons, Inc.: Hoboken, NJ, USA, 2015; pp. 141–172. [Google Scholar]
  26. Grandillo, S.; Chetelat, R.; Knapp, S.; Spooner, D.; Peralta, I.; Cammareri, M.; Perez, O.; Termolino, P.; Tripodi, P.; Chiusano, M.L.; et al. Solanum sect. Lycopersicon. In Wild Crop Relatives: Genomic and Breeding Resources; Springer: Berlin/Heidelberg, Germany, 2011; pp. 129–215. [Google Scholar]
  27. Asins, M.J.; Bretó, M.P.; Cambra, M.; Carbonell, E.A. Salt tolerance in Lycopersicon species. I. Character definition and changes in gene expression. Theor. Appl. Genet. 1993, 86, 737–743. [Google Scholar] [CrossRef] [PubMed]
  28. Foolad, M.R. Current Status Of Breeding Tomatoes For Salt And Drought Tolerance. In Advances in Molecular Breeding Toward Drought and Salt Tolerant Crops; Springer: Amsterdam, The Netherlands, 2007; pp. 669–700. [Google Scholar] [CrossRef]
  29. Martínez-Cuenca, M.-R.; Pereira-Dias, L.; Soler, S.; López-Serrano, L.; Alonso, D.; Calatayud, Á.; Díez, M.J. Adaptation to Water and Salt Stresses of Solanum pimpinellifolium and Solanum lycopersicum var. cerasiforme. Agronomy 2020, 10, 1169. [Google Scholar] [CrossRef]
  30. Alam, M.; Sultana, N.; Ahmad, S.; Hossain, M.; Islam, A. Performance of heat tolerant tomato hybrid lines under hot, humid conditions. Bangladesh J. Agric. Res. 2010, 35, 367–373. [Google Scholar] [CrossRef]
  31. De la Peña, R.; Hughes, J. Improving Vegetable Productivity in a Variable Changing Climate. ICRISAT 2007, 4, 1–22. [Google Scholar]
  32. Golam, F.; Phorhan, Z.H.; Nezhadahmani, A.; Rahman, M. Heat tolerance in tomato. Life Sci. J. 2012, 9, 4. [Google Scholar]
  33. Nahar, K.; Ullah, S.M. Effect of Water Stress on Moisture Content Distribution in Soil and Morphological Characters of Two Tomato (Lycopersicon esculentum Mill) Cultivars. J. Sci. Res. 2011, 3, 677–682. [Google Scholar] [CrossRef] [Green Version]
  34. Nahar, K.; Ullah, S.M. Morphological and physiological characters of tomato (Lycopersicon esculentum Mill.) cultivars under water stress. Bangladesh J. Agric. Res. 2012, 37, 355–360. [Google Scholar] [CrossRef] [Green Version]
  35. Grilli, G.V.; Braz, G.L.T.; Lemos, E.G.M. QTL identification for tolerance to fruit set in tomato by fAFLP markers. Crop Breed. Appl. Biot. 2007, 7, 234–241. [Google Scholar] [CrossRef] [Green Version]
  36. Lin, K.-H.; Yeh, W.-L.; Chen, H.-M.; Lo, H.-F. Quantitative trait loci influencing fruit-related characteristics of tomato grown in high-temperature conditions. Euphytica 2010, 174, 119–135. [Google Scholar] [CrossRef]
  37. Wen, J.; Jiang, F.; Weng, Y.; Sun, M.; Shi, X.; Zhou, Y.; Yu, L.; Wu, Z. Identification of heat-tolerance QTLs and high-temperature stress-responsive genes through conventional QTL mapping, QTL-seq and RNA-seq in tomato. BMC Plant Biol. 2019, 19, 398. [Google Scholar] [CrossRef] [PubMed]
  38. Xu, J.; Driedonks, N.; Rutten, M.J.M.; Vriezen, W.H.; De Boer, G.-J.; Rieu, I. Mapping quantitative trait loci for heat tolerance of reproductive traits in tomato (Solanum lycopersicum). Mol. Breed. 2017, 37, 58. [Google Scholar] [CrossRef] [PubMed]
  39. Bineau, E.; Diouf, I.; Carretero, Y.; Duboscq, R.; Bitton, F.; Djari, A.; Zouine, M.; Causse, M. Genetic diversity of tomato response to heat stress at the QTL and transcriptome levels. Plant J. 2021, 107, 1213–1227. [Google Scholar] [CrossRef] [PubMed]
  40. Zhu, J.-K. Abiotic Stress Signaling and Responses in Plants. Cell 2016, 167, 313–324. [Google Scholar] [CrossRef] [PubMed] [Green Version]
  41. Rivero, R.M.; Ruiz, J.M.; Garcia, P.C.; Lopez-Lefebre, L.R.; Sanchez, E.; Romero, L. Resistance to cold and heat stress: Accumulation of phenolic compounds in tomato and watermelon plants. Plant Sci. 2001, 160, 315–321. [Google Scholar] [CrossRef]
  42. Genoud, T.; Métraux, J.-P. Crosstalk in plant cell signaling: Structure and function of the genetic network. Trends Plant Sci. 1999, 4, 503–507. [Google Scholar] [CrossRef]
  43. Sabehat, A.; Weiss, D.; Lurie, S. Heat-shock proteins and cross-tolerance in plants. Physiol. Plant. 1998, 103, 437–441. [Google Scholar] [CrossRef]
  44. Falconer, D.S.; Mackay, T.F.C. Introduction to Quantitative Genetics, 4th ed.; Longmans Green: London, UK, 1996. [Google Scholar]
  45. Carlborg, Ö.; Haley, C. Epistasis: Too often neglected in complex trait studies? Nat. Rev. Genet. 2004, 5, 618–625. [Google Scholar] [CrossRef]
  46. Xu, J.; Wolters-Arts, A.; Mariani, C.; Huber, H.; Rieu, I. Heat stress affects vegetative and reproductive performance and trait correlations in tomato (Solanum lycopersicum). Euphytica 2017, 213, 156. [Google Scholar] [CrossRef] [Green Version]
  47. Sato, S.; Kamiyama, M.; Iwata, T.; Makita, N.; Furukawa, H.; Ikeda, H. Moderate Increase of Mean Daily Temperature Adversely Affects Fruit Set of Lycopersicon esculentum by Disrupting Specific Physiological Processes in Male Reproductive Development. Ann. Bot. 2006, 97, 731–738. [Google Scholar] [CrossRef]
  48. Sato, S.; Peet, M.M.; Gardner, R.G. Altered flower retention and developmental patterns in nine tomato cultivars under elevated temperature. Sci. Hortic. 2004, 101, 95–101. [Google Scholar] [CrossRef]
  49. Capel, C.; Del Carmen, A.F.; Alba, J.M.; Lima-Silva, V.; Hernández-Gras, F.; Salinas, M.; Boronat, A.; Angosto, T.; Botella, M.A.; Fernandez-Muñoz, R.; et al. Wide-genome QTL mapping of fruit quality traits in a tomato RIL population derived from the wild-relative species Solanum pimpinellifolium L. Theor. Appl. Genet. 2015, 128, 2019–2035. [Google Scholar] [CrossRef] [PubMed]
  50. Devicente, M.C.; Tanksley, S.D. QTL analysis of transgressive segregation in an interspecific tomato cross. Genetics 1993, 134, 585–596. [Google Scholar] [CrossRef] [PubMed]
  51. Monforte, A.; Friedman, E.; Zamir, D.; Tanksley, S.D. Comparison of a set of allelic QTL-NILs for chromosome 4 of tomato: Deductions about natural variation and implications for germplasm utilization. Theor. Appl. Genet. 2001, 102, 572–590. [Google Scholar] [CrossRef]
  52. Ashrafi, H.; Kinkade, M.; Foolad, R. A new genetic linkage of tomato based on a Solanum lycopersicum x S. pimpinellifolium RIL population displaying locations of candidate pathogen response genes. Genome 2009, 52, 935–956. [Google Scholar] [CrossRef]
  53. Bhandari, P.; Lee, T.G. A Genetic Map and Linkage Panel for the Large-fruited Fresh-market Tomato. J. Am. Soc. Hortic. Sci. 2021, 146, 125–131. [Google Scholar] [CrossRef]
  54. Olivieri, F.; Calafiore, R.; Francesca, S.; Schettini, C.; Chiaiese, P.; Rigano, M.M.; Barone, A. High-Throughput Genotyping of Resilient Tomato Landraces to Detect Candidate Genes Involved in the Response to High Temperatures. Genes 2020, 11, 626. [Google Scholar] [CrossRef]
  55. Mackay, T.F.C. Epistasis and quantitative traits: Using model organisms to study gene–gene interactions. Nat. Rev. Genet. 2013, 15, 22–33. [Google Scholar] [CrossRef] [Green Version]
  56. Monforte, A.J.; Asíns, M.J.; Carbonell, E.A. Salt tolerance in Lycopersicon species. V. Does genetic variability at quantitative trait loci affect their analysis? Theor. Appl. Genet. 1997, 95, 284–293. [Google Scholar] [CrossRef]
  57. Villalta, I.; Reina-Sánchez, A.; Bolarín, M.C.; Cuartero, J.; Belver, A.; ·Venema, K.; Carbonell, E.A.; Asin, M.J. Genetic analysis of Na+ and K+ concentrations in leaf and stem as physiological components of salt tolerance in tomato. Theor. Appl. Genet. 2008, 116, 8869–8880. [Google Scholar] [CrossRef]
  58. Doganlar, S.; Frary, A.; Ku, H.-M.; Tanksley, S.D. Mapping quantitative trait loci in inbred backcross lines of Lycopersicon pimpinellifolium (LA1589). Genome 2002, 45, 1189–1202. [Google Scholar] [CrossRef] [Green Version]
  59. JMP® Version 12.1.0; SAS Institute Inc.: Cary, NC, USA, 2021.
  60. Resende, M.D.V. Software Selegen-REML/BLUP: A useful tool for plant breeding. Crop Breed. Appl. Biotech. 2016, 16, 330–339. [Google Scholar] [CrossRef]
  61. Resende, M.D.V. Genética Biométrica e Estatística no Melhoramento de Plantas Perenes, 1st ed.; Embrapa: Brasília, Brazil, 2002; 975p. [Google Scholar]
  62. Asins, M.J.; Raga, V.; Roca, D.; Belver, A.; Carbonell, E.A. Genetic dissection of tomato rootstock effects on scion traits under moderate salinity. Theor. Appl. Genet. 2015, 128, 667–679. [Google Scholar] [CrossRef] [PubMed]
  63. Sim, S.-C.; Durstewitz, G.; Plieske, J.; Wieseke, R.; Ganal, M.W.; Van Deynze, A.; Hamilton, J.P.; Buell, C.R.; Causse, M.; Wijeratne, S.; et al. Development of a Large SNP Genotyping Array and Generation of High-Density Genetic Maps in Tomato. PLoS ONE 2012, 7, e40563. [Google Scholar] [CrossRef] [PubMed]
  64. Doyle, J.J.; Doyle, J.L. Isolation of plant DNA from fresh tissue. Focus 1990, 12, 13–15. [Google Scholar]
  65. Díaz, A.; Martín-Hernández, A.M.; Dolcet-Sanjuan, R.; Garces-Claver, A.; Álvarez, J.M.; Garcia-Mas, J.; Pico, M.B.; Monforte, A.J. Quantitative trait loci analysis of melon (Cucumis melo L.) domestication-related traits. Theor. Appl. Genet. 2017, 130, 1837–1856. [Google Scholar] [CrossRef]
  66. Barchi, L.; Acquadro, A.; Alonso, D.; Aprea, G.; Bassolino, L.; Demurtas, O.; Ferrante, P.; Gramazio, P.; Mini, P.; Portis, E.; et al. Single Primer Enrichment Technology (SPET) for High-Throughput Genotyping in Tomato and Eggplant Germplasm. Front. Plant Sci. 2019, 10, 1005. [Google Scholar] [CrossRef] [Green Version]
  67. Bradbury, P.J.; Zhang, Z.; Kroon, D.E.; Casstevens, T.M.; Ramdoss, Y.; Buckler, E.S. TASSEL: Software for association mapping of complex traits in diverse samples. Bioinformatics 2007, 23, 2633–2635. [Google Scholar] [CrossRef]
  68. Gore, M.A.; Fang, D.D.; Poland, J.A.; Zhang, J.; Percy, R.G.; Cantrell, R.G.; Thyssen, G.; Lipka, A.E. Linkage Map Construction and Quantitative Trait Locus Analysis of Agronomic and Fiber Quality Traits in Cotton. Plant Genome 2014, 7. [Google Scholar] [CrossRef] [Green Version]
  69. Meng, L.; Li, H.; Zhang, L.; Wang, J. QTL IciMapping: Integrated software for genetic linkage map construction and quantitative trait locus mapping in bi-parental populations. Crop J. 2015, 3, 269–283. [Google Scholar] [CrossRef] [Green Version]
  70. Kale, S.; Jaganathan, D.; Ruperao, P.; Chen, C.; Punna, R.; Kudapa, H.; Thudi, M.; Roorkiwal, M.; Katta, M.A.; Doddamani, D.; et al. Prioritization of candidate genes in “QTL-hotspot” region for drought tolerance in chickpea (Cicer arietinum L.). Sci. Rep. 2015, 5, 15296. [Google Scholar] [CrossRef] [PubMed] [Green Version]
  71. Kosambi, D.D. The estimation of map distances from recombination values. Ann. Eugen. 1943, 12, 172–175. [Google Scholar] [CrossRef]
  72. R Development Core Team. R: A language and environment for statistical computing. R Foundation for Statistical Computing, Vienna, Austria. 2020. Available online: https://www.R-project.org/ (accessed on 7 September 2021).
  73. Ouellette, L.A.; Reid, R.W.; Blanchard, S.G.; Brouwer, C.R. LinkageMapView-rendering high-resolution linkage and QTL maps. Bioinformatics 2018, 34, 306–307. [Google Scholar] [CrossRef] [PubMed] [Green Version]
  74. Voorrips, R.E. MapChart: Software for the graphical presentation of linkage maps and QTLs. J. Hered. 2002, 93, 77–78. [Google Scholar] [CrossRef] [PubMed] [Green Version]
  75. Van Ooijen, J.W. MapQTL 6. Software for the Mapping of Quantitative Trait Loci in Experimental Populations of Diploid Species; Kyazma BV: Wageningen, The Netherlands, 2009. [Google Scholar]
Figure 1. Histograms depicting the distribution of reproductive traits in the RIL population E9×L5. Reproductive traits, (A) flower numbers (FLN), (B) fruit numbers (FRN) and (C) fruit sets (FRS) were studied in 2018 and 2019 under three temperature regimes (T1: 25 °C day/20 °C night; T2: 30 °C day/25 °C night; T3: 35 °C day/30 °C night).
Plants 11 01069 g001
Figure 2. Examples of epistatic interaction patterns. The means of genotypic classes for the four possible homozygous allelic combinations (E9 and L5) are depicted for two pairs of markers showing significant epistatic interactions: (A) dominant epistasis for number of flowers under T3 (FLN_T3); (B) co-adaptive epistasis for number of fruits under T1 (FRN_T1); (C) transgressive epistasis for numbers of flowers under T1 (FLN_T1).
Plants 11 01069 g002
Figure 3. Histograms depicting the distribution of reproductive traits in the RIL population E6203×LA1589. (A) Flower number (FLN), (B) fruit number (FRN) and (C) fruit set (FRS) reproductive traits were studied in 2018 and 2019 for three temperature regimes (T1: 25 °C day/20 °C night; T2: 30 °C day/25 °C night; T3: 35 °C day/30 °C night).
Plants 11 01069 g003
Table 1. Linear correlations in the E9×L5 population between the (A) FLN (flower number), (B) FRN (fruit number) and (C) FRS (fruit set) traits by year (2018 and 2019) and the three temperature regimes (T1: 25 °C day/20 °C night; T2: 30 °C day/25 °C night; T3: 35 °C day/30 °C night). Note: ** p < 0.01; * p < 0.05. The correlations within years are highlighted in grey, while the correlations between years are framed in orange.
(A)18FLN_T118FLN_T218FLN_T319FLN_T119FLN_T2
18FLN_T20.37 **
18FLN_T30.31 **0.63 **
19FLN_T10.56 **0.30 **0.23 *
19FLN_T20.55 **0.40 **0.25 **0.63 **
19FLN_T30.40 **0.39 **0.24 **0.47 **0.47 **
(B)18FRN_T118FRN_T218FRN_T319FRN_T119FRN_T2
18FRN_T20.44 **
18FRN_T30.170.07
19FRN_T10.54 **0.36 **0.05
19FRN_T20.40 **0.39 **0.120.52 **
19FRN_T30.24 *0.130.19 *0.33 **0.39 **
(C)18FRS_T118FRS_T218FRS_T319FRS_T119FRS_T2
18FRS_T20.02
18FRS_T30.030.07
19FRS_T10.150.19 *0.03
19FRS_T20.150.03−0.110.39 **
19FRS_T30.14−0.150.21 *0.20 *0.34 *
Table 2. Coefficients of repeatability for the reproductive traits (FLN, FRN and FRS) and non-transformed data, log-transformed data and plasticity indexes for the E9×L5 population.
Repeatability Coefficient
Non-TransformedLog-Transformed Plasticity Indexes
FLN_T10.58LogFLN_T10.53pFLN_T210.10
FLN_T20.47LogFLN_T20.43pFLN_T310.18
FLN_T30.33LogFLN_T30.24pFLN_T320.12
FRN_T10.57LogFRN_T10.56pFRN_T210.08
FRN_T20.40LogFRN_T20.42pFRN_T310.09
FRN_T30.07LogFRN_T30pFRN_T320
FRS_T10.15LogFRS_T10pFRS_T210
FRS_T20.06LogFRS_T20.14pFRS_T310.18
FRS_T30.17LogFRS_T30.17pFRS_T320.06
Table 3. QTLs detected for the reproductive flower number (FLN), fruit number (FRN) and fruit set (FRS) traits, along with non-transformed data, log-transformed data and plasticity indexes at different temperature regimes (T1: 25 °C day/20 °C night; T2: 30 ° C day/25 °C night; T3: 35 °C day/30 °C night) in two experiments (2018 and 2019) as assessed by multi-environment QTL analysis with ICIMapping. QTLs are named using the trait abbreviation, followed by the chromosome number, the number of QTLs within the chromosome, the temperature regime and the suffix _2E. Plasticity QTLs are indicated by the p prefix. The estimates for each QTL include: maximum LOD score for genetic effects (LOD), LOD score of additive effects (LOD (A)), LOD score for the interactions of additive effects with the environment (LOD (AbyE)), percentages of phenotypic variance explained by the QTL (PVE) and additive effects (A), interactions of additives with the environment (AbyE) and the additive value (Add), which was negative when L5 alleles increased the trait and positive when E9 alleles increased it.
TraitTemp.QTL NameChr.Position (cM)Physical PositionLeft MarkerRight Marker LODLOD (A)LOD (AbyE)PVEPVE (A)PVE (AbyE)Add
FLNT1fln1.1_T1_2E14868,120,455solcap_snp_sl_50576solcap_snp_sl_505718.878.530.3421.6416.45.23−1.76
fln1.2_T1_2E18777,186,438solcap_snp_sl_34622solcap_snp_sl_278324.862.562.36.94.712.19−0.9
fln11.1_T1_2E118250,661,076solcap_snp_sl_100998solcap_snp_sl_562954.241.572.675.852.872.98−0.71
T2fln1.1_T2_2E113285,588,938solcap_snp_sl_40586solcap_snp_sl_405954.532.432.13.523.430.09−1.28
fln2.1_T2_2E25841,414,628solcap_snp_sl_23884solcap_snp_sl_2976610.057.662.3912.512.180.32−2.48
fln5.1_T2_2E5373,934,485solcap_snp_sl_23738solcap_snp_sl_237334.81.812.993.112.570.54−1.1
FRNT1frn1.1_T1_2E14868,120,455solcap_snp_sl_50576solcap_snp_sl_505719.995.864.1322.4311.2711.16−0.98
frn1.2_T1_2E113486,020,297solcap_snp_sl_54525solcap_snp_sl_545354.774.680.098.888.690.2−0.82
frn4.1_T1_2E48560,537,037 solcap_snp_sl_47056CL017798-08494.232.931.38.625.53.12−0.67
frn5.1_T1_2E5474,941,314solcap_snp_sl_48814solcap_snp_sl_506874.723.161.569.155.983.17−0.68
frn5.2_T1_2E57561,030,288solcap_snp_sl_22609solcap_snp_sl_371914.662.711.969.545.064.47−0.63
frn9.1_T1_2E9394,450,858solcap_snp_sl_39533solcap_snp_sl_395174.222.112.118.144.034.12−0.56
frn11.1_T1_2E118250,661,076solcap_snp_sl_100998solcap_snp_sl_562954.231.852.388.133.494.63−0.52
T2frn1.1_T2_2E14868,120,455solcap_snp_sl_50576solcap_snp_sl_505714.123.870.256.666.310.35−1.47
frn2.1_T2_2E25741,022,238solcap_snp_sl_100921solcap_snp_sl_1005594.753.671.086.26.170.03−1.43
LogFLNT1flnlog1.1_T1_2E14868,120,455solcap_snp_sl_50576solcap_snp_sl_505719.258.830.4216.6915.051.64−0.06
T2flnlog2.1_T2_2E25841,414,628solcap_snp_sl_23884solcap_snp_sl_2976610.829.361.4517.6717.340.33−0.08
flnlog5.1_T2_2E5373,934,485solcap_snp_sl_23738solcap_snp_sl_237335.062.652.416.574.462.12−0.04
flnlog10.1_T2_2E107162,415,424solcap_snp_sl_33804solcap_snp_sl_337973.893.850.046.346.10.240.04
T3flnlog6.1_T3_2E68643,388,539solcap_snp_sl_57203solcap_snp_sl_571554.243.730.57.157.130.02−0.06
LogFRNT1frnlog1.1_T1_2E113586,635,078solcap_snp_sl_54535solcap_snp_sl_317754.24.040.156.726.260.46−0.05
frnlog2.1_T1_2E25340,380,985solcap_snp_sl_49669solcap_snp_sl_496797.175.1828.838.560.27−0.05
frnlog5.1_T1_2E57560,779,710solcap_snp_sl_22609solcap_snp_sl_371915.691.893.85.643.072.58−0.03
T2frnlog2.1_T2_2E26245,664,881solcap_snp_sl_42692solcap_snp_sl_426785.024.40.6210.969.621.34−0.08
LogFRST3frslog5.1_T3_2E5162,246,381solcap_snp_sl_49182solcap_snp_sl_491275.981.514.478.473.484.990.05
frslog5.2_T3_2E5555,969,101solcap_snp_sl_50819solcap_snp_sl_50503.92.411.4965.160.84−0.05
pFLN_T31T3 vs. T1pfln1.1_T31_2E15671,079,273solcap_snp_sl_38059solcap_snp_sl_380785.013.021.988.76.272.430.1
T3 vs. T1pfln6.1_T31_2E68142,683,699solcap_snp_sl_57294solcap_snp_sl_572524.653.810.848.267.640.62−0.11
pFRN_T31T3 vs. T1pfrn2.1_T31_2E23437,011,375solcap_snp_sl_29543solcap_snp_sl_1363263.5262.361.1620.2810.459.83−0.33
T3 vs. T1pfrn3.1_T31_2E312263,813,612solcap_snp_sl_33829solcap_snp_sl_612384.293.780.510.370.270.10.05
pFRN_T32T3 vs. T2pfrn5.1_T32_2E571,527,883solcap_snp_sl_52738solcap_snp_sl_527483.430.492.9414.593.4711.110.06
Table 4. Epistatic interactions in the E9×L5 population for non-transformed data, log-transformed data and plasticity traits. Reproductive trait, flower number (FLN), fruit number (FRN) and fruit set (FRS) values were studied in three different temperature regimes (T1: 25 °C day/20 °C night; T2: 30 °C day/25 °C night; T3: 35 °C day/30 °C night). A multi-environment QTL analysis was performed with ICIMapping. QTL1 and QTL2 columns indicate major effect QTLs identified in the E9×L5 and E6203×LA1589 population. The statistical significance (p-value) of the two-way ANOVA and the epistasis types (transgressive, co-adaptive and dominant) is also presented.
Chr1/Position1QTL1Chr2/Position2QTL2ANOVA_18 p-ValueANOVA-19 p-Value
TraitTempChrPos (cM) 123456789101112 Epistasis Type
FLNT1185 20 fln1.2_T2_2Ensns-
620 10 <0.0001 0.0008 transgressive
T280 60 0.0001nsco-adaptive
845 40 fln9.1_T1_180.0014nsdominant
1125 65 0.00050.0288dominant
T3960BCfln9.1_T1 65 fln/frn11.1_T1<0.0001 nsdominant
FRNT1745 75 0.0006 0.0005 co-adaptive
T2465 70 frn10.1_T2_180.0001 nsdominant
620 30 <0.0001 nstransgressive
760 95 BCfln9.1_T20.0008nsco-adaptive
115 65frn11.1_T1_2E0.0025nstransgressive
T33105fln3.3_T1_19 5 ns<0.0001transgressive
795frs7.2_T2_18 0 ns<0.0001transgressive
FRST13120fln3.1_T1_19 95 BCfln9.1_T20.00020.0003transgressive
Log FLNT38100 105 <0.0001nstransgressive
Log FRNT1745 75 0.0009 0.0005co-adaptive
T2760 95 <0.0001 nsdominant
Log FRST13115 90 0.0002 0.0015dominant
T2240 5 ns0.0001dominant
T3520 25 frslog5.1_T3_2E0.0002nstransgressive
pFLNT2 vs. T180 60 <0.0001nsco-adaptive
T3 vs. T1735 0 <0.0001 nsdominant
pFRST3 vs. T220 25 <0.0001nsdominant
235 25 <0.0001nsdominant
Table 5. Linear correlations in the E6203×LA1589 population among (A) FLN (flower number), (B) FRN (fruit number) and (C) FRS (fruit set) for different experimental years (2018 and 2019) and temperature regimes (T1: 25 °C day/20 °C night; T2: 30 °C day/25 °C night; T3: 35 °C day/30 °C night). Note: ** p < 0.01; * p < 0.05. Significant correlations within years are highlighted in grey and correlations between years are framed in orange.
(A)18FLN_T118FLN_T218FLN_T319FLN_T119FLN_T2
18FLN_T20.32 **
18FLN_T30.42 **0.57 **
19FLN_T10.39 **0.220.32 **
19FLN_T20.23 *0.34 **0.28 *0.51 **
19FLN_T30.220.24 *0.31 **0.36 **0.32 **
(B)18FRN_T118FRN_T218FRN_T319FRN_T119FRN_T2
18FRN_T20.16
18FRN_T30.070.33 **
19FRN_T10.53 **0.150.12
19FRN_T20.34 **0.31 **0.23 *0.52 **
19FRN_T30.180.13−0.040.25 *0.23 **
(C)18FRS_T118FRS_T218FRS_T319FRS_T119FRS_T2
18FRS_T20.06
18FRS_T30.020.18
19FRS_T10.180.06−0.06
19FRS_T20.170.090.27 *0.29 **
19FRS_T30.090.12−0.010.010.07
Table 6. Coefficients of repeatability for the reproductive traits (FLN, FRN and FRS) for non-transformed data, log-transformed data and plasticity indexes for the E6203×LA1589 population.
Repeatability Coefficient
Non-TransformedLog-Transformed Plasticity Traits
FLN_T10.39LogFLN_T10.37pFLN_T210.17
FLN_T20.33LogFLN_T20.31pFLN_T310.23
FLN_T30.31LogFLN_T30.36pFLN_T320.15
FRN_T10.52LogFRN_T10.51pFRN_T210.07
FRN_T20.30LogFRN_T20.30PFRN_T310.00
FRN_T30.00LogFRN_T30.08pFRN_T320.00
FRS_T10.17LogFRS_T10.10pFRS_T210.00
FRS_T20.09LogFRS_T20.03pFRS_T310.00
FRS_T30.00LogFRS_T30.00pFRS_T320.00
Table 7. QTLs detected in the E6203×LA1589 population for the flower number (FLN), fruit number (FRN) and fruit set (FRS) reproductive traits with non-transformed data, log-transformed data and plasticity indexes at different temperature regimes (T1: 25 °C day/20 °C night; T2: 30 °C day/25 °C night; T3: 35 °C day/30 °C night) in two experiments (2018 and 2019) using multi-environment QTL analysis with ICIMapping. QTLs are named with the trait abbreviation, followed by the chromosome number, the number of QTLs within the chromosome, the temperature regime and the suffix _2E. The estimates for each QTL include: maximum LOD score for genetic effects (LOD), LOD score of additive effects (LOD (A)), LOD score for the interaction of additive effects with environment (LOD (AbyE)), percentages of phenotypic variance explained by the QTL (PVE) and additive effects (A), interaction additive by environment (AbyE) and the additive value (Add), being negative when LA1589 alleles increased the trait and positive when E6203 increased it.
TraitTemp.QTL NameChr.Position (cM)Physical PositionLeft MarkerRight MarkerLODLOD (A)LOD (AbyE)PVEPVE (A)PVE (AbyE)Add
FLNT1BCfln9.1_T1_2E95863,339,8143945-CH09_633398143948-CH09_634570064.353.530.8210.128.591.53−0.75
BCfln10.1_T1_2E106261,961,6744437-CH10_619616744440-CH10_621443356.916.610.3016.7216.200.520.98
T2BCfln9.1_T2_2E97666,172,5673998-CH09_661725674001-CH09_663607174.023.810.2112.7711.711.06−0.89
T3BCfln2.1_T3_2E211150,499,3081176-CH02_504993081184-CH02_511309404.964.780.1815.2714.151.120.87
FRNT1BCfrn2.1_T1_2E26841,605,3511003-CH02_416053511026-CH02_432911589.327.841.4822.4818.973.511.31
BCfrn10.1_T1_2E10374,411,4654225-CH10_44114654304-CH10_440208934.683.621.0610.068.441.620.54
FRST1BCfrs7.1_T1_2E701,345,5112947-CH07_13455112975-CH07_26499738.478.320.1527.8223.903.9221.01
LogFLNT1BCflnlog2.1_T1_2E26841,605,3511003-CH02_416053511026-CH02_432911585.705.530.1618.1415.272.870.08
BCflnlog10.1_T1_2E106261,961,6744437-CH10_619616744440-CH10_621443357.006.870.1320.0320.000.030.07
T3BCflnlog2.1_T3_2E211150,499,3081176-CH02_504993081184-CH02_511309406.746.680.0619.4117.212.190.17
LogFRNT1BCfrnlog2.1_T1_2E26841,605,3511003-CH02_416053511026-CH02_4329115811.8011.640.1638.0830.437.650.18
T3BCfrnlog2.1_T3_2E2033,365,408852-CH02_33365408874-CH02_344726755.462.802.6620.1411.838.300.16
LogFRST1BCfrslog7.1_T1_2E701,345,5112947-CH07_13455112975-CH07_264997312.6412.610.0374.0149.1324.870.22
pFLN_T21T2 vs. T1pBCfln1.1_T21_2E14276,264,322282-CH01_76264322292-CH01_7711530431.0429.911.1339.1221.7017.420.67
pFLN_T31T3 vs. T1pBCfln2.1_T31_2E211150,499,3081176-CH02_504993081184-CH02_511309404.904.890.0119.1217.701.430.14
pFRS_T32T3 vs. T2pBCfrs2.1_T32_2E213553,826,2951255-CH02_538262951260-CH02_5401487221.8417.983.8621.1112.278.84−1.24
Publisher’s Note: MDPI stays neutral with regard to jurisdictional claims in published maps and institutional affiliations.

