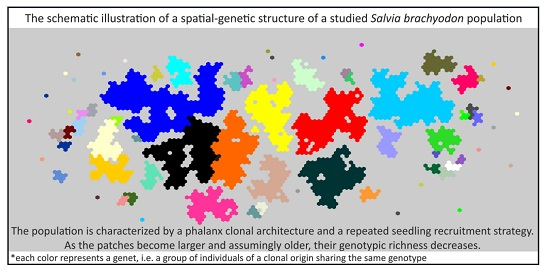
The Influence of a Seedling Recruitment Strategy and a Clonal Architecture on a Spatial Genetic Structure of a Salvia brachyodon (Lamiaceae) Population

 , , , ,
Abstract
:
1. Introduction
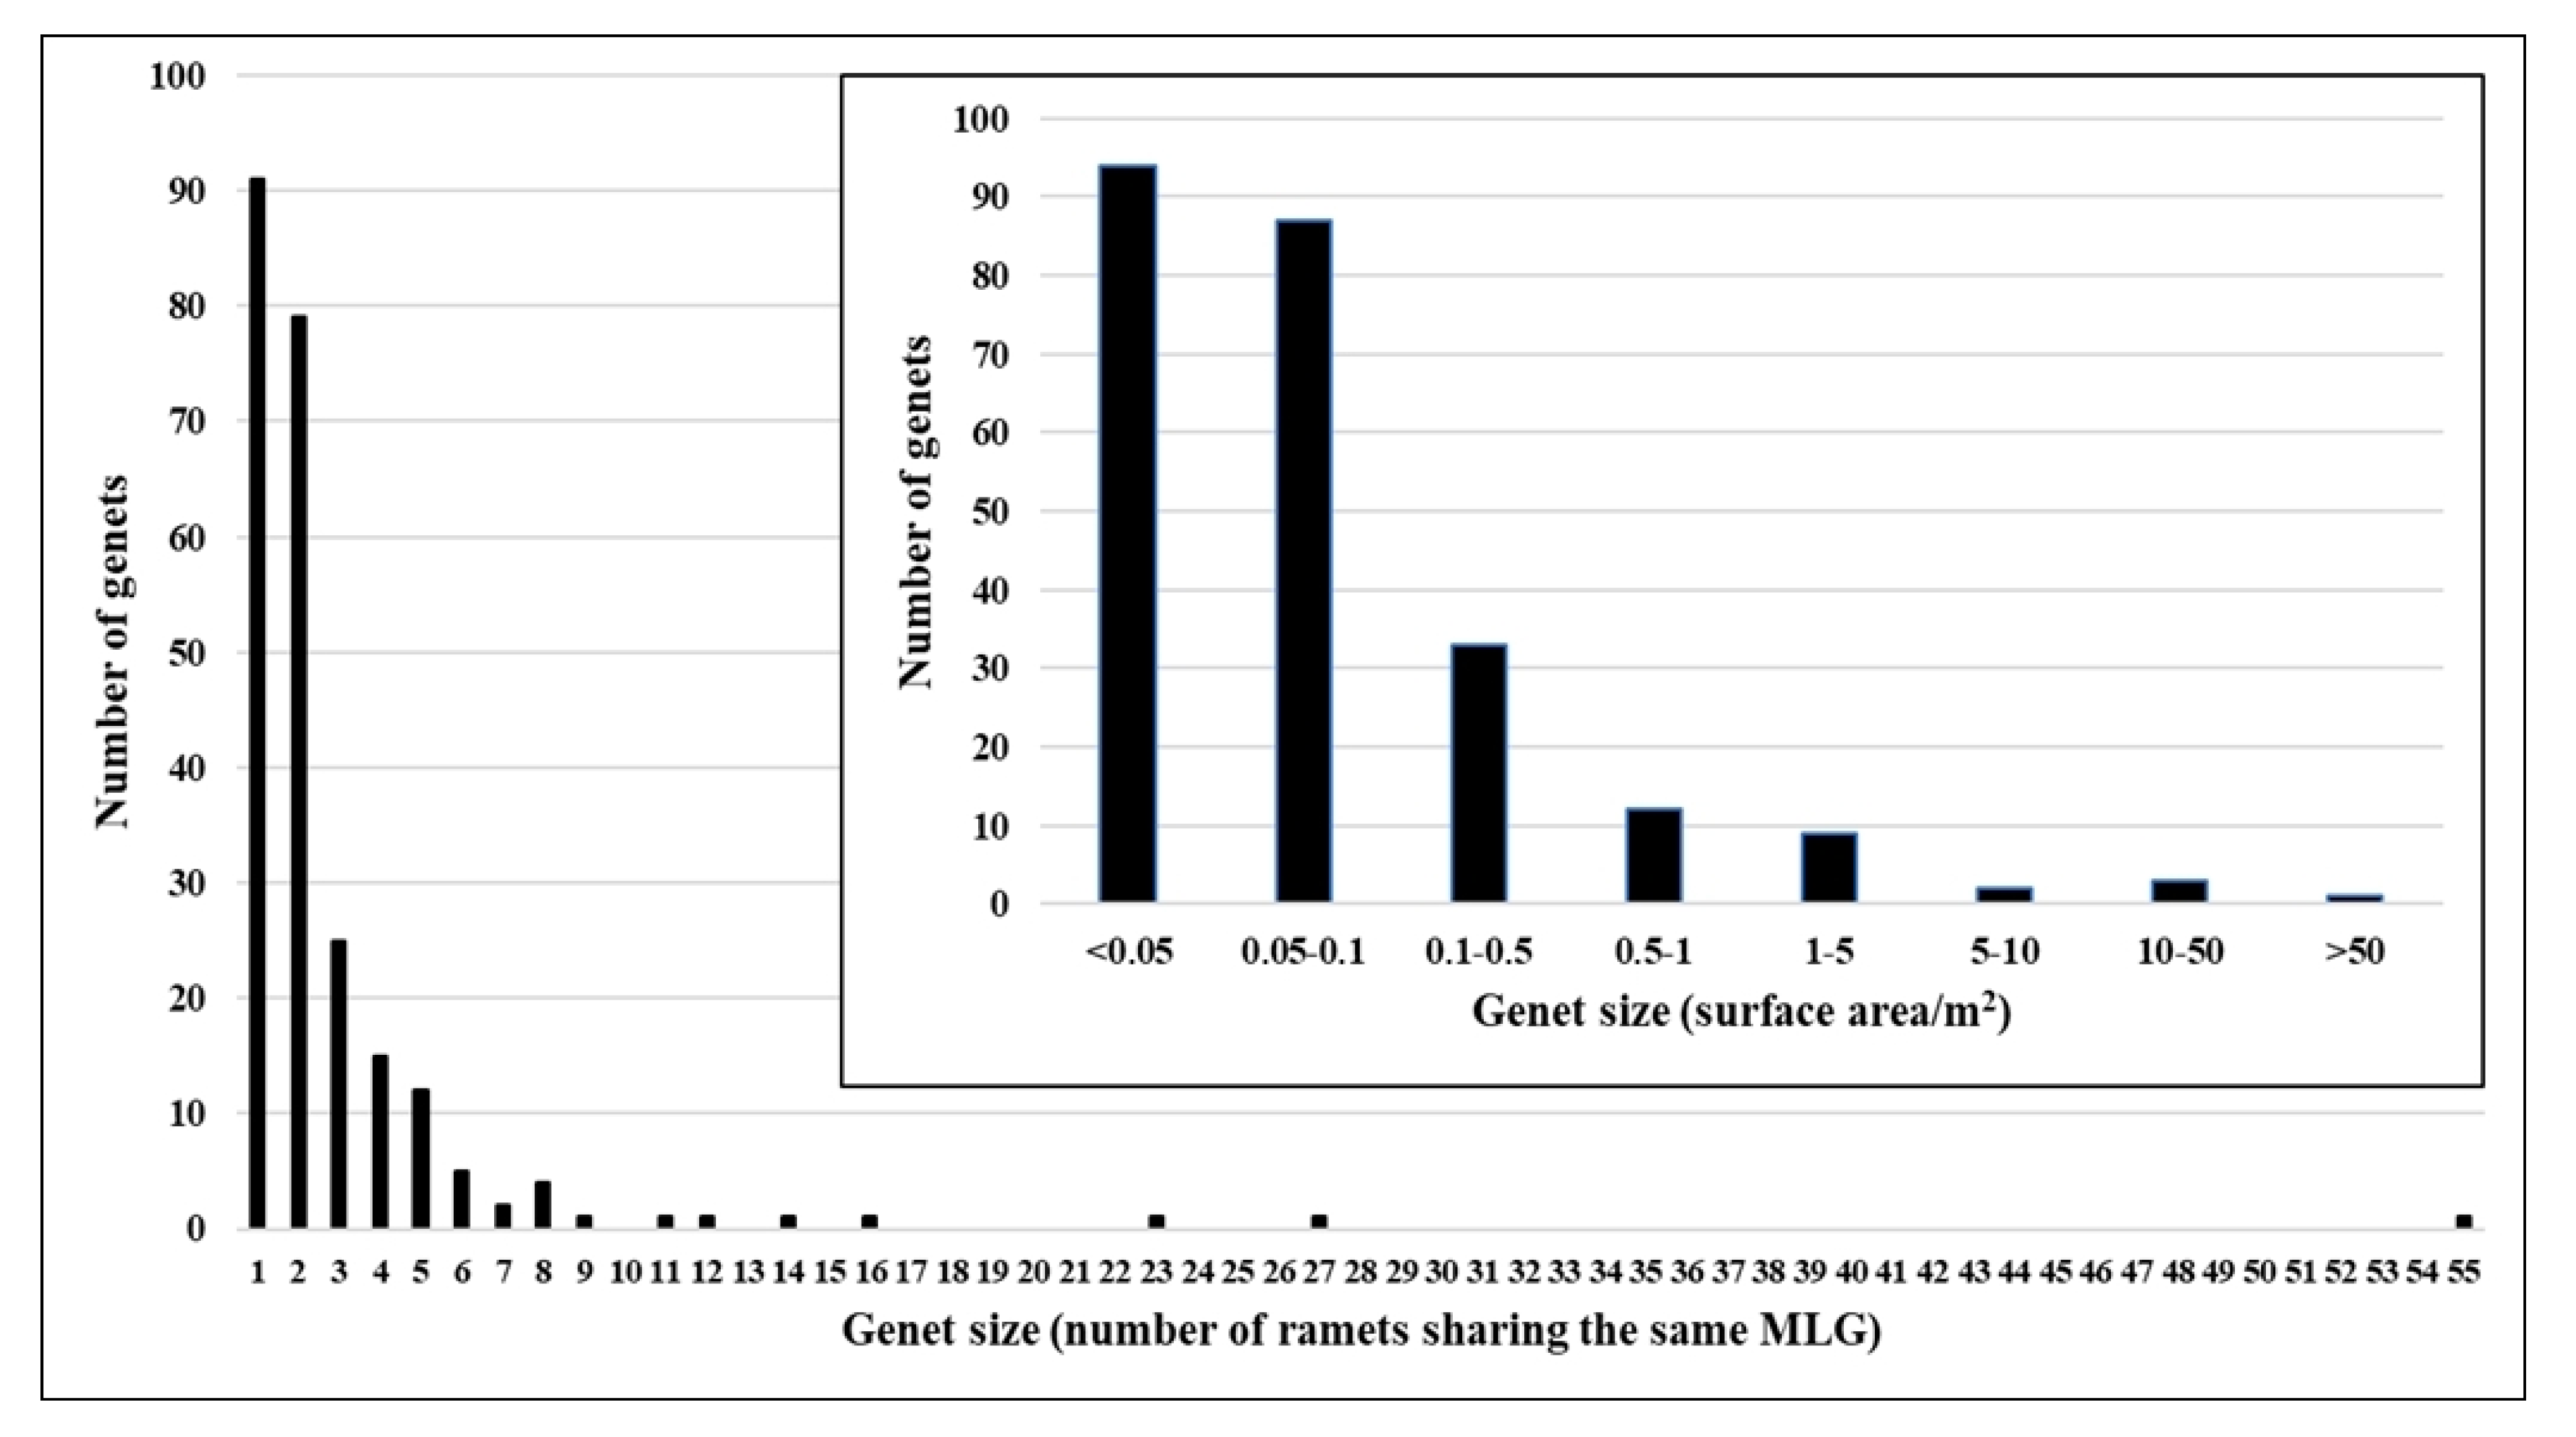
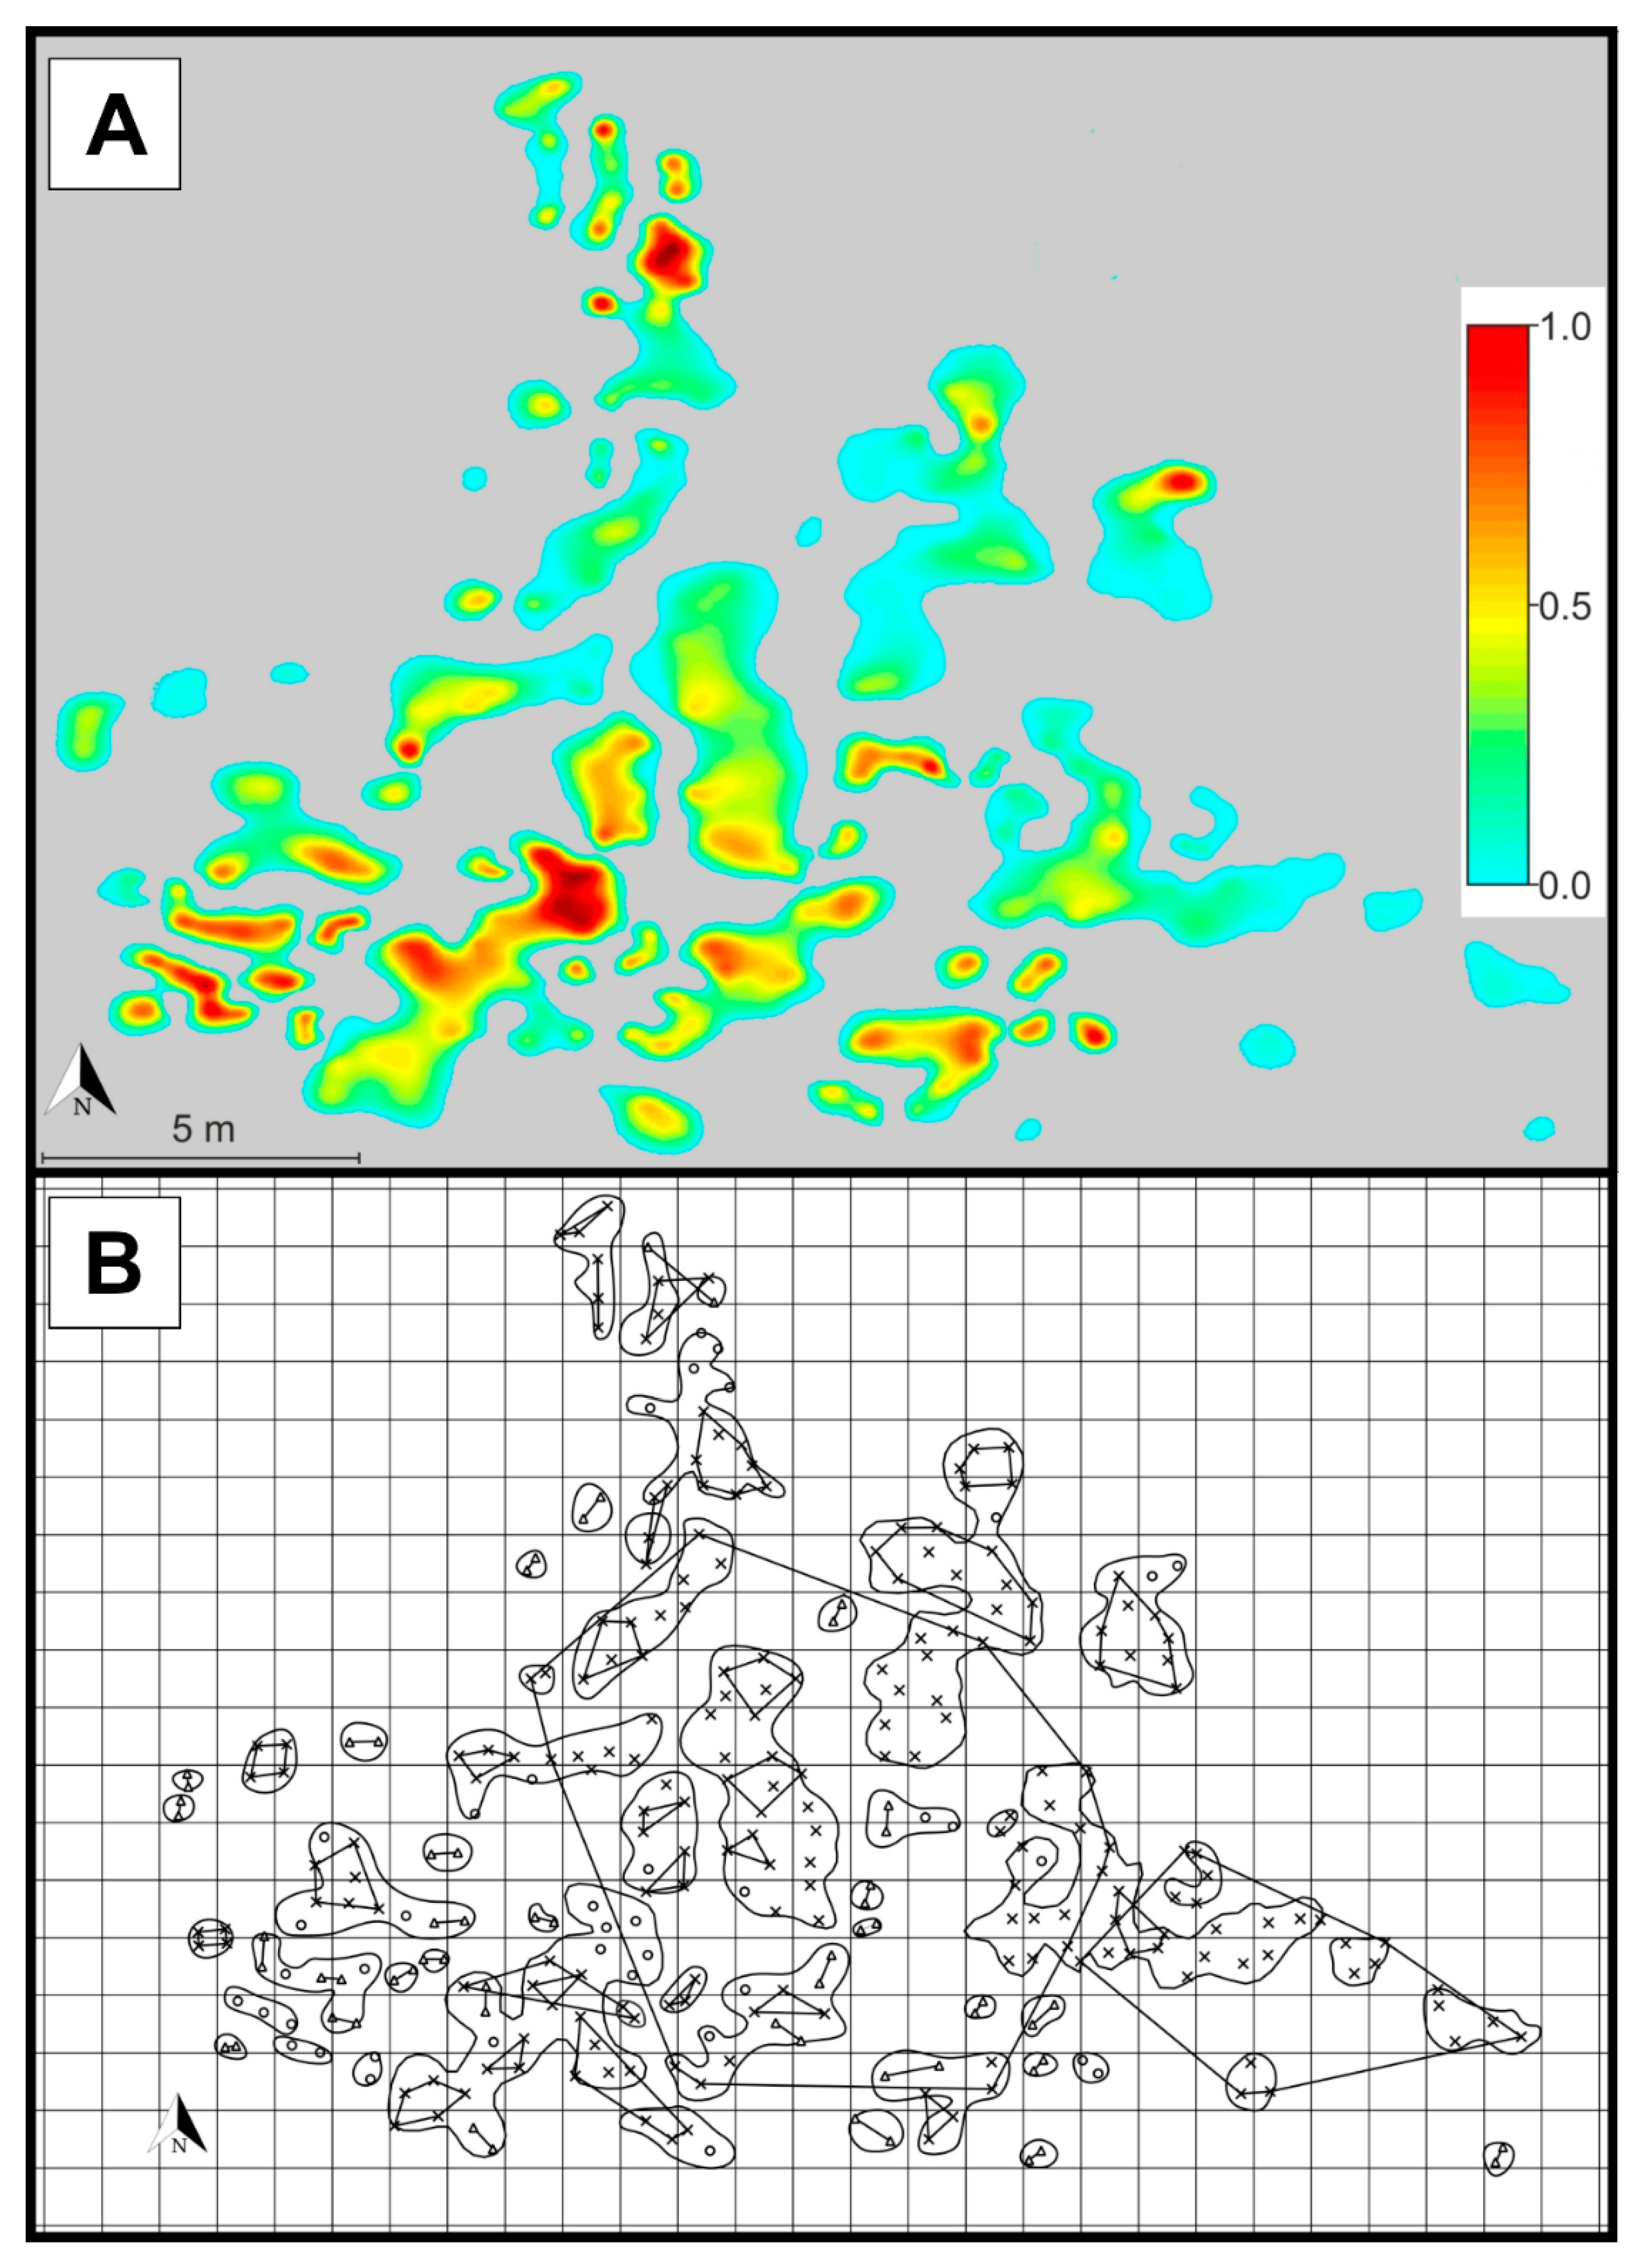
2. Results
3. Discussion
4. Materials and Methods
4.1. Population Description, Sampling Strategy, DNA Extraction and Genotyping
4.2. Population Level Data Analysis
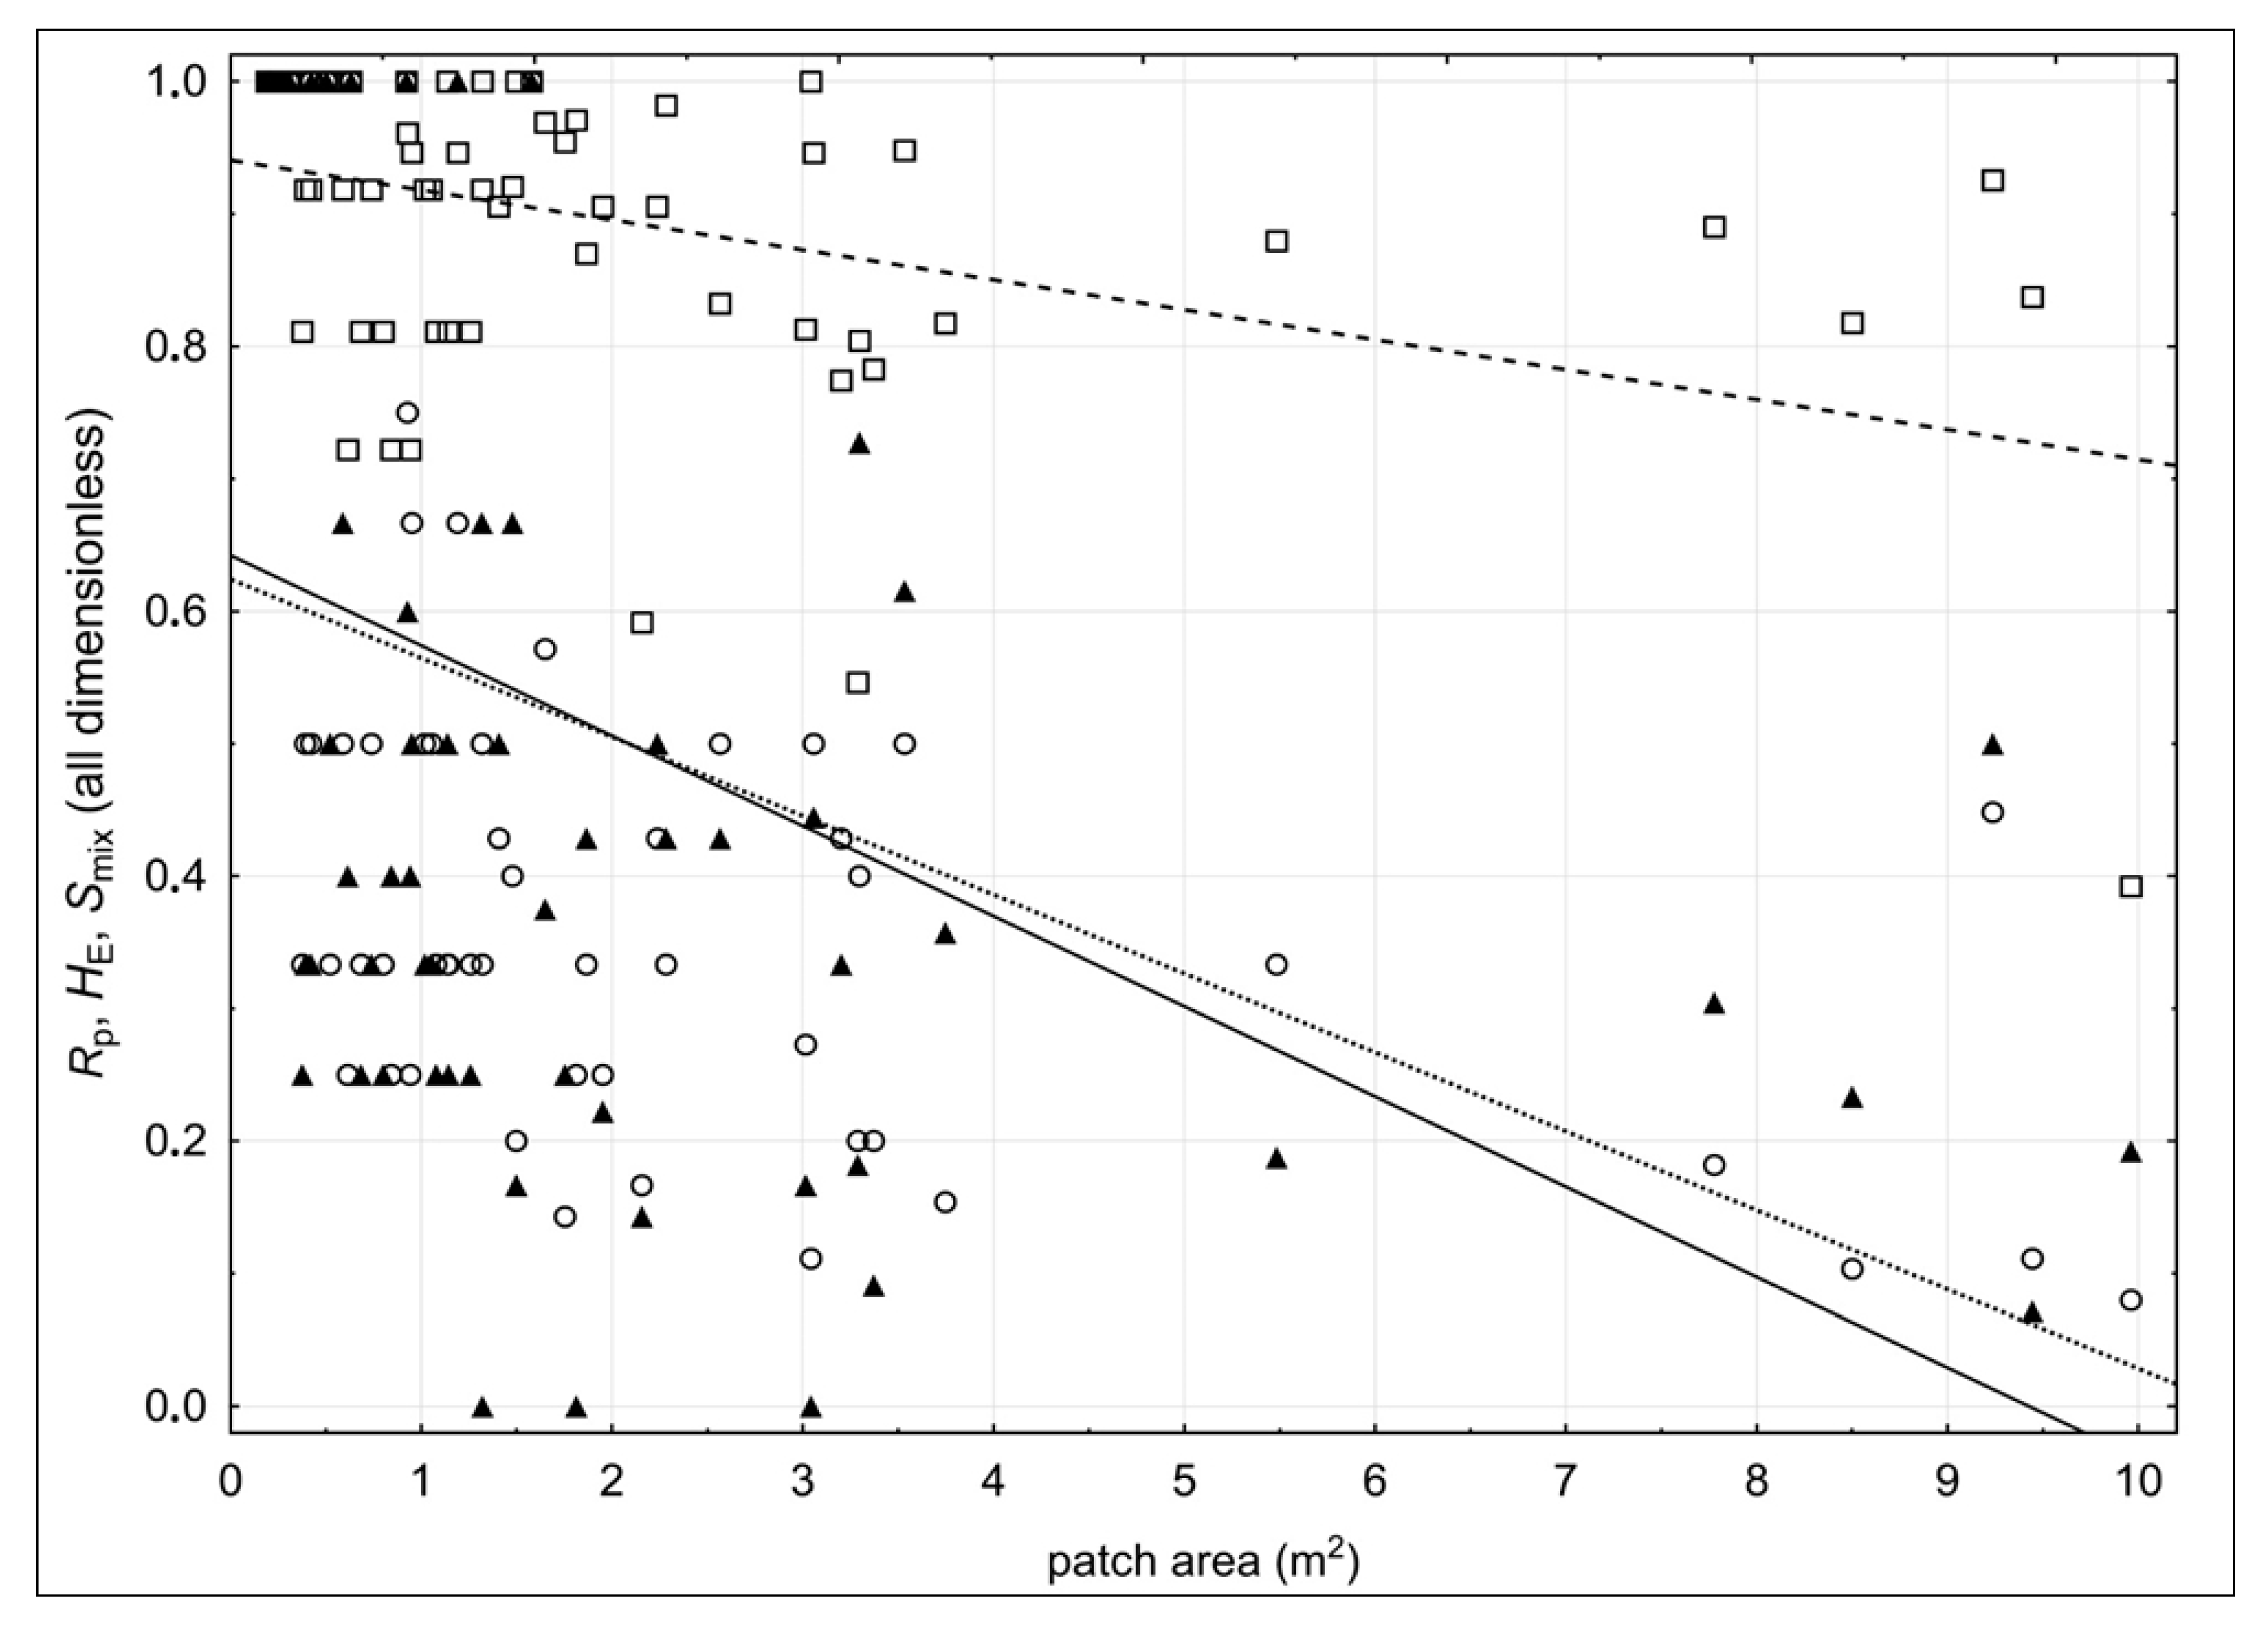
4.3. Patch Level Data Analysis
Supplementary Materials
Author Contributions
Funding
Acknowledgments
Conflicts of Interest
References
- Fryxell, P.A. Mode of reproduction of higher plants. Bot. Rev. 1957, 23, 135–233. [Google Scholar] [CrossRef]
- Klimeš, L.; Klimešova, J.; Hendriks, R.; van Groenendael, J. Clonal plant architecture: A comparative analysis of form and function. In The Ecology and Evolution of Clonal Plants; de Kroon, H., van Groenendael, J., Eds.; Backhuys Publishers: Leiden, The Netherlands, 1997; pp. 1–29. [Google Scholar]
- Silvertown, J. The evolutionary maintenance of sexual reproduction: Evidence from the ecological distribution of asexual reproduction in clonal plants. Int. J. Plant Sci. 2008, 169, 157–168. [Google Scholar] [CrossRef] [Green Version]
- Millar, M.A.; Byrne, M.; Coates, D.J. The maintenance of disparate levels of clonality, genetic diversity and genetic differentiation in disjunct subspecies of the rare Banksia ionthocarpa. Mol. Ecol. 2010, 19, 4217–4227. [Google Scholar] [CrossRef]
- Amat, M.E.; Silvertown, J.; Vargas, P. Strong spatial genetic structure reduces reproductive success in the critically endangered plant genus Pseudomisopates. J. Hered. 2013, 104, 692–703. [Google Scholar] [CrossRef] [PubMed] [Green Version]
- Barrett, S.C.H. Influences of clonality on plant sexual reproduction. Proc. Natl. Acad. Sci. USA 2015, 112, 8859–8866. [Google Scholar] [CrossRef] [PubMed] [Green Version]
- Harper, J.L. Population Biology of Plants; Academic: London, UK, 1977; p. 892. [Google Scholar]
- Lovett Doust, L. Population dynamics and local specialization in a clonal perennial (Ranunculus repens): I. The dynamics of ramets in contrasting habitats. J. Ecol. 1981, 69, 743–755. [Google Scholar] [CrossRef]
- Vallejo-Marín, M.; Dorken, M.E.; Barrett, S.C.H. The ecological and evolutionary consequences of clonality for plant mating. Annu. Rev. Ecol. Evol. Syst. 2010, 41, 193–213. [Google Scholar] [CrossRef] [Green Version]
- Vekemans, X.; Hardy, O.J. New insights from fine-scale spatial genetic structure analyses in plant populations. Mol. Ecol. 2004, 13, 921–935. [Google Scholar] [CrossRef]
- Ohsako, T. Clonal and spatial genetic structure within populations of a coastal plant, Carex kobomugi (Cyperaceae). Am. J. Bot. 2010, 97, 458–470. [Google Scholar] [CrossRef]
- Eriksson, O. Seedling dynamics and life histories in clonal plants. Oikos 1989, 55, 231–238. [Google Scholar] [CrossRef]
- Eriksson, O. Dynamics of genets in clonal plants. Trends Ecol. Evol. 1993, 8, 313–316. [Google Scholar] [CrossRef]
- Eriksson, O. Clonal life histories and the evolution of seed recruitment. In The Ecology and Evolution of Clonal Plants; de Kroon, H., van Groenendael, J., Eds.; Backhuys Publishers: Leiden, The Netherlands, 1997; pp. 211–226. [Google Scholar]
- Watkinson, A.R.; Powell, J.C. Seedling recruitment and the maintenance of clonal diversity in plant populations. A computer simulation of Ranunculus repens. J. Ecol. 1993, 81, 707–717. [Google Scholar] [CrossRef]
- McLellan, A.J.; Prati, D.; Kaltz, O.; Schmid, B. Structure and analysis of phenotypic and genetic variation in clonal plants. In The Ecology and Evolution of Clonal Plants; de Kroon, H., van Groenendael, J., Eds.; Backhuys Publishers: Leiden, The Netherlands, 1997; pp. 185–210. [Google Scholar]
- Barbalić, L. Contribution to the knowledge of Salvia brachyodon Vandas. Period. Biol. 1956, 9, 5–10. (In Croatian) [Google Scholar]
- Abadžić, S.; Šilić, Č. Chorology, ecology and phytosociological affiliation of Salvia brachyodon Vandas in flora of Yugoslavia (in Montenegrin). Glasnik Republičkog Zavoda za Zaštitu Prirode i Prirodnjačkog Muzeja u Titogradu 1982, 15, 125–131. [Google Scholar]
- Šilić, Č. Endemic Plants; Svjetlost: Sarajevo, Yugoslavia, 1984; p. 107. (In Bosnian) [Google Scholar]
- Radosavljević, I.; Satovic, Z.; Liber, Z. Causes and consequences of contrasting genetic structure in sympatrically growing and closely related species. AoB Plants 2015, 7, plv106. [Google Scholar] [CrossRef] [Green Version]
- Arnaud-Haond, S.; Duarte, C.M.; Alberto, F.; Serrao, E.A. Standardizing methods to address clonality in population studies. Mol. Ecol. 2007, 16, 5115–5139. [Google Scholar] [CrossRef] [Green Version]
- Gitzendanner, M.A.; Weekley, C.W.; Germain-Aubrey, C.C.; Soltis, D.E.; Soltis, P.S. Microsatellite evidence for high clonality and limited genetic diversity in Ziziphus celata (Rhamnaceae), an endangered, self-incompatible shrub endemic to the Lake Wales Ridge, Florida, USA. Conserv. Genet. 2012, 13, 223–234. [Google Scholar] [CrossRef]
- James, E.A.; McDougall, K.L. Spatial genetic structure reflects extensive clonality, low genotypic diversity and habitat fragmentation in Grevillea renwickiana (Proteaceae), a rare, sterile shrub from south-eastern Australia. Ann. Bot. 2014, 114, 413–423. [Google Scholar] [CrossRef] [Green Version]
- Gross, C.L.; Nelson, P.A.; Haddadchi, A.; Fatemi, M. Somatic mutations contribute to genotypic diversity in sterile and fertile populations of the threatened shrub, Grevillea rhizomatosa (Proteaceae). Ann. Bot. 2012, 109, 331–342. [Google Scholar] [CrossRef] [Green Version]
- Gitzendanner, M.A.; Soltis, P.S. Patterns of genetic variation in rare and widespread plant congeners. Am. J. Bot. 2000, 87, 783–792. [Google Scholar] [CrossRef]
- Gao, L.Z. Microsatellite variation within and among populations of Oryza officinalis (Poaceae), an endangered wild rice from China. Mol. Ecol. 2005, 14, 4287–4297. [Google Scholar] [CrossRef] [PubMed]
- Moreira, R.G.; McCauley, R.A.; Cortes-Palomec, A.C.; Fernandes, G.W.; Oyama, K. Spatial genetic structure of Coccoloba cereifera (Polygonaceae), a critically endangered microendemic species of Brazilian rupestrian fields. Conserv. Genet. 2010, 11, 1247–1255. [Google Scholar] [CrossRef]
- López-Pujol, J.; Martinell, M.C.; Massó, S.; Blanché, C.; Sáez, L. The ‘paradigm of extremes’: Extremely low genetic diversity in an extremely narrow endemic species, Coristospermum huteri (Umbelliferae). Plant. Syst. Evol. 2013, 299, 439–446. [Google Scholar] [CrossRef]
- Crema, S.; Cristofolini, G.; Rossi, M.; Conte, L. High genetic diversity detected in the endemic Primula apennina Widmer (Primulaceae) using ISSR fingerprinting. Plant. Syst. Evol. 2009, 280, 29–36. [Google Scholar] [CrossRef]
- López-Vinyallonga, S.; López-Pujol, J.; Constantinidis, T.; Susanna, A.; Garcia-Jacas, N. Mountains and refuges: Genetic structure and evolutionary history in closely related, endemic Centaurea in continental Greece. Mol. Phylogenet. Evol. 2015, 92, 243–254. [Google Scholar] [CrossRef] [PubMed]
- Forrest, A.; Escudero, M.; Heuertz, M.; Wilson, Y.; Cano, E.; Vargas, P. Testing the hypothesis of low genetic diversity and population structure in narrow endemic species: The endangered Antirrhinum charidemi (Plantaginaceae). Bot. J. Linn. Soc. 2017, 183, 260–270. [Google Scholar] [CrossRef] [Green Version]
- Binks, R.M.; Millar, M.A.; Byrne, M. Contrasting patterns of clonality and fine-scale genetic structure in two rare sedges with differing geographic distributions. Heredity 2015, 115, 235–242. [Google Scholar] [CrossRef] [Green Version]
- Balloux, F.; Lehmann, L.; de Meeûs, T. The population genetics of clonal and partially clonal diploids. Genetics 2003, 164, 1635–1644. [Google Scholar]
- Mori, Y.; Nagamitsu, T.; Kubo, T. Clonal growth and its effects on male and female reproductive success in Prunus ssiori (Rosaceae). Popul. Ecol. 2009, 51, 175–186. [Google Scholar] [CrossRef]
- Mori, H.; Ueno, S.; Matsumoto, A.; Kamijo, T.; Tsumura, Y.; Masaki, T. Large contribution of clonal reproduction to the distribution of deciduous liana species (Wisteria floribunda) in an old-growth cool temperate forest: Evidence from genetic analysis. Ann. Bot. 2018, 121, 359–365. [Google Scholar] [CrossRef]
- Pausas, J.G. Response of plant functional types to changes in the fire regime in Mediterranean ecosystems: A simulation approach. J. Veg. Sci. 1999, 10, 717–722. [Google Scholar] [CrossRef]
- Pausas, J.G. Resprouting vs seeding—A Mediterranean perspective. Oikos 2001, 94, 193–194. [Google Scholar] [CrossRef]
- Ne’eman, G.; Dafni, A. Fire bees and seed production in a Mediterranean key species Salvia fruticosa (Lamiaceae). Isr. J. Plant Sci. 1999, 47, 157–163. [Google Scholar] [CrossRef]
- Naveh, Z. The evolutionary significance of fire in the Mediterranean region. Vegetatio 1975, 29, 199–208. [Google Scholar] [CrossRef]
- Arianoutsou, M.; Margaris, N.S. Early stages of regeneration after fire in a phryganic ecosystem (East-Mediterranean). 1. Regeneration by seed germination. Biologie-Ecologie Méditerranéenne 1981, 8, 119–128. [Google Scholar]
- Lloret, F. Fire, canopy cover and seedling dynamics in Mediterranean shrubland of northeastern Spain. J. Veg. Sci. 1998, 9, 417–430. [Google Scholar] [CrossRef]
- Sackville Hamilton, N.R.; Schmid, B.; Harper, J.L. Life-history concepts and the population biology of clonal organisms. Proc. R. Soc. B 1997, 232, 35–57. [Google Scholar]
- Cirne, P.; Scarano, F.R. Resprouting and growth dynamics after fire of the clonal shrub Andira legalis (Leguminosae) in a sandy coastal plain in south-eastern Brazil. J. Ecol. 2001, 89, 351–357. [Google Scholar] [CrossRef]
- Maguire, A.J.; Menges, E.S. Post-fire growth strategies of resprouting Florida scrub vegetation. Fire Ecol. 2011, 7, 12–25. [Google Scholar] [CrossRef]
- Clarke, P.J.; Lawes, M.J.; Midgley, J.J.; Lamont, B.B.; Ojeda, F.; Burrows, G.E.; Enright, N.J.; Knox, K.J.E. Resprouting as a key functional trait: How buds, protection and resources drive persistence after fire. New Phytol. 2013, 197, 19–35. [Google Scholar] [CrossRef] [Green Version]
- Pan, J.; Price, J. Fitness and evolution in clonal plants: The impact of clonal growth. Evol. Ecol. 2001, 15, 583–600. [Google Scholar] [CrossRef]
- Hutchings, M.J.; Wijesinghe, D.K.; John, E.A. The effects of heterogeneous nutrient supply on plant performance: A survey of responses, with special reference to clonal herbs. In The Ecological Consequences of Environmental Heterogeneity; Hutchings, M.J., John, E.A., Stewart, A.J.A., Eds.; Blackwell: Oxford, UK, 2000; pp. 91–110. [Google Scholar]
- Hutchings, M.J.; Wijesinghe, D.K. Performance of a clonal species in patchy environments: Effects of environmental context on yield at local and whole-plant scales. Evol. Ecol. 2008, 22, 313–324. [Google Scholar] [CrossRef]
- Charpentier, A. Consequences of clonal growth for plant mating. Evol. Ecol. 2002, 15, 521–530. [Google Scholar] [CrossRef]
- Albert, T.; Raspe, O.; Jacquemart, A.L. Influence of clonal growth on selfing rate in Vaccinium myrtillus L. Plant Biol. 2008, 10, 643–649. [Google Scholar] [CrossRef] [PubMed]
- Handel, S.N. The intrusion of clonal growth patterns on plant breeding systems. Am. Nat. 1985, 125, 367–383. [Google Scholar] [CrossRef]
- Reusch, T.B.H. Fitness-consequences of geitonogamous selfing in a clonal marine angiosperm (Zostera marina). J. Evol. Biol. 2001, 14, 129–138. [Google Scholar] [CrossRef] [PubMed]
- Harder, L.D.; Barrett, S.C.H. Pollen dispersal and mating patterns in animal-pollinated plants. In Floral Biology Studies on Floral Evolution in Animal-Pollinated Plants; Lloyd, D.G., Barrett, S.C.H., Eds.; Chapman & Hall: New York, NY, USA, 1996; pp. 140–190. [Google Scholar]
- Radosavljević, I.; Satovic, Z.; Jakse, J.; Javornik, B.; Greguraš, D.; Jug-Dujaković, M.; Liber, Z. Development of new microsatellite markers for Salvia officinalis L. and its potential use in conservation-genetic studies of narrow endemic Salvia brachyodon Vandas. Int. J. Mol. Sci. 2012, 13, 12082–12093. [Google Scholar] [CrossRef] [Green Version]
- Bailleul, D.; Stoeckel, S.; Arnaud-Haond, S. RClone: A package to identify MultiLocus Clonal Lineages and handle clonal data sets in r. Methods Ecol. Evol. 2016, 7, 966–970. [Google Scholar] [CrossRef] [Green Version]
- R Development Core Team. R: A Language and Environment for Statistical Computing. In R Foundation for Statistical Computing; R Development Core Team: Vienna, Austria, 2017; ISBN 3-900051-07-0. Available online: http://www.R-project.org/ (accessed on 7 January 2019).
- Parks, J.C.; Werth, C.R. A study of spatial features of clones in a population of bracken fern, Pteridium aquilinum (Dennstaedtiaceae). Am. J. Bot. 1993, 80, 537–544. [Google Scholar] [CrossRef]
- Jombart, T. adegenet: A R package for the multivariate analysis of genetic markers. Bioinformatics 2008, 24, 1403–1405. [Google Scholar] [CrossRef] [Green Version]
- Botstein, D.; White, R.L.; Sholnick, M.; David, R.W. Construction of a genetic linkage map in man using restriction fragment length polymorphisms. Am. J. Hum. Genet. 1980, 32, 314–331. [Google Scholar] [PubMed]
- Kalinowski, S.T.; Taper, M.L.; Marshall, T.C. Revising how the computer program CERVUS accommodates genotyping error increases success in paternity assignment. Mol. Ecol. 2007, 16, 1099–1106. [Google Scholar] [CrossRef] [PubMed]
- Peakall, R.; Smouse, P.E. GENALEX 6: Genetic analysis in Excel. Population genetic software for teaching and research. Mol. Ecol. Notes 2006, 6, 288–295. [Google Scholar] [CrossRef]
- Peakall, R.; Smouse, P.E. GenAlEx 6.5: Genetic analysis in Excel. Population genetic software for teaching and research-an update. Bioinformatics 2012, 28, 2537–2539. [Google Scholar] [CrossRef] [PubMed] [Green Version]
- Alberto, F.; Gouveia, L.; Arnaud-Haond, S.; Pérez-Lloréns, J.L.; Duarte, C.M.; Serrão, E.A. Within-population spatial genetic structure, neighbourhood size and clonal subrange in the seagrass Cymodocea nodosa. Mol. Ecol. 2005, 14, 2669–2681. [Google Scholar] [CrossRef]
- Loiselle, B.A.; Sork, V.L.; Nason, J.; Graham, C. Spatial genetic structure of a tropical understorey shrub, Psychotria officinalis (Rubiaceae). Am. J. Bot. 1995, 82, 1420–1425. [Google Scholar] [CrossRef]
- Whittaker, R.H. Evolution and measurement of species diversity. Taxon 1972, 21, 213–251. [Google Scholar] [CrossRef] [Green Version]
- Finley, A.; Banerjee, S. “MBA: Multilevel B-Spline Approximation”. R Package Version 0.0-7. 2010. Available online: http://CRAN.R-project.org/package=MBA (accessed on 4 November 2019).
- Nychka, D.; Furrer, R.; Paige, J.; Sain, S. “Fields: Tools for Spatial Data”. R Package Version 9.6. 2017. Available online: http://cran.r-project.org/web/packages/fields/index.html (accessed on 4 November 2019).
- Dorken, M.E.; Eckert, C.G. Severely reduced sexual reproduction in northern populations of a clonal plant, Decodon verticillatus (Lythraceae). J. Ecol. 2001, 89, 339–350. [Google Scholar] [CrossRef] [Green Version]
- Lee, S.; Wolberg, G.; Shin, S.Y. Scattered data interpolation with multilevel B-splines. IEEE Trans. Vis. Comput. Graph. 1997, 3, 229–244. [Google Scholar] [CrossRef] [Green Version]
- De Berg, M.; van Kreveld, M.; Overmars, M.; Schwarzkopf, O. Computational Geometry: Algorithms and Applications; Springer: Berlin, Germany, 2000; pp. 2–8. [Google Scholar]


| Locus | Na | HO | HE | PIC | FIS |
|---|---|---|---|---|---|
| SoUZ001 | 8 | 0.643 | 0.661 | 0.613 | 0.026 |
| SoUZ002 | 5 | 0.643 | 0.611 | 0.562 | −0.052 |
| SoUZ004 | 4 | 0.369 | 0.367 | 0.342 | −0.005 |
| SoUZ005 | 7 | 0.734 | 0.739 | 0.694 | 0.006 |
| SoUZ006 | 16 | 0.867 | 0.836 | 0.818 | −0.037 |
| SoUZ007 | 11 | 0.909 | 0.877 | 0.864 | −0.036 |
| SoUZ011 | 14 | 0.830 | 0.759 | 0.724 | −0.093 |
| SoUZ014 | 8 | 0.751 | 0.757 | 0.715 | 0.007 |
| Mean | 9.125 | 0.718 | 0.701 | 0.666 | −0.023 |
© 2020 by the authors. Licensee MDPI, Basel, Switzerland. This article is an open access article distributed under the terms and conditions of the Creative Commons Attribution (CC BY) license (http://creativecommons.org/licenses/by/4.0/).
Share and Cite
Radosavljević, I.; Antonić, O.; Hruševar, D.; Križan, J.; Satovic, Z.; Turković, D.; Liber, Z. The Influence of a Seedling Recruitment Strategy and a Clonal Architecture on a Spatial Genetic Structure of a Salvia brachyodon (Lamiaceae) Population. Plants 2020, 9, 828. https://0-doi-org.brum.beds.ac.uk/10.3390/plants9070828
Radosavljević I, Antonić O, Hruševar D, Križan J, Satovic Z, Turković D, Liber Z. The Influence of a Seedling Recruitment Strategy and a Clonal Architecture on a Spatial Genetic Structure of a Salvia brachyodon (Lamiaceae) Population. Plants. 2020; 9(7):828. https://0-doi-org.brum.beds.ac.uk/10.3390/plants9070828
Chicago/Turabian StyleRadosavljević, Ivan, Oleg Antonić, Dario Hruševar, Josip Križan, Zlatko Satovic, Doroteja Turković, and Zlatko Liber. 2020. "The Influence of a Seedling Recruitment Strategy and a Clonal Architecture on a Spatial Genetic Structure of a Salvia brachyodon (Lamiaceae) Population" Plants 9, no. 7: 828. https://0-doi-org.brum.beds.ac.uk/10.3390/plants9070828