Effects of Postharvest Water Deficits on the Physiological Behavior of Early-Maturing Nectarine Trees


Irrigation Department, CEBAS-CSIC. P.O. Box 164, Campus de Espinardo, 30100 Murcia, Spain
*
Author to whom correspondence should be addressed.
Plants 2020, 9(9), 1104; https://0-doi-org.brum.beds.ac.uk/10.3390/plants9091104
Submission received: 6 August 2020
/
Revised: 24 August 2020
/
Accepted: 26 August 2020
/
Published: 27 August 2020
(This article belongs to the Special Issue Water Stress and Desiccation Tolerance in Plants)
Abstract
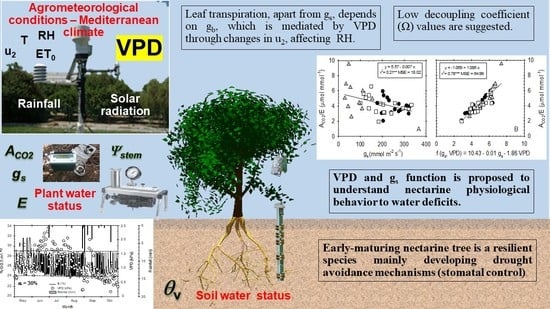
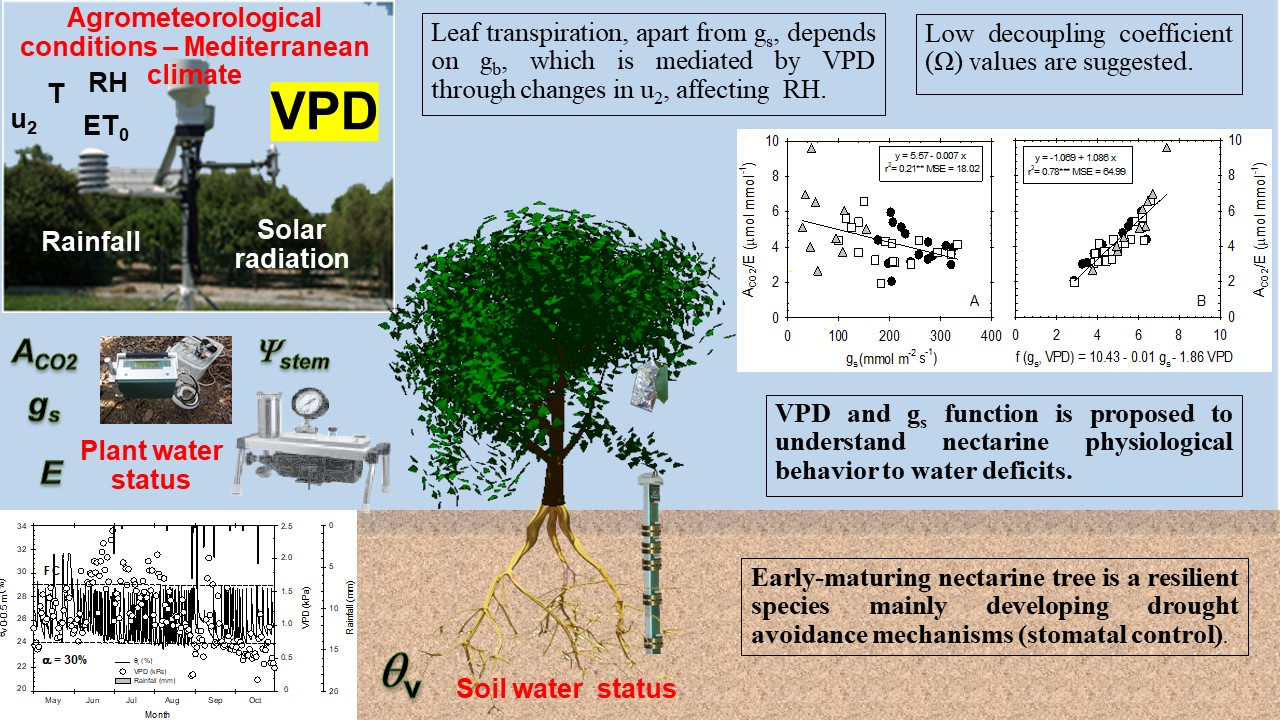
:The physiological performance of early-maturing nectarine trees in response to water deficits was studied during the postharvest period. Two deficit irrigation treatments were applied, moderate and severe, and these were compared with a control treatment (fully irrigated). Stem water potential and leaf gas exchange (net CO2 assimilation rate, ACO2; transpiration rate, E; and stomatal conductance, gs) were measured frequently. Drought avoidance mechanisms included a decrease in stomatal conductance, especially in the case of the severe deficit treatment, which also showed a strong dependence of ACO2 on gs. Intrinsic water-use efficiency (ACO2/gs) was more sensitive than instantaneous water-use efficiency (ACO2/E) as an indicator to detect water deficit situations in nectarine trees. However, in contrast to the results obtained for other deciduous fruit trees, a poor correlation was found between ACO2/E and ACO2/gs, despite the important relation between E and gs. ACO2/E was also weakly correlated with gs, although this relationship clearly improved when the vapor pressure deficit (VPD) was included, along with gs as the independent variable. This fact reveals that apart from stomatal closure, E depends on the boundary layer conductance (gb), which is mediated by VPD through changes in wind speed. This suggests low values of the decoupling coefficient for this water-resilient species.
1. Introduction
Water scarcity in the semi-arid area of Spain is one of the most important environmental constrains affecting the physiology of crops. Its effects are expected to intensify as global temperatures increase [1,2,3]. Peaches and nectarines (Prunus persica L.) are one of the most common and economically important fruit tree species in the Mediterranean area, where nearly 70% of the rainfall is concentrated in autumn and with frequent drought periods during the growing season [4,5]. Spain is the fourth largest peach and nectarine producer with an average annual production of 1,42 Mt in the period 2015–2018 [6], acting as a leader in export to European markets. In early-maturing cultivars, fruit ripening coincides with periods of low crop evapotranspiration (ETc). Cultivation requires lower amounts of water than late-maturing cultivars, which is an important issue in semi-arid areas, where water is often a limiting factor for peach and nectarine production [4,5,6,7,8,9,10,11,12,13].
Deficit irrigation is frequently adopted to improve water-use efficiency and is considered an alternative to traditional irrigation scheduling approaches that fully meet plant water requirements [14]. Deficits are applied during the non-critical phenological periods when the sensitivity of the plant to water stress is minimal in terms of yield and quality. In early-maturing fruit trees, with a very short period from fruit set to harvest and a very long postharvest period, deficit irrigation should be applied only during the postharvest period [4,5,6,7,8,9,10,11,12,13]. Postharvest is an important period for nectarine fruits trees, since carbohydrates are accumulated and floral organ differentiation occurs [15,16], for which reason water deficits should be managed carefully at this time to avoid reductions in bloom and fruit load [4].
Plant physiological processes are directly affected by the amount of water that plants can extract from the soil [17]. Water stress limits plant growth and crop production more than any other environmental factor. In some cases, it may cause a deleterious output [18]. A reduction of stomatal conductance (gs) and leaf growth inhibition are among the first processes that plants develop in response to drought. They protect them from extensive water loss but reduce the source of assimilates (photosynthetic rate) and consequently affect the resulting biomass and final crop production [19]. Although minimizing water loss by stomatal closure under drought conditions clearly increases the water-use efficiency, it has also been seen to reduce CO2 uptake and leaf cooling via leaf transpiration [20,21,22,23]. Plants have developed many mechanisms to survive drought, including escape, tolerance, and avoidance to water deficits. Avoidance of stress includes changes in leaf area, anatomy, and orientation, among others, whereas tolerance to stress involves at least two mechanisms, osmotic adjustment and changes in the elastic properties of tissues [24,25,26]. Mellisho et al. [27] reported that drought resistance in early-maturing peach trees is based both on avoidance mechanisms such as stomatal control and tolerance mechanisms, including active osmotic adjustment and high apoplastic water content.
Reductions in leaf gas exchange parameters are often used as plant indicators of water deficit situations [22,28]. In order to better understand the mechanisms behind water stress when applying deficit irrigation strategies, the use of sensors in the soil–plant–atmosphere water continuum is compelled [1,11]. Previous studies have shown that continuous real-time measurements based on soil water content (θv) with capacitance probes indicated accurately the impact of different irrigation events on the stored soil water. This provided useful information concerning the advance of the wetted front, the depth of the root system activity, and the fate of the applied water [4,5,6,7,8,9,10,11,12,13,14,15,16,17,18,19,20,21,22,23,24,25,26,27,28,29,30,31,32,33]. These θv-based data allowed an optimal soil moisture range to be set for the crop. Then, it was possible to precisely adjust the irrigation dose and frequency and to automate irrigation [4,10]. In a companion paper by Conesa et al. [5], precise irrigation scheduling based on real-time information provided by soil moisture sensors was shown to be a promising tool. It allows water to be saved without compromising yield and fruit quality in early-maturing nectarine trees. However, the efficiency of the automated irrigation scheduling compared with conventional irrigation based on ETc has not been discussed in terms of physiological plant behavior until now.
Under field conditions, water stress is often accompanied by other environmental constraints, such as steep leaf-to-air water vapor gradients and high radiation and temperature, particularly in the Mediterranean regions [34]. The exposure of a single leaf or the whole plant to dry air is expected to increase transpiration because of the greater vapor pressure differences between the leaf and the air. However, such a situation may also decrease gs and hence affect leaf transpiration. The concentration of water vapor inside the leaf changes with leaf temperature: as the temperature rises, the air may contain more water vapor, and subsequent evaporation from the wet surfaces of the leaf will raise the water vapor concentration to saturation, as has been found in leaves of both well-watered and water-stressed plants [35]. Stomatal closure responds with a non-lineal increase in transpiration rate to reach a plateau and, in some cases, to decrease if VPD levels are very high [36,37]. By preventing high transpiration rates, stomatal closure avoids the corresponding decline in plant water potential, protecting the plant from excessive dehydration and physiological damage. The response of stomatal conductance to increasing VPD is generally an exponential decrease, but the magnitude of the decrease—the stomatal sensitivity—varies considerably both within and between species. Stomatal sensitivity at low VPD is proportional to the magnitude of gs. Therefore, stomatal response to air humidity involves an apparent feed-forward response [38], because it enables the plant to restrict excessive water loss and may enhance the plant’s ability to use soil water supplies efficiently [20,21,22,23].
For these reasons, the main objective of this paper was to investigate to what extent changes in stomatal conductance (gs), in response to water deficits, are mediated by vapor pressure deficit (VPD) in early-maturing nectarine trees. Different levels of water deficit (moderate and severe) were applied during the postharvest period to early-maturing nectarine trees grown in a semi-arid area of Spain.
2. Results and Discussion
2.1. Water Applied and Meteorological Conditions
During the postharvest period, which comprised the experimental period, the average amount of water applied by irrigation to each treatment was 359, 208, and 180 mm in the T–C, T–M, and T–S water deficit treatments, respectively (Figure 1). In the T–M treatment, the soil water deficit imposed (based on a θv threshold value of α = 30%) represented a mean water reduction of about 42% compared with the T–C treatment, which was based on conventional ETc calculations. It should be noted that there was no penalty in yield and fruit quality as a result of this treatment [5]. Similarly, automated irrigation has been demonstrated as suitable efficient irrigation scheduling of early-maturing Prunus sp. trees [4,5,6,7,8,9,10,11,12,13,14,15,16,17,18,19,20,21,22,23]. In plum trees, the automated system based on soil moisture sensors proposed by Millán et al. [32] was able to establish a regulated deficit irrigation strategy based on 40% ETc. Moreover, the automated algorithm of Dominguez-Niño et al. [33] saved 23% of the irrigation volume compared with the traditional water balance.
Agro-meteorological conditions in the study area were typical for a Mediterranean climate with dry summers and mild–wet winters [17,39]. During the experimental period, rainfall amounted to 71 mm and ET0 1017.6 mm (Table 1). Daily ET0 was highest in June, and September was the wettest month. VPD reached daily mean values ranging from −1.6 kPa in June to −0.6 kPa in October. Moreover, the mean wind speed and the global radiation decreased as the experiment progressed, with the highest values registered in May and June, respectively (Table 1). Considering the 10-year seasonal average rainfall and ET0 values (≈ 250 and 1320 mm, respectively [40]), the ET0 accumulated during the postharvest period represented 80% of the total water needs, whereas rainfall was low.
2.2. Time Course of Plant–Water Relations
Regarding plant water status, the T–C treatment showed an average Ψstem value of about −0.80 MPa (Figure 2A), which is symptomatic of non-limiting soil water conditions in clay–loam soils [5,6,7,8,9,10,11,12,13,14,15,16,17,18,19,20,21,22,23,24,25,26,27,28,29,30,31,32,33,34,35,36,37,38,39,40,41,42]. In this sense, Abrisqueta et al. [30] affirmed that a Ψstem value above −0.9 MPa during the summer is an indicator of water stress initiation in early-maturing peach trees.
A non-flat pattern of the Ψstem in both deficit irrigation treatments was observed (Figure 2A), averaging −1.07 and −1.98 MPa in the T–M and T–S treatments, respectively. Differences with respect to the T–C treatment were constant and statistically significant from July onwards. The mean Ψstem difference from T–C was 0.27 MPa and 1.18 MPa for T–M and T–S treatments, respectively. Moreover, the greatest plant water deficits were registered during the late postharvest, with minimum Ψstem values of ≈ −1.71 and −2.68 MPa for T–M and T–S, respectively (Figure 2A).
Atmospheric-related effects on Ψstem (increased rainfall in August and September; Table 1, Figure 2A) emphasized the resilient nature of this Prunus species [43].
Values of the leaf gas exchange parameters (ACO2, gs and E) were significantly reduced by water deficit as the experiment progressed, particularly in the T–S treatment (Figure 2B–D). In the T–C treatment, average values for ACO2, gs, and E were 17.5 µmol m−2 s−1, 261 mmol m−2 s−1, and 4.6 mmol m−2 s−1, respectively, which is characteristic of non-limiting soil water conditions, as indicated in Vera et al. [11] for early-maturing nectarine trees. The moderate water deficit imposed in the T–M treatment decreased the gas exchange season values by around 15%, 24%, and 15% for ACO2, gs, and E, respectively, compared with T–C values. As expected, withholding irrigation caused higher gas exchange reductions in the T–S treatment: 55% (for ACO2), 73% (for gs), and 63% (for E) compared with T–C values. Chaves et al. [19] reported that under mild to moderate water deficits, stomata closure is among the earliest of plant responses, restricting water loss and carbon assimilation. However, when water deficits intensified (as in the case of T–S treatment), the decreased gas exchange is motivated by the low rates of electron transport [44], as a result of a reduction in ATP synthesis [19,45].
The rainfall events in late summer (Table 1)were insufficient to enable the gas exchange values to reach the levels of the T–C treatment, in either T–M or T–S treatments, with their moderate and severe water deficit levels, respectively (Figure 2B–D). This relative delay in stomatal opening following re-watering is in contrast with the rapid recovery of the Ψstem (Figure 2A), as has also been observed in almond [22], apricot [46], citrus [24] trees, and table grapes [47], and it can be considered as a safety mechanism that allows plants to regain full turgor more efficiently [48].
The reductions in ACO2 and E associated with limited gs are probably due to stomatal closure occurring when Ψstem declines below a threshold value [49,50]. In this sense, good lineal relationships were found between gs and Ψstem [gs = 333.63 + 116.32 Ψstem, r2 = 0.55, p ≤ 0.001] and between ACO2 and Ψstem [ACO2 = 20.93 + 5.54 Ψstem, r2 = 0.46; p ≤ 0.001] (data not shown). Rahmati et al. [36] observed a reduction (>50%) in leaf gas exchange when Ψstem decreased from −1.4 to −2.0 MPa in peach trees. However, an additional Ψstem decrease (≤−2.0 MPa) only led to a slight decrease in both gs and ACO2. Shackel et al. [51] mentioned a Ψstem threshold value of ≈ −1.5 MPa when the decrease in ACO2 was compensated by the reduction in the vegetative apex growth. Those shoots are the major users of carbohydrates during the postharvest period, and they explain the summer pruning practices in deciduous fruit trees in an attempt to control excessive growth and alleviate the effect of water deficits [40,52].
Values of intrinsic (ACO2/gs) and instantaneous water-use efficiency (ACO2./E) increased with water stress, reaching maximum values in the T–S treatment (Figure 3E,F). By closing the stomata, the water-use efficiency increases, reducing the amount of H2O lost per CO2 assimilated [20,21,22,23]. In this sense, Romero et al. [53] reported that ACO2./gs and ACO2/E increased in deficit-irrigated vines up to Ψstem values of −1.3 to −1.4 MPa when gs varied between 110 and 140 mmol m−2 s−1. Moreover, below these Ψstem threshold values, the leaf gas exchange efficiency did not increase, or it even dropped slightly. Interestingly, ACO2/gs was more sensitive than ACO2/E as a plant water status indicator to detect deficit situations in early-maturing nectarine trees (Figure 3E,F).
2.3. Leaf Gas Exchange Relationships
Our results revealed a strong lineal dependence between ACO2 and gs (r2 = 0.91, p ≤ 0.001) (Figure 3), which demonstrates the potential target of stomatal control of the photosynthetic process in the cultivar studied. Similar slopes of the individual relationships were evident from the analysis of covariance (data not shown). When all data were pooled, the coefficients of determination (r2) were seen to improve as the soil water deficit increased: T–S > T–M > T–C (Figure 3), which agrees with the observation that gs, together with mesophyll conductance are key players in the photosynthesis process, determining the flux of CO2 that reaches the Rubisco carboxylation sites in the chloroplast stroma [54]. However, it is known that the role of gs in the photosynthetic process is also related to the prevailing climatic factors [13]. Indeed, Galle et al. [55,56] found a certain degree of ‘uncoupling’ during drought acclimation and re-watering in herbaceous and woody plants.
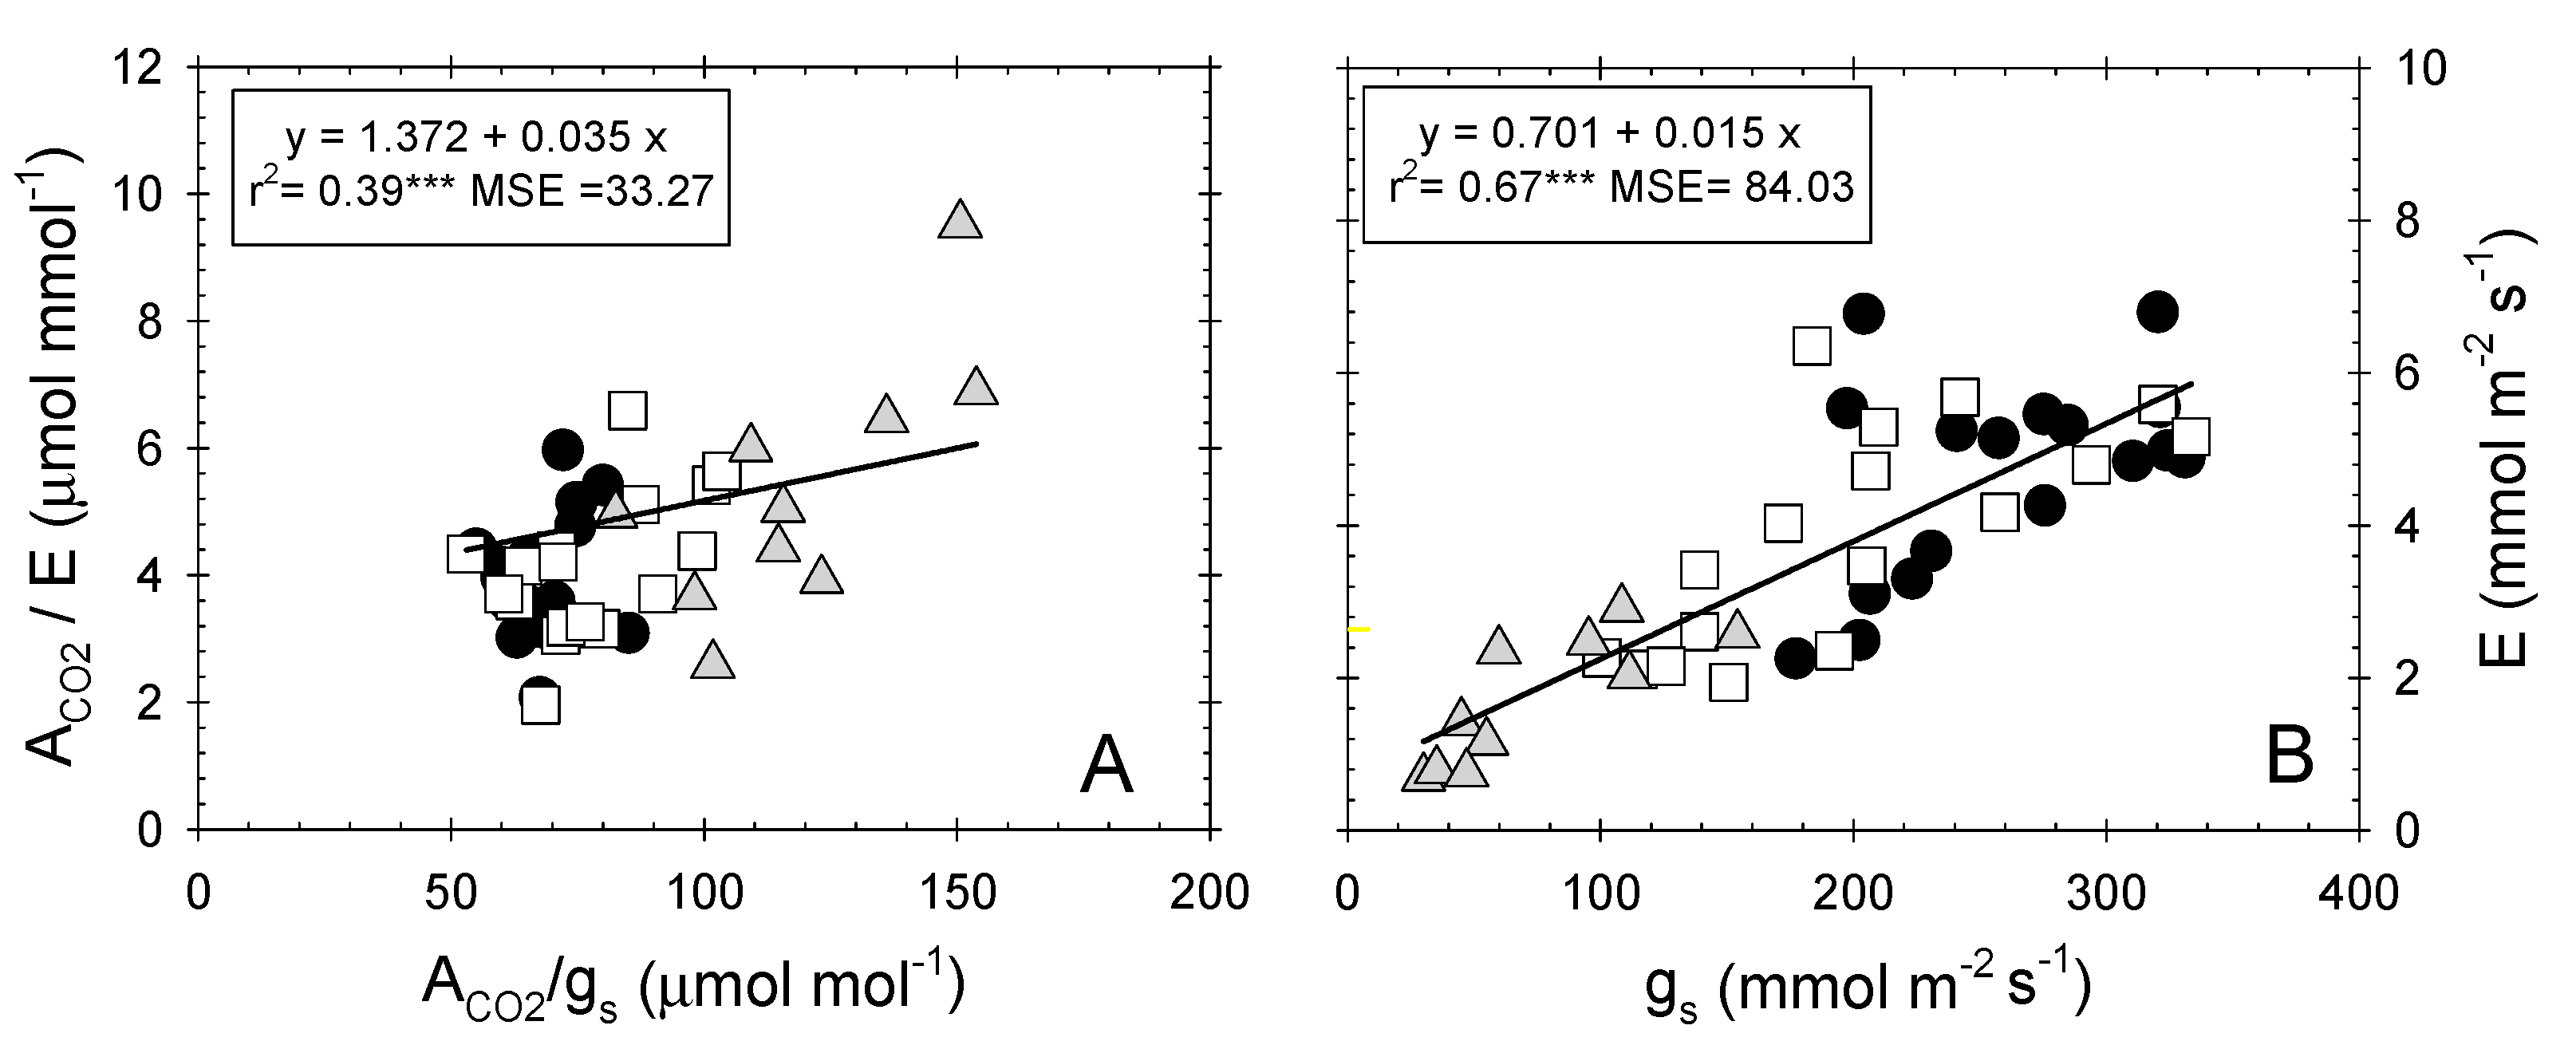
A weak correlation was found between instantaneous (ACO2/E) and intrinsic (ACO2/gs) water-use efficiency (Figure 4A), despite the high dependence observed between E and gs (Figure 4B) [57]. Nectarine trees behaved differently to table grape vines, in which high correlations between both water-use efficiencies (r2 = 0.88; p ≤ 0.001), as well as between E and gs (r2 = 0.86; p ≤ 0.001), were described [47].
When both water-use efficiencies were correlated with the corresponding mean daily VPD values, a higher coefficient of determination was found for ACO2/E (r2 = 0.32 p ≤ 0.001) (Figure 5A) than for ACO2/gs (r2 = 0.05 ns) (Figure 5B). This could be explained by the fact that ACO2/E is more influenced by environmental conditions, since E depends on the degree of stomatal opening and the vapor pressure deficit (VPD) of the atmosphere surrounding the leaf [23,24,25,26,27,28,29,30,31,32,33,34,35,36,37,38,39,40,41,42,43,44,45,46,47,48,49,50,51,52,53,54,55,56,57,58], whereas ACO2/gs excludes the effects of changing evaporative demand on water flux out of the leaf, and it depends only on the stomatal opening [59].
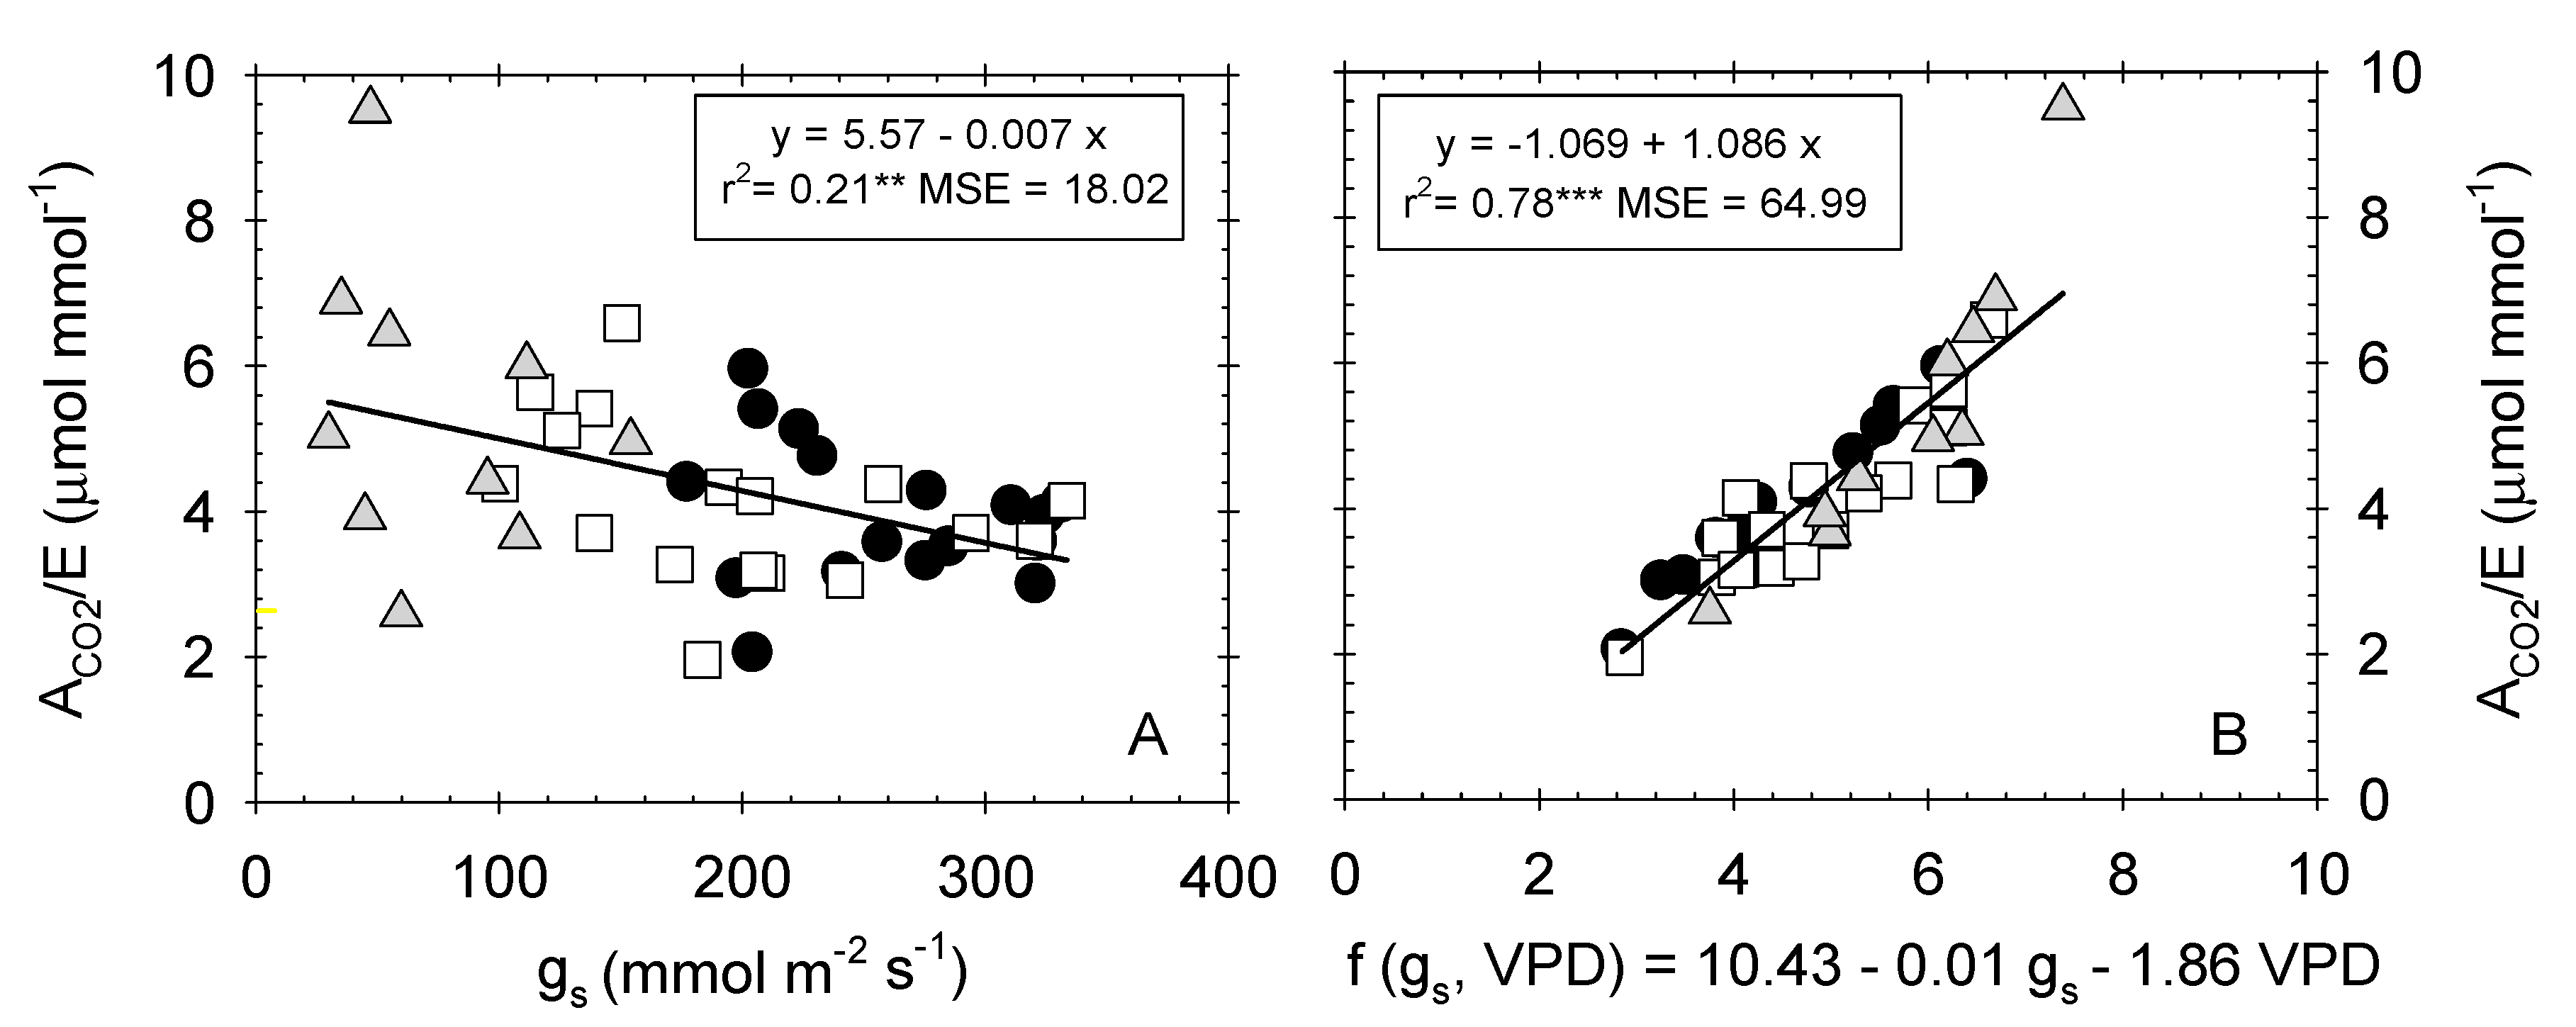
A poor degree of correlation was also noted between the ACO2/E and gs (Figure 6A). Interestingly, when VPD data were included in the independent term along with gs, the coefficient of determination considerably improved (r2 = 0.78 p ≤ 0.001) (Figure 6B). This finding is explained because water loss from plant leaves is controlled not only by gs, but also by boundary layer conductance (gb), both operating in series [60]. The latter, gb, depends on the thickness of the layer of air at the surface of the leaf through which water vapor must diffuse after leaving the stomata [61]. Moreover, Martin et al. [60] reported that gb is controlled by leaf size, morphology, and wind speed.
At this point, it should be remembered that the decoupling coefficient (Ω) (a dimensionless coefficient ranging from 0 to 1) represents the relative contribution of canopy stomatal (gs) and aerodynamic (gb) conductance in controlling rates of canopy transpiration [57,62]. Since gb and gs operate together, their relative magnitude determines which conductance is the dominant regulator of transpiration. Martin et al. [60] indicated that when gs is much smaller than gb, stomata are the dominant controllers of water loss, and a decrease in gs will result in a nearly proportional decrease in transpiration. Under this condition, the canopy and the atmosphere are fully aerodynamically coupled (Ω = 0), since E is controlled by the stomata conductance and VPD. In contrast, when gb is much smaller than gs, changes in gs will have little effect on E, and the input of radiation to the canopy will be the primary driver of leaf transpiration. In this state, the canopy and the atmosphere are fully aerodynamically decoupled (Ω = 1), since E is controlled by the energy balance.
Our results showed that changes in wind speed can modify VPD values through changes in air relative humidity, which would explain the low values of the decoupling coefficient (Ω) in early-maturing nectarine leaves. This emphasizes the advantage of introducing a meteorological variable along with a gas exchange parameter (as a two-variable function) for a better understating of the physiological behavior of plant leaves under water-deficit conditions.
3. Materials and Methods
3.1. Plant Material and Experimental Conditions
The experiment was performed from May to October 2017 in a 0.5 ha orchard of seven-year-old early-maturing nectarine trees (Prunus persica L. Batsch) cv. Flariba on GxN–15 rootstock, at the CEBAS–CSIC experimental station in Santomera, Murcia, Spain (38° 0,603,100 N, 1°0,201,400 W, 110 m altitude). Trees were spaced at 6.5 m × 3.5 m and trained to an open-center canopy. The soil in the 0–0.5 m layer was stony with a clay loam texture and low organic matter content. The average bulk density was 1.43 g cm−3. The volumetric soil water content (θv) at the field capacity and permanent wilting point were 29% and 14%, respectively.
Crop management (including pest control) was that which was commonly used in commercial orchards in the area. Seasonal fertilizer applications were 100, 60, and 120 kg ha−1 of N, P2O5, and K2O, respectively, which were applied through a drip irrigation system [63]. The soil was kept free of weeds and was not tilled. Full bloom took place at the beginning of February; nectarine fruits were hand-thinned in March and harvested in early May. Nectarine trees were pruned annually during the dormancy period (mid-December).
Trees were drip irrigated with one line per tree row with four pressure-compensated emitters per tree each delivering 4 L h−1, located 0.5 and 1.3 m from the tree trunk. More details about the experimental site, soil and climate characteristics, fertilization, and cultural practices can be found elsewhere [5,6,7,8,9,10,11,12,13,14,15,16,17,18,19,20,21,22,23,24,25,26,27,28,29,30,31,32,33,34,35,36,37,38,39,40].
3.2. Irrigation Treatments
Three different irrigation treatments were applied:
- Control treatment (T–C), fully irrigated throughout the growing season, and based on 100% of the crop evapotranspiration (ETc) to ensure non-limiting soil water conditions. ETc was estimated following the FAO approach [64] multiplying the crop reference evapotranspiration (ET0), using the Penman-Monteith equation [64], by the crop coefficients (Kc) obtained by Abrisqueta et al. [65] in the same location for Prunus persica sp. Irrigation was scheduled weekly, and the water was applied on a daily basis during the night as needed.
- Moderate water deficit treatment (T–M), based on reducing soil water content (automatically managed by means of soil water sensors) following the procedure indicated in Vera et al. [11]. Briefly, the volumetric soil water content (θv) was measured at depths of 0.1, 0.3, 0.5, and 0.7 m using capacitance probes (EnviroScan®, Sentek Pty. Ltd., Adelaide, South Australia). One PVC access tube was installed 0.1 m from the emitter located 0.5 m from the trunk of four representative trees. The θv values in the 0–0.5 m soil profile, coinciding with the effective root depth [31], were computed and used to activate electro-hydraulic valves by means of a telemetry system. Threshold θv values were set to α = 30% to trigger irrigation and to the field capacity (FC) value to end irrigation (Figure 7) during the postharvest period (from May to October), the non-critical period of early-maturing Prunus sp. trees [4], while a lower α (10%) was applied during the critical period corresponding to the fruit growth period (March to May) [11].
- Severe water deficit treatment (T–S), which involved withholding irrigation during the late postharvest period (from August to October, 2017) and irrigating (100% of ETc), similarly to the T–C treatment during the rest of the growing season.
The experimental layout consisted of a completely randomized design with four replications per irrigation treatment, each consisting of six trees (the central four were used for measurements and the others served as guard trees), with a total of 24 trees per irrigation treatment. No active roots were seen more than 1.5 m from the drip line, as revealed in a root distribution study [66].
3.3. Measurements
Environmental data, including air temperature (T), relative humidity (RH), wind speed (u2), solar radiation, and rainfall were recorded following the World Meteorological Organization’s recommendations by an automated weather station located 0.25 m from the orchard in the same CEBAS-CSIC experimental field station (http://www.cebas.csic.es/general_spain/est_meteo.html), which read the values every 5 min and recorded the averages every 15 min. Crop reference evapotranspiration (ET0, FAO-56, Penman-Monteith) was calculated hourly [64]. Daily maximum, minimum, and mean air temperatures (Tmax, Tmean, Tmin), and daily maximum, minimum, and mean relative humidity (RHmax, RHmean, RHmin) were calculated, and the daily mean vapor pressure deficit (VPD, kPa) was determined using the following equations:
where es is the saturation vapor pressure, ea is the actual vapor pressure, T is the temperature (°C), and RH is the relative humidity (%) [64].
The volume of water applied in each irrigation treatment was measured by in-line water meters with digital output pulses (ARAD).
Tree water status was estimated by measuring midday stem water potential (Ψstem) using a pressure chamber (Soil Moisture Equipment Corp. Model 3000). Measurements were taken at midday (≈12:00 h solar time) in one healthy mature leaf from each replicate tree of each irrigation treatment (n = 4). Leaves were selected from the north face of the tree, near the trunk, and placed in plastic bags covered with aluminum foil for at least 2 h prior to excision, following the recommendations of Hsiao [67] and McCutchan and Shackel [68]. Measurements were carried out every 7–10 days from May to October.
Leaf gas exchange measurements were made on the same days as Ψstem, at around 10:00 h solar time, in one sun-exposed leaf per replicate and four replicates per irrigation treatment (n = 4). The net CO2 assimilation rate (ACO2, μmol m−2 s−1), stomatal conductance (gs, mmol m−2 s−1), and transpiration rate (E, mmol m−2 s−1) were measured at an ambient photosynthetic photon flux density (PPFD ≈ 1200 μmol m−2 s−1) and near-constant ambient CO2 concentration (Ca ≈ 400 μmol mol−1) with a field-portable closed photosynthesis system (LI-COR, LI-6400, Lincoln, NE, USA) equipped with a transparent 6 cm2 leaf chamber. From these parameters, the following parameters were obtained: intrinsic water-use efficiency, as the ratio between ACO2 and gs (μmol mol−1) and instantaneous water-use efficiency, as the ratio between ACO2 and E (µmol mmol−1), which is also known as transpiration efficiency [50].
3.4. Statistical Analysis
The data were analyzed by one-way ANOVA using SPSS v 9.1 (IBM, Armonk, NY, USA) to discriminate between irrigation treatments. Post hoc pair-wise comparison between all means was performed by a Least Significant Difference (LSD) test at p ≤ 0.05 (LSD0.05). The degree of agreement of the regressions among variables was evaluated through the coefficient of determination (r2) and the mean squared error (MSE).
4. Conclusions
The results indicate that early-maturing nectarine trees are a resilient species that respond well to water stress, essentially by developing drought avoidance mechanisms. The water deficits applied during the postharvest period reduced plant water status and leaf gas exchange values, the most affected parameter being stomatal conductance. The T–M treatment, which was controlled by soil water content sensors, induced a moderate plant water deficit (Ψstem reduction of 0.27 MPa, with respect to the fully irrigated treatment, T–C), leading to a reduction in water application of up to 42% compared with T–C). Meanwhile, severely restricting irrigation (T–S) induced a greater plant water deficit (Ψstem reduction of 1.2 MPa with respect to T–C). Leaf transpiration, apart from stomatal closure, depends on the gb, which is mediated by VPD through changes in wind speed, modifying air relative humidity. We propose the inclusion of a meteorological variable, such as VPD, alongside a gas exchange parameter (as a two-variable function) for a better understanding of the physiological behavior of plant leaves under water deficit conditions, as this would better explain the changes that occur in transpiration efficiency (ACO2/E). The findings also point to low decoupling coefficient values (Ω) for early-maturing nectarine leaves, even though more research is needed in this respect.
Author Contributions
Conceptualization, M.R.C. and M.C.R.-S.; Data curation and formal analysis, M.R.C. and W.C.; Investigation, J.V., W.C. and M.C.R.-S.; Methodology, J.V., W.C. and M.R.C.; Funding acquisition and Project administration, M.C.R.-S.; Software, J.V. and W.C.; Visualization, M.R.C., W.C., and M.C.R.-S.; Writing—original draft, M.R.C.; Writing—review and editing, M.R.C., J.V., W.C., and M.C.R.-S. All authors have read and agreed to the published version of the final manuscript.
Funding
This research was supported by the Spanish Research Agency and co-financed by European Union FEDER funds (AEI/FEDER-UE, AGL2016-77282-C3-1R and PID2019-106226RB-C2-1) and “Fundación Séneca, Agencia de Ciencia y Tecnología” of the Region of Murcia under the Excellence Group Program (19903/GERM/15) projects.
Acknowledgments
M.R. Conesa acknowledges the postdoctoral financial support received from the Spanish Juan de la Cierva program (FJCI -2017 -32045).
Conflicts of Interest
The authors declare no conflict of interest.
References
- Fernández-García, I.; Lecina, S.; Ruiz-Sánchez, M.C.; Vera, J.; Conejero, W.; Conesa, M.R.; Dominguez, A.; Pardo, J.J.; Léllis, B.C.; Montesinos, P. Trends and challenges in irrigation scheduling in the semi-arid area of Spain. Water 2020, 12, 785. [Google Scholar] [CrossRef] [Green Version]
- Feller, U.; Kingston-Smith, A.H.; Centritto, M. Abiotic Stresses in Agroecology: A Challenge for Whole Plant Physiology. Front. Environ. Sci. 2017, 5, 13. [Google Scholar] [CrossRef] [Green Version]
- Slattery, R.A.; Ort, D.R. Carbon assimilation in crops at high temperatures. Plant Cell Environ. 2019, 42, 2750–2758. [Google Scholar] [CrossRef]
- Ruiz-Sánchez, M.C.; Abrisqueta, I.; Conejero, W.; Vera, J. Deficit irrigation management in early-maturing peach crop. In Water Scarcity and Sustainable Agriculture in Semiarid Environment: Tools, Strategies, and Challenges for Woody Crops; Ivan, F.G.T., Victor, H.D.Z., Eds.; Academic Press: Cambridge, MA, USA, 2018; pp. 111–126. [Google Scholar]
- Conesa, M.R.; Conejero, W.; Vera, J.; Ramírez-Cuesta, J.M.; Ruiz-Sánchez, M.C. Terrestrial and remote indexes to assess moderate deficit irrigation in early-maturing nectarine trees. Agronomy 2019, 9, 630. [Google Scholar] [CrossRef] [Green Version]
- FAOSTAST. Food and Agriculture Organization Statistical Data. Available online: http://www.faco.org/faostat/en/#data/QC (accessed on 22 August 2020).
- Buendía, B.; Allende, A.; Nicolás, E.; Alarcón, J.J.; Gil, M.I. Effect of Regulated Deficit Irrigation and Crop Load on the Antioxidant Compounds of Peaches. J. Agric. Food Chem. 2008, 56, 3601–3608. [Google Scholar] [CrossRef]
- Abrisqueta, I.; Tapia, L.M.; Conejero, W.; Sánchez-Toribio, M.I.; Abrisqueta, J.M.; Vera, J.; Ruiz-Sánchez, M.C. Response of early-maturing peach [Prunus persica (L.)] trees to deficit irrigation. Span. J. Agric. Res. 2010, 8, 30–39. [Google Scholar] [CrossRef]
- Alcobendas, R.; Mirás-Avalos, J.M.; Alarcón, J.J.; Pedrero, F.; Nicolás, E. Combined effects of irrigation, crop load and fruit position on size, color and firmness of fruits in an extra-early cultivar of peach. Sci. Hortic. 2012, 142, 128–135. [Google Scholar] [CrossRef]
- Vera, J.; Abrisqueta, I.; Abrisqueta, J.M.; Ruiz-Sánchez, M.C. Effect of deficit irrigation on early-maturing peach tree performance. Irrig. Sci. 2013, 31, 747–757. [Google Scholar] [CrossRef]
- Vera, J.; Conejero, W.; Conesa, M.R.; Ruiz-Sánchez, M.C. Irrigation factor approach based on soil water content: A nectarine orchard case study. Water 2019, 11, 589. [Google Scholar] [CrossRef] [Green Version]
- De la Rosa, J.M.; Domingo, R.; Gómez-Montiel, J.; Pérez-Pastor, A. Implementing deficit irrigation scheduling through plant water stress indicators in early nectarine trees. Agric. Water Manag. 2015, 152, 207–216. [Google Scholar] [CrossRef]
- De la Rosa, J.M.; Conesa, M.R.; Domingo, R.; Aguayo, E.; Falagán, E.; Pérez-Pastor, A. Combined effects of deficit irrigation and crop level on early nectarine trees. Agri. Water Manag. 2016, 170, 120–132. [Google Scholar] [CrossRef] [Green Version]
- Ruiz-Sánchez, M.C.; Domingo, R.; Castel, J.R. Review. Deficit irrigation in fruit trees and vines in Spain. Span. J. Agric. Res. 2010, 8, 5–20. [Google Scholar] [CrossRef] [Green Version]
- Handley, D.F.; Johnson, R.S. Late summer irrigation of water-stressed peach trees reduces fruit doubles and deep sutures. HortScience 2000, 35, 771. [Google Scholar] [CrossRef] [Green Version]
- Dichio, B.; Xiloyannis, C.; Sofo, A.; Montanaro, G. Effects of post-harvest regulated deficit irrigation on carbohydrate and nitrogen partitioning, yield quality and vegetative growth of peach trees. Plant Soil 2007, 290, 127. [Google Scholar] [CrossRef]
- Mirá-García, A.B.; Conejero, W.; Vera, J.; Ruiz-Sánchez, M.C. Leaf water relations in Lime trees grown under shade netting and open-air. Plants 2020, 9, 510. [Google Scholar] [CrossRef] [PubMed] [Green Version]
- Ghrab, M.; Gargouri, K.; Bentaher, H.; Chartzoulakis, K.; Ayadi, M.; Mimoun, M.B.; Masmoudi, M.M.; Mechlia, N.B.; Psarras, G. Water relations and yield of olive tree (cv. Chemlali) in response to partial root-zone drying (PRD) irrigation technique and salinity under arid climate. Agric. Water Manag. 2013, 123, 1–11. [Google Scholar] [CrossRef]
- Chaves, M.M.; Zarrouk, O.; Francisco, R.; Costa, J.M.; Santos, T.; Regalado, A.P.; Rodrigues, M.L.; Lopes, C.M. Grapevine under deficit irrigation-hints from physiological and molecular data. Ann. Bot. 2010, 105, 661–676. [Google Scholar] [CrossRef] [Green Version]
- Cifre, J.; Bota, J.; Escalona, J.M.; Medrano, H.; Flexas, J. Phyisological tolos for irrigation scheduling in grape vines (Vitis vinifera L.). Agric. Ecos. Environ. 2005, 106, 159–170. [Google Scholar] [CrossRef]
- Costa, J.M.; Ortuño, M.F.; Chaves, M.M. Deficit irrigation as a strategy to save water: Physiology and potential application to horticulture. J. Integ. Plant Biol. 2007, 49, 1421–1434. [Google Scholar] [CrossRef]
- Egea, G.; González-Real, M.M.; Baille, A.; Nortes, P.A.; Conesa, M.R.; Ruiz-Salleres, I. Effects of water stress on irradiance acclimation of leaf traits in almond trees. Tree Physiol. 2012, 32, 450–463. [Google Scholar] [CrossRef]
- Medrano, H.; Tomás, M.; Martorell, S.; Escalona, J.; Pou, A.; Fuentes, S. Improving water use efficiency of vineyards in semi-arid regions. A review. Agron. Sustain. Dev. 2015, 35, 499–517. [Google Scholar] [CrossRef] [Green Version]
- Ruiz-Sánchez, M.C.; Domingo, R.; Savé, R.; Biel, C.; Torrecillas, A. Effects of water stress and rewatering on leaf water relations of lemon plants. Biol. Plant. 1997, 39, 623–631. [Google Scholar] [CrossRef]
- Munns, R. Why measure osmotic adjustment? Aust. J. Plant Physiol. 1988, 15, 717–726. [Google Scholar] [CrossRef]
- Savé, R.J.; Peñuelas, J.O.; Marfá, O.; Serrano, L. Changes in leaf osmotic and elastic properties and canopy structure of strawberries under mild water stress. HortScience 1993, 28, 925–927. [Google Scholar] [CrossRef] [Green Version]
- Mellisho, C.D.; Cruz, Z.N.; Conejero, W.; Ortuño, M.F.; Rodriguez, P. Mechanisms for drought resistance in early maturing var. Flordastar peach trees. J. Agric. Sci. 2011, 149, 609–616. [Google Scholar] [CrossRef]
- Yan, W.; Zhong, Y.; Shangguan, Z. A meta-analysis of leaf gas exchange and water status responses to drought. Sci. Rep. 2016, 6, 20917. [Google Scholar] [CrossRef] [Green Version]
- Mounzer, O.H.; Vera, J.; Tapia, L.M.; García-Orellana, Y.; Conejero, W.; Abrisqueta, I.; Ruiz-Sánchez, M.C.; Abrisqueta, J.M. Irrigation scheduling of peach trees by continuous measurement of soil water status. Agrociencia 2008, 42, 857–868. [Google Scholar]
- Abrisqueta, I.; Vera, J.; Tapia, L.; Abrisqueta, J.; Ruiz-Sánchez, M. Soil water content criteria for peach trees water stress detection during the postharvest period. Agric. Water Manag. 2012, 104, 62–67. [Google Scholar] [CrossRef]
- Abrisqueta, I.; Conejero, W.; López-Martínez, L.; Vera, J.; Ruiz-Sánchez, M.C. Root and aerial growth in early-maturing peach trees under two crop load treatments. Span. J. Agric. Res. 2017, 15, e0803. [Google Scholar] [CrossRef] [Green Version]
- Millán, S.; Casadesús, J.; Campillo, C.; Moñino, M.J.; Prieto, M.H. Using soil moisture sensors for automated irrigation scheduling in a plum crop. Water 2019, 11, 2061. [Google Scholar] [CrossRef] [Green Version]
- Domínguez-Niño, J.M.; Oliver-Manera, J.; Girona, J.; Casadesús, J. Differential irrigation scheduling by an automated algorithm of water balance tuned by capacitance-type soil moisture sensors. Agric. Water Manag. 2020, 228, 105880. [Google Scholar] [CrossRef]
- Osorio, M.L.; Breia, E.; Rodrigues, A.P.; Chaves, M.M. Limitations to carbon assimilation by mild drought in nectarine trees growing under field conditions. Environ. Exp. Bot. 2006, 55, 235–347. [Google Scholar] [CrossRef]
- Gates, D.M. Transpiration and Leaf temperature. Annu. Rev. Plant. Biol. 2003, 19, 211–238. [Google Scholar] [CrossRef]
- Turner, N.C.; Schulze, E.D.; Gollan, T. The responses of stomata and leaf gas exchange to vapour pressure deficits and soil water content. Oecologia 1984, 63, 338–342. [Google Scholar] [CrossRef]
- Maroco, J.P.; Pereira, J.S.; Chaves, M.M. Stomatal responses to leaf-to-air vapour pressure deficit in Sahelian species. Aust. J. Plant Physiol. 1997, 24, 381–387. [Google Scholar] [CrossRef]
- Comstock, J.; Ehkeringer, J. Correlating genetic variation in carbon isotopic composition with complex climatic gradients. Proc. Natl. Acad. Sci. USA 1992, 89, 7745–7751. [Google Scholar] [CrossRef] [Green Version]
- Lionello, P.; Malanotte-Rizzoli, P.; Boscolo, R.; Alpert, P.; Artale, V.; Li, L.; Luterbacher, J.; May, W.; Trigo, R.M.; Tsimplis, M.; et al. The Mediterranean climate: An overview of the main characteristics and issues. In Mediterranean Climate Variability; Lionello, P., Malanotte-Rizzoli, P., Boscolo, R., Eds.; Elsevier: Amsterdam, The Netherlands, 2006; Volume 4, pp. 1–26. [Google Scholar]
- Conesa, M.R.; Martínez-López, L.; Conejero, W.; Vera, J.; Ruiz-Sánchez, M.C. Summer pruning of early-maturing Prunus persica: Water implications. Sci. Hort. 2019, 256. [Google Scholar] [CrossRef]
- De la Rosa, J.M.; Conesa, M.R.; Domingo, R.; Torres, R.; Pérez-Pastor, A. Feasibility of using trunk diameter fluctuation and stem water potential reference lines for irrigation scheduling of early nectarine trees. Agric. Water Manag. 2013, 126, 133–141. [Google Scholar] [CrossRef]
- Naor, A. Irrigation scheduling and evaluation of tree water status in deciduous orchards. Hortic. Rev. 2010, 32, 111–165. [Google Scholar]
- Abrisqueta, I.; Conejero, W.; Valdés-Vela, M.; Vera, J.; Ortuño, M.F.; Ruiz-Sánchez, M.C.; Ortuño, M.F. Stem water potential estimation of drip-irrigated early-maturing peach trees under Mediterranean conditions. Comput. Electron. Agric. 2015, 114, 7–13. [Google Scholar] [CrossRef]
- De Souza, C.R.; Maroco, J.P.; Santos, T.P.; Rodrigues, M.L.; Lopes, C.; Pereira, L.S.; Chaves, M.M. Control of stomatal aperture and carbon uptake by deficit irrigation in two grapevine cultivars. Agric. Ecosyst. Environ. 2005, 106, 261–274. [Google Scholar] [CrossRef]
- Rahmati, M.; Davarynejad, G.H.; Génard, M.; Bannayan, M.; Azizi, M.; Vercambre, G. Peach water relations, gas exchange, growth and shoot mortality under water deficit in semi-arid weather conditions. PLoS ONE 2015, 10, e0120246. [Google Scholar] [CrossRef] [PubMed] [Green Version]
- Ruiz-Sánchez, M.C.; Domingo, R.; Torrecillas, A.; Pérez-Pastor, A. Water stress preconditioning to improve drought resistance in young apricot plants. Plant Sci. 2000, 156, 245–251. [Google Scholar] [CrossRef] [Green Version]
- Conesa, M.; Dodd, I.; Temnani, A.; De La Rosa, J.; Pérez-Pastor, A. Physiological response of post-veraison deficit irrigation strategies and growth patterns of table grapes (cv. Crimson Seedless). Agric. Water Manag. 2018, 208, 363–372. [Google Scholar] [CrossRef] [Green Version]
- Mansfield, T.A.; Davies, W.J. Stomata and stomatal mechanisms. In The Physiology and Biochemistry of Drought Resistance in Plants; Leslie, G.P., Donald, A., Eds.; Academic Press: New York, NY, USA, 1981; pp. 315–346. [Google Scholar]
- Ben Mimoun, M.; Lescourret, F.; Génard, M. Modelling carbon allocation in peach shoot bearing fruits: Simulation of the water stress effect. Fruits 1999, 54, 129–134. [Google Scholar]
- Medrano, H.; Escalona, J.; Bota, J.; Gulias, J.; Flexas, J. Regulation of photosynthesis of C-3 plants in response to progressive drought: Stomatal conductance as a reference parameter. Ann. Bot. 2002, 89, 895–905. [Google Scholar] [CrossRef]
- Shackel, K.; Lampinen, B.; Sibbett, S.; Olson, W. The relation of midday stem water potential to the growth and physiology of fruit trees under water limited conditions. Acta Hortic. 2000, 537, 425–430. [Google Scholar] [CrossRef]
- López, G.; Mata, M.; Arbones, A.; Solans, J.R.; Girona, J.; Marsal, J. Mitigation of effects of extreme drought during stage III of peach fruit development by summer pruning and fruit thinning. Tree Physiol. 2006, 26, 469–477. [Google Scholar] [CrossRef] [Green Version]
- Romero, P.; Fernández-Fernández, J.; Martínez-Cutillas, A. Physiological thresholds for efficient regulated deficit-irrigation management in winegrapes grown under semiarid conditions. Am. J. Enol. Vitic. 2010, 61, 300–312. [Google Scholar]
- Flexas, J.; Niinemets, U.; Gallé, A.; Barbour, M.M.; Centritto, M.; Diaz-Espejo, A.; Douthe, C.; Galmés, J.; Ribas-Carbo, M. Diffusional conductances to CO2 as a target for increasing photosynthesis and photosynthetic water-use efficiency. Photosynth. Res. 2013, 117, 45–59. [Google Scholar] [CrossRef]
- Galle, A.; Florez-Sarasa, I.; Tomas, M.; Pou, A.; Medrano, H.; Ribas-Carbo, M.; Flexas, J. The role of mesophyll conductance during water stress and recovery in tobacco (Nicotiana sylvestris): Acclimation or limitation? J. Exp. Bot. 2009, 60, 2379–2390. [Google Scholar] [CrossRef] [PubMed]
- Galle, A.; Florez-Sarasa, I.; Aououad, H.E.; Flexas, J. The Mediterranean evergreen Quercus ilex and the semi-deciduous Cistus albidus differ in their leaf gas exchange regulation and acclimation to repeated drought and re-watering cycles. J. Exp. Bot. 2011, 62, 5207–5216. [Google Scholar] [CrossRef] [PubMed]
- Jarvis, P.G.; McNaughton, K.G. Stomatal control of transpiration: Scaling up from leaf to region. Adv. Ecol. Res. 1986, 15, 1–49. [Google Scholar]
- Medrano, H.; Bota, J.; Cifre, J.; Flexas, J.; Ribas-Carbó, M.; Gulías, J. Eficiencia en el uso del agua por las plantas. Investig. Geogr. 2007, 43, 63–84. [Google Scholar] [CrossRef] [Green Version]
- Bierhuizen, J.F.; Slatyer, R.O. Effect of atmospheric concentration of water vapour and CO2 in determining transpiration-photosynthesis relationships of cotton leaves. Agric. Meterol. 1965, 2, 259–270. [Google Scholar] [CrossRef]
- Martin, T.A.; Hinckley, T.M.; Meinzer, F.C.; Sprugel, D.G. Boundary layer conductance, leaf temperature and transpiration of Abies amabilis branches. Tree Physiol. 1999, 19, 435–443. [Google Scholar] [CrossRef]
- Monteith, J.L.; Unsworth, M.H. Principles of Environmental Physics, 2nd ed.; Butterworth-Heinemann Elsevier: Oxford, UK, 1990; p. 414. [Google Scholar]
- Nicolás, E.; Barradas, V.L.; Ortuño, M.F.; Navarro, A.; Torrecillas, A.; Alarcón, J.J. Environmental and stomatal control of transpiration, canopy conductance and decoupling coefficient in young lemon trees under shading net. Environ. Exp. Bot. 2008, 63, 200–206. [Google Scholar] [CrossRef]
- Vera, J.; de la Peña, J.M. FERTIGA: Programa de Fertirrigación de Frutales; CEBAS-CSIC: Murcia, Spain, 1994; p. 69. [Google Scholar]
- Allen, R.G.; Pereira, L.S.; Raes, D.; Smith, M. Crop Evapotranspiration: Guidelines for Computing Crop Water Requirements; Food and Agriculture Organization of the United Nations: Rome, Italy, 1998. [Google Scholar]
- Abrisqueta, I.; Abrisqueta, J.; Tapia, L.; Munguía, J.; Conejero, W.; Vera, J.; Ruiz-Sánchez, M.C. Basal crop coefficients for early-season peach trees. Agric. Water Manag. 2013, 121, 158–163. [Google Scholar] [CrossRef]
- Méndez, A.; Blaya, J.M.; López-Torres, F.J.; Rodríguez, E.; Conejero, W.; Vera, J.; Ruiz-Sánchez, M.C. Distribución de Raíces de Nectarino en Distintas Condiciones de Riego; II Congreso IDIES: Murcia, Spain, 2015. [Google Scholar]
- Hsiao, T.C. Measurement of tree water status. In Irrigation of Agricultural Crops; Steward, B.A., Nielsen, D.R., Eds.; American Society of Agronomy: Madison, WI, USA, 1990; pp. 243–279. [Google Scholar]
- McCutchan, H.; Shackel, K. Stem-water potential as a sensitive indicator of water stress in prune trees (Prunus domestica L. cv. French). J. Am. Soc. Hortic. Sci. 1992, 117, 607–611. [Google Scholar] [CrossRef] [Green Version]
Figure 1.
Irrigation applied (mm) during the postharvest period (May to October) in the different irrigation treatments. Percentage with respect to the Control treatment. (T–C). Moderate water deficit treatment (T–M); Severe water deficit treatment (T–S).
Figure 1.
Irrigation applied (mm) during the postharvest period (May to October) in the different irrigation treatments. Percentage with respect to the Control treatment. (T–C). Moderate water deficit treatment (T–M); Severe water deficit treatment (T–S).

Figure 2.
Seasonal trends of: (A) midday stem water potential (Ψstem, MPa); (B) net CO2 assimilation rate (ACO2, µmol m−2 s−1); (C) stomatal conductance (gs, mmol m−2 s−1); (D) transpiration rate (E, mmol m−2 s−1); (E) intrinsic water-use efficiency (ACO2/gs, µmol mol−1); and (F) instantaneous water-use efficiency (ACO2/E, µmol mmol−1), in the different irrigation treatments: T–C (●), T–M (□), and T–S ( ![Plants 09 01104 i001]() ). Each point is the mean ± standard error (n = 4). Asterisks indicate statistically significant differences between T–C and T–M (black) and T–S (gray) according to LSD0.05.
). Each point is the mean ± standard error (n = 4). Asterisks indicate statistically significant differences between T–C and T–M (black) and T–S (gray) according to LSD0.05.
 ). Each point is the mean ± standard error (n = 4). Asterisks indicate statistically significant differences between T–C and T–M (black) and T–S (gray) according to LSD0.05.
Figure 2.
Seasonal trends of: (A) midday stem water potential (Ψstem, MPa); (B) net CO2 assimilation rate (ACO2, µmol m−2 s−1); (C) stomatal conductance (gs, mmol m−2 s−1); (D) transpiration rate (E, mmol m−2 s−1); (E) intrinsic water-use efficiency (ACO2/gs, µmol mol−1); and (F) instantaneous water-use efficiency (ACO2/E, µmol mmol−1), in the different irrigation treatments: T–C (●), T–M (□), and T–S ( ![Plants 09 01104 i001]() ). Each point is the mean ± standard error (n = 4). Asterisks indicate statistically significant differences between T–C and T–M (black) and T–S (gray) according to LSD0.05.
). Each point is the mean ± standard error (n = 4). Asterisks indicate statistically significant differences between T–C and T–M (black) and T–S (gray) according to LSD0.05.
). Each point is the mean ± standard error (n = 4). Asterisks indicate statistically significant differences between T–C and T–M (black) and T–S (gray) according to LSD0.05.
Figure 3.
Relationship between stomatal conductance (gs, mmol m−2 s−1) and net CO2 assimilation rate (ACO2, µmol m−2 s−1) in the different irrigation treatments: T–C (●), T–M (□), and T–S ( ![Plants 09 01104 i002]() ). Each point is the mean of four leaves. Coefficient of determination for T–C (r2 = 0.71***), T–M (r2 = 0.83***), and T–S (r2 = 0.96***). ***: p ≤ 0.001, MSE: mean squared error.
). Each point is the mean of four leaves. Coefficient of determination for T–C (r2 = 0.71***), T–M (r2 = 0.83***), and T–S (r2 = 0.96***). ***: p ≤ 0.001, MSE: mean squared error.
 ). Each point is the mean of four leaves. Coefficient of determination for T–C (r2 = 0.71***), T–M (r2 = 0.83***), and T–S (r2 = 0.96***). ***: p ≤ 0.001, MSE: mean squared error.
Figure 3.
Relationship between stomatal conductance (gs, mmol m−2 s−1) and net CO2 assimilation rate (ACO2, µmol m−2 s−1) in the different irrigation treatments: T–C (●), T–M (□), and T–S ( ![Plants 09 01104 i002]() ). Each point is the mean of four leaves. Coefficient of determination for T–C (r2 = 0.71***), T–M (r2 = 0.83***), and T–S (r2 = 0.96***). ***: p ≤ 0.001, MSE: mean squared error.
). Each point is the mean of four leaves. Coefficient of determination for T–C (r2 = 0.71***), T–M (r2 = 0.83***), and T–S (r2 = 0.96***). ***: p ≤ 0.001, MSE: mean squared error.
). Each point is the mean of four leaves. Coefficient of determination for T–C (r2 = 0.71***), T–M (r2 = 0.83***), and T–S (r2 = 0.96***). ***: p ≤ 0.001, MSE: mean squared error.
Figure 4.
Relationship between (A) intrinsic water-use efficiency (ACO2/gs, µmol mol−1) and instantaneous water-use efficiency (ACO2/E, µmol mmol−1); and (B) stomatal conductance (gs, mmol m−2 s−1) and transpiration rate (E, mmol m−2 s−1) in the different irrigation treatments: T–C (●), T–M (□), and T–S ( ![Plants 09 01104 i003]() ). Each point is the mean of four leaves. Coefficient of determination in (A): T–C (r2 = 0.002 ns), T–M (r2 = 0.015 ns), and T–S (r2 = 0.52***); and in (B): T–C (r2 = 0.25***), T–M (r2 = 0.50***), and T–S (r2 = 0.70***). ns: not significant, ***: p ≤ 0.001, MSE: mean squared error.
). Each point is the mean of four leaves. Coefficient of determination in (A): T–C (r2 = 0.002 ns), T–M (r2 = 0.015 ns), and T–S (r2 = 0.52***); and in (B): T–C (r2 = 0.25***), T–M (r2 = 0.50***), and T–S (r2 = 0.70***). ns: not significant, ***: p ≤ 0.001, MSE: mean squared error.
 ). Each point is the mean of four leaves. Coefficient of determination in (A): T–C (r2 = 0.002 ns), T–M (r2 = 0.015 ns), and T–S (r2 = 0.52***); and in (B): T–C (r2 = 0.25***), T–M (r2 = 0.50***), and T–S (r2 = 0.70***). ns: not significant, ***: p ≤ 0.001, MSE: mean squared error.
Figure 4.
Relationship between (A) intrinsic water-use efficiency (ACO2/gs, µmol mol−1) and instantaneous water-use efficiency (ACO2/E, µmol mmol−1); and (B) stomatal conductance (gs, mmol m−2 s−1) and transpiration rate (E, mmol m−2 s−1) in the different irrigation treatments: T–C (●), T–M (□), and T–S ( ![Plants 09 01104 i003]() ). Each point is the mean of four leaves. Coefficient of determination in (A): T–C (r2 = 0.002 ns), T–M (r2 = 0.015 ns), and T–S (r2 = 0.52***); and in (B): T–C (r2 = 0.25***), T–M (r2 = 0.50***), and T–S (r2 = 0.70***). ns: not significant, ***: p ≤ 0.001, MSE: mean squared error.
). Each point is the mean of four leaves. Coefficient of determination in (A): T–C (r2 = 0.002 ns), T–M (r2 = 0.015 ns), and T–S (r2 = 0.52***); and in (B): T–C (r2 = 0.25***), T–M (r2 = 0.50***), and T–S (r2 = 0.70***). ns: not significant, ***: p ≤ 0.001, MSE: mean squared error.
). Each point is the mean of four leaves. Coefficient of determination in (A): T–C (r2 = 0.002 ns), T–M (r2 = 0.015 ns), and T–S (r2 = 0.52***); and in (B): T–C (r2 = 0.25***), T–M (r2 = 0.50***), and T–S (r2 = 0.70***). ns: not significant, ***: p ≤ 0.001, MSE: mean squared error.
Figure 5.
Relationship between vapor pressure deficit (VPD, kPa) and (A) instantaneous water-use efficiency (ACO2/E, µmol mmol−1); and (B) intrinsic water-use efficiency (ACO2/gs, µmol mol−1) in the different irrigation treatments: T–C (●), T–M (□), and T–S ( ![Plants 09 01104 i004]() ). Each point is the mean of 4 leaves. Coefficient of determination in (A): T–C (r2 = 0.72***), T–S (r2 = 0.70***), T–S (r2 = 0.66*); and in (B): T–C (r2 = 0.15 ns), T–M (r2 = 0.10 ns), and T–S (r2 = 0.06 ns). ns: not significant, *: p ≤ 0.05, ***: p ≤ 0.001, MSE: mean squared error.
). Each point is the mean of 4 leaves. Coefficient of determination in (A): T–C (r2 = 0.72***), T–S (r2 = 0.70***), T–S (r2 = 0.66*); and in (B): T–C (r2 = 0.15 ns), T–M (r2 = 0.10 ns), and T–S (r2 = 0.06 ns). ns: not significant, *: p ≤ 0.05, ***: p ≤ 0.001, MSE: mean squared error.
 ). Each point is the mean of 4 leaves. Coefficient of determination in (A): T–C (r2 = 0.72***), T–S (r2 = 0.70***), T–S (r2 = 0.66*); and in (B): T–C (r2 = 0.15 ns), T–M (r2 = 0.10 ns), and T–S (r2 = 0.06 ns). ns: not significant, *: p ≤ 0.05, ***: p ≤ 0.001, MSE: mean squared error.
Figure 5.
Relationship between vapor pressure deficit (VPD, kPa) and (A) instantaneous water-use efficiency (ACO2/E, µmol mmol−1); and (B) intrinsic water-use efficiency (ACO2/gs, µmol mol−1) in the different irrigation treatments: T–C (●), T–M (□), and T–S ( ![Plants 09 01104 i004]() ). Each point is the mean of 4 leaves. Coefficient of determination in (A): T–C (r2 = 0.72***), T–S (r2 = 0.70***), T–S (r2 = 0.66*); and in (B): T–C (r2 = 0.15 ns), T–M (r2 = 0.10 ns), and T–S (r2 = 0.06 ns). ns: not significant, *: p ≤ 0.05, ***: p ≤ 0.001, MSE: mean squared error.
). Each point is the mean of 4 leaves. Coefficient of determination in (A): T–C (r2 = 0.72***), T–S (r2 = 0.70***), T–S (r2 = 0.66*); and in (B): T–C (r2 = 0.15 ns), T–M (r2 = 0.10 ns), and T–S (r2 = 0.06 ns). ns: not significant, *: p ≤ 0.05, ***: p ≤ 0.001, MSE: mean squared error.
). Each point is the mean of 4 leaves. Coefficient of determination in (A): T–C (r2 = 0.72***), T–S (r2 = 0.70***), T–S (r2 = 0.66*); and in (B): T–C (r2 = 0.15 ns), T–M (r2 = 0.10 ns), and T–S (r2 = 0.06 ns). ns: not significant, *: p ≤ 0.05, ***: p ≤ 0.001, MSE: mean squared error.
Figure 6.
Relationship between (A) stomatal conductance (gs, mmol m−2 s−1) and instantaneous water-use efficiency (ACO2/E, µmol mmol−1); and (B) the two-variable function (gs, VPD) and ACO2/E in the different irrigation treatments: T–C (●), T–M (□), and T–S ( ![Plants 09 01104 i005]() ). Each point is the mean of 4 leaves. Coefficient of determination in (A): T–C (r2 = 0.05 ns), T–S (r2 = 0.15 ns), T–S (r2 = 0. 06 ns); and in (B): T–C (r2 = 0.79***), T–M (r2 = 0.77***), and T–S (r2 = 0.85***). *: p ≤ 0.05 **: p ≤ 0.01, ***: p ≤ 0.001, MSE: mean squared error.
). Each point is the mean of 4 leaves. Coefficient of determination in (A): T–C (r2 = 0.05 ns), T–S (r2 = 0.15 ns), T–S (r2 = 0. 06 ns); and in (B): T–C (r2 = 0.79***), T–M (r2 = 0.77***), and T–S (r2 = 0.85***). *: p ≤ 0.05 **: p ≤ 0.01, ***: p ≤ 0.001, MSE: mean squared error.
 ). Each point is the mean of 4 leaves. Coefficient of determination in (A): T–C (r2 = 0.05 ns), T–S (r2 = 0.15 ns), T–S (r2 = 0. 06 ns); and in (B): T–C (r2 = 0.79***), T–M (r2 = 0.77***), and T–S (r2 = 0.85***). *: p ≤ 0.05 **: p ≤ 0.01, ***: p ≤ 0.001, MSE: mean squared error.
Figure 6.
Relationship between (A) stomatal conductance (gs, mmol m−2 s−1) and instantaneous water-use efficiency (ACO2/E, µmol mmol−1); and (B) the two-variable function (gs, VPD) and ACO2/E in the different irrigation treatments: T–C (●), T–M (□), and T–S ( ![Plants 09 01104 i005]() ). Each point is the mean of 4 leaves. Coefficient of determination in (A): T–C (r2 = 0.05 ns), T–S (r2 = 0.15 ns), T–S (r2 = 0. 06 ns); and in (B): T–C (r2 = 0.79***), T–M (r2 = 0.77***), and T–S (r2 = 0.85***). *: p ≤ 0.05 **: p ≤ 0.01, ***: p ≤ 0.001, MSE: mean squared error.
). Each point is the mean of 4 leaves. Coefficient of determination in (A): T–C (r2 = 0.05 ns), T–S (r2 = 0.15 ns), T–S (r2 = 0. 06 ns); and in (B): T–C (r2 = 0.79***), T–M (r2 = 0.77***), and T–S (r2 = 0.85***). *: p ≤ 0.05 **: p ≤ 0.01, ***: p ≤ 0.001, MSE: mean squared error.
). Each point is the mean of 4 leaves. Coefficient of determination in (A): T–C (r2 = 0.05 ns), T–S (r2 = 0.15 ns), T–S (r2 = 0. 06 ns); and in (B): T–C (r2 = 0.79***), T–M (r2 = 0.77***), and T–S (r2 = 0.85***). *: p ≤ 0.05 **: p ≤ 0.01, ***: p ≤ 0.001, MSE: mean squared error.
Figure 7.
Soil water content (θv, %) at 0–0.5 m soil depth during the postharvest period (May to October, 2017) in the moderate water deficit treatment (T–M). Values are the 15-min records corresponding to the average of four probes. Dashed horizontal lines delimit the field capacity (FC) and the soil water deficit (α) imposed. White points indicate daily vapor pressure values (VPD, kPa). Vertical bars indicate daily rainfall.


Table 1.
Monthly values of total crop reference evapotranspiration (ET0), maximum, mean, and minimum air temperatures (Tmax, Tmean, and Tmin), maximum, mean, and minimum relative humidity (RHmax, RHmean, and RHmin), mean vapor pressure deficit (VPD), total rainfall, and mean wind speed at 2 m (u2) and solar radiation.
| ET0 (mm) | Temperature (°C) | RH (%) | VPD (kPa) | Rainfall (mm) | u2 (km d−1) | Solar Radiation (W m−2) | |||||
|---|---|---|---|---|---|---|---|---|---|---|---|
| Month | Tmax | Tmean | Tmin | RHmax | RHmean | RHmin | |||||
| May | 140.3 | 27 | 20.7 | 14.6 | 82.7 | 57.5 | 32.3 | 1.1 | 0 | 5.42 | 243.2 |
| June | 304.8 | 31.5 | 25.3 | 19.2 | 82.5 | 56.1 | 29.6 | 1.6 | 0 | 4.38 | 275.4 |
| July | 158.7 | 32.3 | 26.6 | 21 | 88.8 | 63.1 | 37.5 | 1.5 | 0.4 | 4.88 | 248.2 |
| August | 123 | 32.9 | 27.1 | 22 | 91.2 | 64.3 | 42.1 | 1.1 | 8 | 3.2 | 218.2 |
| September | 219.5 | 30 | 24.4 | 20.2 | 92 | 70.1 | 41.1 | 0.9 | 22.6 | 4.8 | 176.4 |
| October | 71.3 | 24 | 18.8 | 14.4 | 93.7 | 68.2 | 46.3 | 0.6 | 5.2 | 3.61 | 137.4 |
| Total/Mean | 1017.6 | 29.6 | 20.5 | 18.5 | 88.5 | 63.2 | 38.2 | 1.1 | 36.2 | 4.38 | 216.4 |
© 2020 by the authors. Licensee MDPI, Basel, Switzerland. This article is an open access article distributed under the terms and conditions of the Creative Commons Attribution (CC BY) license (http://creativecommons.org/licenses/by/4.0/).
Share and Cite
MDPI and ACS Style
Conesa, M.R.; Conejero, W.; Vera, J.; Ruiz-Sánchez, M.C. Effects of Postharvest Water Deficits on the Physiological Behavior of Early-Maturing Nectarine Trees. Plants 2020, 9, 1104. https://0-doi-org.brum.beds.ac.uk/10.3390/plants9091104
AMA Style
Conesa MR, Conejero W, Vera J, Ruiz-Sánchez MC. Effects of Postharvest Water Deficits on the Physiological Behavior of Early-Maturing Nectarine Trees. Plants. 2020; 9(9):1104. https://0-doi-org.brum.beds.ac.uk/10.3390/plants9091104
Chicago/Turabian StyleConesa, María R., Wenceslao Conejero, Juan Vera, and M. Carmen Ruiz-Sánchez. 2020. "Effects of Postharvest Water Deficits on the Physiological Behavior of Early-Maturing Nectarine Trees" Plants 9, no. 9: 1104. https://0-doi-org.brum.beds.ac.uk/10.3390/plants9091104
Note that from the first issue of 2016, this journal uses article numbers instead of page numbers. See further details here.