Low-Cost IoT Remote Sensor Mesh for Large-Scale Orchard Monitorization


1
Electromechanical Engineering Department, University of Beira Interior, Rua Marquês d’Ávila e Bolama, 6201-001 Covilhã, Portugal
2
C-MAST—Centre for Mechanical and Aerospace Science and Technologies, 6201-001 Covilhã, Portugal
*
Author to whom correspondence should be addressed.
J. Sens. Actuator Netw. 2020, 9(3), 44; https://0-doi-org.brum.beds.ac.uk/10.3390/jsan9030044
Submission received: 5 August 2020
/
Revised: 16 September 2020
/
Accepted: 18 September 2020
/
Published: 21 September 2020
(This article belongs to the Special Issue Advanced Instrumentation for Power Converter Applications)
Abstract
:Population growth and climate change lead agricultural cultures to face environmental degradation and rising of resistant diseases and pests. These conditions result in reduced product quality and increasing risk of harmful toxicity to human health. Thus, the prediction of the occurrence of diseases and pests and the consequent avoidance of the erroneous use of phytosanitary products will contribute to improving food quality and safety and environmental land protection. This study presents the design and construction of a low-cost IoT sensor mesh that enables the remote measurement of parameters of large-scale orchards. The developed remote monitoring system transmits all monitored data to a central node via LoRaWAN technology. To make the system nodes fully autonomous, the individual nodes were designed to be solar-powered and to require low energy consumption. To improve the user experience, a web interface and a mobile application were developed, which allow the monitored information to be viewed in real-time. Several experimental tests were performed in an olive orchard under different environmental conditions. The results indicate an adequate precision and reliability of the system and show that the system is fully adequate to be placed in remote orchards located at a considerable distance from networks, being able to provide real-time parameters monitoring of both tree and the surrounding environment.
1. Introduction
The massive increase in population over the last decades led to intensive practice of agriculture and livestock exploration as well as overuse problems of phytosanitary treatment products. These conditions arose a great concern in society, governments and also in rural communities. However, knowing that about 40% of global food production is lost due to pests and diseases in plantations, it is essential to recognize the importance of phytosanitary protection when combating hunger and poverty and simultaneously engaging environmental protection and economic development [1].
There are several fruits with recognized health benefits. It has become extremely important for farmers to minimize problems arising from diseases and pests [2]. The increase of air temperature and changes in the amount, intensity, and frequency of precipitation as well as the frequency and intensity of extreme weather events have a relevant impact not only on water and nutrient availability but also on diseases and pest-spread. Thus, temperature and humidity have been considered as control parameters to avoid excessive pesticide use [1].
Another aspect to be aware of, which prevents the use of synthetic pesticides, is organic farming. Organic farming has been gaining recognition in the world, especially in Europe, in the past years since it contributes to a better environment, health and quality of products. For example, even though approximately 20% of the world’s total organic agricultural land is used for olive cultivation, just a little percentage (<10%) of earth’s olive orchards are under organic production and in Europe only 10% of its total organic permanent cropland is used for olive cultivation. Although organic farming shows to be a good approach, farmers must consider economic social implications as well as other farming aspects in the passage from conventional to organic farming which may not be easy. Studies comparing conventional and organic farming showed that, on an average, organic farmers had larger farms than conventional farmers having a higher yield of olive oil per tree, but a slightly lower yield per hectare because of a lower number of trees per hectare. It has been more difficult for organic farmers to control pests and diseases. Therefore, a lot of farmers still choose to use non-organic phytosanitary products to ensure their production success [3,4]. One of the reasons for the overuse of phytosanitary products is the large extension of orchards, such as olive orchards. This is because when a pest or disease is detected in a restricted area of the orchard, the treatment is adopted to its full extent, and sometimes it would not be necessary.
Research work has been developed during the last decades to help and improve agricultural processes. Wang et al. [5] developed a review of the recent development and future perspective of wireless sensor networks (WSN) in the agriculture and food industry. This research from decades ago discussed the advantages of WSN and obstacles that prevent their fast adoption. It provided an analysis of market growth to present future trends of WSN technology development in the agriculture and food industry. At this time, the low-power wide-area network (LPWAN) protocol, LoRa (Long Range), which is communication technology considered in our application had not been developed. It was provided a comparison between wireless LAN WiFi (IEEE 802.11b), Bluetooth (IEEE 802.15.1) and ZigBee (IEEE 802.15.4) and it was stated that the deployment of WSN in the agriculture and food industry was still at a beginning stage, however, applications could be classified into several categories. The relevant ones for the current study are environmental monitoring and precision agriculture. Within the 1st category, several applications of a WSN for weather monitoring were provided. Several sensor nodes remotely report temperature, moisture and sunlight intensity to a central PC, in order to provide real-time decision support in terms frost avoidance, irrigation management, fertilizer application determination and harvest scheduling. For the second category, WSN were used in precision agriculture to assist spatial data collection through a mobile field data acquisition system to collect data for crop management and spatial-variability studies. Other were used to variable-rate technology, i.e., as an example, to automatize fertilizer applicator for tree crops, where the system was composed by a GPS module and real-time sensor data acquisition, a decision module for calculating the optimal quantity and spread pattern for fertilizer, and an output module to regulate the fertilizer application rate. Data communications among the modules were established using a Bluetooth network. In the case of data supplied to farmers, a web server developed by Jensen et al. [6] provided information on pest and disease infestation and weather forecasts. Farmers can download the information directly via the Internet and use them for operation scheduling. However, this system does not collect any data, only uses information available on the internet. At that time, Wang et al. [5] already predicted that technology would reach the idea of ubiquitous computing that “virtually everything can be embedded with tiny wireless sensor-based systems (including microprocessors and communication capabilities)”. Due to the huge technological advance during the last decades, Ojha et al. [7] updated the state-of-the-art in practice and future challenges of WSN for agriculture, stating that in recent times, WSNs have been widely applied in various agricultural applications. Devices, sensors and communication techniques associated with WSNs in agricultural applications were analyzed, provided a depth review and analysis of the related work. A typical WSN deployed for agricultural applications is composed of on-field sensor networks powered with application-specific on-board sensors that communicate among themselves and using a gateway to enable a connection between the sensor network and the outer world. Some applications such as those developed by Matese et al. [8] and Bhargava et al. [9] focus on diseases and pest predictions using surrounding climate information. Matese et al. [8] developed a WSN designed and developed with the aim of remote real-time monitoring and collecting of micro-meteorological parameters in a vineyard. The WSN uses 433 MHz radio communication to provide coverage of 200 m, transmitting automatically to the master unit once per day. As the agrometeorological conditions that might favor pathogen attacks on the crop are only measured once per day, the real-time availability of data to predict diseases and pests occurrence is limited. This specification may reduce the window of opportunity of the farmer to quickly intervene. Bhargava et al. [9] developed a simulation of a WSN to predict the onset of Apple Scab. Although the simulation provided a suitable architecture for deployment of WSN, no experimental tests were performed and the power efficiency and the duration of operation of the motes were not evaluated. Other studies have been developed in this scope, such as Liang et al. [10] that propose an Intelligent Agricultural Forecasting System Based Fuzzy Logic from data acquired by WSN or Kassim et al. [11] that provide a review of wireless sensors network (WSN) used to build decision support systems for precision agriculture applications. Rodriguez et al. [12] designed and implemented a Zigbee WSN for monitoring the agricultural environment in a roses greenhouse. Although not being developed to work in outer ambient conditions, the system acquires temperature, humidity and light. Each sensor node transmits monitoring data to the cloud. Data mining techniques were used with the purpose of identifying behavioral patterns given the environment conditions captured by the sensor network. Li et al. [13] and Yang et al. [14] developed a green prevention and control technology for pests using a combination of Solar Insecticide Lamp (SIL) with WSN. The proposed SIL-IoT was developed for pest control, and mostly for airborne insects. The full coverage, penetrable obstacles, irregular boundary and partition structure were studied. Deployment methods based on a genetic algorithm were developed to optimize the partition structure for the area coverage problem.
However, LoRaWAN was not included as one of the possible choices for low-frequency communication technology in any of these research works. Additionally, most of the solutions use battery power management but do not include a solar panel to increase energy autonomy.
As stated by Ferrer et al. [15], the number of occurrences of insects, pathogens and nematodes that affect the fruit trees and consequently their production has suffered a sharp increase over the last years due to goods trade and movement, changes in farming practices and climatic variations. The consequences have been a loss in production and in product quality that reflects serious economic losses to farmers. These authors highlight that Information Technology (IT) tools such as wireless sensors to constantly monitor climatic and vegetation data will increasingly be used in the near future. In this sense, this manuscript describes a novel approach to this problem that can be evaluated from several perspectives:
- (a)
- Fundamentally in the concept of the use of two temperature sensors, internal and external, in the technological solution that allows us to evaluate the temperature difference of fruit trees and in this way to give the farmer more data related to the real need of application of plant protection products. This approach has advantages in reducing the application of these products, with consequent monetary gains for the farmer and reduction of the environmental impact.
- (b)
- For the inclusion in the technological solution of another set of sensors that allow the farmer to have a more general perspective of the intrinsic and extrinsic conditions of his plantations and thus be able to act more quickly if he detects any tree health problem or any danger to the cultures.
- (c)
- The inclusion in the technological solution of a photovoltaic panel to supply the entire sensing system, data processing and communication system and the dimensioning of power electronics is an asset for wireless sensor network applications that intend to be truly remote.
- (d)
- The inclusion of LoRaWAN technology in view of its advantages for remote sensor networks is fully justified.
With the proposed low-cost IoT sensor mesh, it will be possible to carry out accurate, real-time analyzes of all sectors of the large-scale orchard and thus know which are the most likely to contract a pest or disease. In this way, it will be possible to only apply phytosanitary products to eliminate diseases and pests when and where they are necessary, contributing in long term for sustainable development, human health, and to more organic farming.
This paper is organized as follows: Section 2 presents materials and methods used in the proposed sensor mesh, emphasizing the LoRaWAN technology and the used hardware sensors; Section 3 describes the developed prototype, namely, the electronic schematic and the package design; Section 4 presents the obtained results; Section 5 concludes the paper and discusses the achieved results.
2. Materials and Methods
The system shown in this paper can be applied to any kind of fruit or nut tree, but it was specifically tested in large-scale olive orchard. Thus, brief research is presented on the olive tree and the main characteristics of the diseases and pests that most concern farmers nowadays. Thereafter, as a way to understand which components were most suitable for the device proposed in this paper, intensive research is carried out on all sensors and methods most used in the literature for each hardware component.
2.1. Olive Tree and Its Diseases and Pests
In this sense, some details about this fruit tree are presented. Olive trees grow in the Mediterranean climate. These trees are of major agricultural importance in the Mediterranean region as the source of olive oil, which is one of the base ingredients in Mediterranean cuisine. Thus, it is extremely important for farmers to combat problems that arise from past agricultural policies and climate change [2].
Olive orchards are often affected by many diseases and pests responsible for production losses both in quantity and quality, which consequently has repercussions on the olive oil produced. Therefore, fighting diseases and pests in the olive orchard, in most cases using pesticides, is essential to ensure the maintenance of profitability and quality [16]. However, with the overexploitation of crops and the consequent use of phytosanitary products has promoted the development of resistant pathologies.
The olive tree consists of a tree that can reach heights between 5–10 m and has several varieties according to its purpose. All varieties of olive trees are generally tolerant to water stress and well adapted to a wide range of soils as well as cultural conditions [17]. Olive trees are preferably planted in regions with a Mediterranean climate with optimal temperatures between 15–35 °C. Despite withstanding negative temperatures, approximately at −9 °C they stop developing and at temperatures below −10 °C they may even die if exposed to lower temperatures for a long time. Thus, sun exposure can and should be frequent, but a colder period is also necessary for the development of the fruit. The air humidity that surrounds the olive tree should be relatively low. The production cycle starts around the 4th or 5th year and can be maintained until 400–500 years, although after 100 years, production starts to decline. The vegetative cycle starts at the end of winter/beginning of spring and suffers a reduction in summer which makes it evident that the temperature conditions rhythms the floral development. It is also essential to ensure that olive orchards do not experience water stress, especially after dry winters or springs. Hence, it is important to know the evolution of soil humidity [18].
Some of the most worrying diseases and pests are Xylella fastidiosa, anthracnose, tuberculosis (diseases) and flies and olive moths (pests). In general, all the diseases and pests mentioned previously appear/develop between approximately 10–30 °C and with moderate to high relative humidity [16].
It is very important to know if the tree is being affected by a disease or pest. Although the difference is not completely clear, there are differences not only in terms of the living being that originates it but also on how the tree is affected, the problems it causes, and the extrinsic and intrinsic characteristics that lead to its emergence.
A pest consists of a set of living organisms of the same species that appear suddenly and in masse attacking and destroying crops. Some examples are worms, slugs, mice, insects and mites [16].
Diseases, on the other hand, are changes at the physiological and morphological level caused by biotic (parasitic) agents such as bacteria, viruses or fungi; or abiotic (non-parasitic) such as changes in climatic and soil conditions, nutrient deficiency, and the presence of toxic substances resulting from pesticides [16].
Pests are easier to identify and treat than diseases as their damage is mostly external whereas disease damage is generally intrinsic.
2.2. Hardware Sensors
Considering the system need for high autonomy and once known the main favorable characteristics (temperature and humidity) for the development of an olive tree and for some of its most concerning diseases and pests, a study of the existing sensors to monitor the olive tree internal and external parameters was carried out as well as a study of the most appropriate method for powering the device.
Two temperature and humidity sensors were chosen to this device because environment and tree internal temperatures as well as atmospheric and soil humidity have different effects on the fruit tree. A DHT11 sensor composed by an NTC thermistor and a hygro-resistance was used for the atmospheric temperature and humidity monitoring. A sensor with an NTC thermistor and a hygrometer type sensor were chosen for the internal temperature measurement and for the soil humidity monitoring, respectively, once these sensors are easy to implement and have a low consumption. The operating base of the thermistor consists of a temperature-sensitive resistance that varies inversely with the temperature. The hygrometer sensor detects variations in soil humidity based on the principle of electrical conductivity. Lastly, it was also embedded a gas measurement sensor to this device. The sensor chosen was MQ-135 due to its large gas detection range and set of gases that may be detected (Fire smoke, CO2, Ammoniac, Benzene, Alcohol).
It is extremely important to monitor both temperatures once the pest’s appearance is more related to tree surrounding environmental temperature whereas disease dependence is more associated with tree internal temperature, since diseases develop inside the tree. Moreover, it is also very important to know the difference between both temperatures because in most cases farmers’ awareness about environmental temperature is achieved through meteorological sites/applications which are displaying results obtained by a meteorological station. The problem with this is that the station is rarely near the plantation. Thus, knowing the exact environmental and internal temperature, it is possible to have a more accurate notion of the true environmental and internal temperature, and thus act accordingly.
In the humidity case, it is important to measure separately atmospheric and soil humidity once their variation is not completely associated. Both are connected to diseases and pest’s appearance, but atmospheric humidity will mainly influence disease appearance while soil humidity will mostly influence pest’s emergence.
It must be highlighted that a single device provides a point measure. The atmospheric and soil humidities values will be improved, increasing the density of devices along the orchard. The main difference between both humidity results are that air humidity is more constant along the orchard requiring fewer devices. Soil humidity depends on the soil type, which can vary in the orchard. In this sense, the number and location of the sensor devices must be set previously taking into account these considerations. Additionally, as the soil moisture sensor is placed at a specific soil depth, it will not be possible to monitor the vertical distribution of moisture. Several sensors placed at different depths are required to obtain it. In terms of the horizontal distribution, it must be highlighted that soil moisture, at a reduced depth, may increase or decrease rapidly depending on precipitation and soil type, respectively. When it rains, the soil moisture will increase rapidly. If the soil is mostly sandy, the soil moisture may decrease rapidly. On the other hand, if the soil is clayey, the soil moisture will be high and vary very slowly. In most situations, the soil has some thermal and mass transfer inertia. The evolution along time of the parameters measured by sensors in each location can be used to assess the soil moisture and temperature profiles. Thus, after evaluating how these variations occur (amplitude and time), algorithms based in differencing schemes can be applied, if not based on the simple arithmetic average or linear interpolation, to determine the values or equations that correctly describe the horizontal distribution of soil moisture and/or temperature. These algorithms must be included in the application running on the cloud or general server that receives and gathers the data measured from all sensors.
As for the gas sensor, it was added to the device to detect fires and the effect that pollution and pesticide toxic components have on plantations. By analyzing the graphics and knowing the normal gas concentration in the environment, it is possible to analyze not only if there is a fire nearby but also if there is some sort of pollution or even control the concentration of ammonia, alcohol and benzene. Gases concentration graphic shows an average concentration result of all the gases detected by the sensor. Toxic gas concentration control is important since ammoniac gas is a biodegradable gas and in turn quickly absorbed by plants and it appears in some phytosanitary products. If this gas reaches high concentration levels, it has toxic effects on the plant, for example, interference with oxygen transference. As for benzene gas, it is present in pesticides and when in the soil it can pass to groundwater. When plants are exposed to this gas their growth can be slowed since it interferes in cell division and they may even die due to the interference with the photosynthesis process. Alcohols also interfere with plant growth, decreasing it.
An Atmel ATmega328P microcontroller and the EBYTE E32 433t30d communication module were selected for the control module. The Atmel microcontroller was used mainly due to its low commercial value and ease of programming. The EBYTE E32 433t30d is a module based on RFIC SX1278 from SEMTECH and was used due to its great versatility and robustness. A photovoltaic panel was used to charge a 2600 mAh Lithium-ion (Li-Ion) 18,650 battery by means of the Constant Current/Constant Voltage (CC-CV) charging method. The photovoltaic panel has a maximum power of 1.5 W for a surface of 115 mm × 85 mm, a 12 V open-circuit voltage, and a 100-mA short circuit current. In order to allow an efficient extraction for battery charging, an isolated DC/DC converter of Buck topology with a built-in Constant Voltage Maximum Power Point Tracking (MPPT) algorithm was incorporated. Additionally, in order to allow the correct charging of the microcontroller, the communication module and various sensors, a second non-isolated DC/DC Buck-Boost converter was selected once it enables to response to the voltage charging ranges of all those components.
2.3. LoRaWAN Technology
For the communication of monitored data, there is currently a wide variety of Wireless Sensor Networks (WSN) methodologies in the literature linked to the Internet of Things (IoT). These methodologies can be divided into groups according to their communication range. However, for fruit tree plantations extending, in most cases, by several hectares, the communication distances may be in the order of kilometers. Thus, a methodology is required that performs communication over long distances without consuming high power and, consequently, without unnecessary economic expenses. In order to allow remote monitoring, it is essential to implement wireless monitoring systems. Among the various existing technologies, Low Power Wide Area Networks (LPWAN) communication topologies: Narrowband Internet of Things (NB-IoT), Sigfox and LoRa Wide Area Network (LoRaWAN) are technologies that allow long-range communication using low power devices [19,20]. Table 1 compares some of the specifications of the three technologies allowing us to understand the main differences between them.
Despite presenting an additional cost for configuring the gateways, and a low data transfer rate, LoRaWAN technology shows to be the most appropriate for IoT applications, as it allows long-range communications with low power consumption and is accessible to anyone without additional costs.
Sigfox and NB-IoT require regular payment. In the first case because it is a non-open source technology and in the second case because it is a technology that operates in a licensed spectrum area. Nevertheless, LoRaWAN presents some limitations. The main one is related to its baud rate not being a suited technology for applications high-frequency data acquisition and transmission. As in this specific application, the transfer rate is very low, it ends up being the most advantageous and the least expensive technology compared to the other communication technologies, being the topology chosen for this prototype.
LoRaWAN technology obeys to the communication protocol developed by the LoRa Alliance. Featuring a star network architecture this technology has sensor devices, gateways, a network server and an application [10]. However, the devices are not associated with a specific gateway. Instead, and considering that there are several gateways in the same reach, data transmitted by one of the devices is generally received by several gateways. If a transmission is detected by several gateways, the server decides which one to use. Once done this step, each gateway forwards the packet received from the final device to the network server via Ethernet, Wi-Fi or other network technology being its main function data conversion from Radiofrequency (RF) format to Internet Protocol (IP) format and vice versa [21,22].
Until the appearance of LoRaWAN technology, it was known that to perform communications over long distances it was necessary to increase the device’s power. However, there were situations where the increase in power was not possible, limiting the distance of data transmission. Thus, this new technology is based on a factor that allows long-range communications with low power consumption, the channel bandwidth. With this new approach, instead of increasing the power consumed by the device, the bandwidth where the signal propagates is reduced to achieve a greater communication range. Yet, the bandwidth is directly proportional to the channel’s capacity, which means that as the bandwidth is decreased to allow communications over greater distances, the capacity of the channel is reduced, in other words, the transmitted bits per second (baud rate) are reduced [22,23]. LoRa modulation, characteristic of this technology, allows us to overcome this problem.
2.3.1. LoRa Modulation
Whereas the term LoRaWAN defines the communication protocol and system architecture for the network, LoRa designates the modulation used to allow long-range communication. Thus, LoRa provides communication between IoT devices and the application and LoRaWAN is the network connection between several IoT devices with gateways and, in turn, between these and the internet [21,24,25].
The external environment information after being collected is transformed into an electromagnetic signal for later transmission. Nevertheless, this signal first needs to be modulated in order to be able to propagate to the receiver, considering the distance and the data amount to be transmitted. LoRa modulation uses a spectral spreading technique based on the Chirp Spreading Spectrum technique, which translates into a sinusoidal signal of variable and random frequency called Chirp that uses the entire bandwidth of the channel to carry out its propagation [22,25,26]. As the name suggests, Chirps are used as signal carriers that must be transmitted at different and randomly selected frequencies for each transmission to enable more viable communications. Each one of these Chirps encodes x bits and will be rearranged in x Chips (several pieces of the same Chirp arranged along with the bandwidth at different frequencies in order to make up their value) [22]. An example of an unmodulated signal and a LoRa modulated signal can be seen in Figure 1.
It is these Chip jumps/rearrangements over the minimum and maximum frequency that determine how information is encoded and in turn what value the encoded message has. These values are determined from the scattering factor (SF). Each Chirp can have from 6 to 12 bits that will be equal to the SF itself. The number of Chips will be equal to 2SF [22,24,26]. With the spreading factor and the bandwidth (B), the Chirp propagation time (ts) can be determined using Equation (1) [22,26]:
The number of Chirps per second, that is, the baud rate (Rs) can be determined knowing the Chirp period as shown in Equation (2) [22,26]:
The time per Chirp increases setting the bandwidth and increasing the SF, whereas the binary rate decreases.
SF is also important regarding the distance between the transmitter and the receiver. The further away they are, the greater the SF must be, as the signal with the distance tends to get weaker. Hence, it is assumed that for communication to be more robust, a higher SF must be selected. The higher it is, the longer the signal transmission time will also be, which leads consequently to increased energy consumption [22,24]. Therefore, it is important to know the purpose of each application in order to select the correct SF.
The fact that this modulation uses the entire channel bandwidth and transmits the signal based on the Chirp Spread Spectrum technique provides resistance to interferences and signal fading which is ideal for urban environments [25].
2.3.2. LoRaWAN Classes
Bearing in mind that sensors serve different applications and requirements and knowing that one of the main goals of LoRaWAN technology is to optimize energy consumption, the devices are placed in sleep mode for certain previously determined periods of time or until they receive an awake order. Devices do not receive information during the time in the sleep state [20,23]. Thus, the devices can be classified into three classes, all of which allow bidirectional communication balancing the time at which it is intended for the device to wake up with the battery life. These classes are described in the following sections.
Class A: Uplink transmissions in this class are carried out for pre-defined periods according to the needs and only after their transmission, two time slots are available for receiving downlinks. Although there are two slots for downlink, gateway responses can only be transmitted in one of them. In case the module needs to make a two-message uplink, it must wait for the first sending transmission window to pass in order to send the second message [20,23,24]. It is the class that allows the lowest energy consumption and becomes the best choice for cases where the module does not need to be constantly active to collect information.
Class B: this class is similar to class A but is characterized by opening extra downlink windows. This extra period is signaled by the gateway so that the gateway knows when the module is active to receive downlinks and so that both are synchronized [20,23,24].
Class C: the devices referring to this class are always active, so they can receive a downlink at any time except when they are transmitting (uplink). Devices in this class consume much more energy so they should only be used in applications where consumption is not a problem [20,23,24].
The developed device uses LoRaWAN Class B. Each node has an associated unique address, this address is sent in the prefix of each message sent by the gateway to each node. The reverse happens in the reception process, each message received by the gateway contains a prefix with the address of the originating node.
2.3.3. Data Security
The data transmitted is related to climate, tree, and soil conditions. Security protocols are defined in order to implement security from the device to the server. To encrypt the messages sent, the AES algorithm is used to certify the security of the message by encrypting twice using two different keys LoRa Alliance [23]:
Application Session Key (AppSKey): only the device and the application server have access to this key LoRa Alliance [28].
Network Session Key (NwkSKey): used to encrypt the previous encryption together with the transmission data. Only the device and the gateway have access to this code [28].
The payload (part of the message body that has the relevant information) is encrypted using the first key (AppSKey). If the system is corrupted before reaching the gateway, it is not possible to access any information. If it is after having been received by the gateway, only access to the control data. Payload only is decrypted on the server using the first key [28].
Data security must be analyzed in detail for future device versions in order to reduce data exploitation or data manipulation possibilities, either in concurrency or hacking settings. A possible solution includes end-to-end encryption, where all data is encrypted, from the sensor to the cloud. Cichonski et al. [29] explore common components of IoT sensor networks and the requirements for its secure operation. Exposed interfaces, applicable threats, and technologies that may be utilized to ensure the security requirements are described. Another possibility is proposed by Nguyen et al. [30] that use Intel Software Guard Extensions (SGX) to store logs from IoT devices efficiently and securely, satisfying Confidentiality, Integrity, and Availability (CIA) security properties.
3. Prototype
In order to mitigate some disadvantages of the existing patents for the monitoring of internal and external parameters of fruit trees, to enable a greater number of data analyzed, and still to provide a good method to communicate the information obtained, the prototype shown in Figure 2 was developed. Although there are already some technologies that allow more accurate monitoring of the necessary parameters, this monitorization remains expensive and difficult to acquire, as the orchards often have a considerable number of hectares, which makes the communication of information to a server difficult or even impossible. LoRaWAN technology is used in this prototype to overcome this situation.
3.1. Prototype Operation Principle
Once the device is built with the chosen constituents for optimal monitoring, it is possible to observe in Figure 3 the representation of the proposed operating structure. This communication structure was designed in such a way as to require a minimum of evasive changes both in the olive tree itself as in the existing infrastructure, and simultaneously to maximize the user’s access to monitored data. Thus, a device was developed that is attached to the olive tree trunk to be monitored and that reads all the required parameters. In order to receive data from all the olive trees monitored in an olive orchard, a central repeater station was also developed, as shown in Figure 2e,f.
The entire olive orchard should be divided into small sectors with at least one monitoring device per sector in the implementation phase. This device must also be placed in a central area of the sector in order to share the same environmental conditions as all the olive trees around it. This practice will allow the reduction of the number of necessary devices and consequently the implementation cost. As for the central repeater, it should be installed in an infrastructure that is within LoRaWAN communication range and that has internet access via Wi-Fi.
From a functional perspective, the entire data monitoring process is initiated by sending an activation signal from the central repeater to each monitoring device. This selective communication between the repeater and each device is carried out using the identification address of each device. The activation signal is repeatedly sent by the central repeater with a time interval predetermined by the user, which will define the sample rate. Upon receiving the activation signal, the device that was in sleep mode in order to reduce energy consumption and extend its autonomy, awakens and then begins the routine of reading sensors and the subsequent resending of the monitored data to the central repeater. All communication between the repeater and the monitoring devices is accomplished using LoRaWAN technology.
If, by chance, there is a device that cannot communicate directly with the central repeater due to obstructions, interference or a large distance between the two, the communication between the device and the repeater can be made by nodes, that is, by making a bridge between other intermediate devices.
To facilitate the analysis of the obtained information through the devices in each of the olive tree sectors, the central repeater, after receiving the monitored data, will upload it to a cloud service using a pre-existing local Wi-Fi network. Thus, it is possible to access the obtained information and its history anywhere either through any web browser or through a mobile application for the Android platform developed especially for this purpose.
3.2. Charging System
The block diagram topology of the device’s charging system is shown in Figure 4. The device is powered by photovoltaic energy. For an efficient photovoltaic energy extraction, i.e., for the maximum power to be extracted at all times and for the Li-ion battery charging to follow the appropriate profile, an isolated DC/DC converter with Buck topology was used, which has an integrated Constant Voltage MPPT algorithm. A second non-isolated DC/DC converter with Buck/Boost topology is used to correctly power the microcontroller, the communication module, and the various sensors. Hence, it will be possible for the system to remain operational even in cases where the battery voltage levels are low. A 2600 mAh Li-ion 18,650 battery was used and charged by the CC-CV method.
3.3. Mobile Application
A mobile application for the Android platform was specially developed to allow the user to access the monitored data anywhere. Real-time data of each olive orchard sector can be analyzed in the application, as shown in Figure 5a, as well as a history of all monitored data with information concerning the day, month, year, day of the week, and the hours of each acquisition as showed in Figure 5b.
In Figure 5a is shown the dropdown box (1) that allows us to select the sector from which the user wants to obtain information. Segment (2) provides the values of the temperature inside the tree and of the ambient air, as well as making the difference between the two values. Segment (3) provides information regarding the humidity of the surrounding air and of the soil. Segment (4) shows the concentration of harmful gases, and segment (5) shows the graphs of real-time data as well as information concerning the date and time of the data acquisition.
4. Experimental Tests and Results
This section may be divided by subheadings. It should provide a concise and precise description of the experimental results, their interpretation as well as the experimental conclusions that can be drawn.
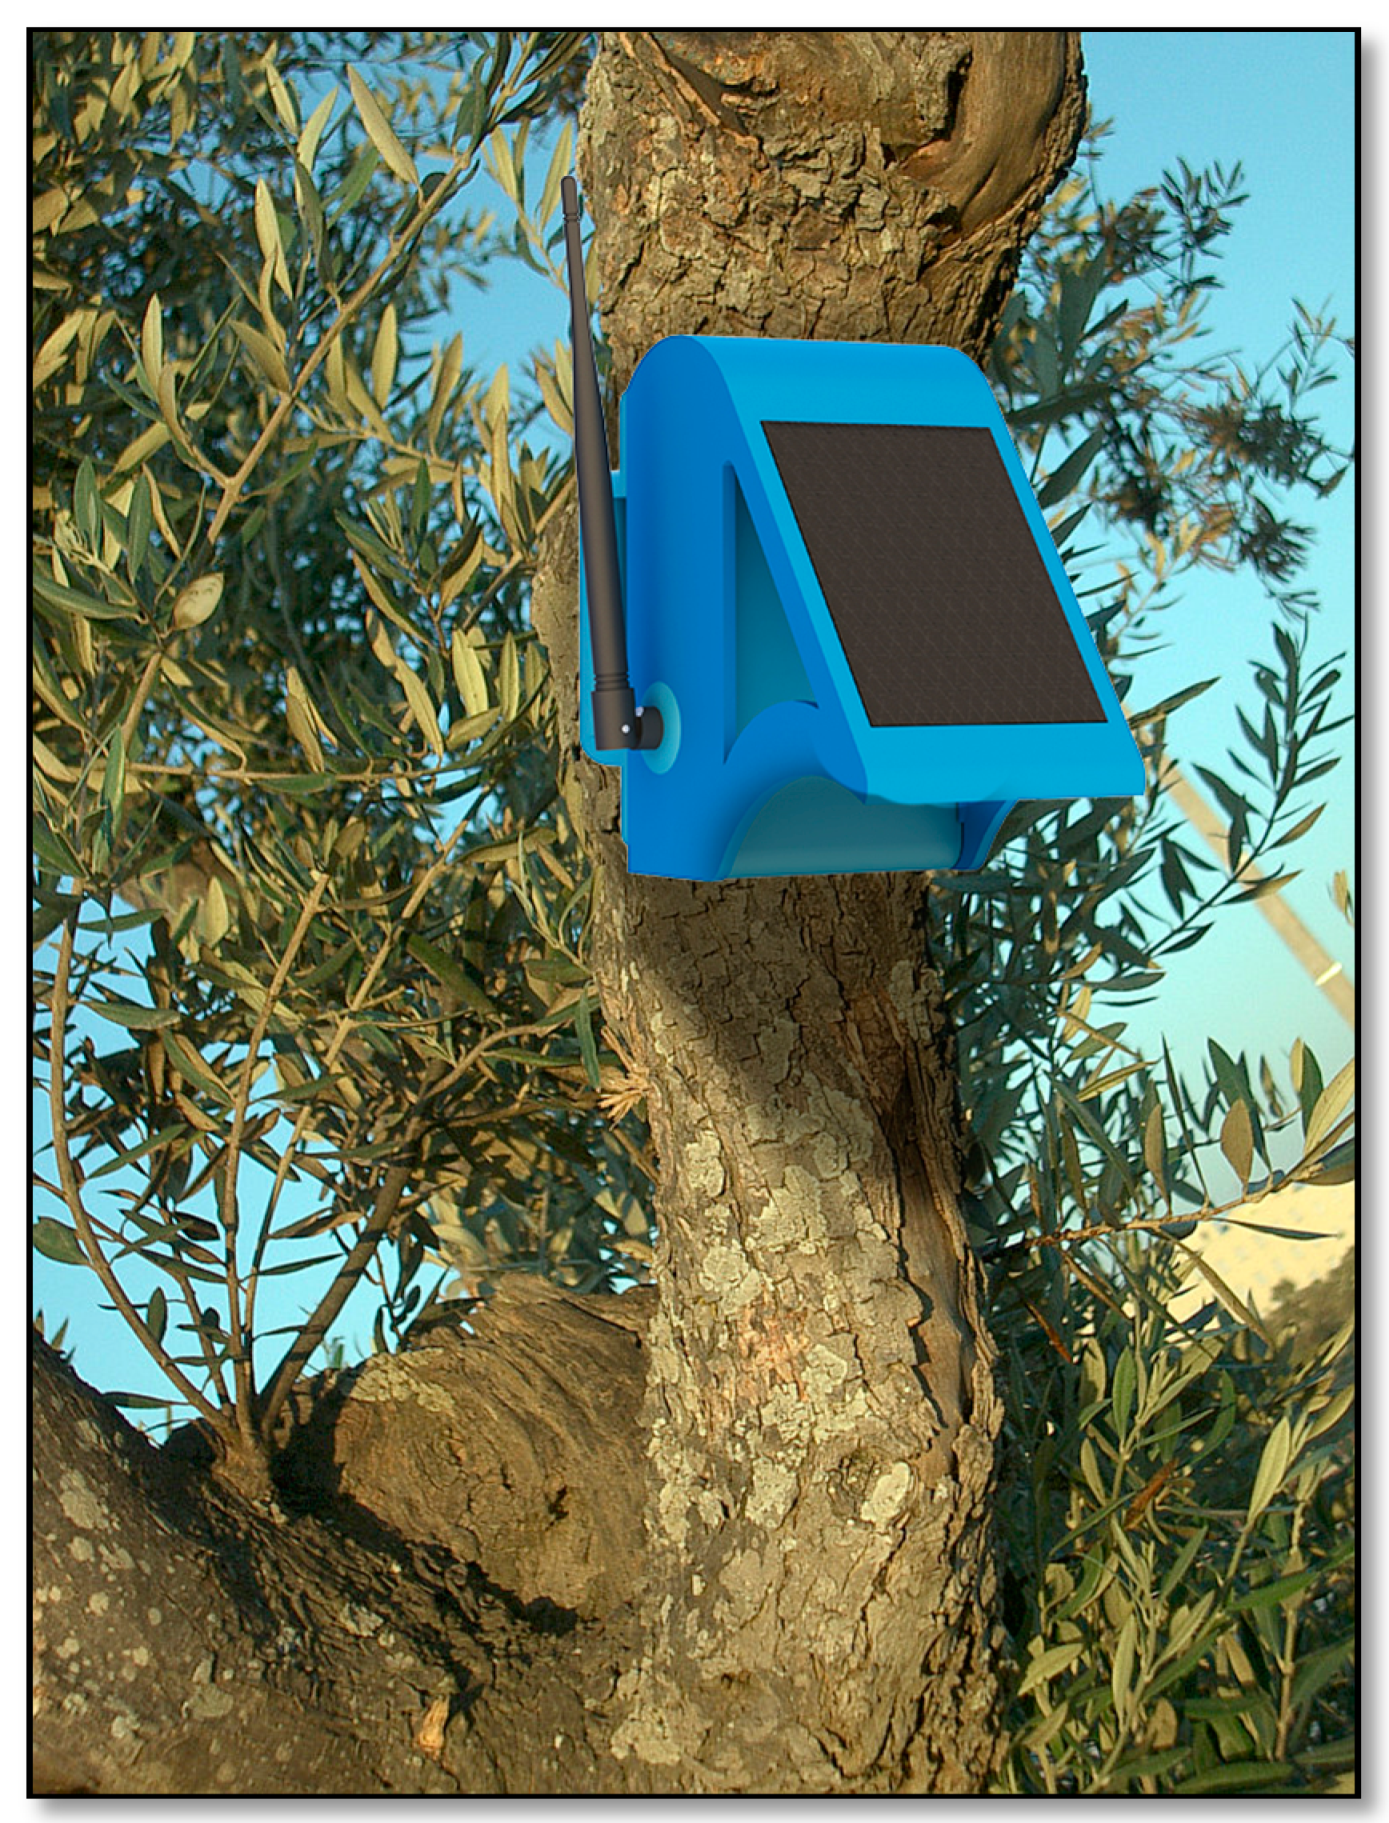
Two experimental tests were performed on an olive tree to test the precision and robustness of the device. The sampling time was 15 s for both tests. This measuring interval was used in order to obtain a good autonomy of the system and at the same time not compromise the acquisition rate. An image of the placement of the monitoring device in an olive tree is shown in Figure 6.
4.1. Experimental Test 1
Experimental test 1 was conducted for 12 h (h), starting at 6 a.m. and ending at 18 p.m. Figure 7 shows the internal and external (air) tree temperature variation over time. The ambient temperature initiated with a temperature value of 15 °C at 6 a.m. and continued to rise until 8 a.m. due to the sun rising in that period. At 12 a.m., approximately, a gradual decrease in temperature was perceived until the end of measurements as a result of clouds. Despite all these environmental changes during the day, the temperature variation, when comparing the initial and final measurements, was practically null and the largest temperature amplitude was only 1 °C.
The tree internal temperature, as expected, behaveed very similarly to the ambient temperature. As shown in Figure 7, the internal temperature variation was influenced by the ambient temperature variation. At the beginning of the test, the sensor detected 12.2 °C and at the end of the test no more than 11.9 °C. Between 10 a.m. and 12 a.m. there was a peak caused by the increase in ambient temperature felt until 8 a.m. This peak was delayed in relation to the increase in the ambient temperature since the thermal conductivity of the wood and cork is small. The temperature variation between the first and the last measurement was only 0.3 °C and between the lowest and the highest measurements was 0.6 °C.
Comparing the internal and external tree temperature values there is a difference of approximately 3 °C. Knowing that most diseases and pests develop more quickly at 25 °C and considering that in Portugal in the 1971–2000 history the average number of days with ambient temperature above 25 °C was 81 days (IPMA; 2020), the need to use phytosanitary products to fight these diseases and pests is noticeable. Therefore, having more accurate knowledge about the difference between the internal and external tree temperatures, the farmer can manage and decide with higher reliability the use of phytosanitary products, reducing its unnecessary use. This reduction not only preserves the tree health but also has a relevant impact on the environment and its long-term sustainability.
The humidity variation is shown in Figure 8. One curve represents the atmospheric humidity and the other the soil humidity. Both humidities start with high values since a rainy period preceded the test. However, although there is a gradual and similar decrease in measured data in both cases over time, soil humidity is not influenced by atmospheric humidity as the tree internal temperature by ambient temperature. Thus, both humidities experienced a small decrease, due to the lack of sun in most of the testing time.
The variation between the lowest and highest peak for atmospheric humidity was 11%, and for soil humidity was 19%. The soil humidity values were always lower than the atmospheric humidity values. Additionally, the variation of the soil humidity was high. These conditions arose from the location of the sensor under the tree canopy during the acquisition period, as well as the fact that the soil sensor was placed in the root area where the water, essential for the sensor measurement process, was absorbed.
Figure 9 shows the gas concentration measured with the MQ-135 sensor. It can be concluded that the gas concentration in the tree’s surrounding atmosphere is relatively low, since it does not even reach 1% on a scale of 0–100% of harmful gases detected by the sensor. Although measurements suffered from some variation over the measurement period, it was only 0.01%, which is not a significant variation concerning the measured values.
4.2. Experimental Test 2
Experimental test 2 was conducted for 24 h starting at 0 a.m. and ending the next day on the same hour. Figure 10 shows the internal and external tree temperature variation over time.
The ambient temperature started with a value of 15.5 °C and ended at approximately 19.5 °C. Until 14 p.m. there was mostly a decrease in temperature value followed by a significant increase due to the sun uncover, since the device was facing the sun. The internal temperature value experienced a decrease as a result of the relationship between internal and ambient temperatures variation. The increase of ambient temperature led to an increase in internal temperature of 2.5 °C in a period of 4 h. The ambient and internal tree temperature values have a difference of approximately 4 °C, which strengthens the conclusions indicated in the experimental test 1.
Once an initial period of rain occurred, both the atmospheric and soil humidity curves, shown in Figure 11, show an initial high value of approximately 90%. Figure 11 shows that atmospheric humidity varies more than the soil humidity, once it began at 90% and, although it had always remained high, it experienced sudden changes between 10 a.m. and 19 p.m. related to the small particles characteristic of wet weather sensed by the sensor that day. The difference between the lowest and the highest atmospheric humidity is 20%. The soil humidity presents a more stable profile since its variation is not entirely related to atmospheric humidity variation but showing a decrease of about 23% due to the reasons mentioned in experimental test 1.
As for gases concentration in the tree’s surrounding atmosphere the monitored data showed very similar behavior to the first experimental test not being relevant a second graphic demonstration.
4.3. Communication Range Test
In addition to the experimental tests developed to test the device’s robustness and reliability, a communication range test was also performed in order to understand the maximum communication range achieved by the device.
The test range consisted of a communication between the gateway (at 1270 m altitude) and an end device (at 740 m altitude) in a rural environment with a clear line of sight between the communication points and without obstacles to the communication.
Both devices have a transmission power of 20 dBm, were equipped with a 5 dBi antenna. The test was carried out with a transmission length of 58 Bytes and an air data rate of 1 kbps with a spreading factor of 10.
Figure 12 shows the orographic conditions of the carried-out test between the communication points, gateway (B) and the end device (A). In the tested conditions, it was possible to guarantee stable communication for a communication range of approximately 10 km.
4.4. Concluding Remarks
The experimental tests conducted did not include the evaluation (specific analysis and quantification) of diseases and pests and consequently of the contribution for the farmers without excessive use of pesticides. This would be a research work outside the main focus of this paper. However, as stated by Ferrer et al. [15], in the specific case of olive trees, there are several insects, pathogens and nematodes that affect the trees and consequently their olive production. The number of these occurrences has suffered a sharp increase over the last years due to goods trade and movement, changes in farming practices and climatic variations.
Landa et al. [31] and Trapero-Casas et al. [32] state that there are more than one hundred olive pathogens, although only a few of them cause serious economic losses on olive groves. Verticillium wilt includes high rates of tree mortality and reductions in fruit yield [33]. High infestation levels of olive moth and fly (P. oleae) can lead to high economic losses [34]. The olive fly causes severe economic losses. The bacterium X. fastidiosa is a plant pathogen transmitted by insects that feed on the xylem fluid of plants. Fernandez et al. [35] estimate that X. fastidiosa full spread could ultimately cost the EU over €5.5 billion/year due to production losses, affecting over 70% of the EU’s production value of olive trees. Thus, it is very important to apply control measures, not only to contribute to reduce the excessive use of pesticides, but to evaluate the tree health and to spot parameters variation that can indicate diseases and pests surge. Among the research work developed by Ferrer et al. [15], an inventory with the main pests and diseases affecting the olive tree was developed, including their geographical distribution and economic impact, as well as, how expected climatic changes are likely to impact the distribution and occurrence of such pests and diseases and their impact on olive growing. Research studies focusing on the analysis of the effects of climate change on the olive agricultural production system, including the development of pest and diseases, is limited. Some results were obtained by Graniti et al. [36] and Ponti et al. [37]. They concluded that is very difficult to predict how diseases and pests in an olive tree evolve due to changes in temperature, humidity (precipitation) and CO2 concentration, but some indications are: (1) extension of the survival rate of pathogens and pests outside their usual ranges; (2) change of biological cycles of pests and diseases; and (3) unpredictable increase of their development. Thus, as stated before, Information Technology (IT) tools such as wireless sensors are now at a stage of technological maturity that can be used to constantly monitor climatic and vegetation data that will feed decision support systems and ultimately be used by farmers as a precision plant protection technique.
5. Conclusions
One of the main focuses among farmers nowadays is the appropriate fight against diseases and pests in plantations without excessive use of pesticides. Temperature and humidity are crucial to the surge of diseases and pests, thus the development of a monitoring device to mitigate the disadvantages of other existing devices is required.
When compared with other devices for the same scope, this device has advantages in terms of analyzed parameters, the system power supply used and the communication method. This device has a much broader measurement capacity, being able to measure five parameters, while other devices only measure one parameter, in most cases. In addition to internal and external parameters monitoring sensors, a gas detection sensor was also included in this device. The main point when including this sensor was, above all, fires detection. Additionally, it also allows chemical substances detection that can be toxic to the tree and to the human being, as well as carbon dioxide concentration detection in tree’s surrounding atmosphere, a very important factor nowadays as it is a preponderant factor to atmospheric pollution. The system power supply consists of a photovoltaic panel, which constitutes an advantage since this method allows the battery to be recharged without the need to replace it and allows its use in remote locations that, for some reason, do not have access to the electrical grid. In relation to the data communication, other devices within the same scope resort to methods with shorter communication range and more expensive, whereas this device implements LoRaWAN technology. It has proved to be an advantage over other topologies once it uses unlicensed bandwidth and is open source. This advantage combined with the large communication range and the fact that this communication topology can be used to transmit data from simple and low energy consumption sensors allowed the development of a much more economical device.
The experimental tests were very important, not just to test the devices robustness and efficiency, but also to understand the importance of monitoring temperature and humidity with the largest precision and regularity as possible since it is essential to detect small variations. In the experimental tests, it was also possible to observe differences between internal and external temperature values that are very relevant for the management of phytosanitary products application. In other words, this difference can dictate the lesser/greater application of these products, an action that has an impact on economics and environmental sustainability.
The communication range test confirmed that a higher SF is needed to achieve longer communication ranges although it means a shorter data rate. Despite this fact, monitored data was all transmitted without resorting to an expensive and complex communication method.
Thus, a device capable of monitoring internal and external tree parameters such as internal tree temperature, soil humidity, and tree’s surrounding environmental temperature and humidity and even harmful and fire-inducing gases was developed. In addition, it also allows real-time monitoring on large properties with several hectares and with resources for low power sensors, due to LoRaWAN communication technology which is easy to implement and free of charge for the user. All of this is possible without resorting to the electrical grid to charge the device using the sunlight natural resource.
Author Contributions
Conceptualization, P.D.G.; data curation, L.V. and P.D.G.; formal analysis, L.V. and P.D.G.; investigation, L.V. and J.F.; methodology, L.V. and P.D.G.; project administration, P.D.G.; resources, L.V., J.F. and M.L.A.; software, L.V., J.F.; supervision, P.D.G.; validation, L.V.; visualization, L.V., J.F. and M.L.A.; writing—original draft, L.V.; writing—review and editing, P.D.G., L.V., J.F. All authors have read and agreed to the published version of the manuscript.
Funding
This research received no external funding. The authors thank the Fundação para a Ciência e Tecnologia (FCT) and R&D Unit “Centre for Mechanical and Aerospace Science and Technologies” (C-MAST), under project UIDB/00151/2020 for the opportunity to carry on this project.
Conflicts of Interest
The authors declare no conflict of interest.
References
- Food and Agriculture Organization of the United Nations. Available online: http://www.fao.org/portugal/en/ (accessed on 16 October 2019).
- International Olive Council. Olive Oil—Provisional Data 2018/19 Crop Year. Available online: https://www.internationaloliveoil.org/olive-oil-provisional-data-2018-19-crop-year/ (accessed on 11 November 2019).
- Berg, H.; Maneas, G.; Engström, A.S. A comparison between organic and conventional olive farming in Messenia, Greece. Horticulturae 2018, 4, 15. [Google Scholar] [CrossRef] [Green Version]
- Putinja, I. Organic Olive Cultivation Increasing Worldwide. Available online: https://www.oliveoiltimes.com/business/organic-olive-cultivation-increasing-worldwide/67492 (accessed on 17 September 2020).
- Wang, N.; Zhang, N.; Wang, M. Wireless sensors in agriculture and food industry—Recent development and future perspective. Comput. Electr. Agric. 2006, 50, 1–14. [Google Scholar] [CrossRef]
- Jensen, A.L.; Boll, P.S.; Thysen, I.; Pathak, B.K. Pl@nteInfo: A web-based system for personalized decision support in crop management. Comput. Electr. Agric. 2000, 25, 271–293. [Google Scholar] [CrossRef]
- Ojha, T.; Misra, S.; Raghuwanshi, N.S. Wireless sensor networks for agriculture: The state-of-the-art in practice and future challenges. Comput. Electr. Agric. 2015, 118, 66–84. [Google Scholar] [CrossRef]
- Matese, A.; Gennaro, S.F.D.; Zaldei, A.; Genesio, L.; Vaccari, F.P. A wireless sensor network for precision viticulture: The NAV system. Comput. Electr. Agric. 2009, 69, 51–58. [Google Scholar] [CrossRef]
- Bhargava, K.; Kashyap, A.; Gonsalves, T.A. Wireless sensor network based advisory system for Apple Scab prevention. In Proceedings of the 2014 Twentieth National Conference on Communications (NCC), Kanpur, India, 2 March 2014; pp. 1–6. [Google Scholar] [CrossRef]
- Liang, Z.; Liyuan, H.; Wong, H.; Xing, J. Intelligent Agricultural Forecasting System Based on Wireless Sensor. J. Netw. 2013, 8, 1817–1824. [Google Scholar]
- Kassim, M.R.M.; Mat, I.; Harun, A.N. Wireless Sensor Network in precision agriculture application. In Proceedings of the 2014 International Conference on Computer, Information and Telecommunication Systems (CITS), Jeju, Korea, 7–9 July 2014; pp. 1–5. [Google Scholar] [CrossRef]
- Rodríguez, S.; Gualotuña, T.; Grilo, C. A system for the monitoring and predicting of data in precision agriculture in a rose greenhouse based on wireless sensor networks. Procedia Comput. Sci. 2017, 121, 306–313. [Google Scholar] [CrossRef]
- Li, K.; Shu, L.; Huang, K.; Sun, Y.; Yang, F.; Zhang, Y.; Huo, Z.; Wang, Y.; Wang, X.; Lu, Q.; et al. Research and prospect of solarinsecticidal lamps internet of things. Smart Agric. 2019, 1, 13–28. [Google Scholar]
- Yang, F.; Shu, L.; Huang, K.; Li, K.; Han, G.; Liu, Y. A partition-based node deployment strategy in solar insecticide lamp Internet of Things. IEEE Internet Things J. 2020. [Google Scholar] [CrossRef]
- Ferrer, M.T.M.; Nobre, T.; Gkisakis, V.; Warlop, F.; Olivares, J.; Pascual, S. EIP-AGRI Focus Group ‘Pests and diseases of the olive tree’ Biodiversity and pest management. In Olive Fly Management through Symbiosis-Based Strategies: Looking for Trojan Horse Candidates; Technical Report; EIP-AGRI Focus Group, European Commission: Brussels, Belgium, 2020. [Google Scholar]
- Mendes, F.; Cavaco, M. Proteção Integrada da Cultura da Oliveira; Direção Geral de Alimentação e Veterinária (DGAV): Lisboa, Portugal, 2017; p. 94. (In Portuguese) [Google Scholar]
- Lima, M.A.A.; Matos, C. Oliveiras—Divulgação de uma coleção da FAO. Oleovitis/Olivicultura 2018, 34, 6–8. (In Portuguese) [Google Scholar]
- Cordeiro, A.M.; Inês, C.S.F. O Ciclo Anual da Oliveira, a Fenologia e as Práticas Culturais no Olival. Oleovitis/Olivicultura. 2017. Available online: http://www.iniav.pt/fotos/editor2/olivicultura_o_ciclo_anual_da_oliveira.pdf (accessed on 5 August 2020). (In Portuguese).
- Sinha, R.S.; Wei, Y.; Hwang, S. A survey on LPWA technology: LoRa and NB-IoT. ICT Express 2017, 3, 14–21. [Google Scholar] [CrossRef]
- Mekki, K.; Bajic, E.; Chaxel, F.; Meyer, F. A comparative study of LPWAN technologies for large-scale IoT deployment. ICT Express 2019, 5, 1–7. [Google Scholar] [CrossRef]
- LoRa Alliance. Available online: https://lora-alliance.org/lorawan-for-developers (accessed on 2 October 2019).
- Yi, J.; Clausen, T.H.; Townsley, W.M.; Augustin, A. A Study of LoRa: Long Range & Low Power Networks for the Internet of Things. MDPI Sens. 2016, 16, 1466. [Google Scholar] [CrossRef]
- LoRa Alliance. A Technical Overview of LoRa® and LoRaWANTM; LoRa Alliance: San Ramon CA, USA, 2015. [Google Scholar]
- Ait, F.; Gautier, M.; Magno, M.; Le, M.; Berder, O.; Benini, L. Long-short range communication network leveraging LoRa TM and wake-up receiver. Microprocess. Microsyst. 2018, 56, 184–192. [Google Scholar] [CrossRef]
- Varsier, N.; Schwoerer, J. Capacity Limits of LoRaWAN Technology for Smart Metering Applications. In Proceedings of the 2017 IEEE International Conference on Communications (ICC), Paris, France, 21–25 May 2017; pp. 1–6. [Google Scholar] [CrossRef]
- Reynders, B.; Pollin, S. Chirp Spread Spectrum as a Modulation Technique for Long Range Communication. In Proceedings of the 2016 Symposium on Communications and Vehicular Technologies (SCVT), Mons, Belgium, 22–22 November 2016; pp. 1–5. [Google Scholar] [CrossRef]
- Centenaro, M.; Vangelista, L.; Zanella, A.; Zorzi, M. Long-Range Communications in Unlicensed Bands: The Rising Stars in the IoT and Smart City Scenarios. IEEE Wirel. Commun. 2016, 23, 1–8. [Google Scholar] [CrossRef] [Green Version]
- LoRa Alliance. LoRaWAN Security. Full End–to–End Encryption for IoT Application Providers; LoRa Alliance (Gemalto Actility and Semtech): Fremont, CA, USA, 2017. [Google Scholar]
- Cichonski, J.; Marron, J.; Hastings, N.; Ajmo, J.; Rufus, R. Security for IoT Sensor Networks—Building Management Systems Case Study; National Cybersecurity Center of Excellence (NCCoE), National Institute of Standards and Technology (NIST), U.S. Department of Commerce: Washington, DC, USA, 2019.
- Nguyen, H.; Ivanov, R.; Phan, L.T.X.; Sokolsky, O.; Weimer, J.; Lee, I. LogSafe: Secure and Scalable Data Logger for IoT Devices. In Proceedings of the 2018 IEEE/ACM Third International Conference on Internet-of-Things Design and Implementation (IoTDI), Orlando, FL, USA, 17–20 April 2018; pp. 141–152. [Google Scholar] [CrossRef] [Green Version]
- Landa, B.B.; Jiménez-Díaz, R.M.; Navas-Cortés, J.A. Control de Enfermedades Causadas porMicroorganismos. In Sostenibilidad de la Producción de Olivar en Andalucía; Calero, J.A.G., Ed.; Junta de Andalucía, Consejería de Agricultura y Pesca: Seville, Spain, 2009; pp. 225–266. [Google Scholar]
- Trapero, A.; López-Escudero, F.J.; Blanco, M.A. Enfermedades. In El Cultivo del Olivo; Barranco, D., Fernández-Escobar, R., Rallo, L., Eds.; Mundi-Prensa Madrid Spain: Madrid, Spain, 2017; pp. 735–793. [Google Scholar]
- Jiménez-Díaz, R.M.; Cirulli, M.; Bubici, G.; Jiménez-Gasco, L.M.; Antoniou, P.P.; Tjamos, E.C. Verticillium wilt, a major threat to olive production: Current status and future prospects for its management. Plant Dis. 2012, 96, 304–329. [Google Scholar] [CrossRef] [PubMed] [Green Version]
- Ramos, P.; Campos, M.; Ramos, J.M. Long-term study on the evaluation of yield and economic losses caused by Prays oleae Bern. in the olive crop of Granada (southern Spain). Crop Protect. 1998, 17, 645–647. [Google Scholar] [CrossRef]
- Fernandez, B.S.; Hurle, B.J.; Embodas, I.S.; Cerezo, E.M. The Impact Indicator for Priority Pests (I2P2): A Tool for Ranking Pests According to Regulation (EU) 2016/2031; Publications Office of the European Union, European Commission: Brussels, Belgium, 2019; ISBN 978-92-76-08785-4. [Google Scholar] [CrossRef]
- Graniti, A.; Faedda, R.; Cacciola, S.O.; di San Lio, G.M. Olive diseases in a changing ecosystem. In Olive Diseases and Disorders; Schena, L., Agosteo, G.E., Cacciola, S.O., Eds.; Transworld Research Network: Kerala, India, 2011; pp. 403–433. [Google Scholar]
- Ponti, L.; Gutierrez, A.P.; Ruti, P.M.; Dell’Aquila, A. Fine-scale ecological and economic assessment of climate change on olive in the Mediterranean Basin reveals winners and losers. Proc. Natl. Acad. Sci. USA 2014, 111, 5598–5603. [Google Scholar] [CrossRef] [PubMed] [Green Version]
Figure 1.
Signal modulation: (a) unmodulated signal; (b) LoRa-modulated signal.

Figure 2.
Prototype photos: (a) frontal view; (b) back view; (c) bottom view; (d) inner view; (e) central repeater overview; (f) central repeater inside view.
Figure 2.
Prototype photos: (a) frontal view; (b) back view; (c) bottom view; (d) inner view; (e) central repeater overview; (f) central repeater inside view.

Figure 3.
Proposed operating structure.

Figure 4.
Block diagram of the charging system.

Figure 5.
Application for Android platform: (a) application principal view; (b) graph with measured parameters, the day, the moth, the year, the day of the week, and the time of each acquisition.
Figure 5.
Application for Android platform: (a) application principal view; (b) graph with measured parameters, the day, the moth, the year, the day of the week, and the time of each acquisition.

Figure 6.
Placement of the monitoring device in an olive tree.

Figure 7.
Internal and external tree temperature (°C) evolution over time—Experimental test 1.

Figure 8.
Atmospheric and soil humidity (%) evolution over time—Experimental test 1.

Figure 9.
Tree’s surrounding gases concentration [%] evolution over time—Experimental test 1.

Figure 10.
Internal and external tree temperature [°C] evolution over time—Experimental test 2.

Figure 11.
Atmospheric and soil humidity (%) evolution over time—Experimental test 2.

Figure 12.
Orographic conditions of the range test.


Table 1.
Technical specifications of Low Power Wide Area Networks (LPWAN) communication technologies: LoRaWAN, Sigfox and NB-IoT.
Table 1.
Technical specifications of Low Power Wide Area Networks (LPWAN) communication technologies: LoRaWAN, Sigfox and NB-IoT.
| Technology | Range | Channel Bandwidth | Data Transmission Rate | Link Budget | Current Consumption | Radio Frequency Spectrum | Open Source | Coverage | |||
|---|---|---|---|---|---|---|---|---|---|---|---|
| Rural Area (km) | Urban Area (km) | Sending (mA) | Sleep Mode (µA) | ||||||||
| LoRaWAN | 10–15 | 3–5 | 125 kHz, 250 kHz or 500 kHz | 290 bps–50 kbps | 154 db | 44 | 0.1 | ISM | Unlicensed | Yes | 100 countries |
| Sigfox | 30–50 | 3–10 | 100 Hz | 100 bps–600 bps | 151 db | 49 | 0.1 | ISM | Unlicensed | No | 45 countries |
| NB-IoT | 10 | 1 | 200 kHz | ~200 kbps | 150 db | 220 | 3 | LTE | Licensed | Yes | 78 countries |
© 2020 by the authors. Licensee MDPI, Basel, Switzerland. This article is an open access article distributed under the terms and conditions of the Creative Commons Attribution (CC BY) license (http://creativecommons.org/licenses/by/4.0/).
Share and Cite
MDPI and ACS Style
Varandas, L.; Faria, J.; Gaspar, P.D.; Aguiar, M.L. Low-Cost IoT Remote Sensor Mesh for Large-Scale Orchard Monitorization. J. Sens. Actuator Netw. 2020, 9, 44. https://0-doi-org.brum.beds.ac.uk/10.3390/jsan9030044
AMA Style
Varandas L, Faria J, Gaspar PD, Aguiar ML. Low-Cost IoT Remote Sensor Mesh for Large-Scale Orchard Monitorization. Journal of Sensor and Actuator Networks. 2020; 9(3):44. https://0-doi-org.brum.beds.ac.uk/10.3390/jsan9030044
Chicago/Turabian StyleVarandas, Leonor, João Faria, Pedro Dinis Gaspar, and Martim L. Aguiar. 2020. "Low-Cost IoT Remote Sensor Mesh for Large-Scale Orchard Monitorization" Journal of Sensor and Actuator Networks 9, no. 3: 44. https://0-doi-org.brum.beds.ac.uk/10.3390/jsan9030044
Note that from the first issue of 2016, this journal uses article numbers instead of page numbers. See further details here.