
Influence of Digitalisation on Business Success in Austrian Traded Prime Market Companies—A Longitudinal Study

Department of Controlling, Accounting and Financial Management, Faculty of Management, University of Applied Sciences Upper Austria, Wehrgrabengasse 1-3, 4400 Steyr, Austria
Econometrics 2024, 12(1), 4; https://0-doi-org.brum.beds.ac.uk/10.3390/econometrics12010004
Submission received: 17 December 2023
/
Revised: 27 January 2024
/
Accepted: 29 January 2024
/
Published: 9 February 2024
Abstract
:Software investments can significantly contribute to corporate success by optimising productivity, stimulating creativity, elevating customer satisfaction, and equipping organisations with the essential resources to adapt and thrive in a rapidly changing market. This paper examines whether software investments have an impact on the economic success of the companies listed on the Austrian Traded Prime market (ATX companies). A literature review and qualitative content analysis are performed to answer the research questions. For testing hypotheses, a longitudinal study is conducted. Over a ten-year period, the consolidated financial statements of the businesses under review are evaluated. A panel will assist with the data analysis. This study offers notable distinctions from other research that has investigated the correlation between digitalisation and economic success. In contrast to prior studies that relied on surveys to assess the level of digitalisation, this study obtained the required data by conducting a comprehensive examination of the annual reports of all the organisations included in the analysis. The regression analysis of all businesses revealed no correlation between software expenditures and economic success. The regression models were subsequently calculated independently for financial and non-financial companies. The correlation between software investments and economic success in both industries is evident.
1. Introduction
Digital progress is changing markets, business models, value chains and companies worldwide and across industries. Innovative concepts, newly launched start-ups, or established organisations that have been engaged in different industries appear as new challengers to conventional business methods and models. Amazon or eBay have put stationary trade under pressure, Airbnb has developed a digital business model to connect people who have unused and available accommodation with those who need temporary accommodation via digital marketplaces. Along with PayPal and Google with Android Pay, the German Fidor Bank has also entered the market for payment services with new business models and by combining its experience with digital processes and data management with banking services. The advent of new technology has spawned the development of new markets. If companies did not want to be forced out of the market, they were forced to adapt their processes to the new conditions. The literature shows that the current digitalisation process has brought a new quality of human substitution to the current process of digitalisation, since for the first time more complex activities that previously required special cognitive abilities can now be performed by machines (Bardmann 2019; Krause and Pellens 2017; Nagl et al. 2017).
Investment in intangible, knowledge-intensive assets such as research and development, software or licences is a driver of productivity growth in economically advanced countries. The main purpose of this paper is to determine whether software investments resulting from digitalisation efforts in Austrian ATX Prime market firms influence the economic success of the companies under review. The findings of the qualitative content analysis indicate that organisations operating within the finance industry engage in a significant amount of digitalisation initiatives. Consequently, an examination was conducted again to assess the impact of digitalisation on economic performance, with a specific focus on the finance and non-finance sectors.
There is a limited body of research that investigates the relationship between investments in digitalisation and the financial performance of firms. Among the several studies conducted, only a limited number of them specifically concentrate on publicly traded corporations. To ensure the accuracy of statements and computations, it is necessary to engage in comprehensive data collecting, which entails conducting a thorough examination of investments and cost structures. Gathering data and information within the framework of an employee survey conducted at companies may not be feasible, as companies typically do not disclose such information to external entities. In the context of internal corporate analysis, the acquisition of these data can be readily accomplished through financial accounting. In contrast, external analysts are limited to utilising solely the annual report and the company’s official website for their information gathering purposes. The asset overview (from the annual report) can be consulted for updates to purchased software or licences for software. Software created by the business itself is subject to special regulations. Austrian corporations whose shares are officially traded on a stock exchange must prepare their consolidated financial statements in accordance with International Financial Reporting Standards (IFRS). The standard IAS 38.21 requires companies to recognise internally generated intangible assets if the asset satisfies the recognition criterion of future economic benefits and reliable measurement of production costs. This requirement applies to banks and insurance companies as well. If an internally generated intangible asset does not meet these criteria, it is considered research expenditure. Companies must disclose in the notes the amount of research and development costs recognised as expenses during the fiscal year. The consolidated annual reports of the investigated organisations provide information on the research and development expenses associated with software development or digitalisation costs.
Hence, this study presents notable distinctions from prior research endeavours that have investigated the correlation between digitalisation and economic success. This study quantifies the extent of digitalisation by examining the financial investments allocated to digitalisation operations, as documented in the group annual reports of the companies within the study’s framework. The duration of the study spans a decade, during which a longitudinal analysis is conducted using the acquired data.
For a business to advance its digitalisation initiatives, substantial investments are required. On the one hand, these investments are reflected in the company’s assets; on the other, depending on the type of financing, they result in either a decrease in cash and cash equivalents or an increase in borrowed capital if the investments are financed with third-party funds. Third-party financing results in an increase in borrowing costs. To complete the new tasks, many businesses invest in expanding their expertise. New job profiles, such as data scientists, content managers, and web designers, result from the emergence of new task areas. The implementation of new IT solutions incurs ongoing expenses. However, rising costs will only be worthwhile if companies realise sufficient benefits from digitalisation. New digital services or tapping into new customer groups, for instance, are anticipated to generate additional revenue for businesses. On the other hand, the automation of processes brought about by new technologies reduces costs (transaction costs), allowing businesses to increase their profitability and, consequently, their profits. Profit before taxes is used as an indicator of an economy’s health, as this variable reflects the impact of digitalisation on both costs and revenues. This paper aims to determine whether the development of intangible assets attributable to digitalisation initiatives has a positive effect on the economic success of Austrian ATX Prime market firms. The purpose of the literature review is to document and elucidate the existing state of research, establish the theoretical foundation of the work, and formulate the research question. Hypotheses are developed in the Methods section, along with a discussion of the method’s salient features, benefits, and drawbacks. Additionally, a thorough explanation of the study’s method is provided. The empirical section presents and discusses the results obtained from the analysis and verification of hypotheses. The findings are evaluated and reconciled with the current state of research and the findings from the qualitative content analysis, and significant implications for science and practise are obtained throughout the discussion. This chapter also discusses the paper’s limitations. The research question is answered, hypotheses are validated, and future study topics are provided in the conclusion.
2. Literature Research
There are many research contributions about digitalisation but only few studies examine the relationship between digitalisation and business success. Noteworthy in this context is the 2021 study by Truant et al. (2021), which surveys the impact of digitalisation on company performance using a sample of Italian listed companies from a variety of industries. The results indicate that the adoption of digital tools to support daily company operations is still in its infancy, but the effects of digitalisation on company performance are observable. In their study, the authors cited numerous scholars (for example Benner and Ranganathan (2017); Hossnofsky and Junge (2019)) who studied the relationship between stock market valuation and the disclosure of information about digitalisation and concluded that information about digitalisation has a positive effect on the value of a company. Their inference is that digitalisation investments influence a company’s stock market performance. It is expected that listed companies will have a high level of digitalisation initiatives due to the positive correlation between stock market value and digitalisation investments. The authors were, however, unable to confirm this hypothesis. Only 13% of publicly traded Italian firms have fully implemented and utilised digital tools such as business intelligence, analytics, and Big Data, while 53% of the surveyed companies have inadequate implementation; 34% of the sample lacks digital tools and advanced digital tools. The research was conducted from December 2019 to September 2020 (Truant et al. 2021).
In 2021, Broccardo et al. (2023) conducted an additional study on companies listed on the Italian stock exchange. The study focused on analysing the influence of digitalisation on the incorporation of sustainability into corporate strategy and its effect on financial performance. The study revealed a noteworthy association between digitalisation, sustainability, and profitability in publicly traded enterprises in Italy. The study emphasizes the significance of incorporating sustainability into company plans and the possible influence of digitalisation on the execution and effectiveness of sustainability (Broccardo et al. 2023).
Consistent findings are presented in an investigation conducted by Ionaşcu et al. (2022). This research paper examines, within the framework of the European Green Deal, the digital transformation of publicly traded corporations in the European Union. The study’s goal is to investigate the relationship between digitalisation, financial success, and sustainability. The authors used a quantitative examination of annual reports from 2018 to 2020 to generate a digitalisation index for 986 company-year data. The findings indicate a beneficial relationship between digitalisation initiatives and corporate social responsibility, notably in terms of environmental preservation. Furthermore, the research revealed a favorable correlation between digitalisation endeavors and market performance, indicating that investors place a higher value on organizations that have made significant progress in the process of digital transformation. These findings have consequences for EU regulators and the management plans of large European listed corporations.
Salvi et al. (2021) carried out a significant study that aimed to investigate how the data provided by businesses on their websites regarding their level of digitalisation affect the value of the firm. The extent of information on digitalisation was gathered by performing a manual content analysis of company websites. The regression research conducted on a sample of 114 globally operating enterprises revealed a positive correlation between the level of information regarding digitalisation and the value of the company. Control variables, including company size, return on assets, liquidity, research and development intensity, profit growth rate, unlevered beta, and financial leverage, exhibited noteworthy associations with firm value. The findings suggest that the level of digitalisation within a firm has a favourable impact on its value and emphasizes the significance of this information as a signal to investors.
A study by Chen and Srinivasan (2023), which investigates the influence of digitalisation on the value and performance of non-technology enterprises, yields intriguing findings. In order to achieve this objective, the authors devised a text-based metric to gauge digital activity, thereby generating a substantial pool of organizations that are undergoing digitalisation. The findings indicate that non-technology organizations that adopt digitalisation are typically characterized by their size and youthfulness. Furthermore, these companies tend to allocate a greater portion of their resources towards sales and operate within industries that exhibit a higher level of digital activity. Companies that adopted digital technology experienced an increase in their valuations. Specifically, their market-to-book ratios are 8% to 26% higher compared to other companies in the same industry. Nevertheless, the authors discover inconclusive findings when analysing the influence of digital activities on accounting performance metrics. The data indicate that digital activities have a positive impact on company productivity, as seen by improvements in return on assets (ROA) and asset turnover. However, the association between digital activities, profit margins, and revenue growth is either minor or negative. The authors ascribe the limited improvements in the accounting performance of digital operations to the extended durations required for the return on digital investments, competitive pressure, or the market enthusiasm linked to digitalisation. However, the authors did not conduct a further analysis to determine which of these characteristics elucidates their results.
Chinese scholars are particularly interested in the relationship between digitalisation and company financial development. In recent years, there have been a number of publications investigating the impact of the digital transformation on the financial performance of publicly traded corporations. Zeng et al. (2022) study examines the impact of the relationship between corporate digitalisation and financial performance on both business value and the process of value generation. The researchers gathered and empirically examined data from Chinese A-share listed companies spanning the period from 2012 to 2019. The findings indicate that the implementation of digital technology has a substantial favorable impact on the overall performance of a company. Additionally, the experience of the top management team has a beneficial role in enhancing the relationship between digitalisation and financial performance. This finding validates a study conducted by Ren (Ren et al. 2023) in 2023, which indicates a direct relationship between the degree of digitalisation and the level of digital awareness among managers. Additionally, the study reveals that competition within the business strengthens the benefits of digital technology, leading to financial gains. Furthermore, it is worth mentioning that the financial impact of corporate digitalisation varies across different entities. Specifically, the process of digital transformation has a more pronounced effect on the financial performance of State-Owned-Enterprises (SOE). Gao et al. (2023) reach a similar finding and ascribe this to government subsidies.
A research paper authored by Ren et al. (2023) investigates the influence of digitalisation on the performance of all Chinese enterprises that are listed. The authors collected over 40,000 data points on digital investments, including software, computer hardware, platform systems, and others, from the annual reports of corporations spanning from 2009 to 2020. These data are utilized to quantify the level of digitalisation of firms. Similar to the study presented here, the text analysis method is employed to gather the keywords associated with “digitalisation” from the annual reports of Chinese listed firms. This analysis explores the current state and factors influencing the development of digital business applications, as well as the impact of digitalisation on firm performance. The study concludes that investments in digitalisation enhance corporate performance, and there is a positive correlation between the level of digitalisation in organizations and the managers’ digital awareness.
A similar academic study, analysing the influence of digitalisation on the financial performance of Chinese publicly traded firms, draws comparable findings to Ren’s (Ren et al. 2023) research. This analysis utilizes manually collected digital company data spanning from 2012 to 2020. The study develops a metric to measure the level of digitalisation in corporations and concludes that digitalisation enhances corporate performance. The research also examines the possible mechanisms by which digitalisation impacts company performance, including the reduction of external transaction costs and the enhancement of internal control. The study employs a panel analysis to quantify the business performance outcomes that are influenced by corporate digitalisation. Furthermore, the text portion encompasses an examination of the disparity among firms, revealing that SOEs derive greater advantages from digitalisation compared to non-SOEs. This is attributed to the fact that SOEs obtain more financial resources and political backing for their digitalisation endeavours (Gao et al. 2023).
Few researchers have focused their studies on publicly traded companies, and the few studies that have been conducted provide an incomplete picture of the level of digitalisation among these companies due to a lack of empirical evidence demonstrating the effect of digitalisation on firm performance. More research contributions related to digitalisation and impact on economic success are found among small- and medium-sized enterprises (for example, studies conducted by Bouwman et al. (2018); Chesbrough (2006); Etienne Fabian et al. (2023); Giesen et al. (2010)).
Pfister and Lehmann (2022) conducted a systematic literature review to assess the effect of digitalisation on small- and medium-sized enterprises (SME) financial performance. From 2009 to 2019, 124 peer-reviewed journal articles were extracted from databases such as EBSCOhost, Emerald, ResearchGate, and ScienceDirect and analysed. The authors were able to classify 14 verified added values, ranked by number of mentions, as both financial and strategic digital advantages. Efficiency and effectiveness, cost reduction, increased productivity, customer satisfaction, and competitive advantage were the most frequently mentioned outcomes. 2022, Pfister and Lehmann (2023) conducted a qualitative study in small- and medium-sized businesses to investigate how SME managers create added value and achieve a quantifiable return on investment (ROI) using digital technologies. Based on 48 expert interviews, the authors concluded that digital solutions either increased revenue through increased sales and new business models or reduced operating and personnel costs.
In a 2015 study published by Enríquez et al. (2015), structural equation modelling (SEM) was used to analyse data from 200 manufacturing SMEs in the Mexican state of Aguascalientes. The authors concluded that the hypotheses tested suggest that information and communication technology (ICT) has a positive and significant impact on the financial performance, cost reduction, use of technology, and competitiveness of these types of companies. Surveys such as Schwer and Lucas (2022) reveal which company variables are significantly related to strong digitalisation activities and the financial success of the company. For this purpose, the authors performed a correlation analysis on several variables. A survey conducted by the European Investment Bank provided the information for the analysis. Target variables are endogenous variables like “Implementation of Multiple Digital Technologies (IMDT)” and “Financial Business Outcomes (FBO)”. The IMDT variable indicates whether a company has implemented multiple digital technologies and thus provides information about the extent of its digitalisation efforts. Profit, loss, and break-even before taxes comprise the FBO variable. Climate, COVID-19, company profile, innovation and digitalisation, investment activity, and other company variables encompass the exogenous variables. The effect of exogenous variables on the digitalisation activities of a company and the effect of digitalisation-relevant exogenous variables on the success of the company were investigated. The study by Schwer and Lucas (2022) draws the conclusion that digitalisation is seen as a critical success activity and that successful companies have strong planning and leadership skills. These businesses frequently sell their goods and services on a global scale and have a high investment intensity (total investments divided by the number of employees).
Another notable study was undertaken by Fernández-Portillo et al. (2022), which examines the impact of innovation on the association between a company’s digitalisation efforts and its economic and financial performance exclusively for retail enterprises that are headquartered in Spain. The study investigates the causal relationship between these factors. However, it does not include any information regarding whether these companies are publicly listed. The authors reached the conclusion that the enhancement of a company’s performance is not solely contingent upon its digitalisation, but rather, it is imperative for this digitalisation to be harmonised with a well-defined innovation strategy that ultimately results in enhanced commercial performance.
The banking industry is undergoing a digital transformation that is reshaping the way financial products and services are marketed and distributed. This shift might be attributed to the increasing need for digital platforms and the advancement of emerging technology. The digital transformation in the banking industry has been instigated by the advent of new financial technology companies (Valero et al. 2020). FinTechs are a research area in management, digitalisation, and transaction costs. Howell E. Jackson’s study, “The nature of the FinTech Firm”, draws inspiration from Ronald Coase’s seminal work “The nature of the firm” to discuss the rise of financial technology (Jackson 2020). The existing body of scholarly literature pertaining to FinTechs has predominantly concentrated on their business advantages, as researchers have delved into the possibilities and merits associated with their adoption (Jinasena et al. 2020; Ruhland and Wiese 2023). There is a scarcity of research investigating the impact of digitalisation on the financial performance of FinTechs and financial institutions in general.
The literature study demonstrates a growing focus on the financial advantages linked to digitalisation and the underlying mechanisms supporting it. To summarize, digitalisation can yield significant advantages, but it is crucial to conduct research, particularly in quantitative terms, to provide evidence for its effectiveness. The objective of this study is to address a knowledge gap in the existing literature by examining the potential influence of digitalisation investments on the economic performance of Austrian publicly traded enterprises.
3. Materials and Methods, Hypotheses Development
While the number of research works investigating the relationship between investments in digitalisation and organisations’ economic performance remains limited, the existing literature indicates a positive correlation between these two variables. The primary objective of this study is to investigate whether there is a discernible impact of digitalisation on the financial performance of companies listed in the Austrian ATX Prime market. The main objective of this study is to address the subsequent research question:
Do software investments resulting from digitalisation initiatives in Austrian ATX Prime market firms influence the economic success of the company?
The hypotheses are derived from the research question and will be tested in the empirical part of this paper. It is reasonable to posit that the process of digitalisation exerts an influence on the attainment of company success.
H1:
There is a relationship between investments in software and business success in Austrian ATX companies.
Based on the findings obtained from the qualitative content analysis of the group annual reports of all businesses listed on the Austrian ATX Prime Market, it can be inferred that finance companies are significantly allocating substantial resources towards digitalisation. Consequently, the second hypothesis is formulated based on this observation.
H2:
There is a positive relationship between investments in software and business success in companies allocated to the finance sector.
Following the formulation of the hypotheses, the subsequent phase involves elucidating the research methods employed in the empirical investigation.
3.1. Research Design
The methods used in this paper are:
- qualitative content analysis and
- quantitative research methods
3.1.1. Qualitative Content Analysis
To answer the research question, a qualitative content analysis was conducted on the consolidated annual reports of all 20 companies listed in the ATX Prime market over a span of 10 years (2009–2019 or 2020 for companies with a different balance sheet date; the most recent annual report included in the study is from 2020). The analysis was carried out using the Mayring method (Mayring 2019). This is a proven way of empirical social research for the evaluation of written data. The Group annual reports are taken from the respective company websites (Investor Relations). The qualitative content analysis pursues the goal of finding out from the group annual reports which activities are carried out in connection with digitalisation in the individual business years. The qualitative content analysis is supplemented by a quantitative analysis.
3.1.2. Procedure Content Analysis
Over a 10-year period, the consolidated annual financial statements of all ATX Prime market companies are examined for the existence of the words or parts of words “intangible assets” or “other intangible assets” (performed as a text search of the string “intangible”), “research and development costs”; “research costs” (performed as a text search of the string “research”); “development costs”; “digitalisation expenses”, “digitalisation costs” (performed as a text search of the string “digital“), ”software“, “IT”. The procedure is carried out in two steps: First, each occurrence of the term is recorded individually, and the respective text passages are collected in a Word document. Those text passages are then eliminated which obviously did not refer to the company but, for example, to the strategy of customers, competitors, partner companies or authorities.
3.1.3. Quantitative Research Methods
The collected data are appropriate for application of the panel method, and both the fixed effects and the random model are utilised for analysis. A panel data model with fixed effects assumes a deviation from the panel mean for each individual considered, to be determined by regression, whereas this deviation represents a normally distributed random variable in a panel data model with random effects (Hausman 1978). Fixed effects refer to a particular kind of independent variable. In most experimental designs, fixed effects models are employed, in which the factor levels of the independent variable are finite and known, and in which researchers typically manipulate the factor levels to be reasonably distinct to detect a difference in the dependent variable. As an example, consider biological sex (two-level factor). In experimental designs, fixed-effect independent variables differ from random effects. Random factors are independent variables that consist of a pool of potential factor levels that are not manipulated by the researcher, but rather chosen (Schmidheiny and Basel 2011). The Hausman test is used to calculate the correlation between the explanatory (independent) variables and the confounding variable. This test procedure determines whether a panel data model with fixed effects or a panel data model with random effects is present for panel data models. As the number of observations rises, the estimator becomes closer to the true parameter value, as long as the estimators are not biased (). This means that there is no endogeneity. The estimator is consistent and additionally efficient only if (individual effects) and (regressor) are uncorrelated in the random effects model. The Hausman specification test compares the two methods’ regressors. If they differ substantially, the null hypothesis
is rejected and estimation of fixed effects is recommended (Hausman 1978). A common criticism of pure fixed-effect designs, especially those in which the factor levels of the independent variable are determined by the researcher, is that the results are only applicable to comparable levels of the independent variable within the population. In contrast, the results of pure random factor models are presumptively generalizable because the experiment’s factor levels were chosen at random and are therefore representative of the population (Baltagi 2021).
This paper investigates whether software investments affect the success of a company (measured as profit before taxes). However, it is unclear whether this relationship is causal. It is possible that software investments have a positive impact on the company’s cost structure because of altered business processes. This would indicate that costs are a confounding variable for the effect of software investment on a company’s economic success. For this confounding variable, the digitalisation-attributable cost savings pertaining to altered process structures can be calculated. Another potential confounder is the company’s location. Companies with a physical location benefit from nearby parking facilities and, in general, from good accessibility, as it makes it easier for customers to make purchases, which has an impact on the company’s success. Unfortunately, the impact of the company’s location is difficult to quantify. Unmeasured confounding variables lead to biases. This problem can be resolved using the panel data structure. In the current data structure, sales revenues, software investments, expenses, and profit before taxes are collected over a 10-year period. These variables all fluctuate over time. In contrast, other company characteristics, such as location and industry—the unmeasured confounding variables—remain constant across all time periods (see Figure 1).
These time-fixed confounding variables are entity-specific characteristics. Location and industry are immeasurable in terms of their influence, but the company that possesses them remains the same over time. Under the assumption of parallelism (i.e., that the effect of investments in software is identical across firms), dummy variables are now created for each firm and added to a linear model. When estimating the impact of software investments on firm performance, regression determines the impact of software investments while leaving the firm variable unchanged. This is known as a fixed-effect model (see Figure 2).
The fixed effect corresponds to one regression line per company. The lines are parallel, and the slope of the straight line represents the impact of software investments on the company’s success. The fixed effect therefore assumes that the causal effect is constant across all entities, which in this case are the ATX Prime market companies. This is either a weakness or a strength. It is a weakness if the objective is to identify the causal effect for each company. Since the Fixed Effect Model assumes that this effect is constant across entities, no variation in the causal effect is observed. If the objective is to determine the overall impact of software investments on the companies’ economic success, the panel structure of the data is a very useful lever for examining fixed effects (Matheus 2022).
3.2. Description of the Study Design
3.2.1. Sample
The Austrian ATX Prime market forms the basic population of the companies considered. The Austrian Stock Exchange (ATX) is a price index developed by Wiener Boerse AG and calculated in real time (real-time index). It includes twenty of Wiener Boerse AG’s most liquid shares and represents the blue-chip segment of the Austrian stock exchange. Stocks with a large market capitalization have a greater impact on the ATX because the shares are weighted according to their valuation (price of the individual shares multiplied by the number of shares). Included in the prime market segment are equity securities that are admitted to official trading or regulated over-the-counter trading and satisfy special additional requirements, such as increased transparency standards and minimum capitalization. The ATX Prime primarily serves as a benchmark for institutional investors (Börse n.d.). The sector classification of the Vienna Stock Exchange is presented in Table 1.
As seen in Table 2, the aggregation of sectors into industries yields the following result.
3.2.2. Study Period
Over a ten-year period, the aggregated annual reports of the companies traded on the ATX Prime market are examined. The collected data span the years 2010 to 2019, except for three companies (Andritz AG, DO & Co AG, and VOEST Alpine AG) whose fiscal year differs from the calendar year and whose most recent consolidated financial statements are for 2020. The data for BAWAG AG are only accessible as of the balance sheet date of 31 December 2013. In 2016, Immofinanz AG shifted the balance sheet date to the end of its fiscal year (short financial year 1 May to 31 December 2016). This, however, does not affect the subsequent explanations.
3.2.3. Data Collection and Preparation of the Statistical Analysis
The balance sheet information of the examined companies is obtained from the Bloomberg database. This database contains real-time data and historical time series for equities, foreign exchange, commodity, and fixed income markets. In addition, news and research on companies, industries, and markets are provided. An Excel spreadsheet containing data from the Bloomberg database is provided for all companies, organised by year. To conduct a more comprehensive analysis, it is important to obtain data for each organisation over the whole duration of the study. This entails converting the existing data into the appropriate format. Additional data required for the statistical analyses (investments in software, expenses) are collected manually from the individual Group annual reports.
This Microsoft Excel database serves as the foundation for statistical analyses. IBM SPSS version 28 and SAS version 9.4 are used for the statistical analysis. Alpha, the level of significance, is set as 5 percent across the study. All currency units in tables and figures are in EUR, and all value units are in millions of EUR.
3.2.4. Compilation of the Operationalisations
Investments in Software. The operationalisation of ”investments in software” is derived from the statement of changes in non-current assets in the notes to the consolidated financial statements, whereby the term “investments in software” includes the values “additions to software” and “additions to concessions, rights and licences”—insofar as they relate to software or digitalisation activities. Research expenses in connection with digitalisation are also considered. Individual financial statements in Austria must be prepared in accordance with the Austrian Commercial Code (Unternehmensgesetzbuch, UGB). The UGB requires Austrian groups whose shares or debt securities are traded on a regulated stock exchange market to prepare their consolidated financial statements in accordance with international accounting standards, the IFRS (International Financial Reporting Standards). Goodwill, patents and related property rights, utility models, design patents, trademarks, recipes, concessions, licences, brands, print titles, publishing rights, software, customer lists, and equivalent assets are examples of intangible assets. International Accounting Standard (IAS) 38 is the regulation that governs intangible assets in accordance with International Financial Reporting Standards (IFRS). According to IAS 38, an intangible asset is: “[…] an identifiable non-monetary asset without physical substance. An asset is identifiable as an intangible asset when it is separable, or if it arises from a contractual or other legal right, regardless of whether these rights are transferable or separable from the entity or from other rights and obligations. According to IAS 38, all expenditures related to intangible assets must be capitalised if it is probable that future economic benefits associated with the asset will flow to the entity and the cost of the asset can be measured reliably (IAS 38, § 22)”. Intangible expenditure must therefore either be recognised as an expense or capitalised (Sahut et al. 2011).
While section 197 (2) of the Austrian Commercial Code (UGB) bans the capitalization of internally generated intangible assets, the International Financial Reporting Standards contain contradicting requirements. IAS 38.21 mandates that enterprises recognise internally generated assets provided the asset meets the recognition criterion of future economic benefits and reliable measurement of production costs. According to IAS 38.54, research expenditure may not be capitalised as an intangible asset. However, IAS 38.57 authorises a company to capitalise development expenditure as an intangible asset if the following criteria are cumulatively met:
- the intangible asset can be technically realised,
- the entity intends to complete the asset,
- there is an intention to sell or use the intangible asset,
- the entity must demonstrate how the asset will generate economic benefits,
- the entity has access to the necessary technical, financial, and other resources to complete the intangible asset; and
- the entity can reliably measure the intangible asset during its development.
In contrast, self-created brand names, print titles, publishing rights, customer lists (IAS 38.63) and self-created goodwill (IAS 38.48) may not be capitalised. European Union lawmakers adopted an IAS legislation in July 2002. Since 2005, it has been mandatory for European companies traded on a European stock market to compile their consolidated financial statements in conformity with International Financial Reporting Standards. This rule must be followed in banks and insurance firms as well.
Consequently, the consolidated financial statements of all the companies examined are based on the provisions of IFRS. Accordingly, intangible assets include acquired and internally generated assets, provided they meet the recognition criteria.
The required data cannot be obtained from the Bloomberg database; the additions to intangible assets attributable to digitalisation activities must be collected for each company from the notes to the annual consolidated financial statements, and the research expenses attributable to digitalisation must be determined by analysing the annual reports. For this purpose, the terms “research and development costs”; “research costs” (performed as a text search of the string “research”); “development costs”; “digitalisation expenses”, “digitalisation costs” (performed as a text search of the string “digital”) are used as search criteria.
Profit before taxes. The item “profit before taxes” is sourced from the Bloomberg database. Profit before tax is a business indicator and corresponds to the profit generated by a company before deduction of income tax expense. It is a measure that aims to represent the profitability of a business’s operations, excluding any expenditures related to taxes. This metric consequently aids in assessing the financial prosperity of an organization. This is especially crucial for investors, as it enables them to promptly ascertain the profitability of a company. EBITDA provides a more detailed analysis of a company’s operational segments by excluding interest, taxes, depreciation, and amortization from the calculation. While this essential metric offers an accurate perspective on the company’s earnings from its activities, it simultaneously distorts the facts regarding the true profit. Depreciation, amortization, investments and associated financing costs are essential components of an expanding firm and significantly impact the company’s profitability. By excluding these effects from the value, it becomes impossible to make accurate claims regarding the stability of a company (Adiloglu and Vuran 2017; Nissim 2019).
Except for Wienerberger AG, it was possible to derive the necessary information from the consolidated financial statements for all companies.
3.2.5. Exclusion Criteria for Participation in the Study
According to the consolidated annual reports of Wienerberger AG, the company is a market leader in intelligent solutions and services in building materials and infrastructure solutions. Digitalisation is anticipated to result in substantial increases in productivity and cost reductions. In 2018 and 2019, investments in digital transformation are categorised as “Special CapEx”. However, this also involves investments in the development of new products, expansion, and optimisation. Due to the impossibility of deriving investment expenditures relevant to digitalisation from the consolidated annual reports and the impossibility of collecting data for prior years that may be attributed to software or digitalisation, the company is excluded from the analysis.
4. Results
The data set and its characteristics are presented and organised using tables, graphs, and key figures in the first section of this chapter. An exploratory data analysis is then conducted to answer the various questions raised by the data set. Using a panel study, the author answers the research question of whether software investments attributable to digitalisation activities have an impact on the economic success of ATX Prime market companies.
4.1. Descriptive Values for All Companies over Time
4.1.1. Development of Investments in Software (Internally Developed, Purchased Software and Expenses Attributable to Digitalisation)
As presented in Table 3, the median, minimum, maximum as well as upper and lower quartiles of investments in software are calculated for each company in the sample over the entire observation period.
Summarized by sectors (see Table 1), the results are as follows: The calculations reveal that only a minority of ATX Prime-listed companies are making significant investments in digitalisation (see Table 4)1. Two of the sample’s three banks (finance industry) have the highest values, with EUR 290 million (Erste Bank Group AG) and EUR 226 million, respectively, (Raiffeisen International). In contrast, real estate companies, which, like banks, are part of the finance sector, have the lowest investment levels. The minimum investments made by these three companies (CA Immobilien Anlagen AG, Immofinanz AG, and S Immo AG) during the period under review range from EUR 0 (Immofinanz AG) to EUR 0.2 million (CA Immobilien Anlagen AG), while the maximum investment is only EUR 3.8 million (Immofinanz AG). The median ranges between EUR 0.1 million (S Immo AG) and EUR 1 million (Immofinanz AG). For companies classified as basic industry (see Table 1); Lenzing AG, OMV, Voest Alpine AG, Schöller-Bleckmann Oilfield Equipment AG), the median ranges between EUR 0.3 million (Schöller-Bleckmann Oilfield Equipment AG) and EUR 90.5 million (OMV). In the consolidated annual reports of the companies assigned to basic industry, there are only significant references to digitalisation activities from the 2016 fiscal years onwards.
Andritz AG, Mayr-Melnhof Karton AG and Österreichische Post AG are assigned to the “Industrial Goods and Services” sector. The median ranges between EUR 3.1 million (Mayr-Melnhof Karton AG) and EUR 6.6 million (Österreichische Post AG). Since 2016, Andritz AG has reported on its digitalisation activities in its Group Annual Reports. Digitalisation activities include innovative Industry 4.0 products, which entail the optimization of plants and processes through sensor technology, sophisticated and highly complex data analysis, and augmented reality, as well as “Smart Services”, which allow customers to place online orders for spare parts more efficiently. Mayr-Melnhof Karton AG’s primary application of digitalisation is in human resources. Since 2018, a web-based platform has enabled digital business process planning. Österreichische Post AG reports very extensively on its digitalisation efforts but invests less than one percent of its annual revenue in digitalisation.
The maximum investment for companies in the Technology and Telecommunications sector (AT&S AG and Telekom Austria Group) exceeds EUR 100 million in each case. Telekom Austria Group places a particular emphasis on digitalisation, which is also a result of its business model. The median of investments in software at the consumer goods company DO & CO AG is EUR 0.7 million. Digitalisation does not play a significant role in this organisation. The business model includes gourmet kitchen operations and airline catering. Ordering procedures and some administrative tasks can be managed digitally, but meal preparation and delivery cannot.
At Verbund AG (utilities sector), the median investment in software is EUR 25 million. The investment ratio (investments in software related to sales revenues) ranges from 0.43 percent in 2013 (minimum) to 1.2 percent (maximum) in 2017 (see Table 4). The company’s digitalisation efforts are concentrated on workforce management. Figure 3 presents a summary of the median, lower and upper quartile of software investments across all companies included in the study. It also shows any extreme values (outliers) and the range of investments over the time being analyzed.
The analysis of investments in software reveals notable differences in the median between the various companies. Considering the median over the years for all companies, the highest value was in 2014 (EUR 29.6 million), and the lowest was in 2010 (EUR 5 million).
4.1.2. Profit before Taxes
Over the entire observation period, the median, minimum, and maximum as well as upper and lower quartiles of the profit before taxes are calculated for each company in the sample (see Table 5).
The median profit before taxes for all companies listed on the ATX Prime market ranges from approximately EUR 200 million in 2013 to just below EUR 500 million in 2015 (as seen in Figure 4). OMV, Erste Group Bank AG, and Raiffeisen Bank International AG are the corporations with the highest profits before taxes. The median value of this variable for OMV is approximately EUR 2.7 billion. The company reported the lowest profit before taxes of approximately EUR 1.1 billion for the 2015 fiscal year, and the highest profit before taxes for the 2019 fiscal year (EUR 3.7 billion). At Erste Group Bank AG, the median profit before taxes is approximately EUR 1.7 billion, with the highest reported value in fiscal 2018 (approximately EUR 2.7 billion) and the lowest in 2013 (around EUR 810 million). Like Erste Group Bank AG, Raiffeisen International AG reported the highest profit before taxes in fiscal year 2018 (approximately EUR 1.9 billion) but the lowest profit before taxes in fiscal year 2014 (approximately EUR 300 million). The median is EUR 1.2 billion. Immofinanz AG reports inconsistent results. The company reported losses for the fiscal years 2011, 2012, and from 2014 to 2016, with the highest losses occurring in 2014 and 2015. The greatest profit before taxes (approx. EUR 240 million) was generated in 2010. In addition to Immofinanz AG, AT&S AG lost approximately EUR 11 million in the 2016 fiscal year, CA Immobilien Anlagen AG reported a loss of EUR 402 million in 2019, Schöller-Bleckmann lost EUR 48 million in 2016, Uniqa Insurance Group AG lost EUR 305 million in the 2011 fiscal year, and Voestalpine AG reported a loss of EUR 237 million in the 2019/20 fiscal year.
4.1.3. Variable Analysis by Finance and Non-Finance Industry
The analysis of annual reports from business groups and subsequent calculations of descriptive data clearly indicate that a significant proportion of digitalisation activities are carried out by firms in the financial sector. Hence, a thorough analysis of the two factors, specifically software investments and pre-tax profits, is conducted for companies categorized as part of the financial industry and for all other businesses.
- Presentation of investments in software, broken down into companies that can be allocated to the finance industry and all other companies (with and without OMV’s investments in software).
The median investment in software by financial industry companies was lowest in 2013 at EUR 13.6 million and highest in 2019 at EUR 69 million (as seen in Figure 5). In contrast, the median of companies that cannot be assigned to the financial industry ranges from EUR 3.2 million in 2010 to EUR 16.4 million in 2019, with both values representing the minimum and maximum, respectively. Figure 6 and Figure 7 depict the software investments of non-financial sector companies, once with (Figure 6) and once without OMV (Figure 7). Table 6 presents a comprehensive summary of the minimum, maximum, and median of investments in software and profit before taxes for each company, categorized into finance and non-finance companies, for the full period being examined.
As described in the analysis of software investments, companies in the financial sector invest significantly more in digitalisation than all other companies, although there are distinct differences between banks, insurance companies, and real estate firms. Digitalisation arrived in the real estate industry to a very limited degree; however, experts agree that in the coming years, digitalisation will significantly transform the real estate industry.
Moring et al. (2018) describe in their book “Bits and Bricks: Digitalisierung von Geschäftsmodellen in der Immobilienbranche” (“Bits and Bricks: Digitalisation of Business Models in the Real Estate Industry; note of the author)”, the potential effects of digitalisation on the business models of construction companies, real estate agents, and project developers in the real estate industry. As a result of the digitalisation of the building industry, the value chain has undergone modifications. The authors present a software-based method (Building Information Modeling) for optimising the planning, execution, and management of buildings, while noting that this is merely one of the future digital fields of activity in the construction industry.
The bar graph in Figure 8 illustrates a comparison between the mean values of companies operating in the financial sector and those operating outside the financial sector. The horizontal line represents the proportion of total investments allocated to software, with a further division into financial sector and non-financial sector companies.
- Presentation of profit before taxes, broken down into companies that can be allocated to the finance industry and all other companies (with and without OMV’s profit before taxes).
The boxplots for the variable "Profit before tax" are shown separately for companies that are not allocated to the financial sector (with and without OMV, see Figure 9 and Figure 10) and for those in the financial sector (see Figure 11).
The median profit before taxes for all non-finance companies ranges from approximately EUR 200 million in 2013 to approximately EUR 400 million in 2017, with OMV showing the highest profit before taxes for the period 2019 (EUR 3.7 billion). If OMV is excluded from the analysis, Voestalpine AG has the highest profit before taxes in 2017 of all companies (EUR 960 million; see Figure 10). In contrast to the Finance companies, where different companies report losses in different years (and sometimes in multiple years), only AT&S AG and Schoeller-Bleckmann each reported a negative result in the 2016 fiscal year and Voestalpine AG in 2019.
Examining the median profits before taxes of companies that cannot be assigned to the financial sector and excluding the outlier OMV reveals a very mixed picture. The lowest median, at around EUR 100 million, is in 2013, the highest in 2017 (around EUR 260 million). In contrast, Voestalpine AG, an outlier in the boxplot with a profit before taxes of nearly EUR 1 billion in the 2017 fiscal year, shows a loss of approximately EUR 240 million in the 2019 fiscal year (see Figure 10).
The maximum value of profits before taxes across all finance companies is in 2018 (Erste Bank Group AG, EUR 2.7 billion). CA Immobilien Anlagen AG generates the largest loss among finance companies in fiscal year 2019 (EUR 400 million). The median fluctuates between just over EUR 0 million (2011) and approximately EUR 500 million (2015).
The results of the qualitative content analysis indicate that digitalisation is a high priority for the companies surveyed (except for the real estate companies and the company in the consumer goods industry) and that many digitalisation-related activities are performed. The analyses of the balance sheets and income statements of the group’s annual reports indicate that banks invest above-average amounts in digitalisation (see Table 4). If the mean values for companies that are not assigned to the financial industry are calculated, these companies also exhibit a slight increase in investments related to digitalisation, although this remains significantly lower than the financial sector.
4.2. Exploratory Statistics
A total of four models are evaluated to determine the relationship between software investments and the economic success of a company. Additional effects (time constant, study object-specific components) that are either uncorrelated with the independent variables (random effects) or can be correlated with the independent variables (fixed effects) are considered.
- Panel data regression analysis with a fixed effect (Fixed One-Way model)
- Panel data regression analysis with two fixed effects (Fixed Two-Way model)
- Analysis of panel data using a single random effect (Random One model)
- Regression analysis with two random effects for panel data (Random Two model)
In one-way models, companies are evaluated based on their characteristics (location, industry, number of employees, legal system, etc.). These characteristics represent fixed effects (which are included in the model via a dummy variable for each company) or random effects, given that the companies in question are all listed on the Austrian ATX Prime market, have their headquarters in Austria (and are therefore subject to the same legal framework), operate in the same industry, and have a relatively constant number of employees. In the two-way models, time (10 years) is also accounted for as a fixed (a dummy variable represents each investigated year) or variable effect. The fact that all of the companies under investigation are based in Austria and consequently experience all changes over time (economic cycle, tax changes, legal changes, inflation, etc.) justifies this.
To ascertain the most suitable model among the four options, a comparative analysis is conducted on the various models using a range of pertinent metrics.
- The F-test is used to determine whether the model contains fixed effects (H0: there are no fixed effects)2.
- The Hausman test determines the existence of random effects (H0: there are random effects).
- R2 indicates how well the chosen model can explain the variability of the dependent variable using the independent variables (R2 multiplied by 100 equals the percentage of variability explained). The coefficient of determination (R2) is a precise measure of the accuracy of the linear regression prediction and ranges from 0 to 1. A linear regression that is closer to 1 indicates a stronger agreement with the gathered data.
- The t-test for the individual beta coefficients determines whether the model’s independent variables have a significant impact on the dependent variable (H0: beta coefficient = 0). The significance of the effect is assessed by the utilization of a t-test. A value less than 0.05 is considered significant. A higher t-value indicates stronger evidence against the null hypothesis. Consequently, there is more compelling evidence to support a significant disparity. As t approaches 0, the probability of there being no significant difference increases.
Results of the combined regression analysis of all companies:
- 1.
- Fixed One-Way model:F-Test for no fixed effects: p < 0.0001R² = 0.8157Investments in Software: p = 0.9589
In this instance, no significant influence on software investment can be demonstrated, but the model has a high explanatory value due to the fixed effect of the firms. This model accounts for 81.57% of the overall variability.
- 2.
- Fixed Two-Way model:F-Test for no fixed effects: p < 0.0001R² = 0.8387Investments in Software: p = 0.8035
The value of R2 increases to 0.8387 if time is included in the analysis as a fixed effect in addition to the company’s characteristics. The inclusion of time provides a further explanation for the variability. However, like the fixed one-way model, there is no significant correlation between software investments and the company’s economic success.
- 3.
- Random One model:Hausman test for random effects: p = 0.0089R² = 0.007Investments in Software: p = 0.2541
Contrary to fixed effects models, random effects models account for unobserved individual effects as random effects. The Hausman test is used to determine the presence of random effects. The result indicates that a fixed effects model would be preferable. Again, no significant correlation can be established between software investments and the company’s economic success.
- 4.
- Random Two model:Hausman-Test for random effects: p = 0.0082R² = 0.0047Investments in Software: p = 0.3535
As anticipated based on the outcomes of the random one model, the random two model is also inappropriate for modelling the panel data.
Results of a regression analysis performed on all companies:
Compared to the Random models, it is evident that the Fixed Effect models are more appropriate for modelling the study data.
The model that yields the best outcomes is the Fixed Two-Way model, which has a high explanatory value with the company (and all its characteristics) and time influences, but a significant relationship between software investments and the economic success of the company cannot be demonstrated (see Table 7).
4.3. Division of Companies into Finance and Non-Finance Industry
The findings of the qualitative content analysis indicate that companies operating in the finance sector prioritise digitalisation and consequently allocate substantial resources towards it. Hence, the regression models are recalculated, with a distinction made between organisations that belong to the finance industry and those in the non-financial industry.
For the finance companies, a different picture now emerges for the models: The results of the Hausman test indicate that models with random effects are more appropriate for finance companies; the random two model has the greatest explanatory power. All models demonstrate a significant correlation between software investments and the economic success of a company (see Table 8 and Table 9).
The circumstances vary throughout the companies, which are categorised as non-finance industry: the fixed two-way model best explains the variability of company success, and investments in software have a significant impact as well (as seen in Table 10).
Hence, when all businesses are considered, it is impossible to establish a significant relationship between the two variables software investment and profit before taxes. If the companies are separated into finance and non-finance companies, a significant correlation can be demonstrated between investments in software and economic success in both groups (see Table 11).
4.4. Consideration of the Delayed Economic Impact of Software Investments
Because it is not unusual for software investments to begin only having an effect the following year, this is also investigated. For this purpose, an additional variable—Last Year Investment in Software—is created, and the regression analysis is performed separately for finance and non-finance companies, with the best model in each case, yielding the following results (see Table 12).
A significant influence of the prior year’s investments on the current profit before tax can be demonstrated only for those companies that cannot be assigned to the finance industry, but not for those that can be assigned to the finance industry.
Deng and Zhao (2022) examined the time-lagged effect of investments on firm value using panel VAR (vector autoregressiv) models with data from 622 Chinese firms listed between 2011 and 2019 on the Shanghai and Shenzhen stock exchanges. Since profit is a determinant of a company’s value, the study can be utilised for comparison purposes. The results indicate that investment has a one-period lag effect. These findings are consistent with those of the present study, although it should be noted that Deng and Zhao (2022) analysed companies with financing constraints (see Table 13 and Table 14).
5. Discussion
Using a panel analysis, it was determined whether there is a correlation between investments in software and the economic success of the company, as measured by profit before tax. A regression analysis carried out for all companies brought the result that a significant relationship between software investments and the economic success of the company cannot be proven.
Given the findings derived from the qualitative content analysis, it was seen that digitalisation holds particular importance among organisation’s falling under the financial industry category. Consequently, different regression models were computed for companies operating within the financial industry and those outside of it. Therefore, it is unfeasible to ascertain a significant correlation between investments in software and pre-tax profits when considering all enterprises. A noteworthy correlation may be established between software investments and economic success in both finance and non-finance enterprises, when these organisations are categorised accordingly. The results demonstrate that digitalisation holds different status across sectors and that the effects of digitalisation measures vary by sector. There are industry-specific studies on the effects of digitalisation in the academic literature. In the financial industry, FinTechs have primarily piqued the interest of researchers. There is scant research on the correlation between digitalisation and business success. The conclusion of the study by Truant et al. (2021), which examined the effects of digitalisation on the economic success of Italian listed companies, is that digitalisation is still in its infancy, but its effects on economic success are becoming apparent. In accordance with the findings of Droste et al. (2022) study, 64 percent of Austrian companies in 2022 are still in the early stages of digital transformation, as demonstrated by these findings. Another noteworthy outcome of this investigation is that higher-than-average investments in digitalisation exhibit a positive correlation with increased returns. Organisations that allocate more than three percent of their yearly net sales towards industrial transformation are 2.5 times more inclined to obtain higher returns compared to those who invest less than two percent. The calculation of return on sales (profit before taxes in relation to revenues) reveals that only companies in the financial sector achieve the highest returns (see Table 15). All these businesses exhibit a significant correlation between software investments and returns. Three of these corporations (BAWAG AG, Erste Group Bank AG, and Raiffeisen International AG) have annual investment rates exceeding 2% (Raiffeisen International over the entire period under review, BAWAG in 2014 and 2016 to 2019; Erste Group Bank AG consistently from 2013). Insurance companies, which are also part of the financial sector, have the lowest returns. A generalisation of the results with those of the study is only possible to a limited extent, as the study does not include any companies in the financial industry. The calculations allow the author to draw the conclusion that software investments have a positive effect on sales revenues and, consequently, profits, particularly for businesses in the financial sector.
Despite structural variations, the studies incorporated in the literature review share the common objective of examining the impact of digitalisation on corporate value and economic success. Truant et al. (2021) conducted a study that investigates the impact of digitalisation on the operational outcomes of publicly traded companies in Italy. Although the results suggest that the use of digital tools to support day-to-day business operations is still in its infancy, the effect on the performance of the organization is already evident. The authors highlight the favourable impacts that investments in digitalisation have on the market value of a company. As part of the European Green Deal, Ionaşcu et al. (2022) examine the digital transformation of publicly traded companies in the European Union. A positive correlation exists between digitalisation initiatives, economic achievement, and social responsibility, according to the findings. The study conducted by Chen and Srinivasan (2023) investigates the effects of digitalisation on the performance and value of non-technology firms. The findings indicate that organizations that embrace digitalisation experience an increase in market-to-book ratios. Additionally, gain in asset turnover and return on assets (ROA) is observed, whereas profit margins and sales growth exhibit negligible or negative correlations with digital initiatives. The extended amortisation periods associated with digital investments, competitive pressures, and potential market euphoria account for this.
There is an increasing scholarly focus in Chinese research on the correlation between digitalisation and the financial growth of corporations. Empirical evidence supports the notion that the integration of digital technologies substantially enhances the overall performance of an organization (Gao et al. 2023; Ren et al. 2023; Zeng et al. 2022).
A study conducted by Salvi et al. (2021) demonstrates that the disclosure of digitalisation efforts by enterprises affects projected cash flows and decreases the cost of equity due to the reduced perceived risk by investors. The study also offers theoretical and managerial insights and recommends that managers utilize corporate websites to communicate strategies, procedures, and outcomes associated with digitalisation in order to enhance shareholder value. This paper’s content analysis reveals that banks allocate a substantial portion of their annual reports to discussing digitalisation. Furthermore, there exists a noteworthy positive correlation between investments in digitalisation and the success of these institutions.
The financial performance of small- and medium-sized enterprises (SMEs) can be significantly impacted by digitalisation, according to various research works (Enríquez et al. 2015; Pfister and Lehmann 2022, 2023; Schwer and Lucas 2022). Enhanced efficiency, decreased expenses, heightened productivity, and a competitive edge are among the advantages emphasized in these studies.
In general, the literature underscores the wide range of results obtained from multiple studies concerning the effects of digitalisation on business performance across various sectors and contexts.
Similarly, it was determined whether investments in software have a delayed impact on economic success. Only non-financial sector companies exhibit a significant impact of previous year’s investments on their current profit before taxes. The fact that investments in software have a delayed effect on economic success in non-financial sector companies can be attributed to a variety of factors. The customers in the non-financial sector, with three exceptions (Telekom Austria AG, Österreichische Post AG, and Verbund AG), are business customers and not end consumers. Even the three exceptions operate in both the Business-to-Business (B2B) and Business-to-Customer (B2C) industries. The question arises as to whether businesses and consumers react differently to digitalisation initiatives. The financial sector, and banks and insurance companies in particular, have digitalised their business models. Customers, whether B2B or B2C, are utilising the opportunities to conduct most of their banking transactions online. The same holds true for insurance companies. Claim processing is performed digitally. Non-financial companies cannot conduct business online with customers to the same extent, or they do not offer this option to their customers. Using AI, manufacturing companies can make data-driven decisions in milliseconds; these decisions are communicated to customers in the form of improved products, more efficient production methods, and optimised process flows with a time lag. Moreover, this delay also influences economic success. Roland Berger GmbH (Lässig et al. 2015), a management consulting firm, conducted a study on the digitalisation of sales among nearly 3000 sales managers in B2B manufacturing companies in Germany and the United States and concluded that many businesses are not maximising their potential. B2B commerce is undergoing rapid transformation because of digitalisation, whereas sales departments are undergoing negligible transformation. According to the study, nearly half of purchasing managers in Germany and the United States are under the age of 35. The Internet plays a central role in the information, communication, and relationship behaviours of these so-called “digital natives”. They are accustomed to purchasing consumer goods easily online and transfer those experiences to B2B transactions, resulting in a significant digitalisation of the purchasing process. In total, 57 percent of the decision-making process is completed by the time first contact is made with the seller, according to the study. Numerous B2B companies that have not yet adapted to the needs of this new generation of purchasing decision-makers risk long-term inability to compete. More than half of the businesses surveyed are aware that a digital sales channel will be crucial to their future business success, but only 42 percent are pursuing a strategy to expand their digital activities. Approximately 33% of the firms under consideration do not provide the option of online ordering for their products.
The objective of the study was to investigate the impact of software investments on companies listed on the ATX Prime market in Austria. This research question has been posed:
Do software investments resulting from digitalisation initiatives in Austrian ATX Prime market firms influence the economic success of the company?
From the research question, the following hypotheses were generated:
H1:
There is a relationship between investments in software and business success.
To respond to the research question, a panel analysis was conducted to ascertain whether there is a correlation between software investments and a company’s financial success. A regression analysis of all companies revealed no significant correlation between software expenditures and economic success.
H2:
There is a positive relationship between investments in software and business success in companies allocated to the finance sector.
The regression models were computed individually for financial and non-financial firms due to the findings of the qualitative content analysis and the results from the descriptive statistics, which indicated that digitalisation holds particular significance within the financial sector. When the calculations are performed separately for the finance and non-finance industries, it becomes evident that software investments correlate with economic success in both the finance and non-finance industry.
It was also investigated whether software investments could have a time-delayed effect on economic success. A correlation could only be demonstrated for companies that are not classified as financial. Statistical analysis indicates that, when all companies are considered together, it is not possible to confirm Hypothesis 1 (H1), which states that there is a correlation between software investments and economic success. When categorising companies by their affiliation with the financial industry, a correlation can be observed. This result is applicable to organisations operating outside the purview of the financial sector as well. Based on the available evidence, it may be concluded that Hypothesis 2 (H2) is confirmed.
6. Implications for Science and Practice
The literature presents facts that support the significance and value of investments in digitalisation for the future market performance of firms. These findings are further substantiated by the results of statistical computations. However, the freedom of most companies to decide whether to invest in digitalisation is very limited if they do not want to be squeezed out of the market. Based on quantitative and qualitative analyses, the impact of software investments on companies’ economic success was demonstrated. Further endeavours can be undertaken to explore the underlying factors and associations to gain a deeper understanding of the implications of these findings, given that the allocation of resources towards software development exerts influence on both the financial gains and expenditure patterns of organisations. The process of digitalisation has the potential to facilitate the expansion of firms’ customer base without incurring commensurate cost increases, hence resulting in economies of scale. The utilisation of data-driven decision-making methodologies enables organisations to make decisions based on empirical evidence, hence improving the level of information available for decision-making processes. This approach has the potential to result in cost reductions and improved revenue generation for enterprises. The process of digitalisation empowers organisations to provide customised products and services, resulting in potentially enhancing consumer satisfaction. However, this may also result in elevated expenses. The utilisation of digital technologies can boost innovation and foster the creation of novel products and services. Nonetheless, it is important to acknowledge that this process may incur supplementary expenses related to research and development.
Particularly for practitioners, an analysis of the effects of digitalisation on cost structure can yield invaluable insights as the cost structure is impacted in numerous ways by digitalisation. The process of digitalisation empowers organisations to automate operations that are repetitive and manual in nature, hence diminishing the necessity for human involvement and the accompanying expenses related to wages. The utilisation of digital tools has the potential to optimise procedures and eradicate obstacles and inefficiencies. The implementation of digital technology frequently necessitates substantial initial expenditures on software, hardware, training, and integration. Continuous maintenance, regular updates, and periodic upgrades are necessary for the optimal functioning of digital systems. With the escalating prevalence of digitalisation, it has become imperative for firms to allocate resources towards the implementation of comprehensive cybersecurity measures to safeguard their digital assets. Organisations may find it necessary to recruit or provide training for employees who possess digital competencies. When creating a budget, it is necessary to consider not only the phases of the technical category, but also the costs associated with administrative duties. The entire customer journey encompasses the procedure beginning with the selection of the provider and concluding with the modification of processes following successful implementation. This calls for a project management structure. Digitalisation can result in significant cost savings, which can be realised both directly in the form of monetary cost reductions and indirectly via a reduction in transaction costs. For this total cost consideration, the Total Cost of Ownership (TCO) method is recommended.
7. Limitations and Future Research
This paper sought to be exhaustive in its analysis and represents a new effort to comprehend the connection between software investments and economic performance; however, it is not without limitations, primarily due to the small sample size. The data set contains only companies listed on the Austrian ATX Prime market, the vast majority of which are large companies in a developed economy; thus, the results cannot be generalised to all companies worldwide. The scope of this study can be broadened to encompass all companies listed on the ATX or to include all listed companies in general, as the necessary data for the study are readily accessible. Nevertheless, the benefits of having access to data are counterbalanced by the substantial amount of labour that is necessary for conducting the study. Since this study concludes that there are significant differences in terms of intensity and impact of digitalisation measures between companies in the finance industry and those that cannot be assigned to the finance industry, it is prudent to conduct a sector-specific investigation (in line with the classification of the Vienna Stock Exchange). This could lead to additional interesting discoveries. The variable “Investments in software” presents an additional limitation. This item was extracted from the notes to the consolidated financial statements (software and related licences and rights as well as expenses related to digitalisation) and used as a measure of digitalisation. This item can also encompass non-digitalisation-related issues, such as software updates for a spreadsheet application or payroll software. The investigation into whether software investments have a time-delayed effect on the economic success revealed that only companies unaffiliated with the finance industry could be evaluated for a delayed effect on economic success. The results from the research confirm that investments have a delayed effect, although researchers come to different conclusions regarding the duration. In this paper, only a single year was examined. If a multi-year period is considered, it may be possible to demonstrate a correlation between software investments and economic success for more companies. An additional element worthy of scholarly inquiry pertains to the correlation between the level of digitalisation implemented by organizations and the level of digital awareness of managers.
Drawing from the findings of Chinese studies, state financial aid for implementing digitalisation measures was found to have a positive impact on the economic success of supported companies. Therefore, conducting a study on the influence of state-implemented digitalisation measures on the economic success of companies in Austria and other European countries could yield interesting findings. While Chinese corporations predominantly operate as state-owned enterprises (SOEs) under the authority of the national or local government, European companies typically function as privately held entities. However, it is worth noting that all European countries have implemented government action plans to facilitate digitalisation.
The convergence of digitalisation and sustainability presents multiple research opportunities that can be examined at various levels.
Funding
This research received no external funding.
Data Availability Statement
Publicly available datasets were analyzed in this study. These data can be found here: https://www.wienerborse.at/ (accessed on 15 October 2020).
Conflicts of Interest
The author declares no conflicts of interest.
Abbreviations
The following abbreviations are used in this manuscript:
| AG | Aktiengesellschaft (publicly limited company) |
| ATX | Austrian Traded Index |
| IFRS | International Financial Reporting Standards |
| UGB | Unternehmensgesetzbuch |
| SME | Small- and medium-sized enterprises |
| ICT | Information and communication technology |
| SEM | Structural equation modelling |
| IMDT | Implementation of Multiple Digital Technologies |
| FBO | Financial Business Outcomes |
| ROI | Return on Investment |
| ROA | Return on Assets |
| SOE | State-owned enterprises |
| IAS | International Accounting Standard |
| TCO | Total Cost of Ownership |
| 1 | The findings of a study conducted by Droste et al. (2022) on Austrian companies indicate that companies allocating more than three percent of their annual revenue towards digital transformation are 2.5 times more likely to attain a higher return on investment compared to companies investing less than two percent. Table 4 highlights organisations that allocate above 2% of their yearly revenue towards digitalisation by marking them in red. |
| 2 | The F-test is employed to examine fixed effects in panel data models, specifically for fixed-effects models. The purpose of this test is to evaluate the null hypothesis that the constant terms of all individuals are the same, meaning that there are no individual effects. The F-value is computed by dividing the variance of the predicted values by the variance of the residuals. A high F-value implies that the predicted values have a larger spread than the residuals, suggesting that independent variables have a substantial impact on the dependent variable. The determination of the significance of the F-value relies on the F-distribution. If the p-value obtained from the F-test is lower than the predetermined significance level (0.05 for this study), we reject the null hypothesis and conclude that at least one regression coefficient is substantially different from zero. |
References
- Adiloglu, Burcu, and Bengu Vuran. 2017. The importance of ebit-ebitda disclosure in annual reports: A comparison from turkey. International Journal of Social Sciences and Education Research 3: 397–405. [Google Scholar] [CrossRef]
- Baltagi, Badi H. 2021. Test of hypotheses with panel data. In Econometric Analysis of Panel Data. Cham: Springer, pp. 75–108. [Google Scholar]
- Bardmann, Manfred. 2019. Wissenschaftskonzepte, methoden und modelle der betriebswirtschaftslehre. In Grundlagen der Allgemeinen Betriebswirtschaftslehre: Geschichte–Konzepte–Digitalisierung. Wiesbaden: Springer Gabler, pp. 123–52. [Google Scholar]
- Benner, Mary J., and Ram Ranganathan. 2017. Measuring up? persistence and change in analysts’ evaluative schemas following technological change. Organization Science 28: 760–80. [Google Scholar] [CrossRef]
- Bouwman, Harry, Shahrokh Nikou, Francisco J Molina-Castillo, and Mark de Reuver. 2018. The impact of digitalization on business models. Digital Policy, Regulation and Governance 20: 105–24. [Google Scholar] [CrossRef]
- Broccardo, Laura, Elisa Truant, and Léo-Paul Dana. 2023. The interlink between digitalization, sustainability, and performance: An italian context. Journal of Business Research 158: 113621. [Google Scholar] [CrossRef]
- Börse, Wiener. n.d. Das Unternehmen Wiener Börse ag. Available online: https://www.wienerborse (accessed on 7 January 2020).
- Chen, Wilbur, and Suraj Srinivasan. 2023. Going digital: Implications for firm value and performance. Review of Accounting Studies 28: 1–47. [Google Scholar] [CrossRef]
- Chesbrough, Henry. 2006. Open Business Models: How to Thrive in the New Innovation Landscape. Boston: Harvard Business Press. [Google Scholar]
- Deng, Liurui, and Yiwen Zhao. 2022. Investment lag, financially constraints and company value—Evidence from china. Emerging Markets Finance and Trade 58: 3034–47. [Google Scholar] [CrossRef]
- Droste, Niklas, Ugur Dayan, Riegler Tony, Schuster Christian, Jan Schäfer, and Leila Fathallah. 2022. Digital Factory Transformation Survey 2022. Available online: https://www.pwc.de/de/content/0f96ea9c-992c-4ba7-8c4db4637cf81d9f/pwc-digital-factory-transformation-survey-2022.pdf.PricewaterhouseCoopersGmbHWirtschaftsprÃijfungsgesellschaft (accessed on 7 January 2023).
- Enríquez, Luis Aguilera, Héctor Cuevas-Vargas, and Martha González Adame. 2015. The impact of information and communication technologies on the competitiveness: Evidence of manufacturing smes in aguascalientes, mexico. International Review of Management and Business Research 4: 758. [Google Scholar]
- Etienne Fabian, Nicolai, John Qi Dong, Thijs Broekhuizen, and Peter C Verhoef. 2023. Business value of sme digitalisation: When does it pay off more? European Journal of Information Systems 2023: 1–20. [Google Scholar] [CrossRef]
- Fernández-Portillo, Antonio, Manuel Almodóvar-González, Mari Cruz Sánchez-Escobedo, and José Luis Coca-Pérez. 2022. The role of innovation in the relationship between digitalisation and economic and financial performance. A company-level research. European Research on Management and Business Economics 28: 100190. [Google Scholar] [CrossRef]
- Gao, Da, Zhiliang Yan, Xiaotian Zhou, and Xinlin Mo. 2023. Smarter and prosperous: Digital transformation and enterprise performance. Systems 11: 329. [Google Scholar] [CrossRef]
- Giesen, Edward, Eric Riddleberger, Richard Christner, and Ragna Bell. 2010. When and how to innovate your business model. Strategy & Leadership 38: 17–26. [Google Scholar]
- Hausman, Jerry A. 1978. Specification tests in econometrics. Econometrica: Journal of the Econometric Society 46: 1251–71. [Google Scholar] [CrossRef]
- Hossnofsky, Verena, and Sebastian Junge. 2019. Does the market reward digitalization efforts? Evidence from securities analysts’ investment recommendations. Journal of Business Economics 89: 965–94. [Google Scholar] [CrossRef]
- Ionaşcu, Ion, Mihaela Ionaşcu, Elena Nechita, Marian Săcărin, and Mihaela Minu. 2022. Digital transformation, financial performance and sustainability: Evidence for european union listed companies. Amfiteatru Economic 24: 94–109. [Google Scholar] [CrossRef]
- Jackson, Howell E. 2020. The nature of the fintech firm. Wash. UJL & Pol’y 61: 9. [Google Scholar]
- Jinasena, Dakshitha N., Konstantina Spanaki, Thanos Papadopoulos, and Maria E. Balta. 2020. Success and failure retrospectives of fintech projects: A case study approach. Information Systems Frontiers 25: 259–74. [Google Scholar] [CrossRef]
- Krause, Stefan, and Bernhard Pellens. 2017. Betriebswirtschaftliche Implikationen der digitalen Transformation. Wiesbaden: Springer Gabler. [Google Scholar]
- Lässig, Reinhard und Hentschel, Stefan und Leutiger Philipp und Tornier Silvia und Fey Alexander, and Florian Hirt. 2015. Die digitale zukunft des b2b-vertriebs. Roland Berger GmbH. Available online: https://www.thinkwithgoogle.com/_qs/documents/3879/97234_TA_15_045_TAB_01_Transforming_B2B-Sales-12_Online.pdf (accessed on 2 February 2021).
- Matheus, Facure Alves. 2022. Causal Inference for the Brave and True. Available online: https://matheusfacure.github.io/python-causality-handbook/landing-page.html (accessed on 2 February 2021).
- Mayring, Philipp. 2019. Qualitative content analysis: Demarcation, varieties, developments. Forum: Qualitative Social Research 20: 16. [Google Scholar]
- Moring, Andreas, Lukas Maiwald, and Timo Kewitz. 2018. Bits and Bricks: Digitalisierung von Geschäftsmodellen in der Immobilienbranche. Wiesbaden: Springer Gabler. [Google Scholar]
- Nagl, Wolfgang, Gerlinde Titelbach, and Katarina Valkova. 2017. Digitalisierung der Arbeit: Substituierbarkeit von Berufen im Zuge der Automatisierung durch Industrie 4.0. Endbericht. Vienna: Institute for Advanced Studies. [Google Scholar]
- Nissim, Doron. 2019. Ebitda, Ebita, or Ebit? Columbia Business School Research Paper. New York: Columbia University, pp. 17–71. [Google Scholar]
- Pfister, Paul, and Claudia Lehmann. 2022. Digital value creation in german smes—A return-on-investment analysis. Journal of Small Business & Entrepreneurship 2022: 1–26. [Google Scholar] [CrossRef]
- Pfister, Paul, and Claudia Lehmann. 2023. Returns on digitisation in smes—A systematic literature review. Journal of Small Business & Entrepreneurship 35: 574–98. [Google Scholar]
- Ren, Chen, Sang-Joon Lee, and Chenxi Hu. 2023. Digitalization improves enterprise performance: New evidence by text analysis. SAGE Open 13: 21582440231175871. [Google Scholar] [CrossRef]
- Ruhland, Pascal, and Felix Wiese. 2023. Fintechs and the financial industry: Partnerships for success. Journal of Business Strategy 44: 228–37. [Google Scholar] [CrossRef]
- Sahut, Jean-Michel, Sandrine Boulerne, and Frederic Teulon. 2011. Do ifrs provide better information about intangibles in europe? Review of Accounting and Finance 10: 267–90. [Google Scholar] [CrossRef]
- Salvi, Antonio, Filippo Vitolla, Michele Rubino, Anastasia Giakoumelou, and Nicola Raimo. 2021. Online information on digitalisation processes and its impact on firm value. Journal of Business Research 124: 437–44. [Google Scholar] [CrossRef]
- Schmidheiny, Kurt, and Unversität Basel. 2011. Panel data: Fixed and random effects. Short Guides to Microeconometrics 7: 2–7. [Google Scholar]
- Schwer, Karlheinz, and Andre Lucas. 2022. Significant variables for digitalization and financial business outcome: Impact of climate, covid; profile of firm, innovation and digitalization, investment activity and other company variables in western europe. Paper presented at 5th International Conference on Information Management and Management Science, Chengdu, China, August 26–28; pp. 312–23. [Google Scholar]
- Truant, Elisa, Laura Broccardo, and Léo-Paul Dana. 2021. Digitalisation boosts company performance: An overview of italian listed companies. Technological Forecasting and Social Change 173: 121173. [Google Scholar] [CrossRef]
- Valero, Silvia, Francisco Climent, and Rafael Esteban. 2020. Future banking scenarios. Evolution of digitalisation in spanish banking. Journal of Business Accounting and Finance Perspectives 2: 13. [Google Scholar] [CrossRef]
- Zeng, Huixiang, Hangxin Ran, Qiong Zhou, Youliang Jin, and Xu Cheng. 2022. The financial effect of firm digitalization: Evidence from china. Technological Forecasting and Social Change 183: 121951. [Google Scholar] [CrossRef]
Figure 1.
Graphical illustration of the fixed effects model.

Figure 2.
Fixed Effect Model (symbolic).

Figure 3.
Development of investments in software of all companies listed on the Austrian ATX Prime market from 2010 to 2019 (n = 19).
Figure 3.
Development of investments in software of all companies listed on the Austrian ATX Prime market from 2010 to 2019 (n = 19).

Figure 4.
Development of profit before taxes for all companies listed on the ATX Prime market for the period 2010 to 2019 (n = 19).
Figure 4.
Development of profit before taxes for all companies listed on the ATX Prime market for the period 2010 to 2019 (n = 19).

Figure 5.
Development of investments in software from 2010 to 2019 for all companies listed on the ATX Prime market that are assigned to the finance industry (n = 8).
Figure 5.
Development of investments in software from 2010 to 2019 for all companies listed on the ATX Prime market that are assigned to the finance industry (n = 8).

Figure 6.
Development of investments in software of companies listed on the ATX Prime market excluding financial companies from 2010 to 2019 (including OMV, n = 11).
Figure 6.
Development of investments in software of companies listed on the ATX Prime market excluding financial companies from 2010 to 2019 (including OMV, n = 11).

Figure 7.
Development of investments in software of companies listed on the ATX Prime market excluding financial companies and OMV from 2010 to 2019 (n = 10).
Figure 7.
Development of investments in software of companies listed on the ATX Prime market excluding financial companies and OMV from 2010 to 2019 (n = 10).

Figure 8.
Comparison of the mean values of companies within the financial sector (n = 8) and outside the financial sector (n = 11) as well as the percentage share of investments in software in total investments, broken down into finance (n = 8) and non-finance (n = 11) companies.
Figure 8.
Comparison of the mean values of companies within the financial sector (n = 8) and outside the financial sector (n = 11) as well as the percentage share of investments in software in total investments, broken down into finance (n = 8) and non-finance (n = 11) companies.

Figure 9.
Develapment of profit before taxes for the period 2010 to 2019 for all companies listed on the ATX Prime market excluding finance companies (outlier OMV - shown in the box plot as a circle; n = 11).
Figure 9.
Develapment of profit before taxes for the period 2010 to 2019 for all companies listed on the ATX Prime market excluding finance companies (outlier OMV - shown in the box plot as a circle; n = 11).

Figure 10.
Development of profit before taxes for the period 2010 to 2019 for all companies listed on the ATX Prime market excluding finance companies and OMV (n = 10).
Figure 10.
Development of profit before taxes for the period 2010 to 2019 for all companies listed on the ATX Prime market excluding finance companies and OMV (n = 10).

Figure 11.
Development of profit before taxes for the period 2010 to 2019 for all companies listed on the ATX Prime market assigned to the finance sector (outlier Erste Group Bank AG - shown in the box plot as a circle; n = 8).
Figure 11.
Development of profit before taxes for the period 2010 to 2019 for all companies listed on the ATX Prime market assigned to the finance sector (outlier Erste Group Bank AG - shown in the box plot as a circle; n = 8).


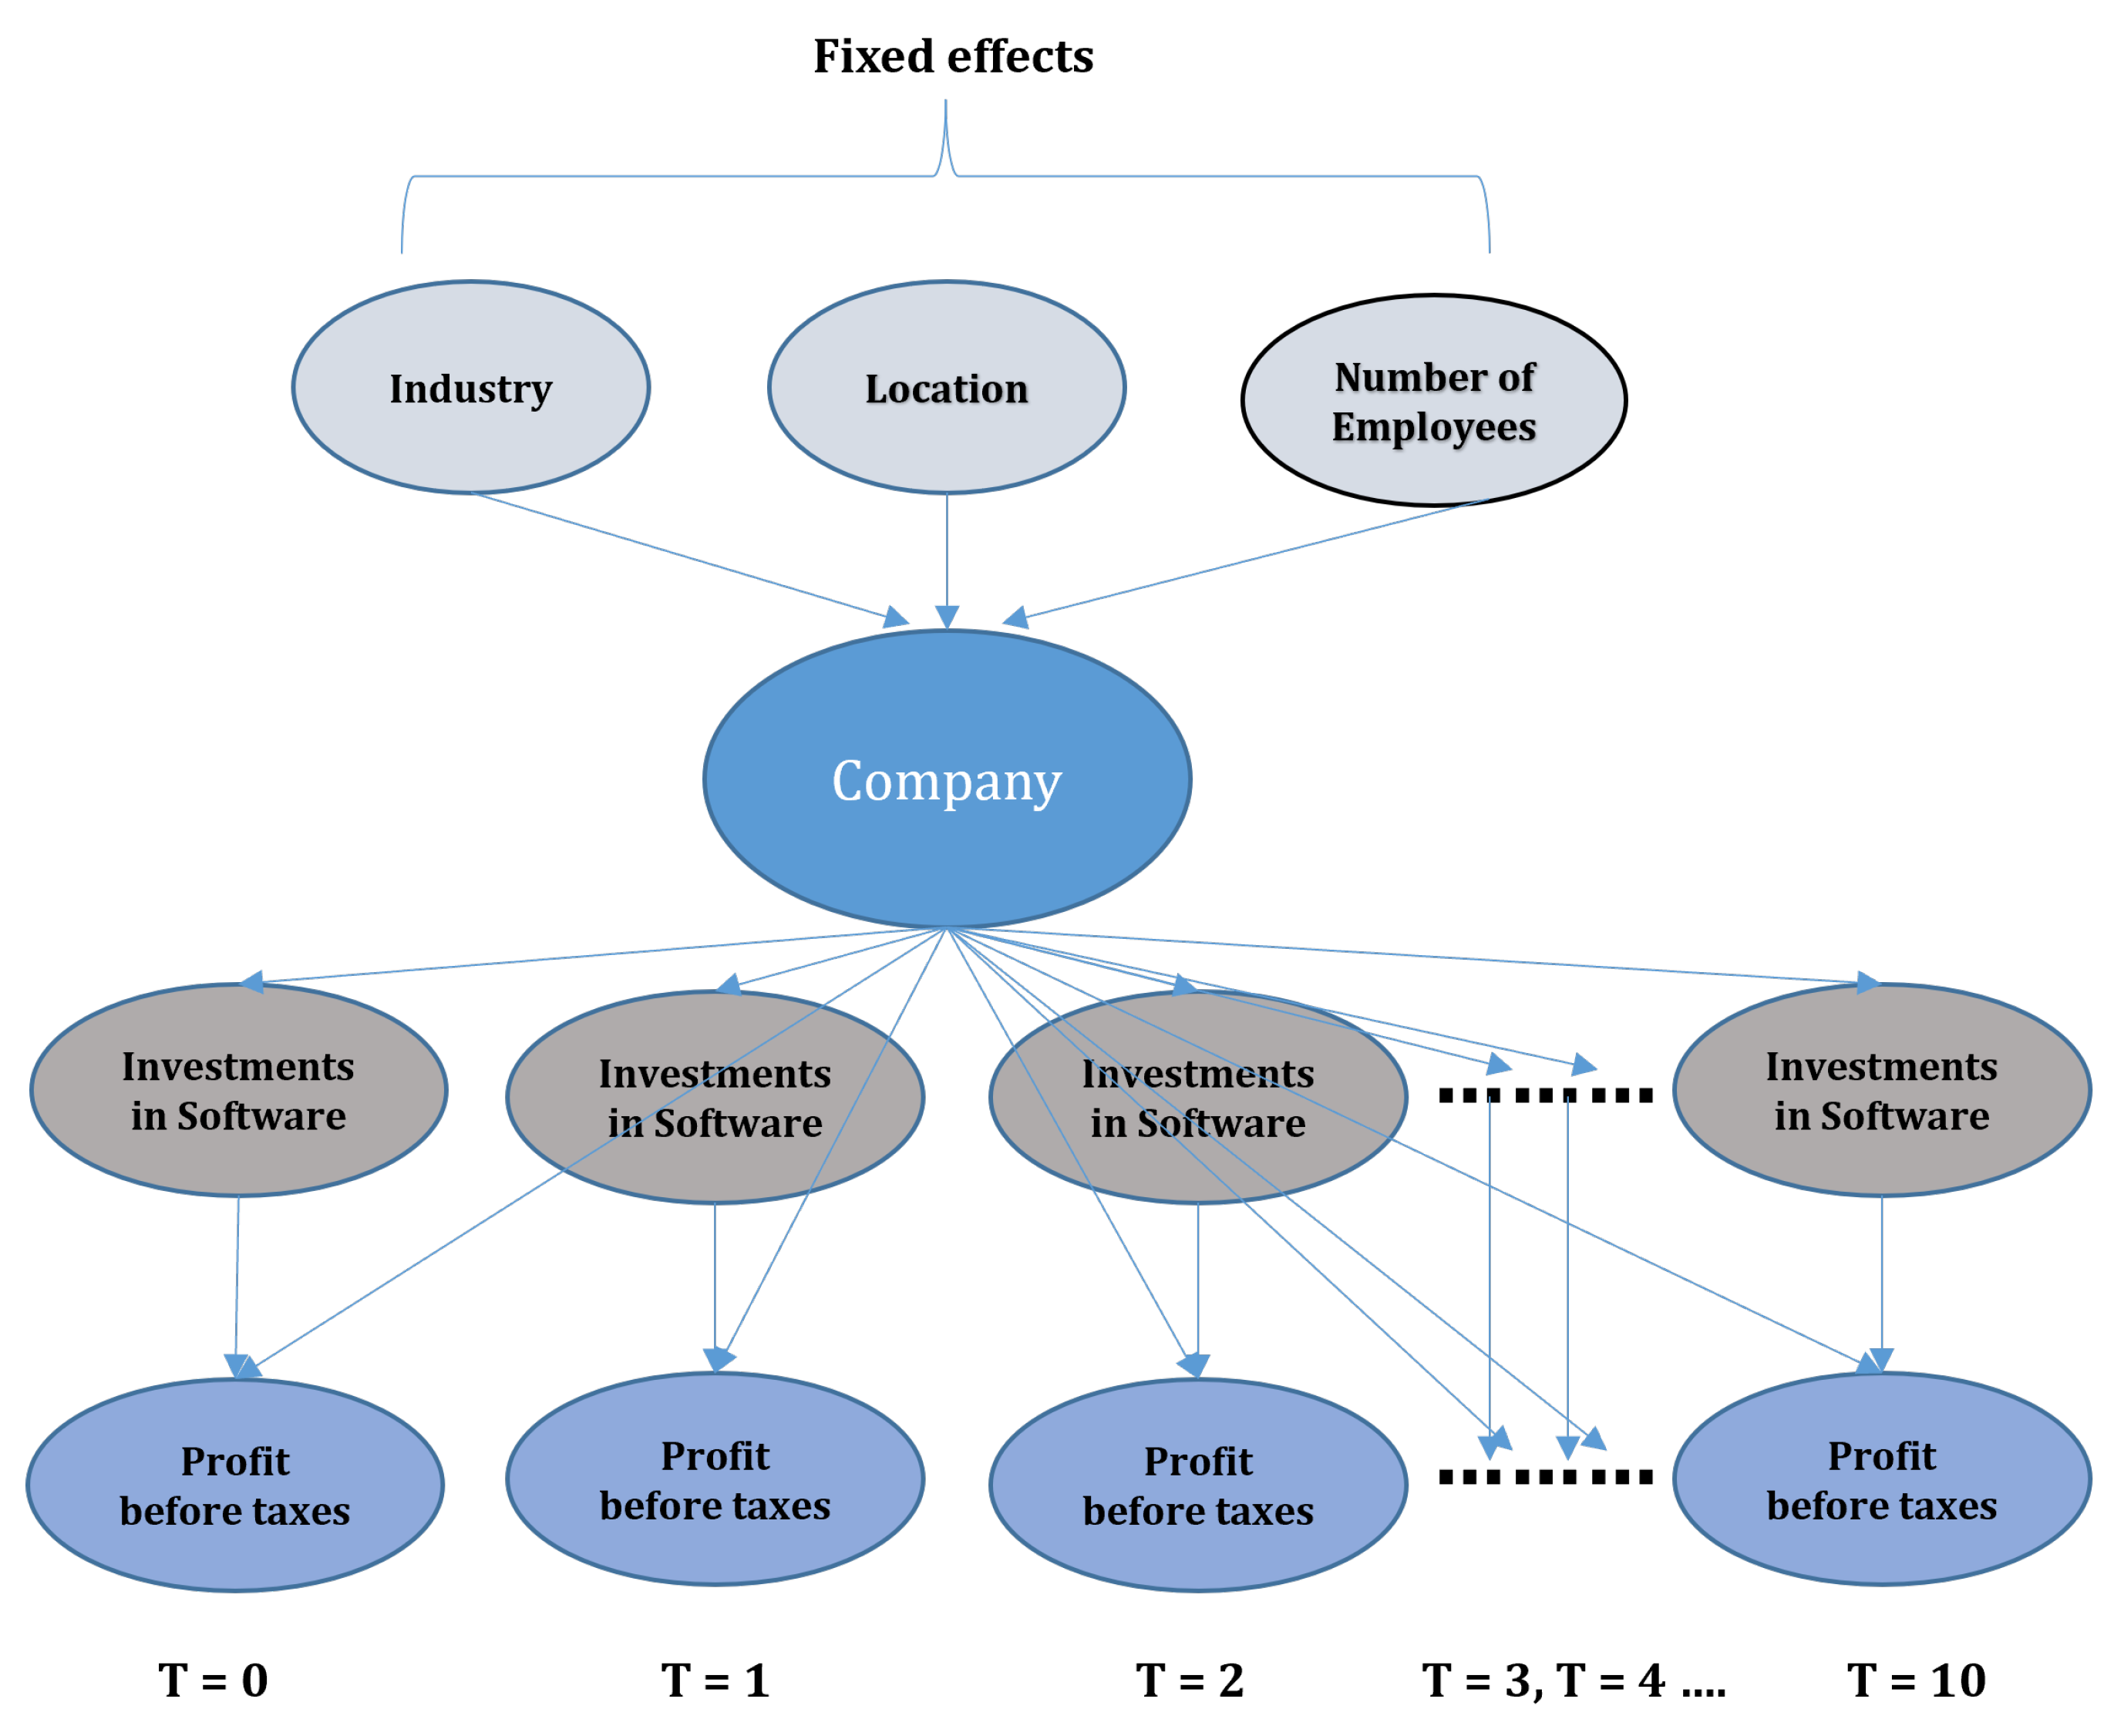
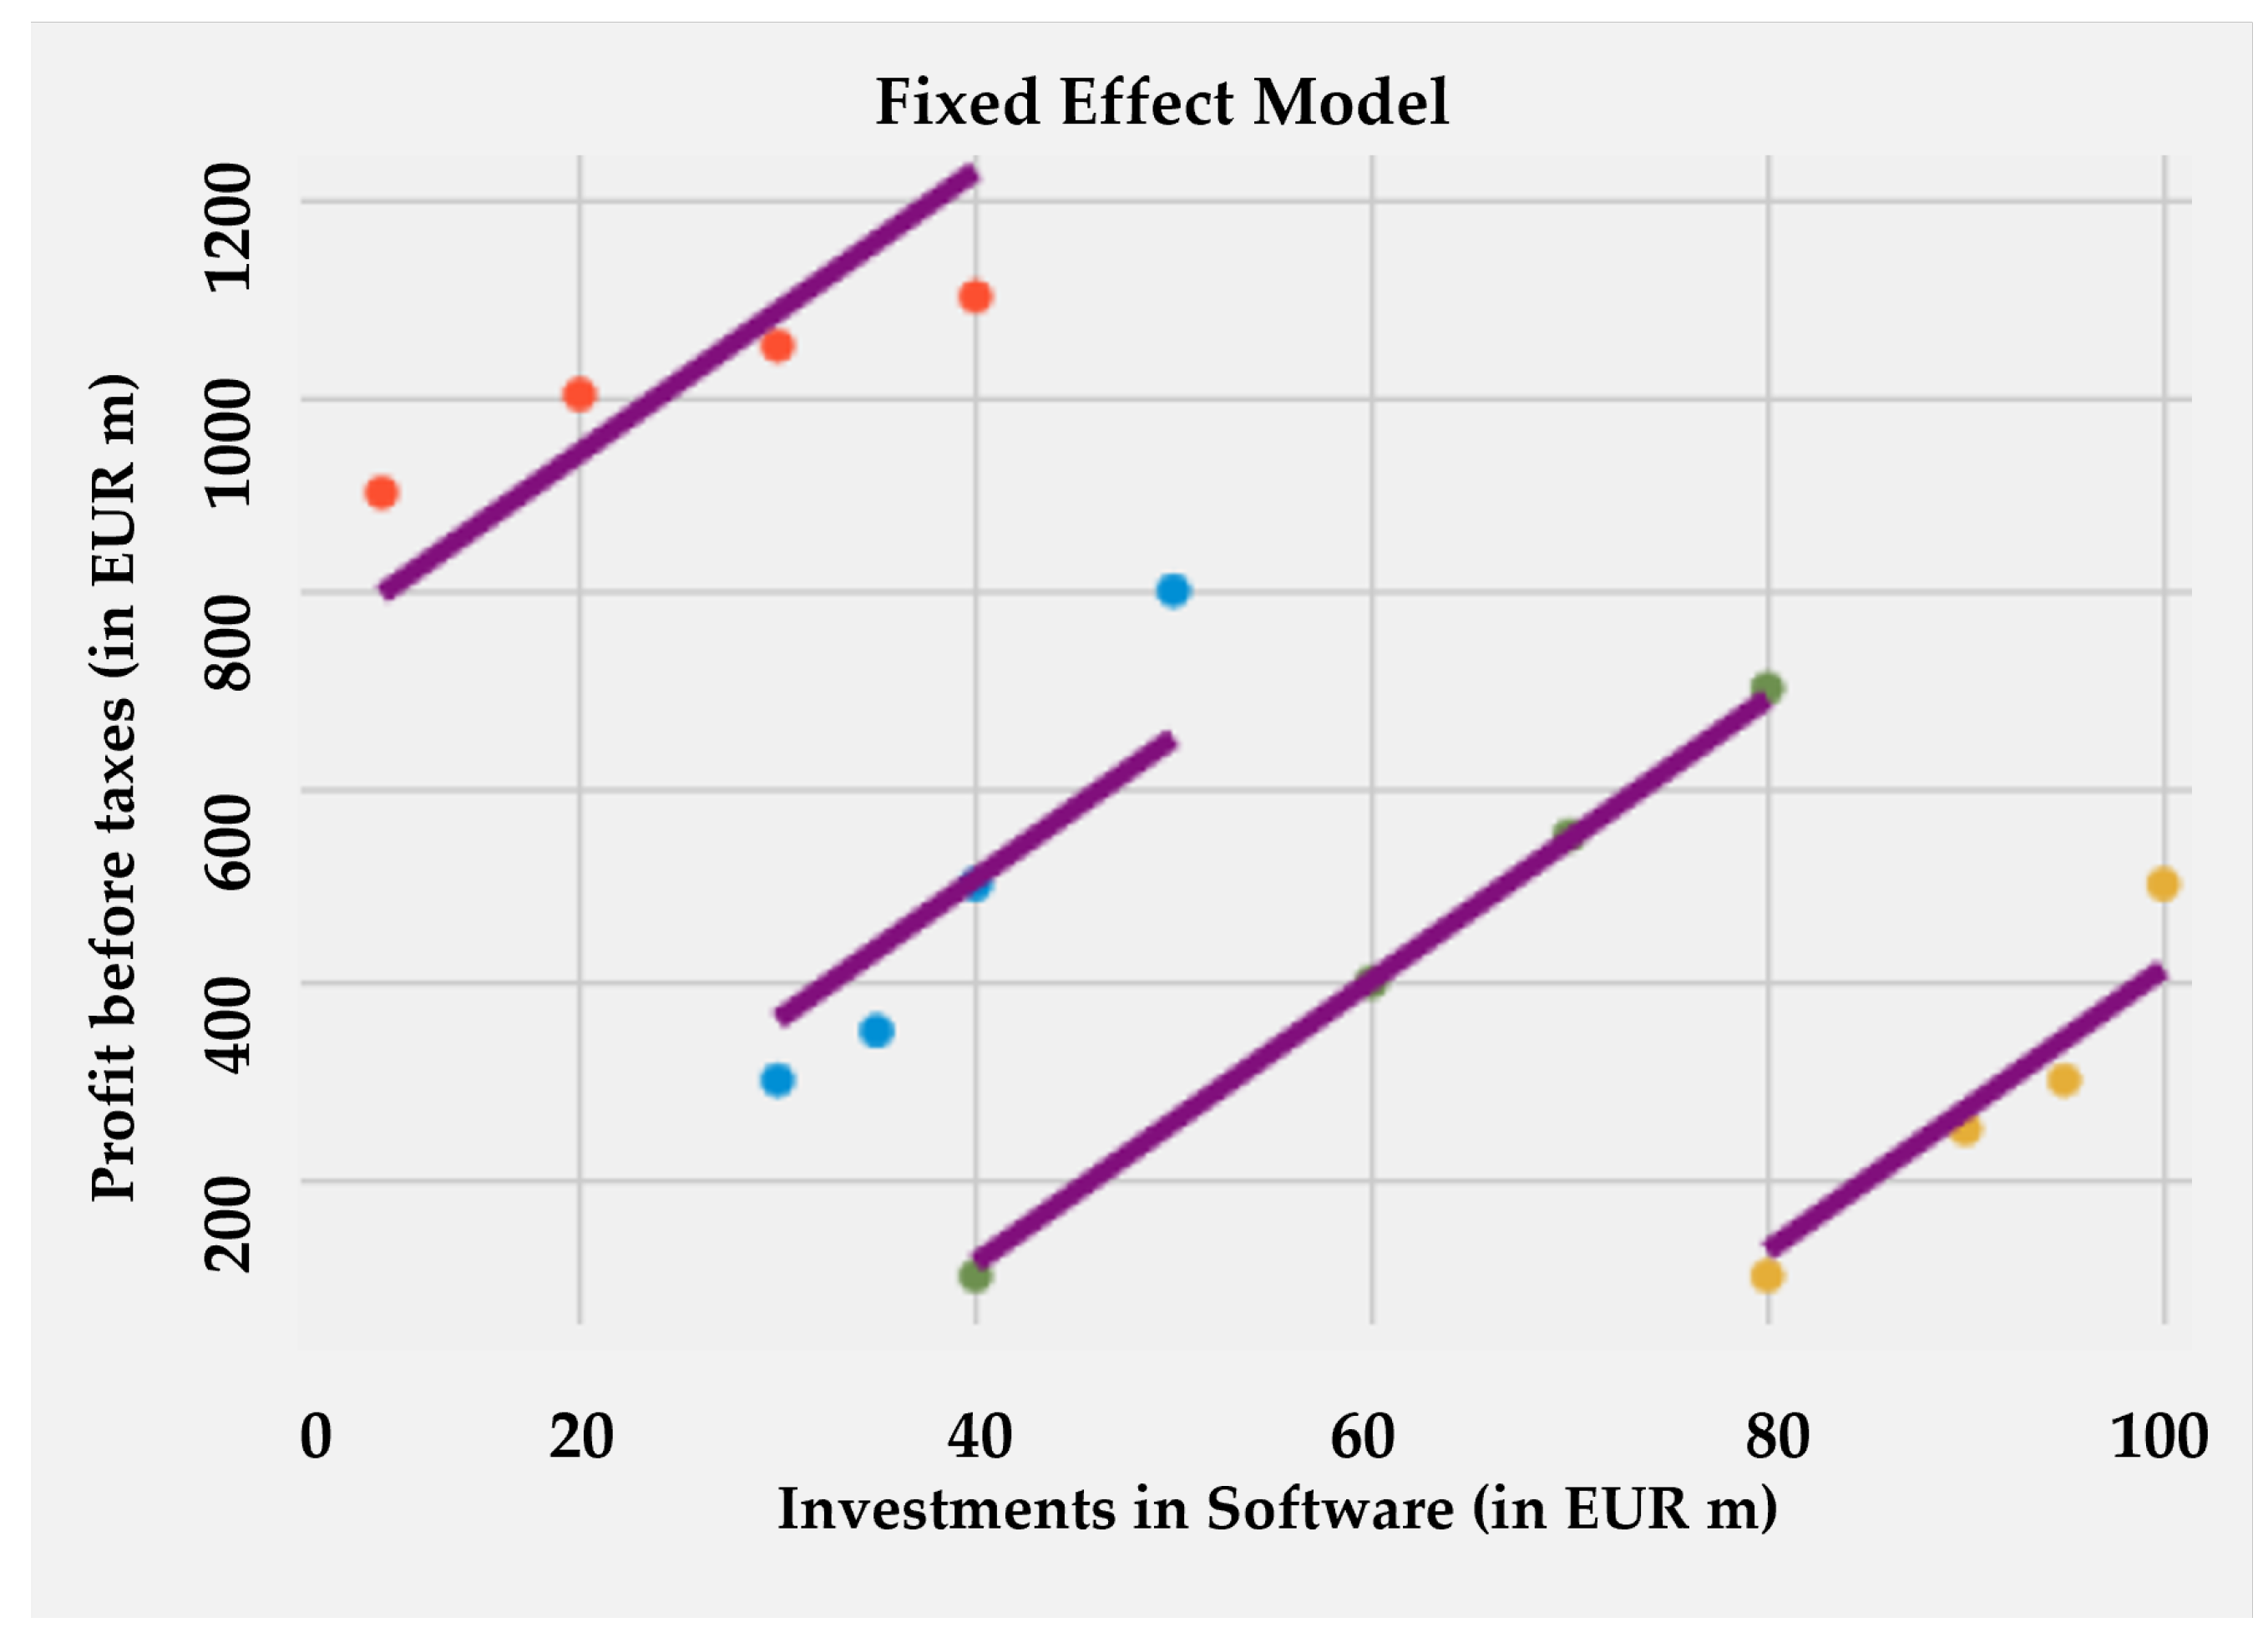
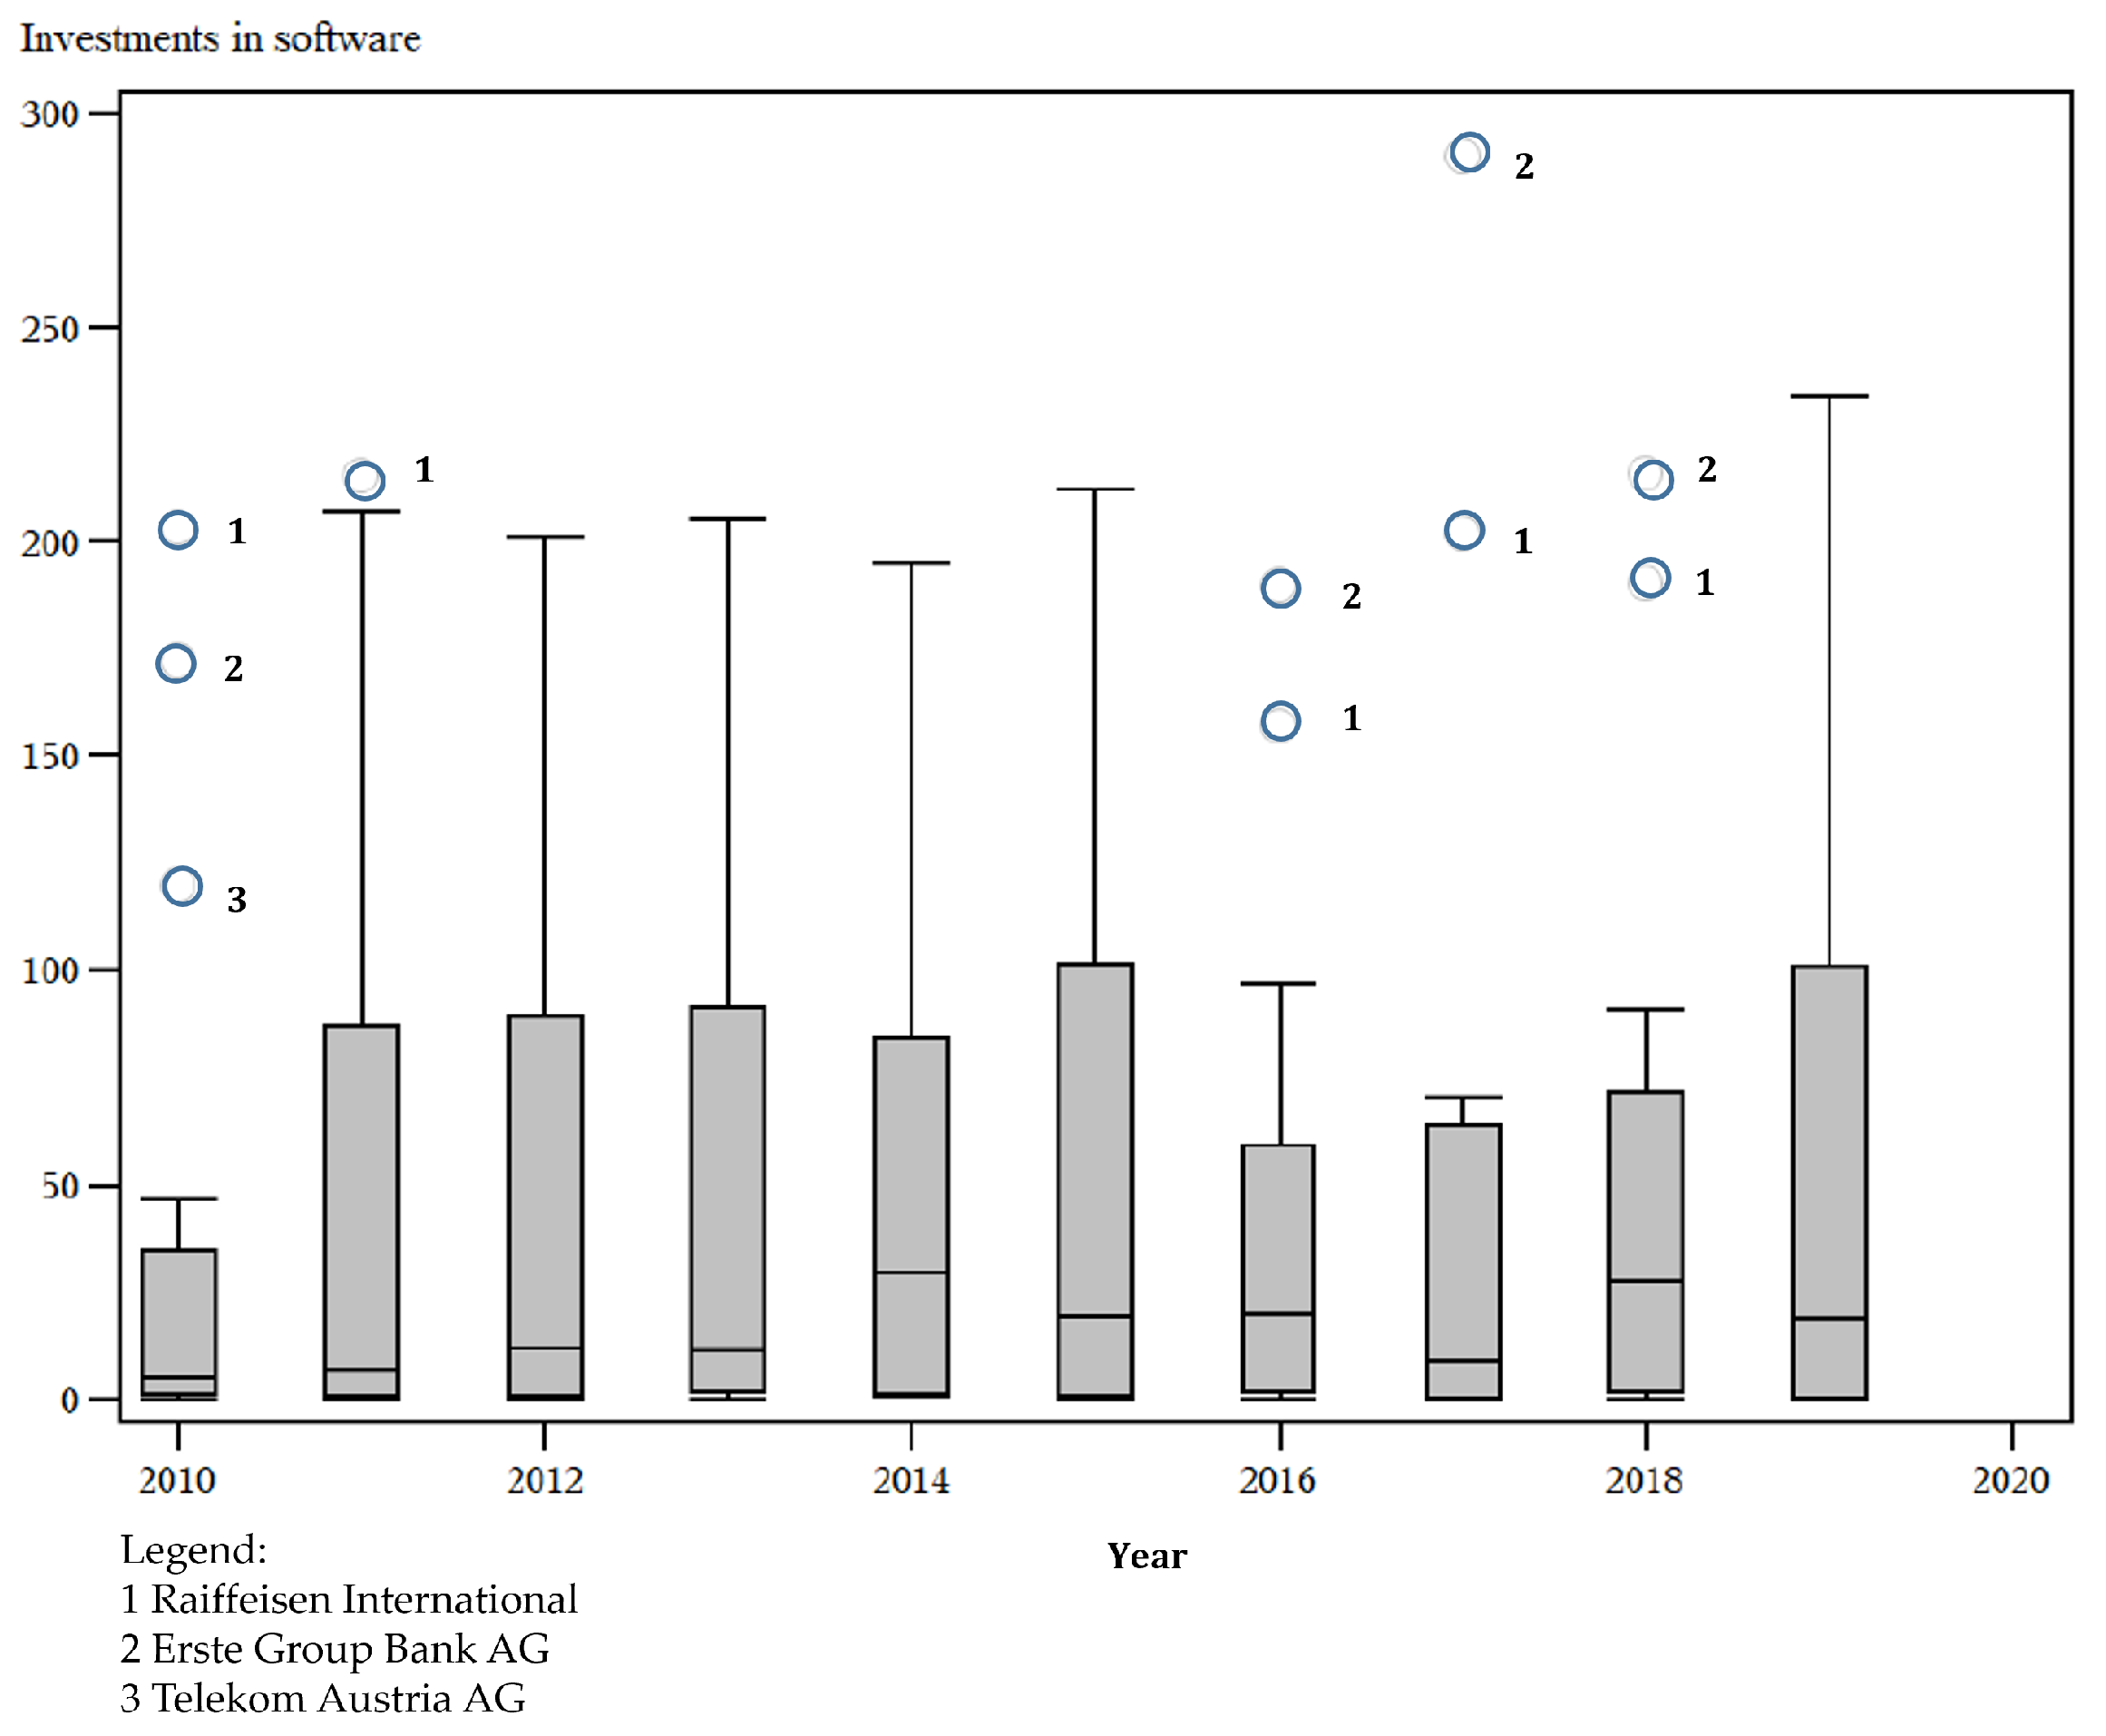
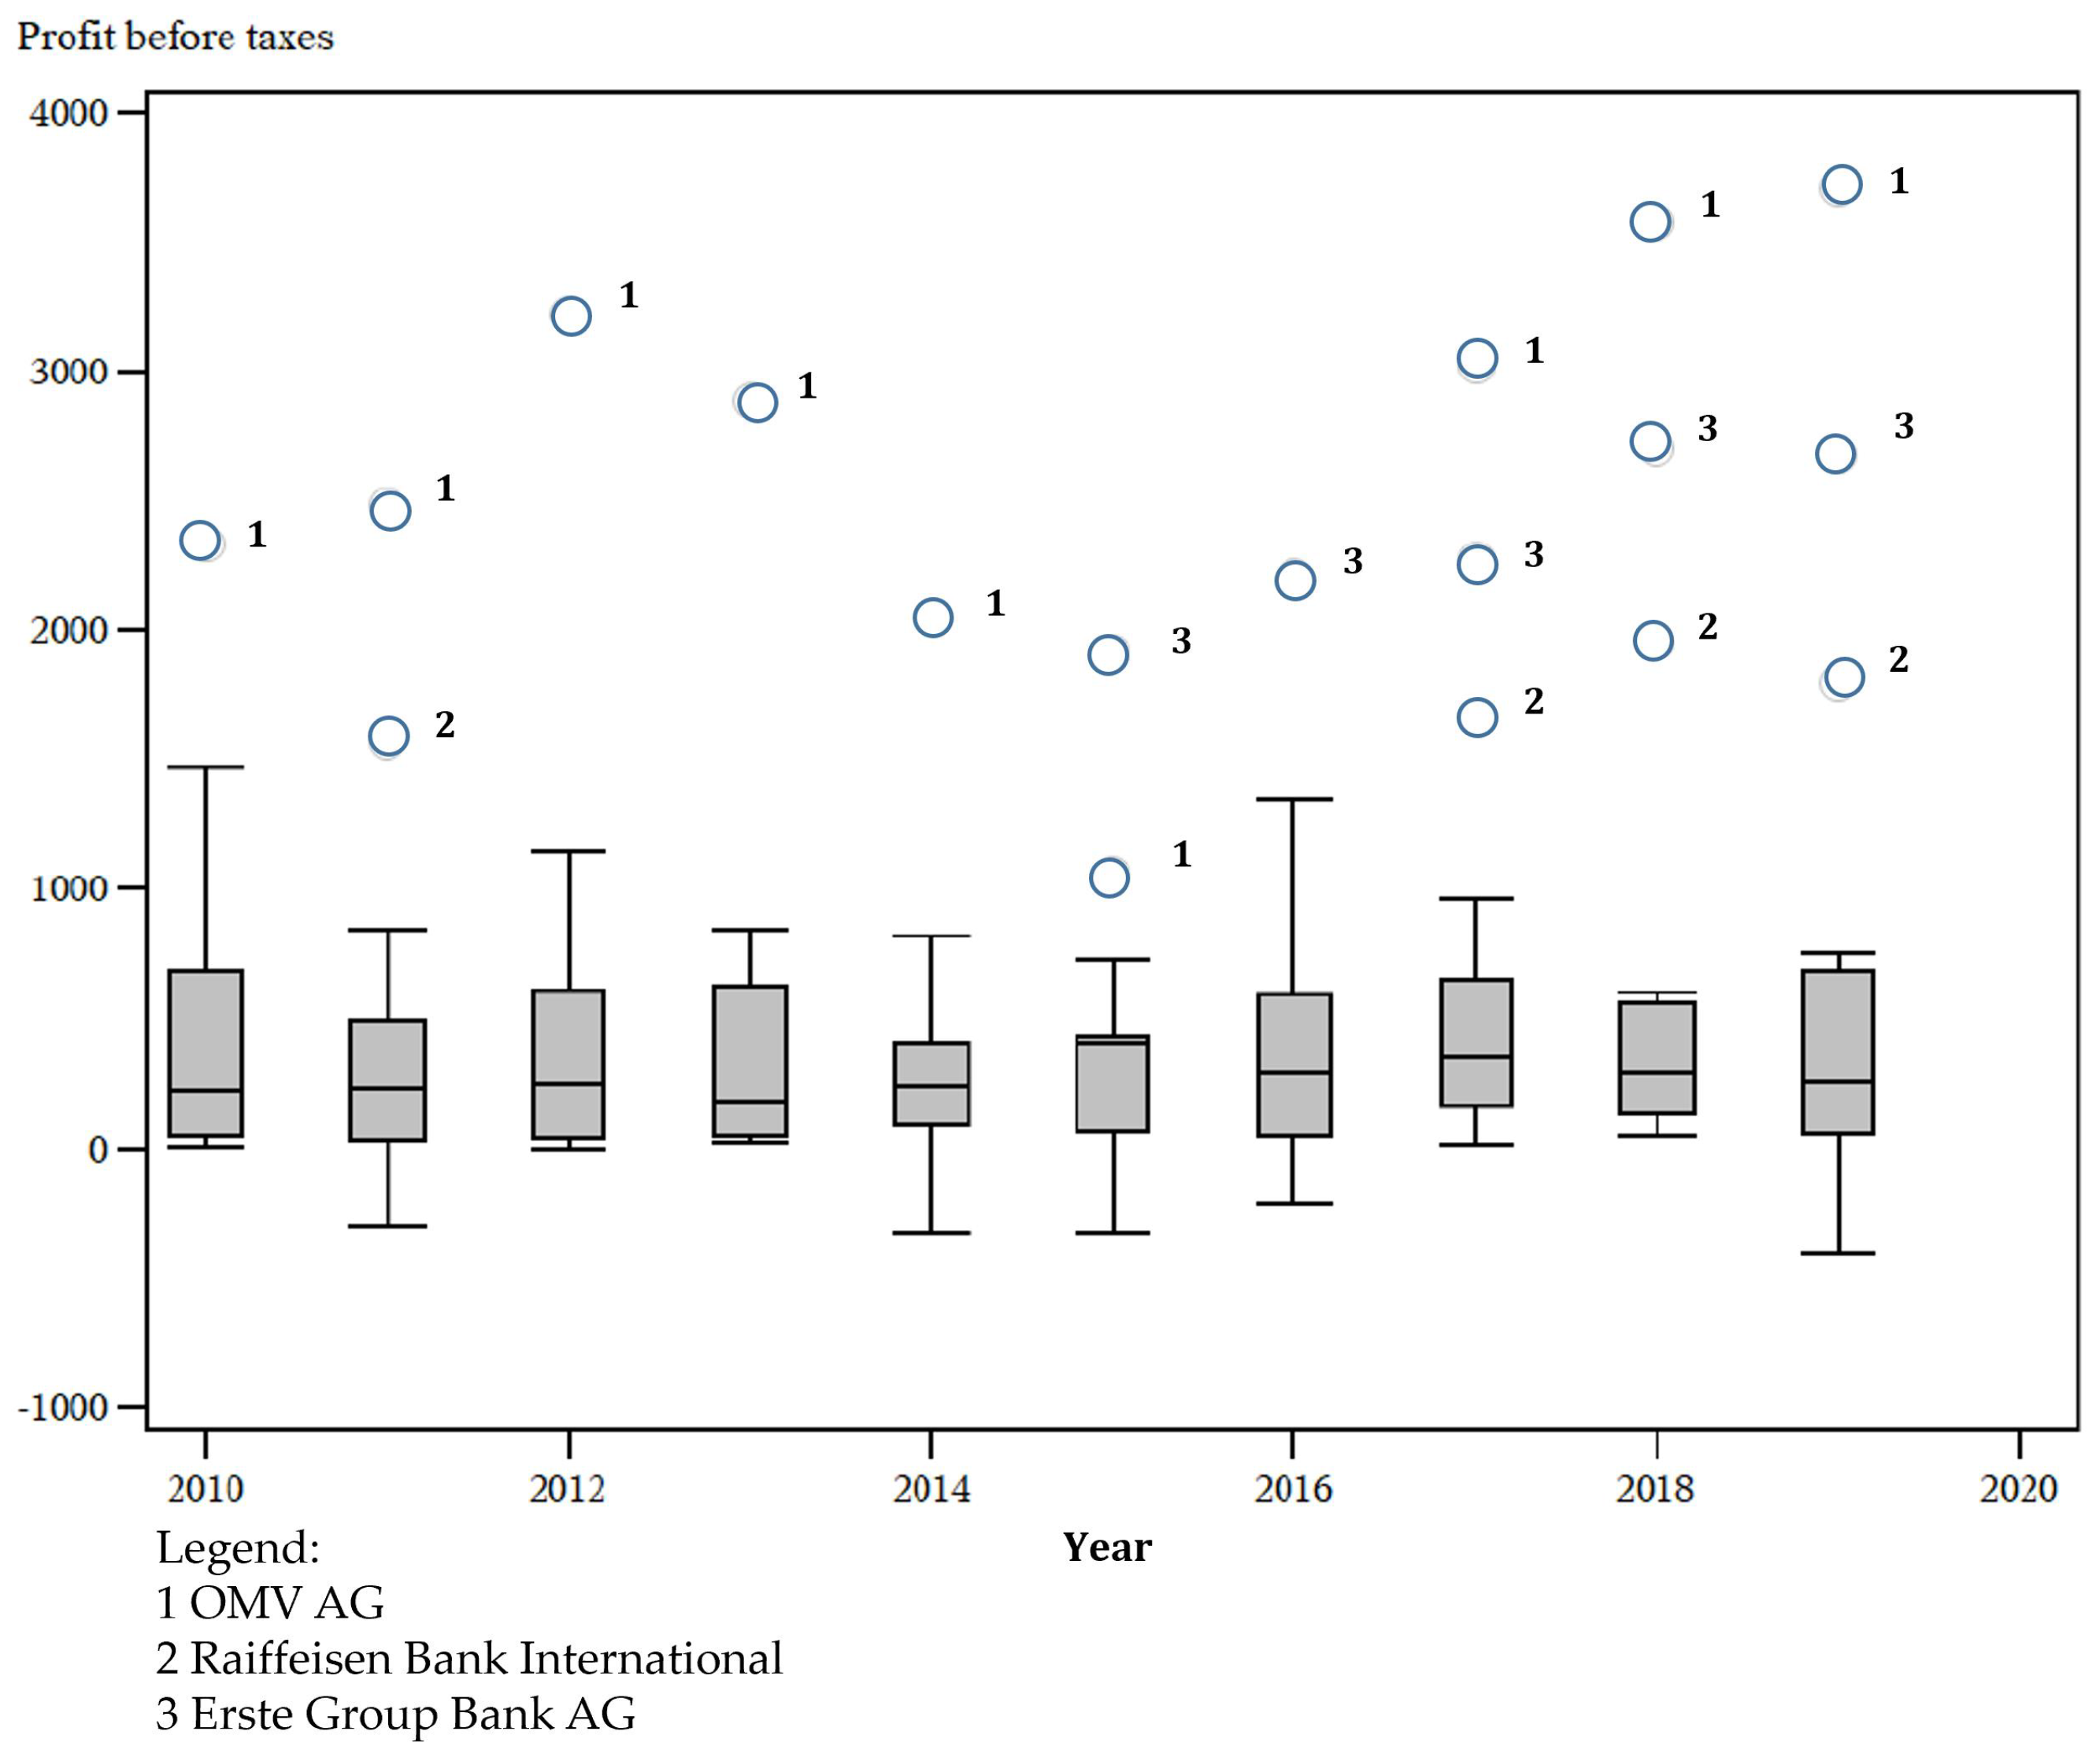
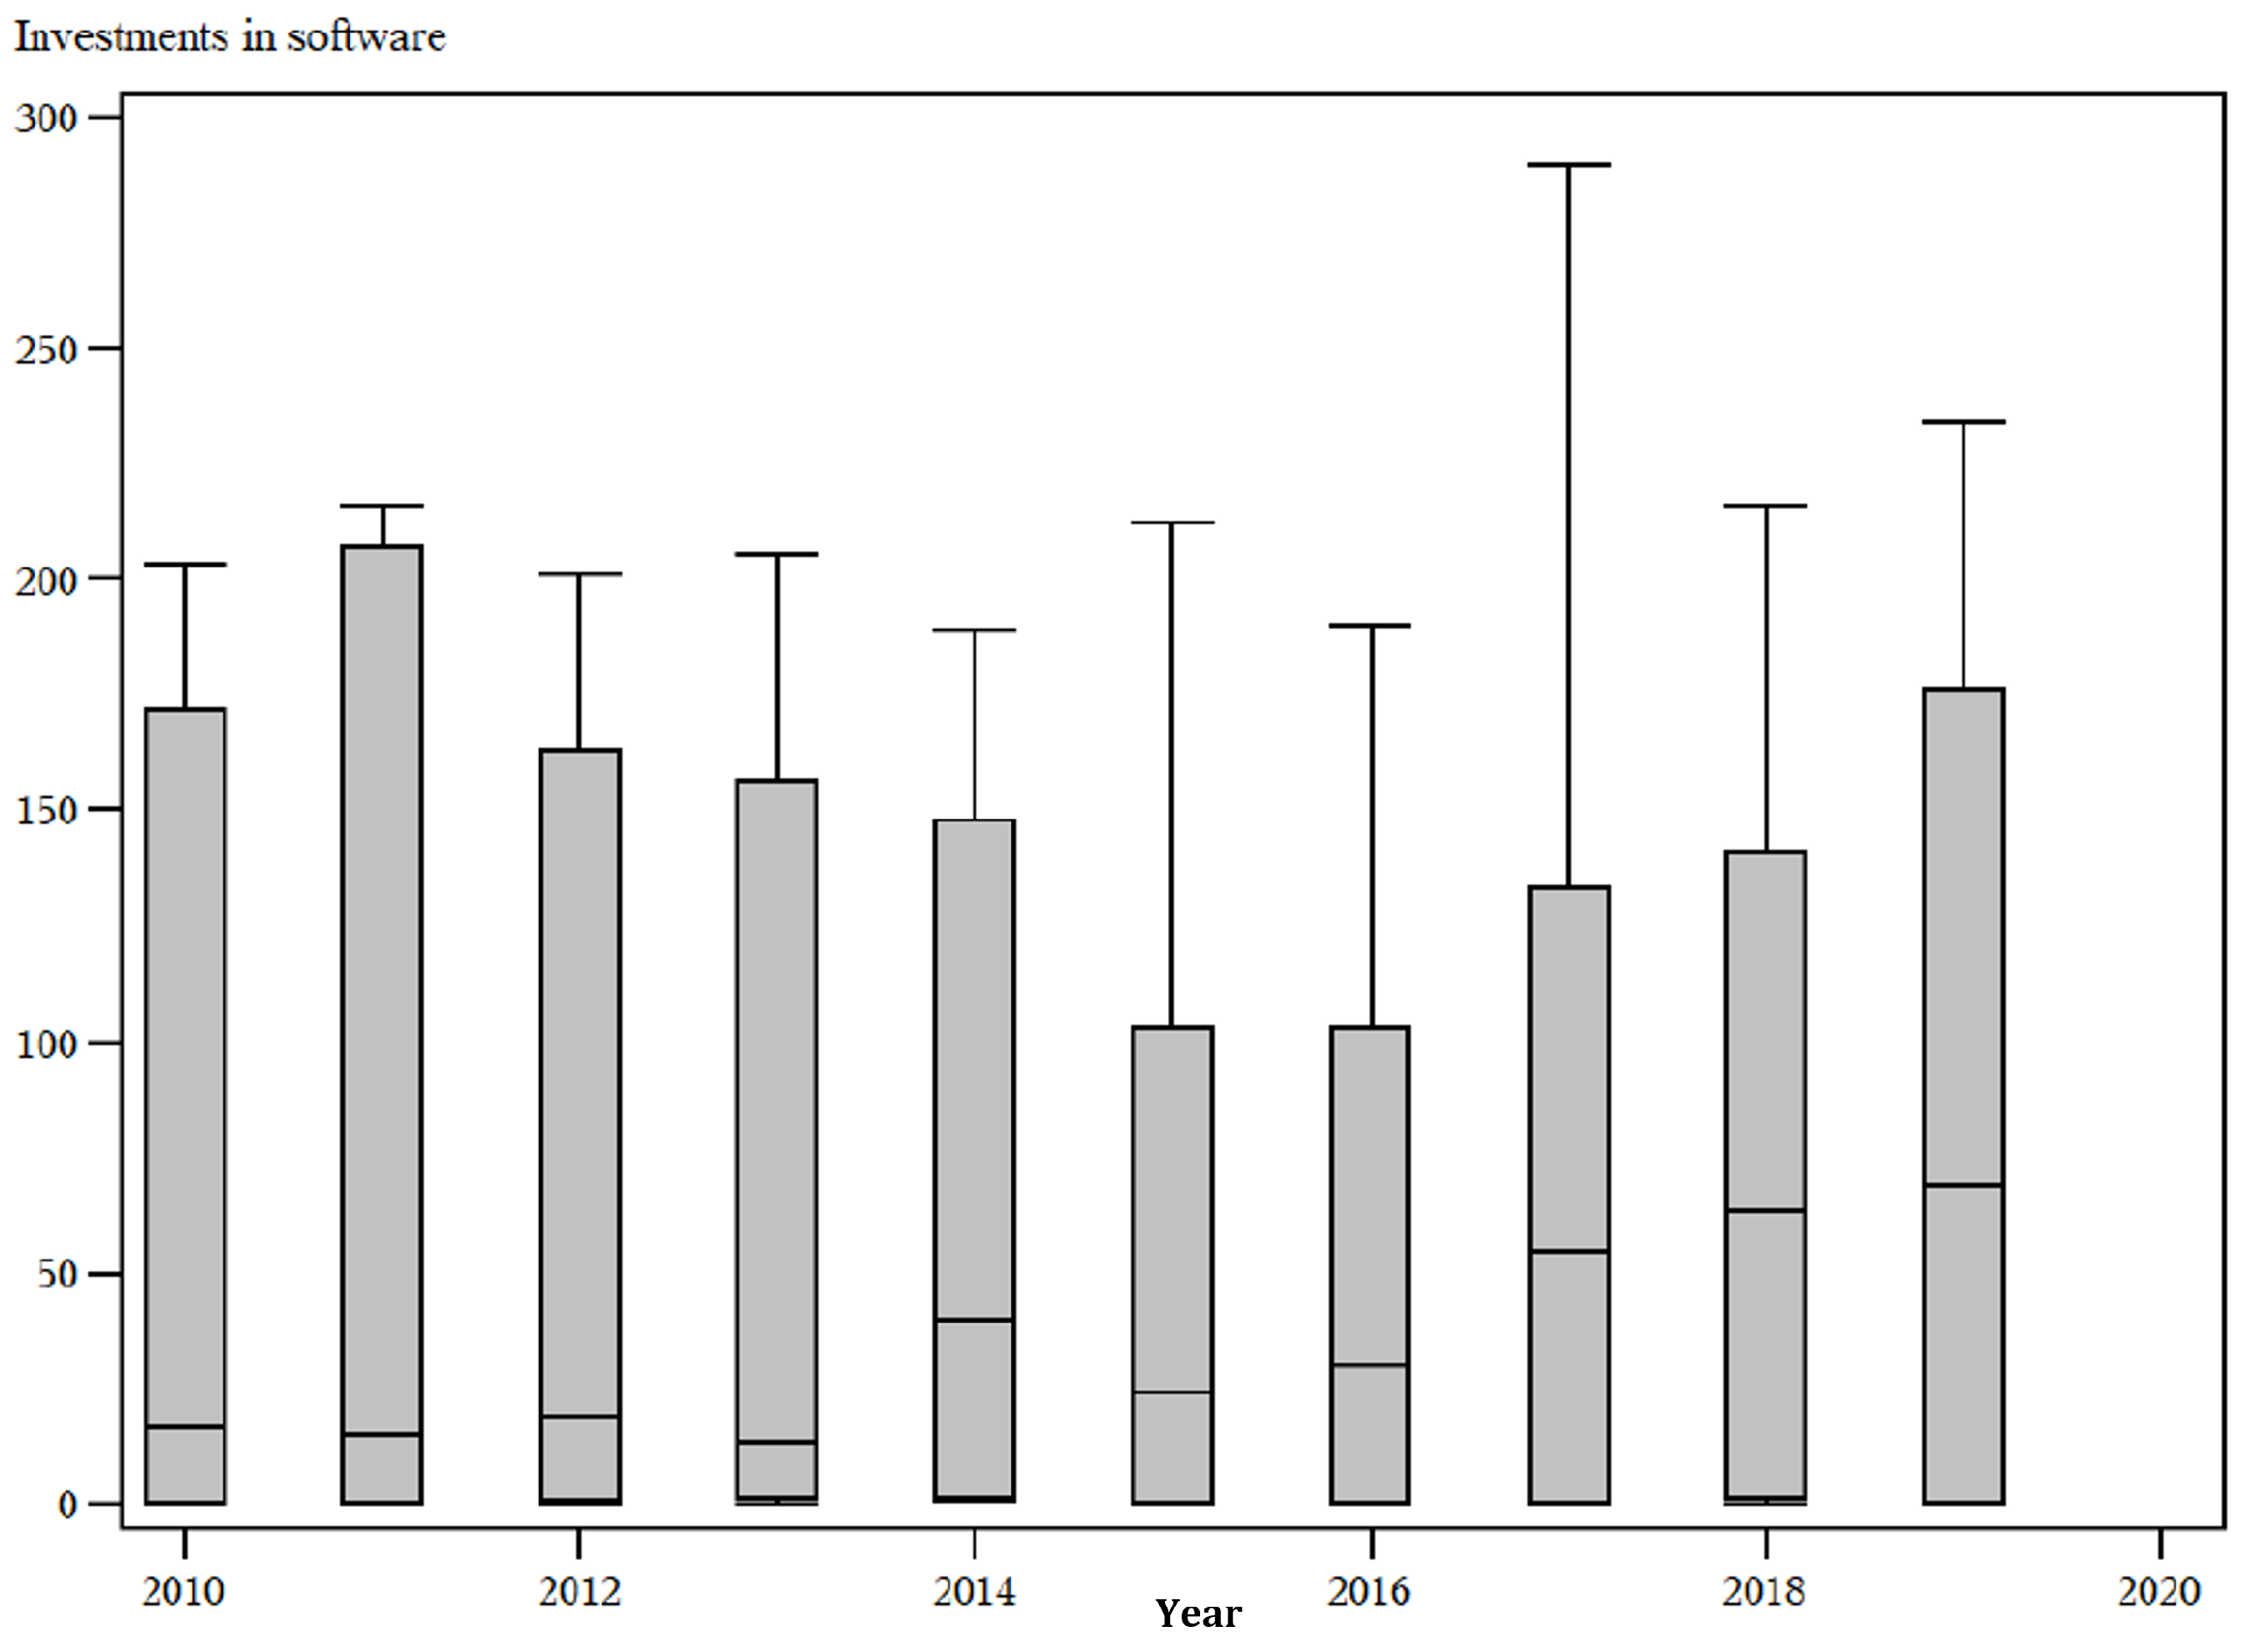
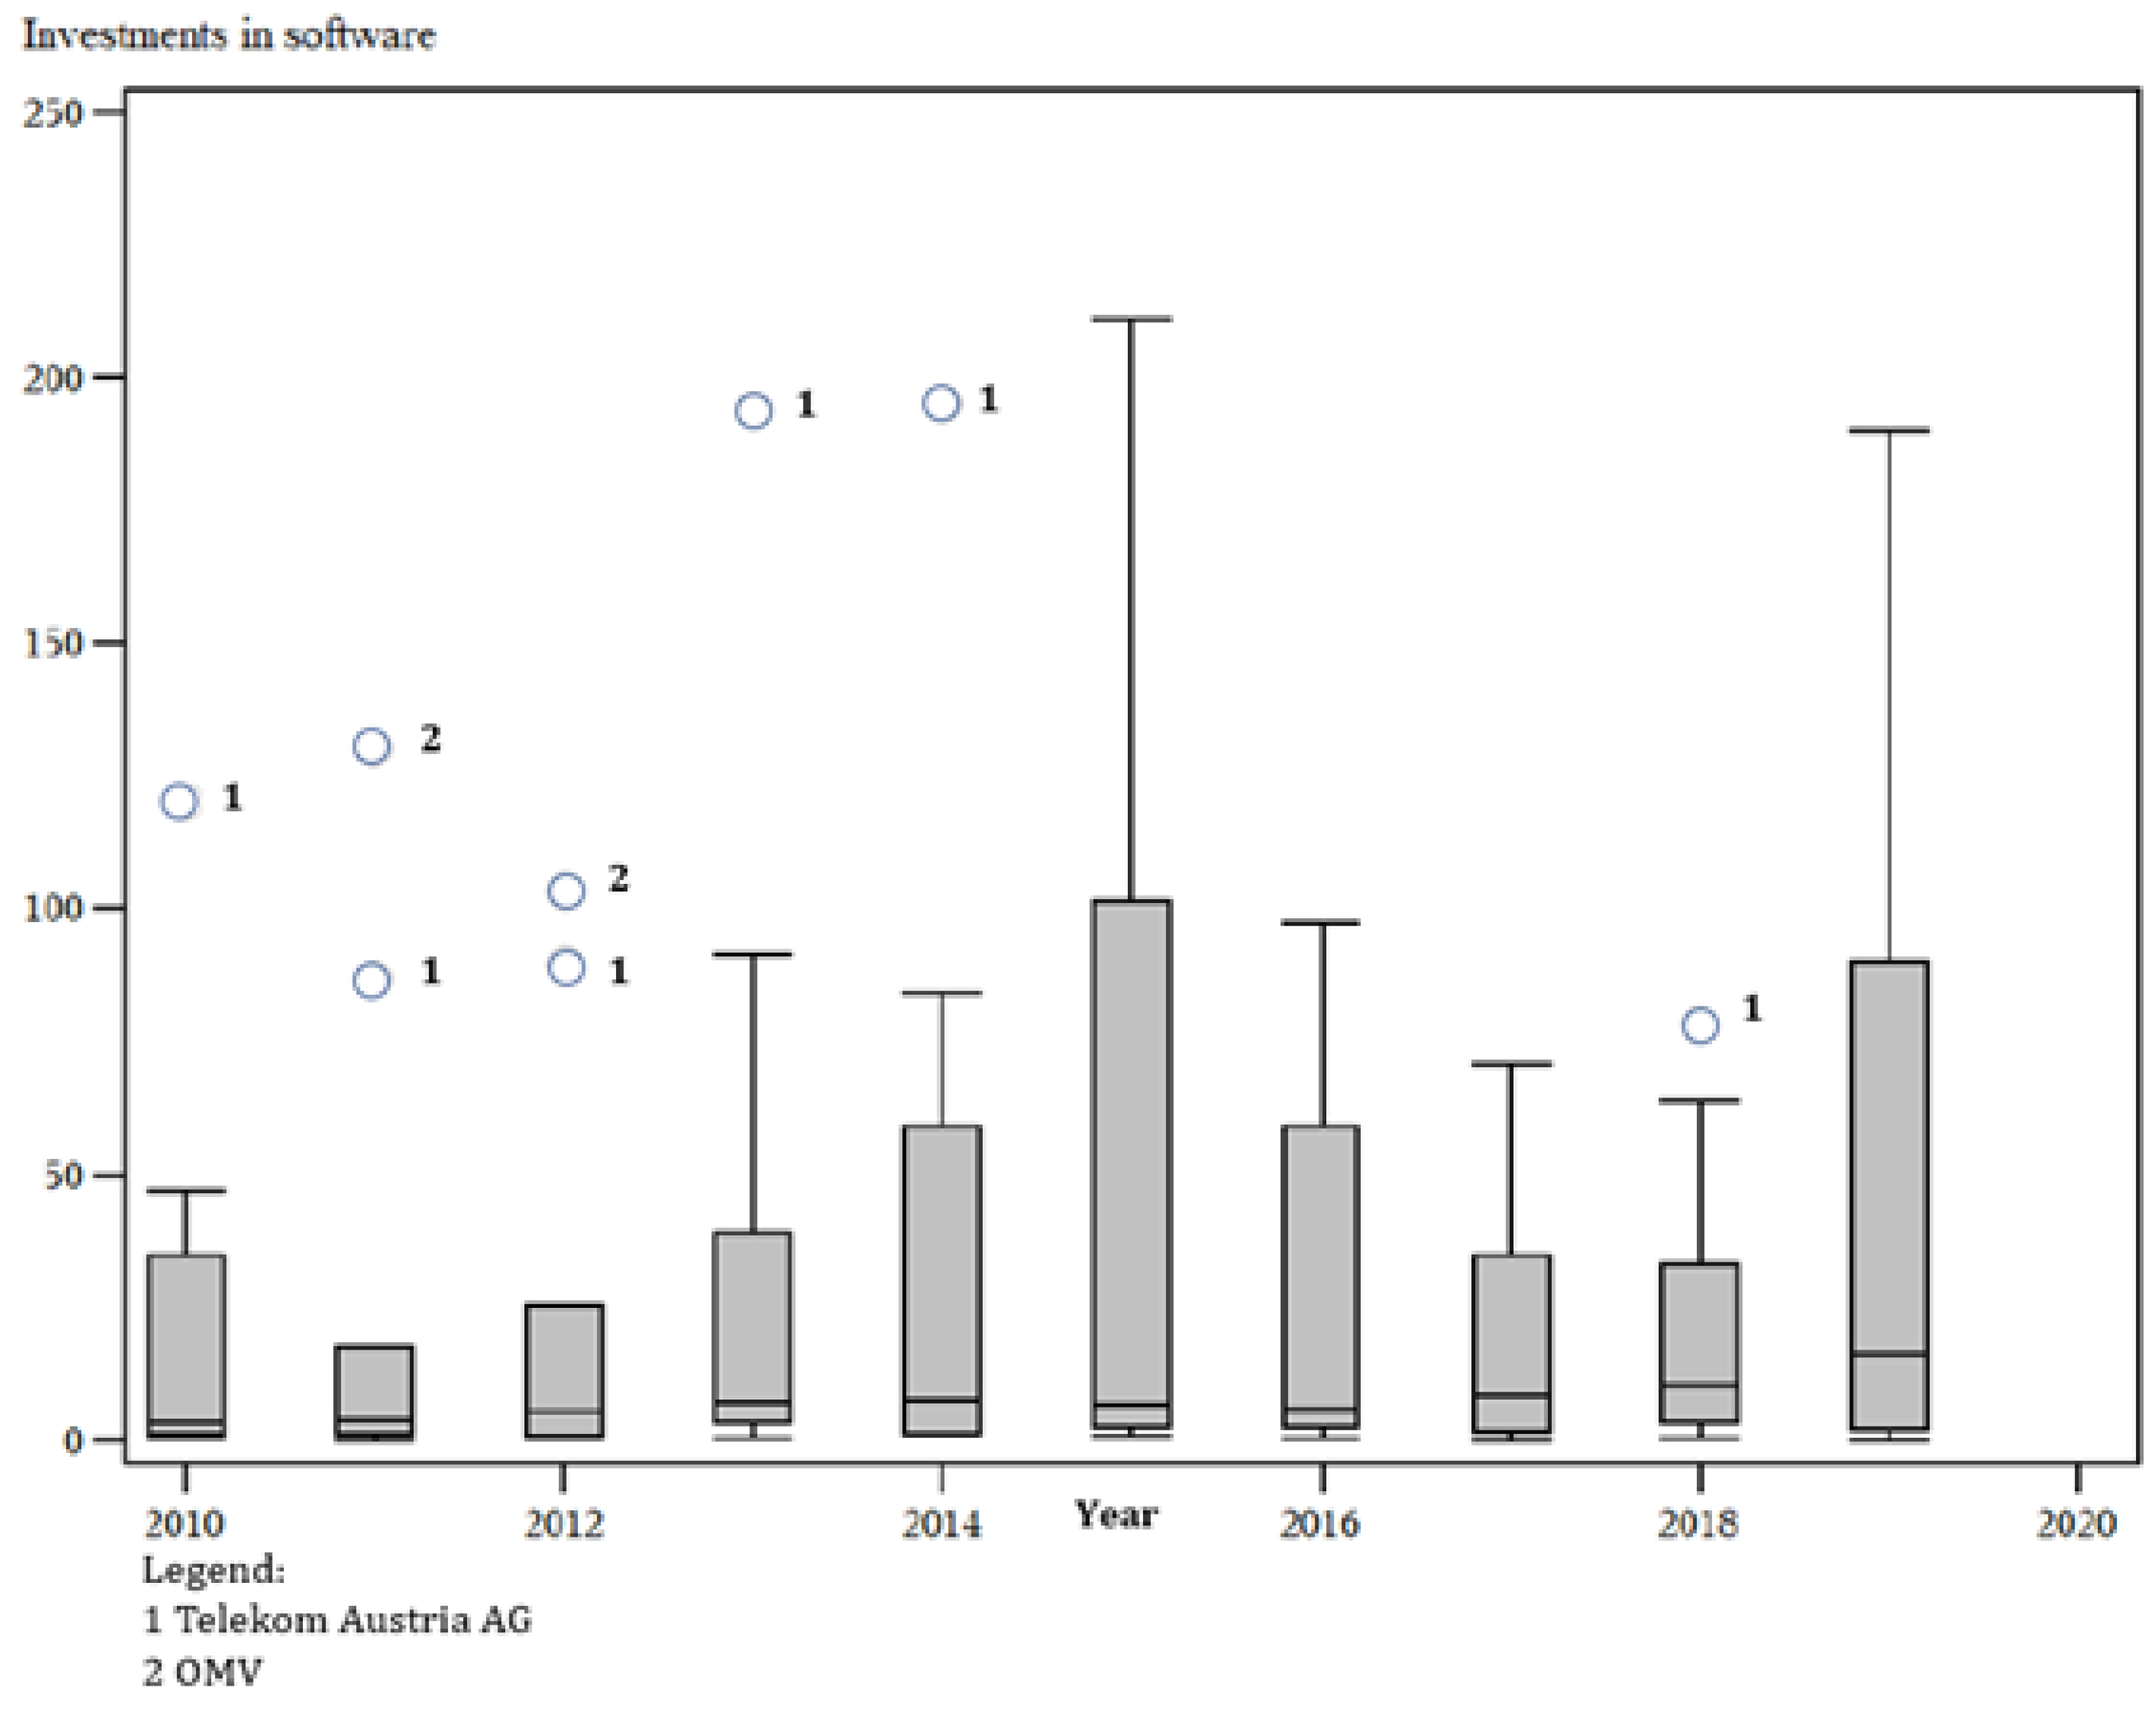
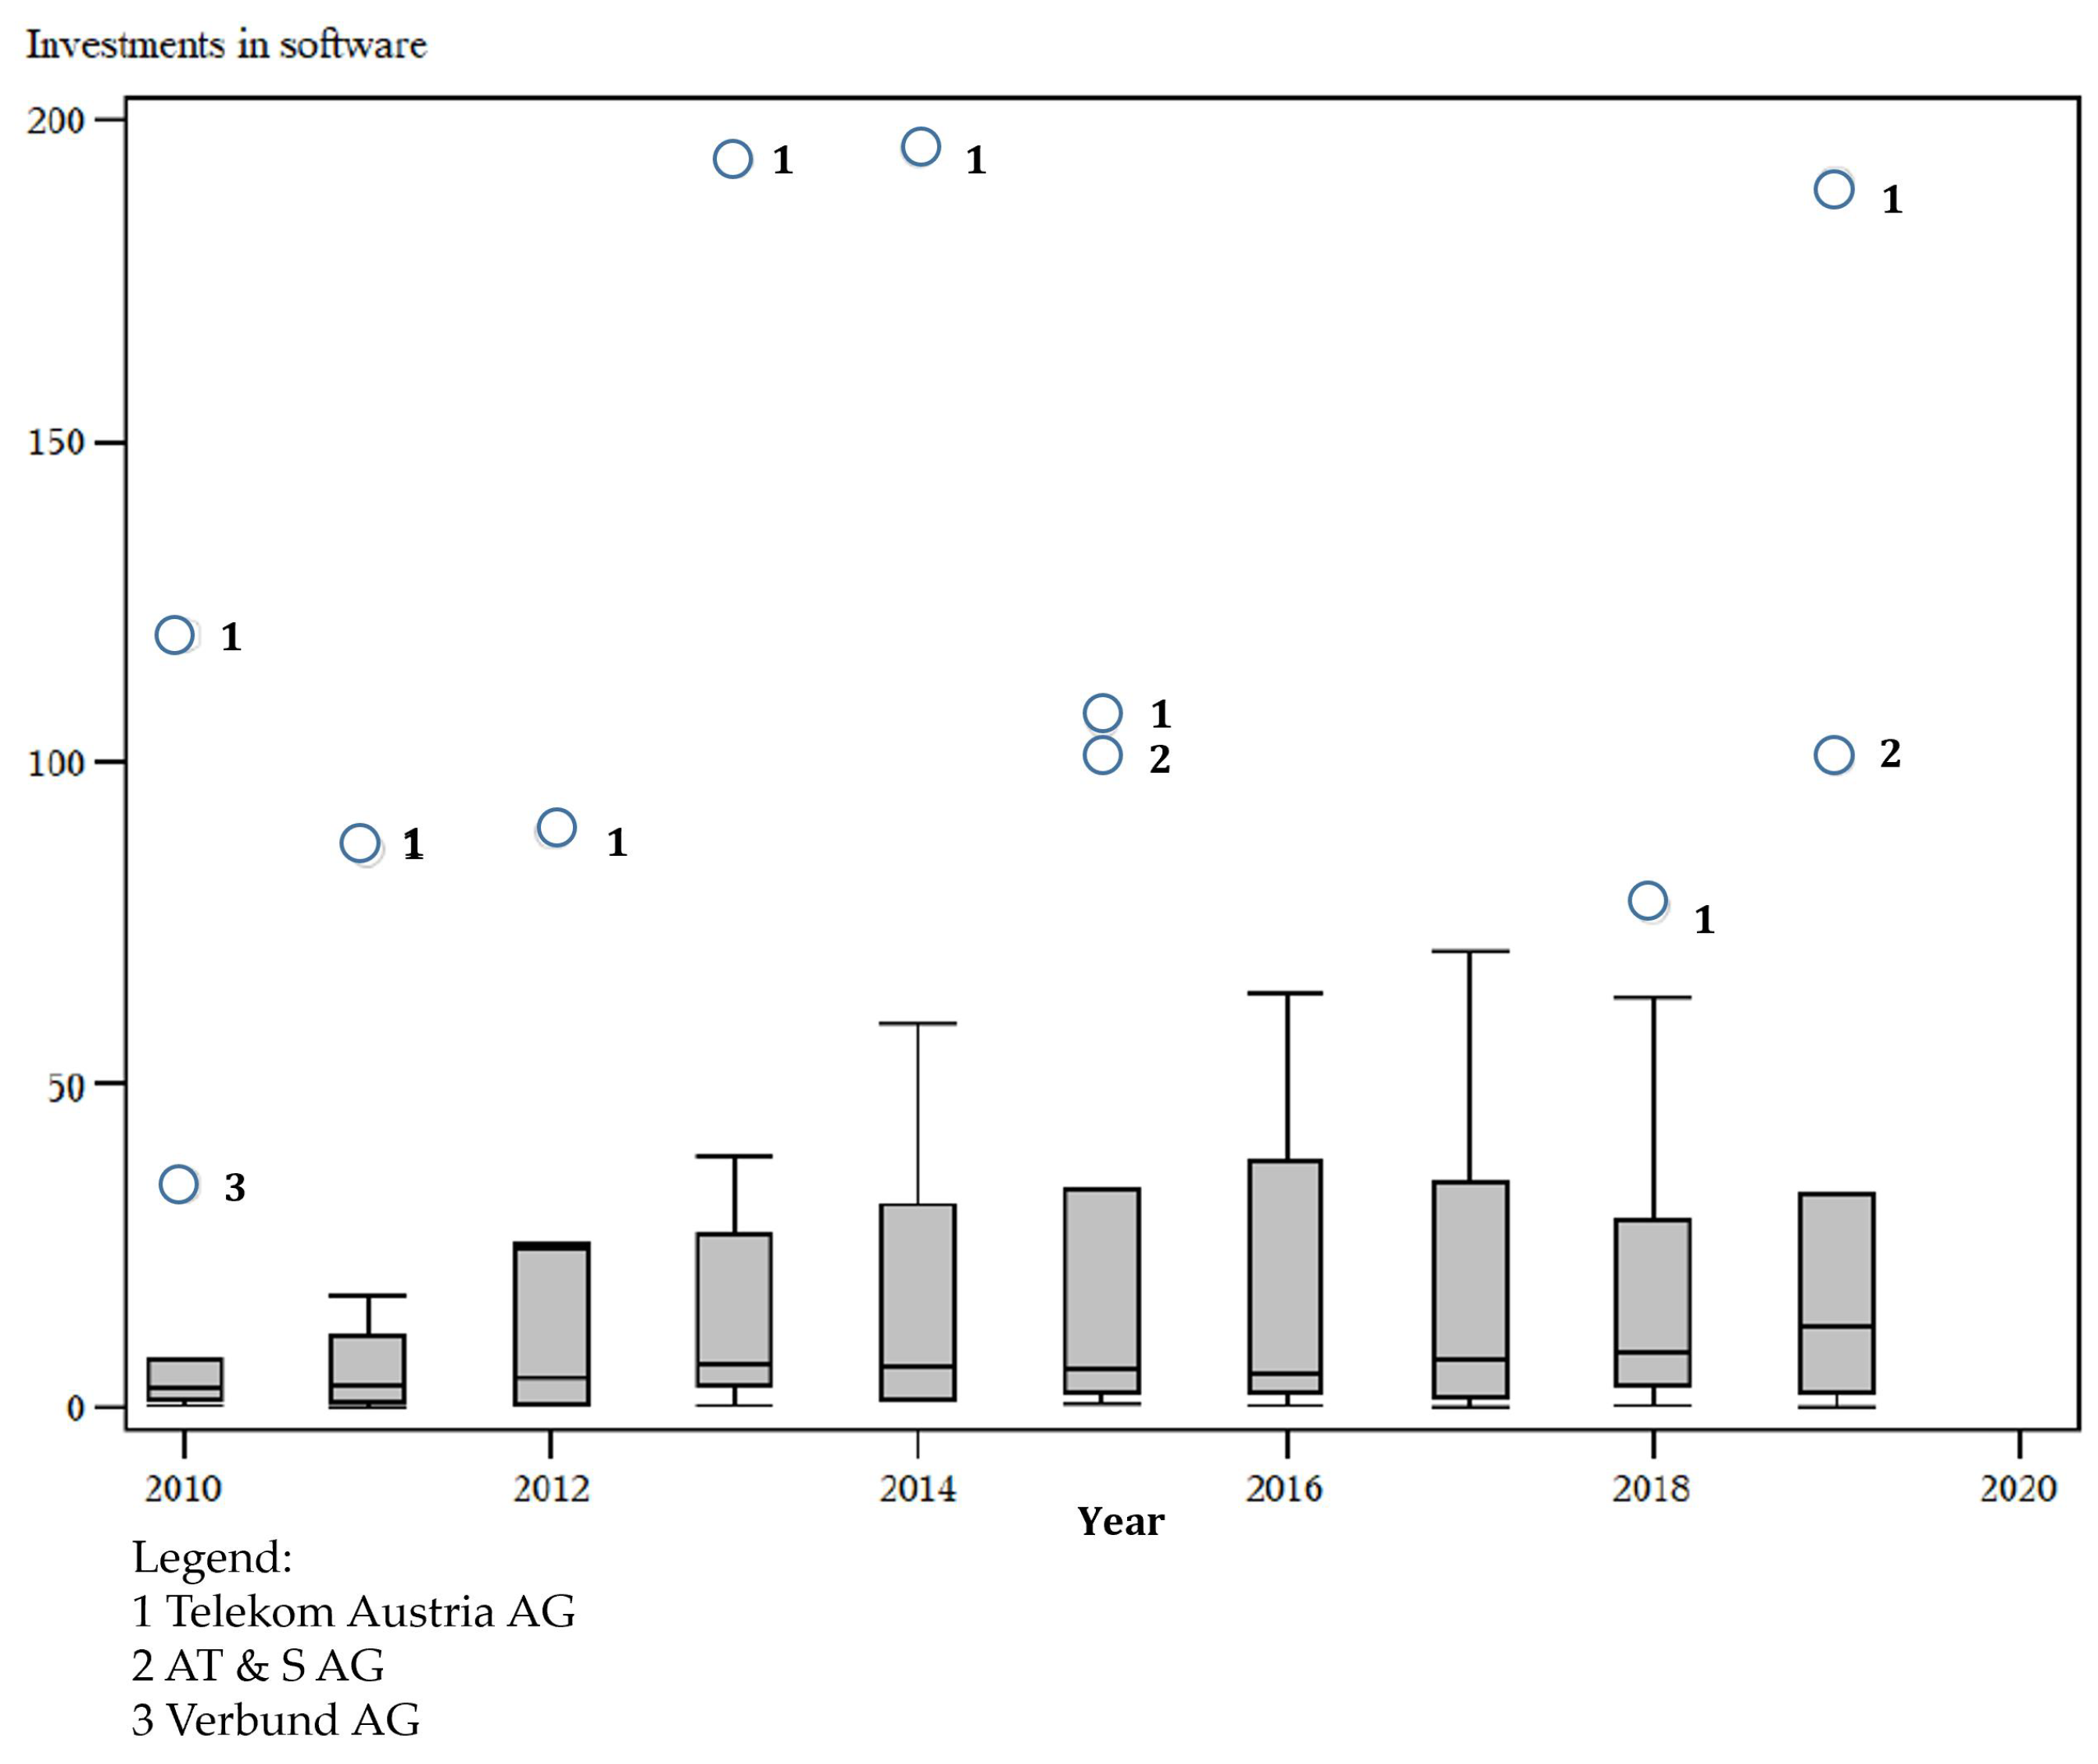
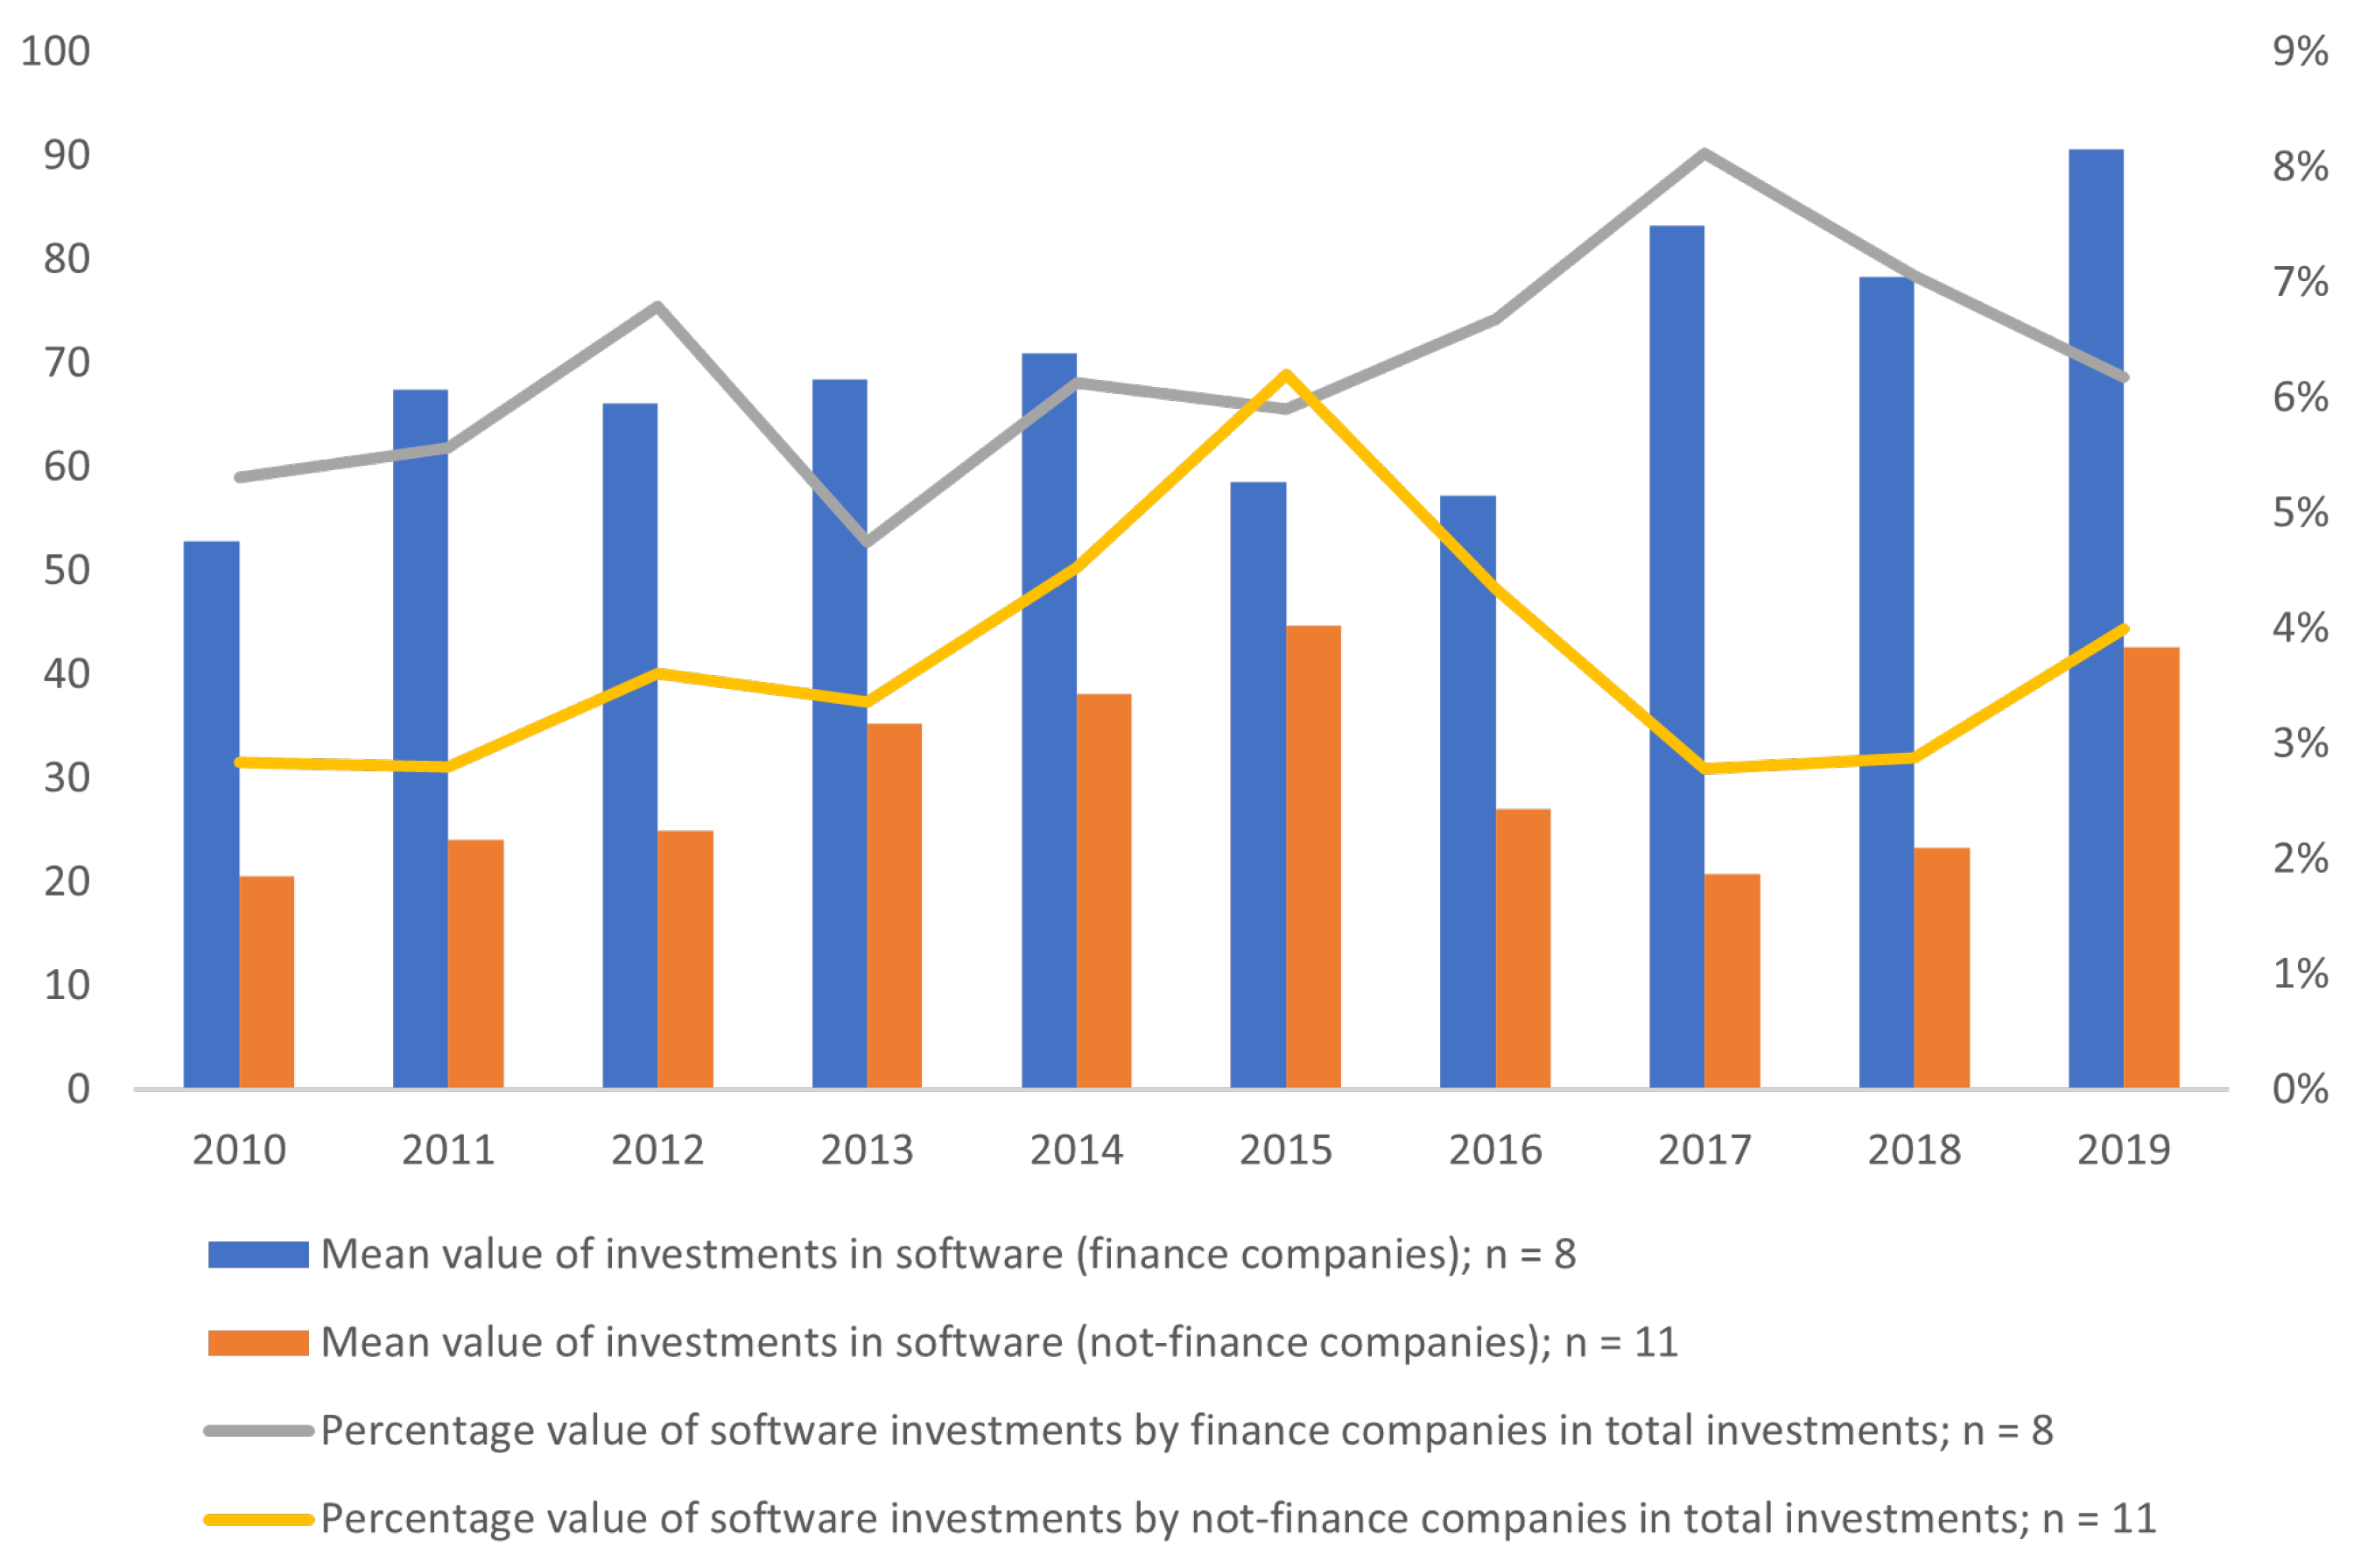
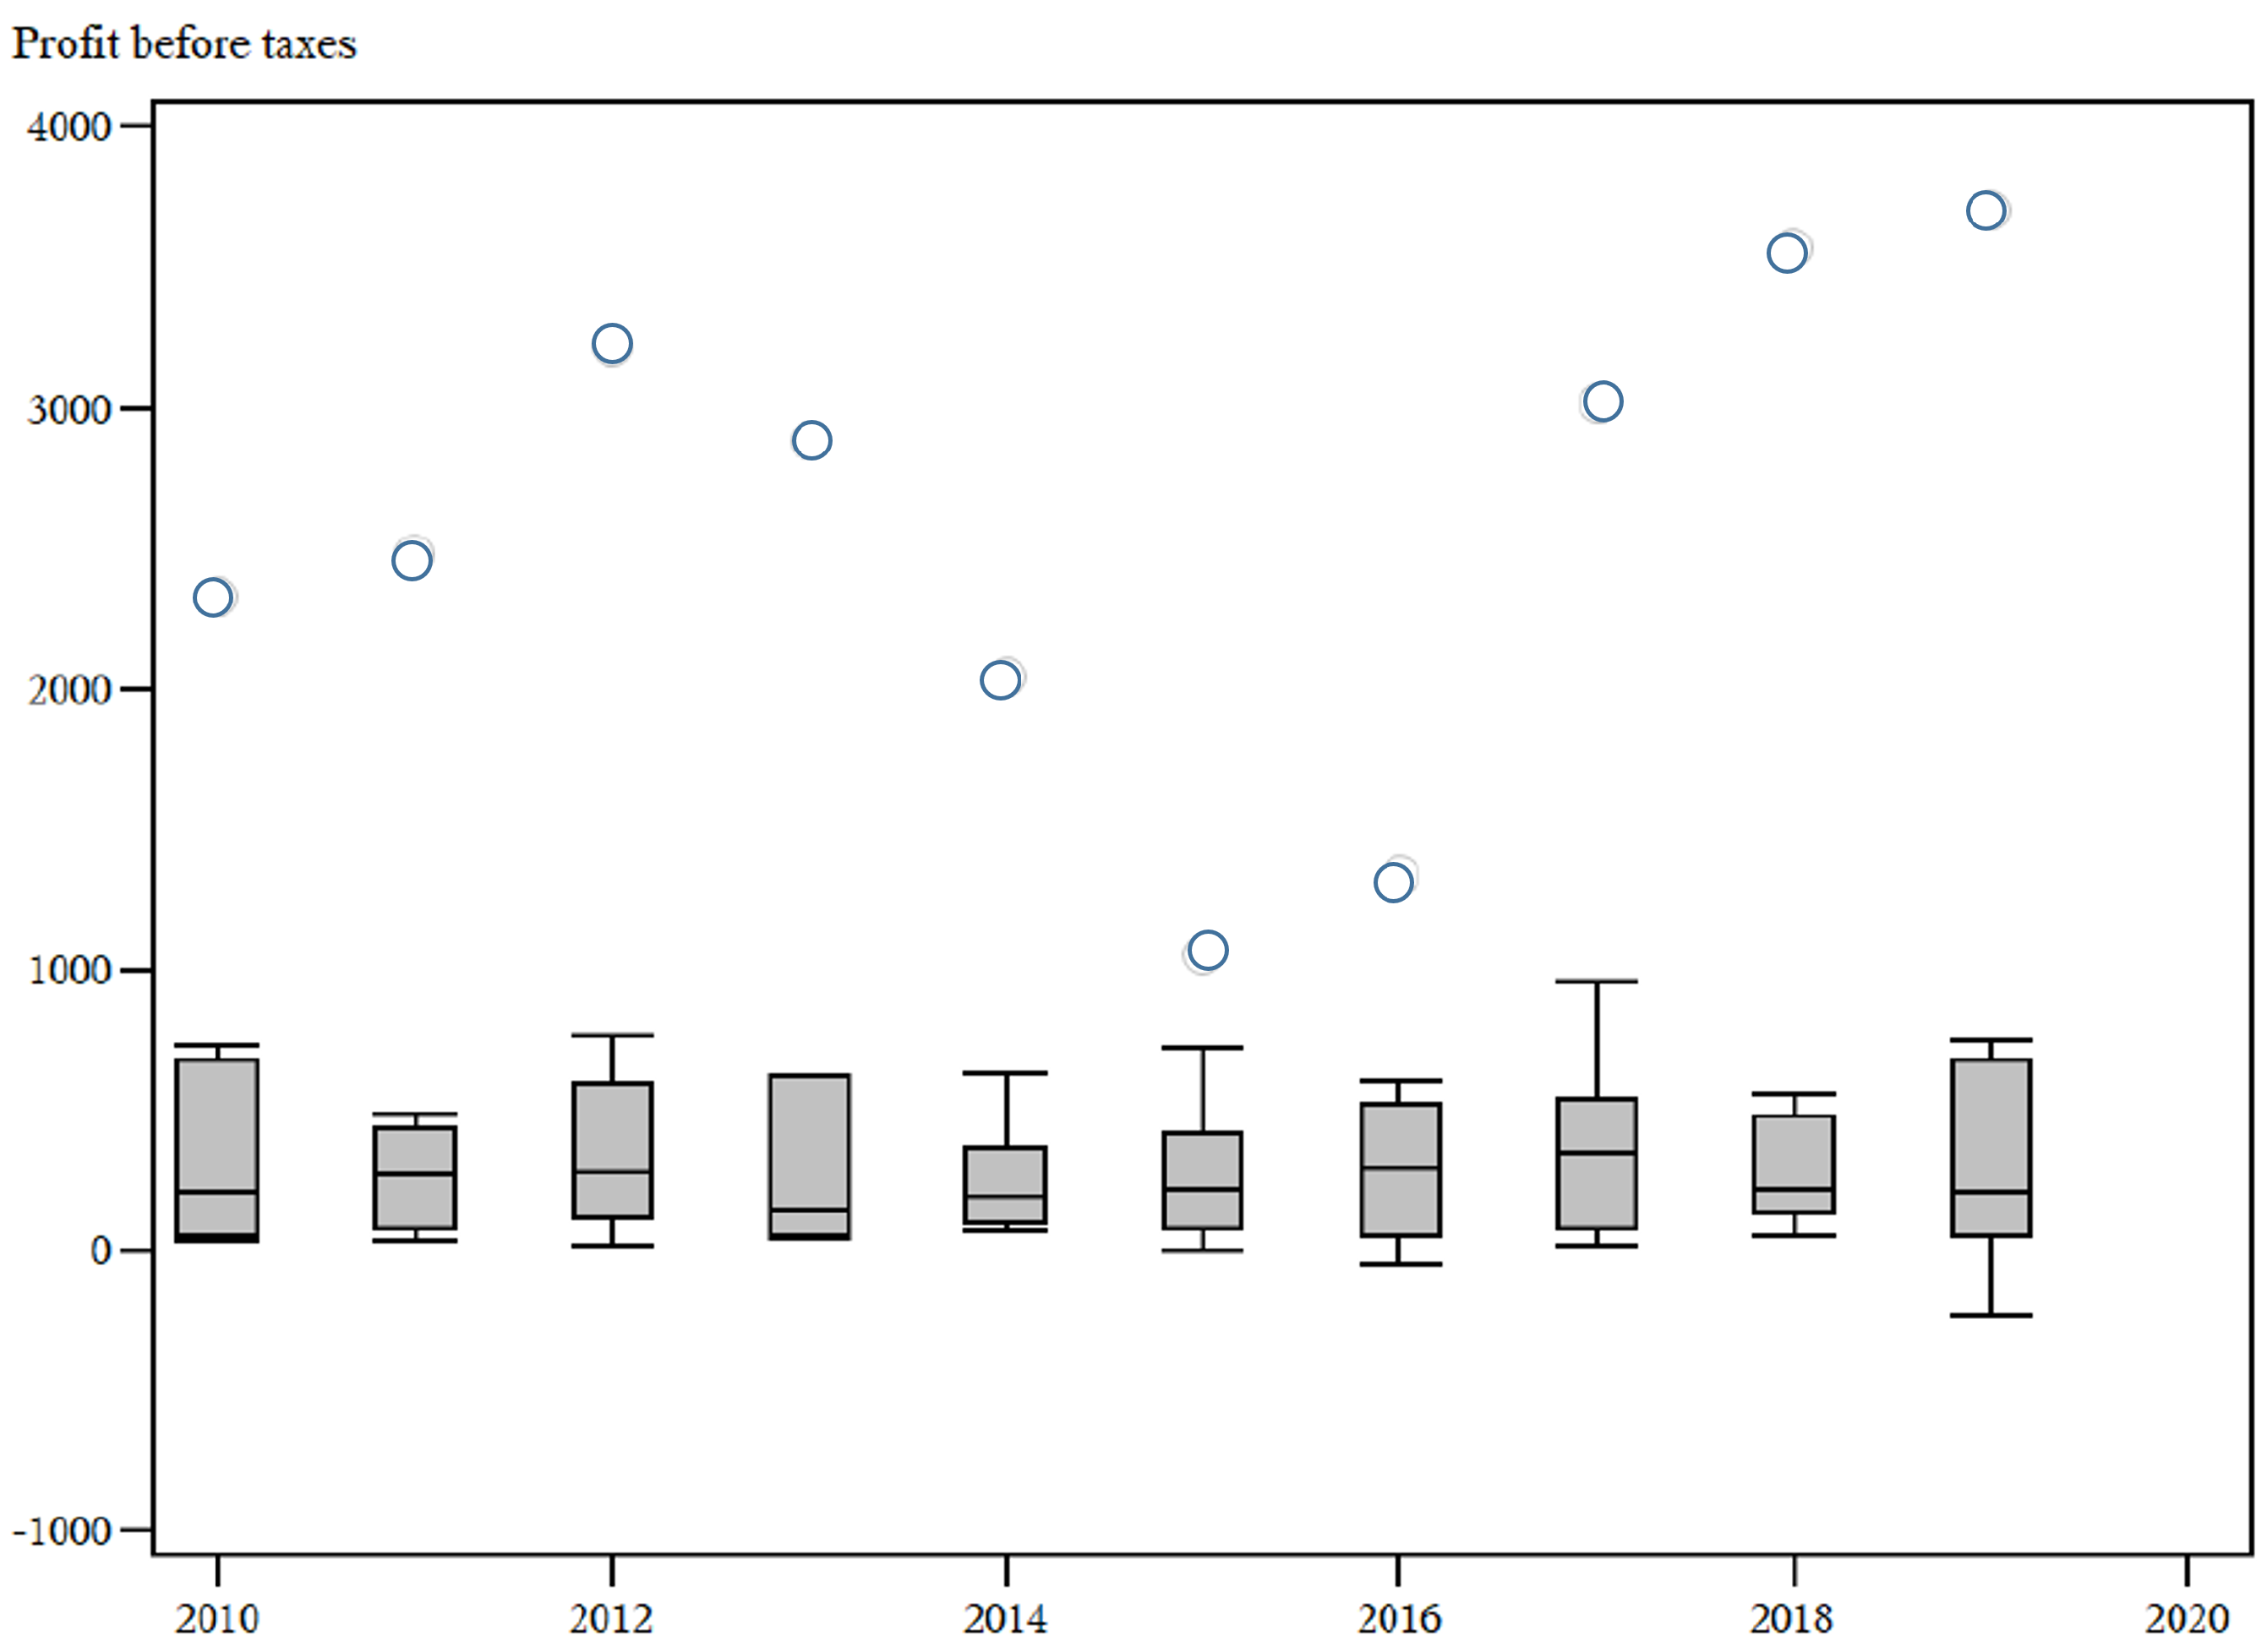
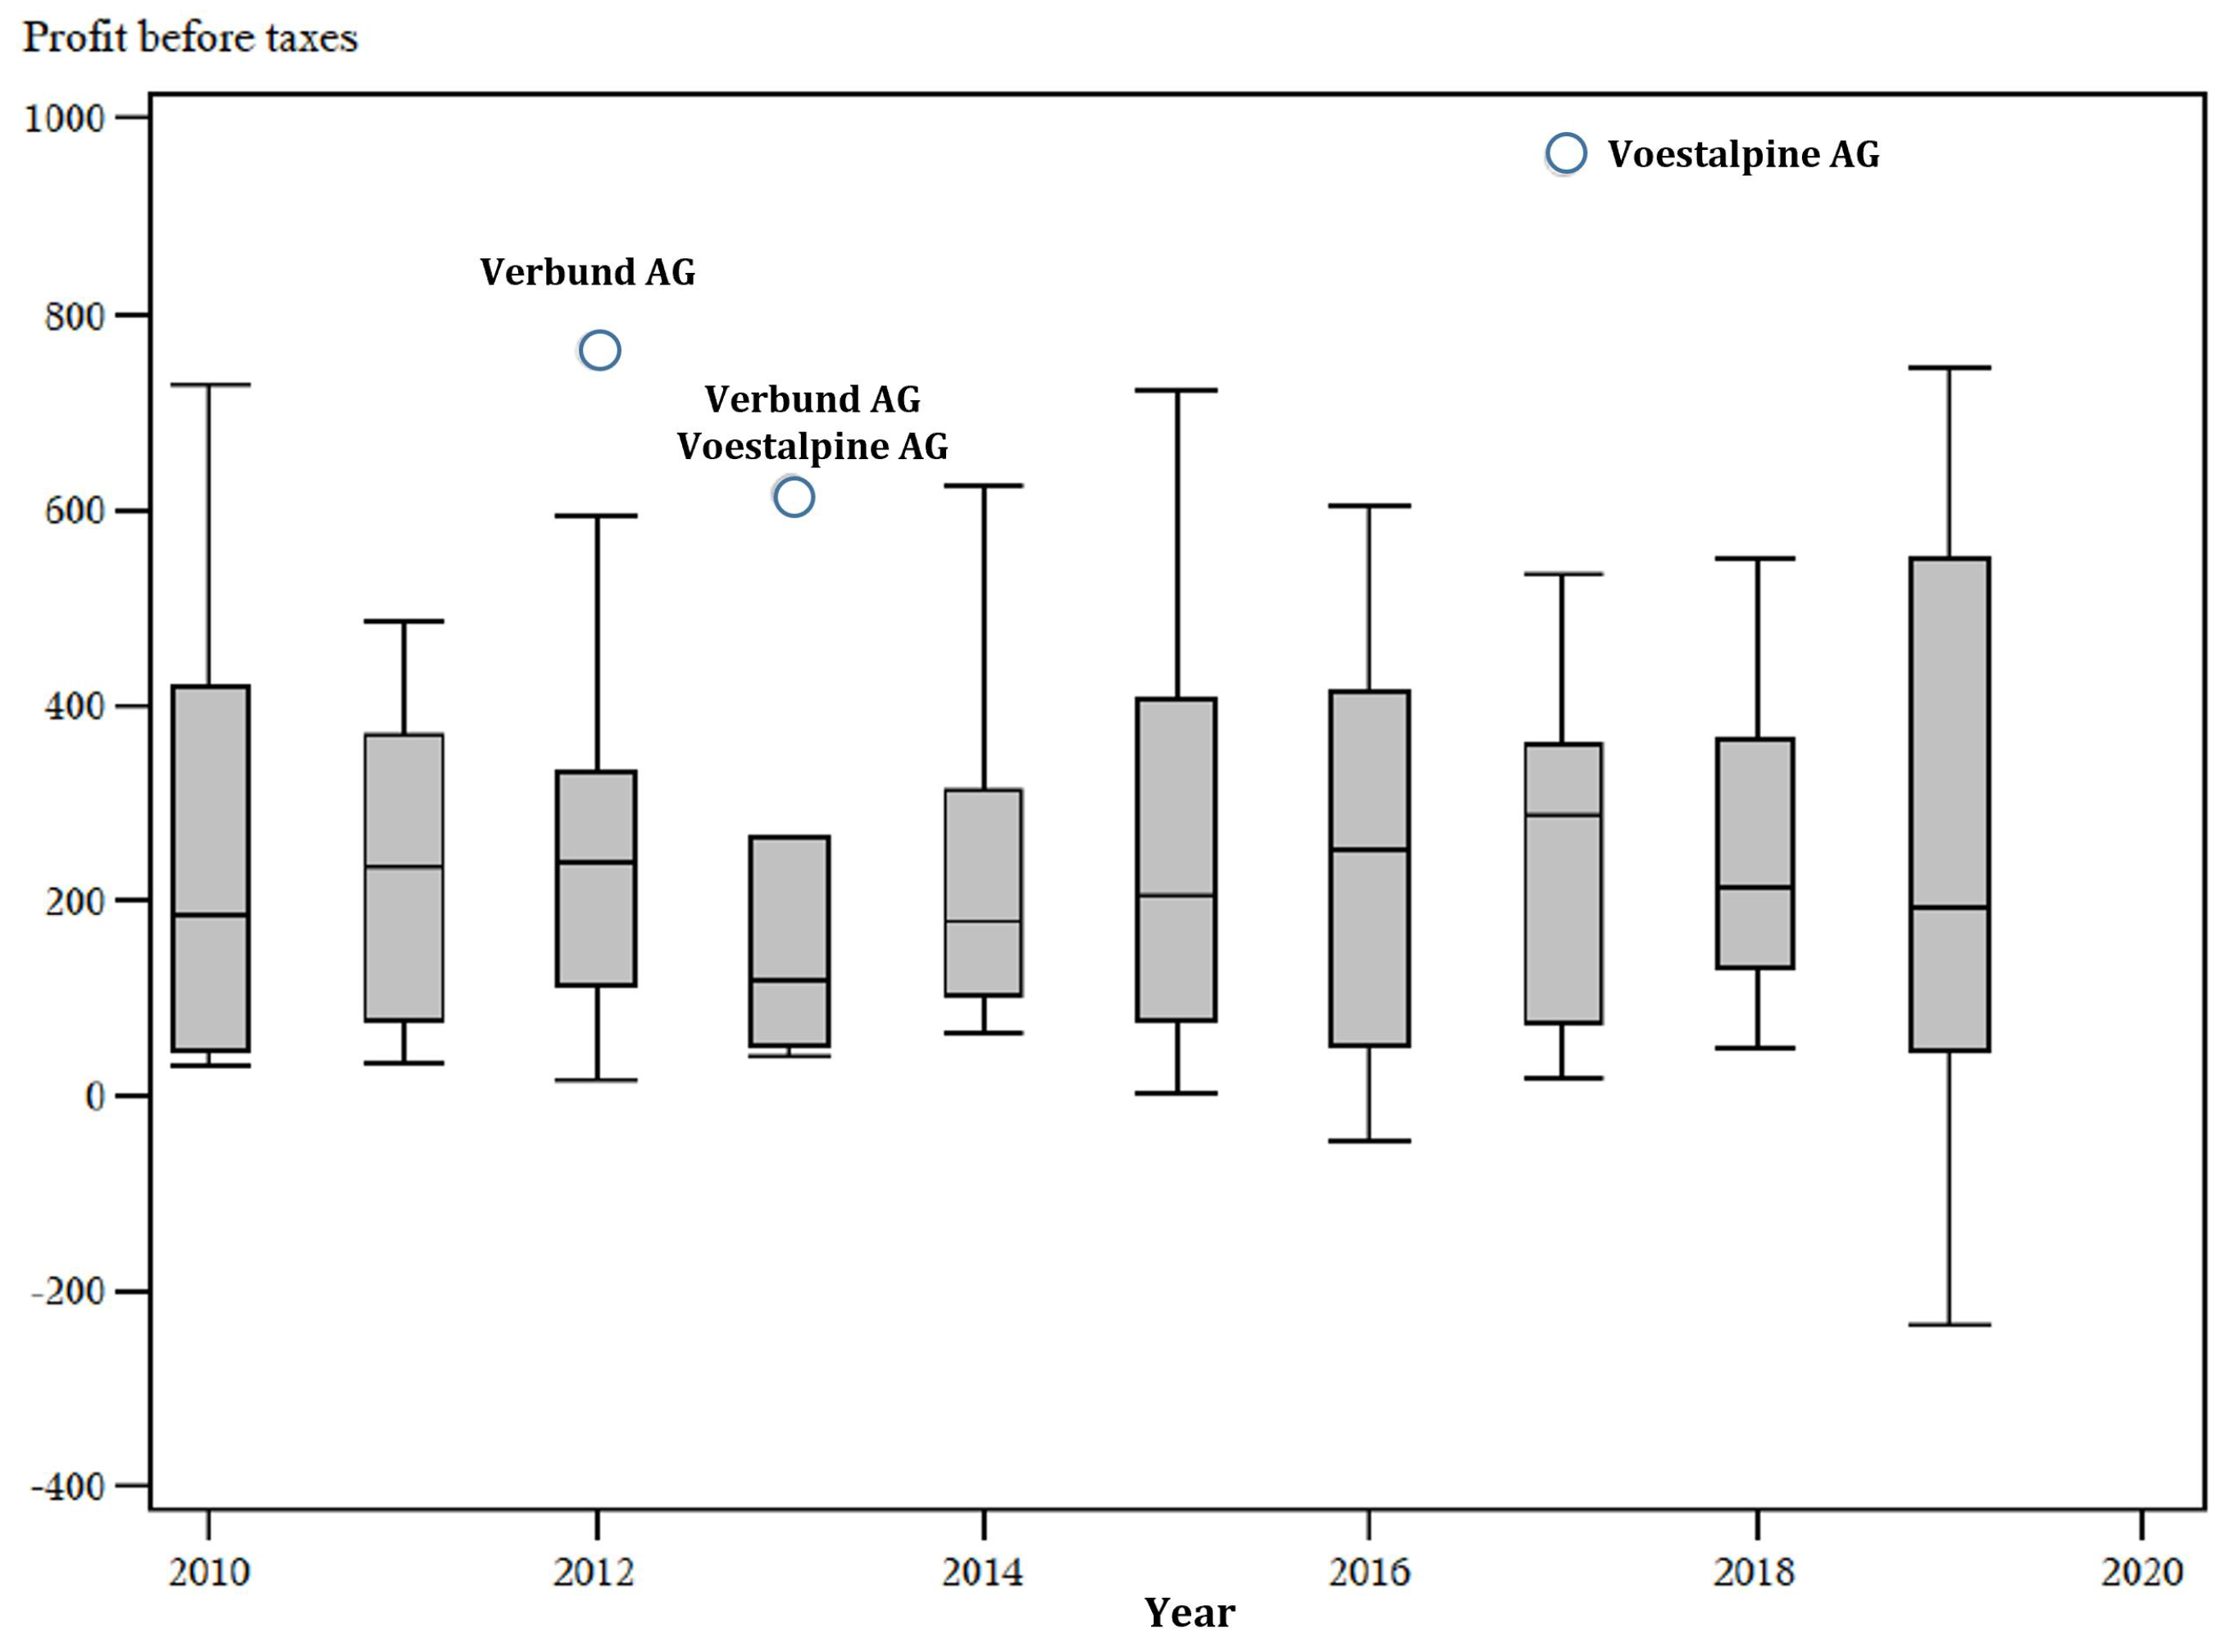
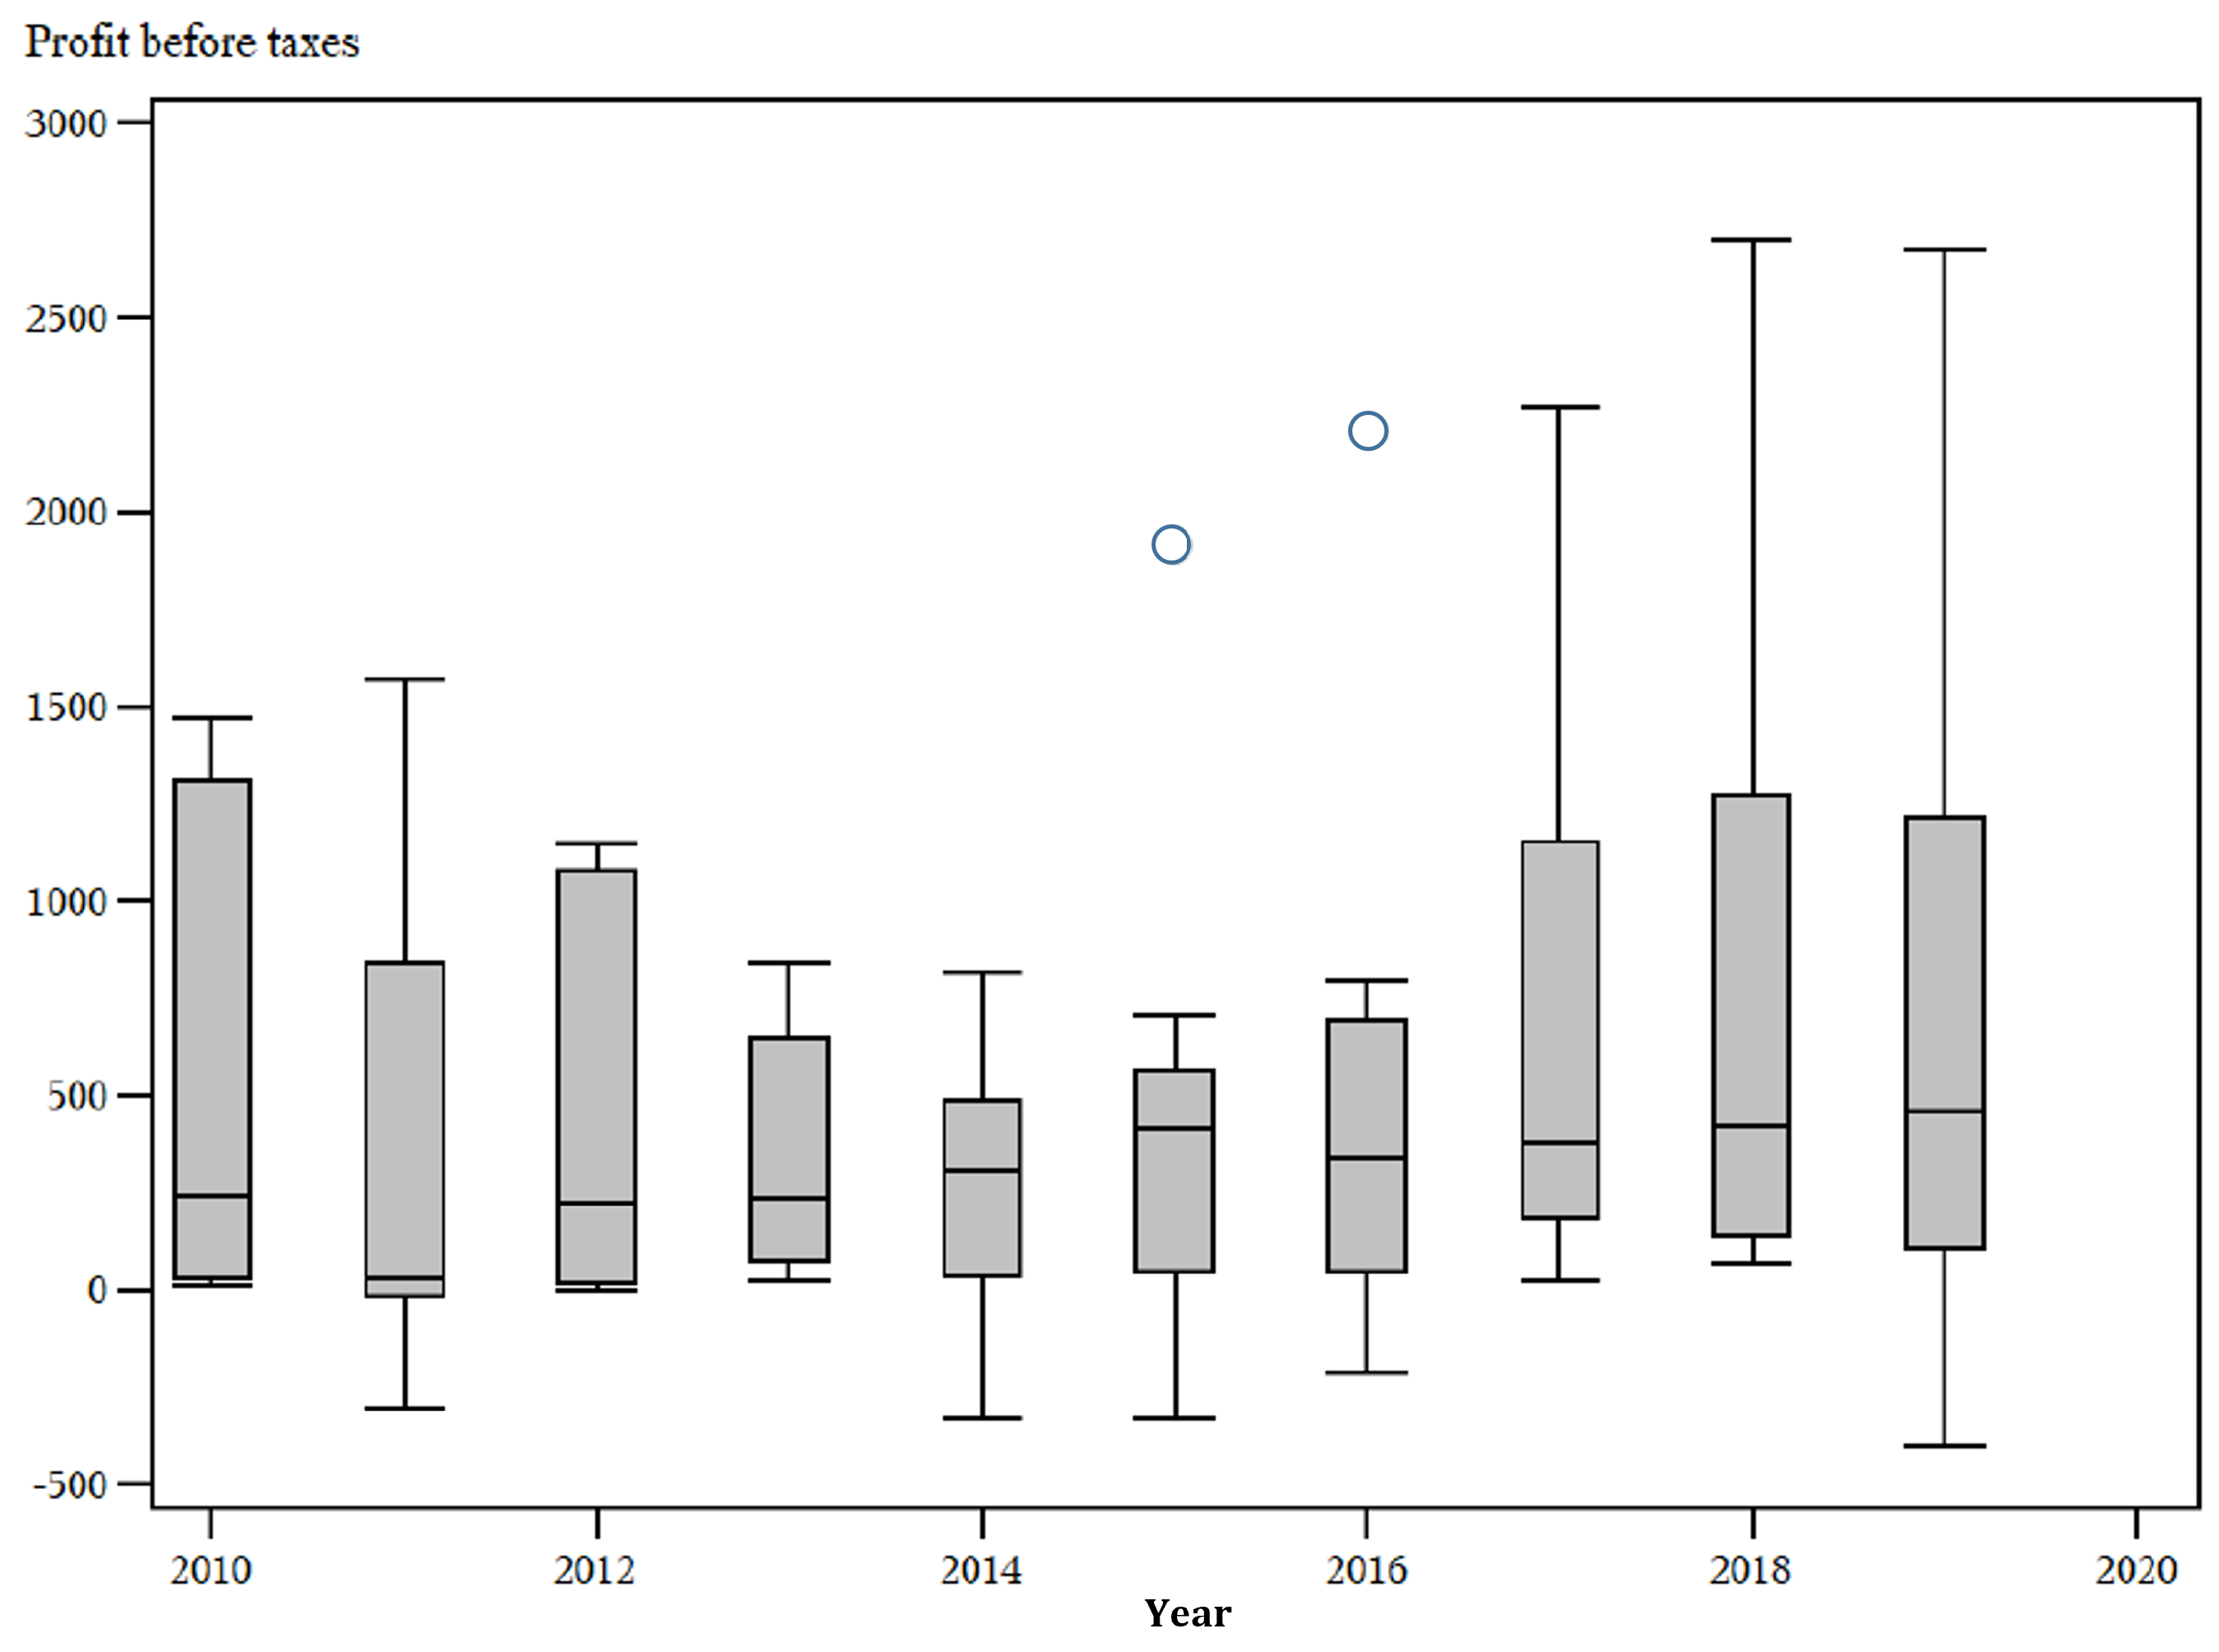
Table 1.
Classification of companies listed on the ATX Prime market by sector.
| Company | Sector | Sector Classification of the Vienna Stock Exchange |
|---|---|---|
| Andritz AG | Production technology and machinery | Industrial Goods and Services |
| AT & S Austria Technologie & Systemtechnik AG | Hardware and equipment | Technology and Telecom |
| Bawag Group AG | Banks | Finance |
| CA Immobilien Anlagen AG | Real Estate | Finance |
| DO & CO AG | Food, beverages and tobacco | Consumer Goods |
| Erste Group Bank AG | Banks | Finance |
| Immofinanz AG | Real Estate | Finance |
| Lenzing AG | Chemicals | Basic Industry |
| Mayr-Melnhof Karton AG | Packaging | Industry and Services |
| OMV AG | Oil and gas | Basic Industry |
| Österreichische Post AG | Transport | Industry and Services |
| Raiffeisen Bank International | Banks | Finance |
| S Immo AG | Real Estate | Finance |
| Schoeller-Bleckmann Oilfield Equipment AG | Oil and gas | Basic Industry |
| Telekom Austria Group | Telecommunications | Technology & Telecom |
| Uniqa Insurance Group AG | Insurance | Finance |
| Verbund AG | Electricity suppliers | Utilities |
| Vienna Insurance Group AG | Insurance | Finance |
| VOEST Alpine AG | Mining and metals | Basic Industry |
| Wienerberger AG | Building Materials | Basic Industry |
Table 2.
Number of companies listed on the ATX Prime market, aggregated by industries.
| Vienna Stock Exchange Sector Classification | Number of Companies |
|---|---|
| Finance Industry | 8 |
| Basic Industry | 5 |
| Industrial Goods and Services | 3 |
| Technology and Telecommunication | 2 |
| Consumer Goods | 1 |
| Utilities sector | 1 |
Table 3.
Median, minimum, and maximum as well as upper and lower quartiles of investments in software for each company from 2010 to 2019 (in millions of EUR; n = 19).
Table 3.
Median, minimum, and maximum as well as upper and lower quartiles of investments in software for each company from 2010 to 2019 (in millions of EUR; n = 19).
| Corporation | n | Investments in Software_Min | Investments in Software_Max | Investments in Software_Q1 | Investments in Software_Median | Investments in Software_Q3 |
|---|---|---|---|---|---|---|
| Andritz AG | 10 | 3.2 | 7.6 | 5.5 | 6.3 | 6.7 |
| AT & S | 10 | 1.0 | 101.4 | 24.7 | 61.8 | 77.9 |
| Bawag Group AG | 9 | 12.0 | 64.0 | 16.0 | 35.0 | 55.0 |
| CA Immobilien Anlagen AG | 10 | 0.2 | 0.9 | 0.3 | 0.6 | 0.8 |
| DO & CO AG | 10 | 0.1 | 5.3 | 0.4 | 0.7 | 1.8 |
| Erste Group Bank AG | 10 | 163.0 | 290.0 | 189.0 | 206.0 | 216.0 |
| Immofinanz AG | 10 | 0.0 | 3.8 | 0.0 | 1.0 | 2.1 |
| Lenzing AG | 10 | 1.0 | 9.4 | 1.4 | 2.1 | 3.2 |
| Mayr-Melnhof Karton AG | 10 | 1.2 | 3.6 | 2.2 | 3.1 | 3.4 |
| OMV AG | 10 | 9.0 | 211.0 | 47.0 | 90.5 | 103.0 |
| Österreichische Post AG | 10 | 0.6 | 16.4 | 4.9 | 6.6 | 10.5 |
| Raiffeisen Bank International | 10 | 155.9 | 226.0 | 176.0 | 199.8 | 203.4 |
| S Immo AG | 10 | 0.1 | 0.2 | 0.1 | 0.1 | 0.1 |
| Schoeller-Bleckmann | 10 | 0.1 | 3.1 | 0.2 | 0.3 | 0.7 |
| Telekom Austria Group | 10 | 59.3 | 195.3 | 70.7 | 98.1 | 190.1 |
| Uniqa Insurance Group AG | 10 | 11.5 | 90.7 | 16.4 | 22.1 | 54.0 |
| Verbund AG | 10 | 13.7 | 35.0 | 18.1 | 24.6 | 33.3 |
| Vienna Insurance Group AG | 10 | 26.6 | 131.4 | 50.8 | 80.0 | 119.2 |
| Voestalpine AG | 10 | 7.3 | 39.0 | 19.2 | 27.0 | 33.8 |
Table 4.
Investment ratio (investments in software related to sales revenues) for companies listed on the ATX Prime market; values above 2% are marked in red.
Table 4.
Investment ratio (investments in software related to sales revenues) for companies listed on the ATX Prime market; values above 2% are marked in red.
| Corporation/Year | 2019 | 2018 | 2017 | 2016 | 2015 | 2014 | 2013 | 2012 | 2011 | 2010 |
|---|---|---|---|---|---|---|---|---|---|---|
| Andritz AG | 0.10% | 0.11% | 0.11% | 0.10% | 0.10% | 0.13% | 0.11% | 0.11% | 0.08% | 0.09% |
| AT & S | 10.06% | 7.58% | 6.77% | 7.88% | 13.29% | 8.91% | 4.58% | 4.56% | 0.19% | 0.20% |
| Bawag Group AG | 3.50% | 3.42% | 3.78% | 3.76% | 1.83% | 2.40% | 0.99% | |||
| CA Immobilien Anlagen AG | 0.17% | 0.10% | 0.10% | 0.24% | 0.41% | 0.35% | 0.29% | 0.19% | 0.08% | 0.06% |
| DO & CO AG | 0.04% | 0.05% | 0.07% | 0.20% | 0.25% | 0.16% | 0.83% | 0.12% | 0.02% | 0.07% |
| Erste Group Bank AG | 2.30% | 2.22% | 3.35% | 2.16% | 2.39% | 2.18% | 2.19% | 1.44% | 1.77% | 1.49% |
| Immofinanz AG | 0.00% | 0.35% | 0.00% | 0.00% | 0.07% | 0.37% | 0.22% | 0.08% | 0.14% | 0.47% |
| Lenzing AG | 0.45% | 0.15% | 0.16% | 0.11% | 0.05% | 0.07% | 0.08% | 0.16% | 0.07% | 0.10% |
| Mayr-Melnhof Karton AG | 0.09% | 0.14% | 0.06% | 0.13% | 0.17% | 0.15% | 0.17% | 0.18% | 0.15% | 0.07% |
| OMV AG | 0.38% | 0.14% | 0.04% | 0.50% | 0.94% | 0.23% | 0.21% | 0.24% | 0.38% | 0.20% |
| Österreichische Post AG | 0.81% | 0.54% | 0.42% | 0.24% | 0.23% | 0.20% | 0.30% | 0.03% | 0.47% | 0.26% |
| Raiffeisen Bank International | 2.90% | 2.55% | 2.77% | 2.58% | 2.23% | 2.54% | 2.58% | 2.42% | 2.38% | 2.39% |
| S Immo AG | 0.05% | 0.05% | 0.05% | 0.04% | 0.05% | 0.10% | 0.03% | 0.03% | 0.02% | 0.06% |
| Schoeller-Bleckmann | 0.02% | 0.07% | 0.03% | 0.22% | 0.22% | 0.25% | 0.04% | 0.04% | 0.05% | 1.01% |
| Telekom Austria Group | 4.16% | 1.43% | 1.61% | 1.41% | 2.59% | 4.86% | 4.63% | 2.06% | 1.94% | 2.58% |
| Uniqa Insurance Group AG | 1.39% | 1.71% | 1.03% | 0.43% | 0.41% | 0.71% | 0.20% | 0.34% | 0.28% | 0.27% |
| Verbund AG | 0.85% | 1.10% | 1.20% | 0.71% | 0.66% | 1.03% | 0.43% | 0.57% | 0.58% | 1.06% |
| Vienna Insurance Group AG | 1.19% | 0.73% | 0.58% | 0.41% | 0.54% | 1.24% | 1.16% | 1.26% | 0.95% | 0.29% |
| Voestalpine AG | 0.15% | 0.20% | 0.20% | 0.34% | 0.31% | 0.28% | 0.35% | 0.22% | 0.09% | 0.07% |
Table 5.
Median, minimum, and maximum as well as upper and lower quartiles of profit before taxes for each company from 2010 to 2019 (in millions of EUR; n = 19).
Table 5.
Median, minimum, and maximum as well as upper and lower quartiles of profit before taxes for each company from 2010 to 2019 (in millions of EUR; n = 19).
| Corporation | n | Profit before Taxes_Min | Profit before Taxes_Max | Profit before Taxes_Q1 | Profit before Taxes_Median | Profit before Taxes_Q3 |
|---|---|---|---|---|---|---|
| Andritz AG | 10 | 91.60 | 676.46 | 313.57 | 327.43 | 407.61 |
| AT & S | 10 | −10.83 | 132.60 | 32.98 | 53.58 | 76.38 |
| Bawag Group AG | 7 | 182.20 | 642.40 | 318.90 | 588.30 | 624.10 |
| CA Immobilien Anlagen AG | 10 | −401.85 | 199.08 | 28.32 | 50.47 | 77.58 |
| DO & CO AG | 10 | 26.09 | 62.74 | 38.74 | 46.90 | 50.29 |
| Erste Group Bank AG | 10 | 809.62 | 2698.37 | 838.67 | 1691.49 | 2269.60 |
| Immofinanz AG | 10 | −331.19 | 238.24 | −210.26 | 53.95 | 163.39 |
| Lenzing AG | 10 | 39.23 | 369.50 | 166.28 | 211.62 | 293.73 |
| Mayr-Melnhof Karton AG | 10 | 143.83 | 256.08 | 161.43 | 179.88 | 209.97 |
| OMV AG | 10 | 1056.00 | 3711.00 | 2045.00 | 2684.42 | 3226.41 |
| Österreichische Post AG | 10 | 105.10 | 229.80 | 190.40 | 200.65 | 211.40 |
| Raiffeisen Bank International | 10 | 296.77 | 1949.46 | 796.01 | 1194.32 | 1657.03 |
| S Immo AG | 10 | 2.97 | 68.16 | 15.51 | 24.27 | 29.50 |
| Schoeller-Bleckmann | 10 | −47.83 | 113.42 | 18.33 | 52.49 | 89.79 |
| Telekom Austria Group | 10 | 245.00 | 550.59 | 266.30 | 349.81 | 399.86 |
| Uniqa Insurance Group AG | 10 | −305.31 | 417.10 | 224.84 | 276.67 | 297.73 |
| Verbund AG | 10 | 361.78 | 763.05 | 474.03 | 528.96 | 680.28 |
| Vienna Insurance Group AG | 10 | 422.90 | 630.81 | 488.47 | 529.11 | 596.49 |
| Voestalpine AG | 10 | −236.70 | 960.60 | 551.10 | 610.76 | 723.00 |
Table 6.
Minimum, maximum, and median of investments in software and profit before taxes for each company listed on the ATX Prime market for the period 2010 to 2019 allocated to finance and non-finance entities (in total n = 19; finance companies n = 8; non-finance companies n = 11).
Table 6.
Minimum, maximum, and median of investments in software and profit before taxes for each company listed on the ATX Prime market for the period 2010 to 2019 allocated to finance and non-finance entities (in total n = 19; finance companies n = 8; non-finance companies n = 11).
| Corporation | Investments in Software_Min | Investments in Software_Max | Investments in Software_Median | Profit before Taxes_Min | Profit before Taxes_Max | Profit before Taxes_Median |
|---|---|---|---|---|---|---|
| Bawag Group AG | 16.00 | 64.00 | 35.00 | 182.20 | 642.40 | 588.30 |
| CA Immobilien Anlagen AG | 0.20 | 0.90 | 0.55 | −401.85 | 199.08 | 50.47 |
| Erste Group Bank AG | 163.00 | 290.00 | 206.00 | 809.62 | 2698.37 | 1691.49 |
| Immofinanz AG | 0.00 | 3.80 | 1.00 | −331.19 | 238.24 | 53.95 |
| Raiffeisen Bank International | 155.90 | 226.00 | 199.75 | 296.77 | 1949.46 | 1194.32 |
| S Immo AG | 0.05 | 0.20 | 0.10 | 2.97 | 68.16 | 24.27 |
| Uniqa Insurance Group AG | 11.50 | 90.70 | 22.10 | −305.31 | 417.10 | 276.67 |
| Vienna Insurance Group AG | 26.60 | 131.40 | 80.00 | 422.90 | 630.81 | 529.11 |
| AT & S | 1.00 | 101.40 | 61.80 | −10.83 | 132.60 | 53.58 |
| Andritz AG | 3.20 | 7.60 | 6.25 | 91.60 | 676.46 | 327.43 |
| DO & CO AG | 0.10 | 5.30 | 0.65 | 26.09 | 62.74 | 46.90 |
| Lenzing AG | 1.00 | 9.40 | 2.10 | 39.23 | 369.50 | 211.62 |
| Mayr-Melnhof Karton AG | 1.20 | 3.60 | 3.05 | 143.83 | 256.08 | 179.88 |
| OMV AG | 9.00 | 211.00 | 90.50 | 1056.00 | 3711.00 | 2684.42 |
| Schoeller-Bleckmann | 0.10 | 3.10 | 0.25 | −47.83 | 113.42 | 52.49 |
| Telekom Austria Group | 59.30 | 195.30 | 98.05 | 245.00 | 550.59 | 349.81 |
| Verbund AG | 13.70 | 35.00 | 24.60 | 361.78 | 763.05 | 528.96 |
| Voestalpine AG | 7.30 | 39.00 | 26.95 | −236.70 | 960.60 | 610.76 |
| Österreichische Post AG | 0.60 | 16.40 | 6.60 | 105.10 | 229.80 | 200.65 |
Table 7.
Regression analysis of panel data from all ATX Prime market-listed companies; Model: Fixed two-way estimates; dependent variable: profit before taxes.
Table 7.
Regression analysis of panel data from all ATX Prime market-listed companies; Model: Fixed two-way estimates; dependent variable: profit before taxes.
| Parameter Estimators | ||||||
|---|---|---|---|---|---|---|
| Variable | DF | Estimated Value | Standard Error | t-Value | Pr > |t| | Label |
| CS1 | 1 | −125.769 | 147.4 | −0.85 | 0.3947 | Cross Sectional Effect 1 |
| CS2 | 1 | 154.3641 | 140.5 | 1.10 | 0.2735 | Cross Sectional Effect 2 |
| CS3 | 1 | 287.7391 | 159.1 | 1.81 | 0.0724 | Cross Sectional Effect 3 |
| CS4 | 1 | −172.122 | 140.6 | −1.22 | 0.2228 | Cross Sectional Effect 4 |
| CS5 | 1 | −150.641 | 140.6 | −1.07 | 0.2856 | Cross Sectional Effect 5 |
| CS6 | 1 | 1540.494 | 243.5 | 6.33 | <.0001 | Cross Sectional Effect 6 |
| CS7 | 1 | −202.042 | 140.6 | −1.44 | 0.1527 | Cross Sectional Effect 7 |
| CS8 | 1 | 25.55754 | 140.5 | 0.18 | 0.8559 | Cross Sectional Effect 8 |
| CS9 | 1 | −7.23489 | 140.5 | −0.05 | 0.9590 | Cross Sectional Effect 9 |
| CS10 | 1 | 2395.275 | 162.4 | 14.75 | <.0001 | Cross Sectional Effect 10 |
| CS11 | 1 | 1052.018 | 231.3 | 4.55 | <.0001 | Cross Sectional Effect 11 |
| CS12 | 1 | −164.788 | 140.7 | −1.19 | 0.2347 | Cross Sectional Effect 12 |
| CS13 | 1 | −144.794 | 140.6 | −1.03 | 0.3048 | Cross Sectional Effect 13 |
| CS14 | 1 | 186.263 | 177.9 | 1.05 | 0.2968 | Cross Sectional Effect 14 |
| CS15 | 1 | 42.5982 | 143.6 | 0.30 | 0.7671 | Cross Sectional Effect 15 |
| CS16 | 1 | 370.7036 | 141.5 | 2.62 | 0.0097 | Cross Sectional Effect 16 |
| CS17 | 1 | 353.8705 | 158.8 | 2.23 | 0.0273 | Cross Sectional Effect 17 |
| CS18 | 1 | 371.6934 | 141.6 | 2.62 | 0.0095 | Cross Sectional Effect 18 |
| TS1 | 1 | −157.071 | 107.0 | −1.47 | 0.1439 | Times Series Effect 1 |
| TS2 | 1 | −217.23 | 105.2 | −2.06 | 0.0406 | Times Series Effect 2 |
| TS3 | 1 | −132.798 | 105.3 | −1.26 | 0.2089 | Times Series Effect 3 |
| TS4 | 1 | −225.41 | 102.8 | −2.19 | 0.0298 | Times Series Effect 4 |
| TS5 | 1 | −297.601 | 102.5 | −2.90 | 0.0042 | Times Series Effect 5 |
| TS6 | 1 | −250.844 | 102.6 | −2.44 | 0.0156 | Times Series Effect 6 |
| TS7 | 1 | −214.728 | 104.4 | −2.06 | 0.0414 | Times Series Effect 7 |
| TS8 | 1 | −14.1154 | 103.1 | −0.14 | 0.8913 | Times Series Effect 8 |
| TS9 | 1 | 23.3761 | 103.2 | 0.23 | 0.8211 | Times Series Effect 9 |
| Intercept | 1 | 344.2832 | 122.8 | 2.80 | 0.0057 | Intercept |
| Investments in Software | 1 | −0.2475 | 0.9931 | −0.25 | 0.8035 | |
Table 8.
Regression analysis of panel data pertaining to ATX Prime market-listed companies, results for those companies that are allocated to the finance sector.
Table 8.
Regression analysis of panel data pertaining to ATX Prime market-listed companies, results for those companies that are allocated to the finance sector.
| Statistical Value/Model | Fixed One-Way Model | Fixed Two-Way Model | Random One Model | Random Two Model |
|---|---|---|---|---|
| F-Test for no fixed effects | p = 0.2773 | p = 0.0849 | ||
| Hausman-Test for random effects | p = 0.7202 | p = 0.4891 | ||
| R2 | 0.7918 | 0.8372 | 0.7645 | 0.7793 |
| Investments in Software | p = 0.002 | p = 0.0019 | p < 0.0001 | p < 0.0001 |
Table 9.
Regression analysis of panel data from ATX Prime market-listed companies, assigned to the finance industry; Model: Random two; dependent variable: profit before taxes.
Table 9.
Regression analysis of panel data from ATX Prime market-listed companies, assigned to the finance industry; Model: Random two; dependent variable: profit before taxes.
| Parameter Estimators | |||||
|---|---|---|---|---|---|
| Variable | DF | Estimated Value | Standard Error | t-Value | Pr > |t| |
| Intercept | 1 | 11.59324 | 58.7636 | 0.20 | 0.8441 |
| Investments in Software | 1 | 7.110355 | 0.4369 | 16.27 | <0.0001 |
Table 10.
Regression analysis of panel data pertaining to ATX Prime market-listed companies, results for non-finance companies.
Table 10.
Regression analysis of panel data pertaining to ATX Prime market-listed companies, results for non-finance companies.
| Statistical Value/Model | Fixed One-Way Model | Fixed Two-Way Model | Random One Model | Random Two Model |
|---|---|---|---|---|
| F-Test for no fixed effects | p <0.0001 | p <0.0001 | ||
| Hausman-Test for random effects | p = 0.0002 | p = 0.2377 | ||
| R2 | 0.8719 | 0.8827 | 0.0755 | 0.0737 |
| Investments in Software | p = 0.0011 | p = 0.0022 | p = 0.0037 | p = 0.0041 |
Table 11.
Regression analysis of panel data from ATX Prime market-listed companies, which are not assigned to the Finance industry; Model: Fixed two-way estimates; dependent variable: profit before taxes.
Table 11.
Regression analysis of panel data from ATX Prime market-listed companies, which are not assigned to the Finance industry; Model: Fixed two-way estimates; dependent variable: profit before taxes.
| Parameter Estimators | ||||||
|---|---|---|---|---|---|---|
| Variable | DF | Estimated Value | Standard Error | t-Value | Pr > |t| | Label |
| CS1 | 1 | 24.66184 | 136.4 | 0.18 | 0.8569 | Cross Sectional Effect 1 |
| CS2 | 1 | 148.8385 | 126.4 | 1.18 | 0.2422 | Cross Sectional Effect 2 |
| CS3 | 1 | −171.404 | 126.6 | −1.35 | 0.1792 | Cross Sectional Effect 3 |
| CS4 | 1 | 9.9853 | 126.5 | 0.08 | 0.9373 | Cross Sectional Effect 4 |
| CS5 | 1 | −23.142 | 126.5 | −0.18 | 0.8553 | Cross Sectional Effect 5 |
| CS6 | 1 | 2669.815 | 157.1 | 16.99 | <0.0001 | Cross Sectional Effect 6 |
| CS7 | 1 | −167.801 | 126.7 | −1.32 | 0.1886 | Cross Sectional Effect 7 |
| CS8 | 1 | 554.6385 | 177.9 | 3.12 | 0.0025 | Cross Sectional Effect 8 |
| CS9 | 1 | 429.5432 | 128.0 | 3.36 | 0.0012 | Cross Sectional Effect 9 |
| CS10 | 1 | 433.2121 | 128.1 | 3.38 | 0.0011 | Cross Sectional Effect 10 |
| TS1 | 1 | −189.125 | 123.1 | −1.54 | 0.1281 | Times Series Effect 1 |
| TS2 | 1 | −187.804 | 122.4 | −1.53 | 0.1284 | Times Series Effect 2 |
| TS3 | 1 | −80.0465 | 122.2 | −0.66 | 0.5141 | Times Series Effect 3 |
| TS4 | 1 | −132.679 | 120.8 | −1.10 | 0.2751 | Times Series Effect 4 |
| TS5 | 1 | −189.851 | 120.6 | −1.57 | 0.1191 | Times Series Effect 5 |
| TS6 | 1 | −220.693 | 120.6 | −1.83 | 0.0705 | Times Series Effect 6 |
| TS7 | 1 | −264.273 | 121.8 | −2.17 | 0.0327 | Times Series Effect 7 |
| TS8 | 1 | −84.8042 | 123.1 | −0.69 | 0.4926 | Times Series Effect 8 |
| TS9 | 1 | −75.9349 | 122.5 | −0.62 | 0.5370 | Times Series Effect 9 |
| Intercept | 1 | 363.3457 | 122.7 | 2.96 | 0.0039 | Intercept |
| Investments in Software | 1 | −3.59637 | 1.1382 | −3.16 | 0.0022 | |
Table 12.
Regression analysis of panel data pertaining to ATX Prime market-listed companies, subdivided into finance sector-allocated and non-finance sector-allocated companies, under consideration of the delayed economic impact of software investments.
Table 12.
Regression analysis of panel data pertaining to ATX Prime market-listed companies, subdivided into finance sector-allocated and non-finance sector-allocated companies, under consideration of the delayed economic impact of software investments.
| Statistical Value/Model | Random Two Model | Fixed Two-Way Model |
|---|---|---|
| Hausman-Test for random effects | p = 0.7559 | |
| F-Test for no fixed effects | p < 0.0001 | |
| R2 | 0.7793 | 0.8847 |
| Investments in Software | p = 0.0033 | p = 0.0041 |
| Last year investments in Software | p = 0.1663 | p = 0.0093 |
Table 13.
Compilation of the results of the regression analysis of the panel data for all models and all variants (Finance—Non-Finance industry); significant results are marked in red.
Table 13.
Compilation of the results of the regression analysis of the panel data for all models and all variants (Finance—Non-Finance industry); significant results are marked in red.
| Model | Fixed Effects (One Way Estimates) | Random Effects (One Way Estimates) | Fixed Effects (Two Way Estimates) | Random Effects (Two Way Estimates) | ||||
|---|---|---|---|---|---|---|---|---|
| Company/Statistical Size | R2 | p-Value | R2 | p-Value | R2 | p-Value | R2 | p-Value |
| all companies | 0.8157 | 0.9589 | 0.0070 | 0.2541 | 0.8387 | 0.8035 | 0.0047 | 0.3535 |
| Finance companies | 0.7918 | 0.0002 | 0.7645 | <0.0001 | 0.8372 | 0.0019 | 0.7793 | <0.0001 |
| Non-Finance companies | 0.8719 | 0.0011 | 0.0755 | 0.0037 | 0.8827 | 0.0022 | 0.0737 | 0.0041 |
| Finance companies with the investment of the previous year | 0.7932 | 0.1076 | 0.7608 | 0.1977 | 0.8366 | 0.1339 | 0.7767 | 0.1663 |
| Non-Finance companies with the investment of the previous year | 0.8776 | 0.0071 | 0.1554 | 0.0137 | 0.8847 | 0.0356 | 0.1530 | 0.0146 |
Table 14.
Compilation of the results of the regression analysis for all models of the panel data for finance and non-finance companies, considering the lagged effect of investments in software on the economic success of the company; significant results are marked in red.
Table 14.
Compilation of the results of the regression analysis for all models of the panel data for finance and non-finance companies, considering the lagged effect of investments in software on the economic success of the company; significant results are marked in red.
| Model | Fixed Effects (One Way Estimates) | Random Effects (One Way Estimates) | Fixed Effects (Two Way Estimates) | Random Effects (Two Way Estimates) | ||||||||
|---|---|---|---|---|---|---|---|---|---|---|---|---|
| Company/Statistical Size | R2 | p-Value liS_act | p-Value liS_ly | R2 | p-Value liS_act | p-Value liS_ly | R2 | p-Value liS_act | p-Value liS_ly | R2 | p-Value liS_act | p-Value liS_ly |
| Finance companies with the investment of the previous year | 0.7932 | 0.0037 | 0.1076 | 0.7608 | 0.0026 | 0.1977 | 0.8366 | 0.0197 | 0.1339 | 0.7767 | 0.0033 | 0.1663 |
| Non-Finance companies with the investment of the previous year | 0.8776 | 0.0069 | 0.0071 | 0.1554 | 0.0135 | 0.0137 | 0.8847 | 0.0093 | 0.0356 | 0.1530 | 0.0145 | 0.0146 |
Table 15.
Return on sales for each company assigned to the ATX Prime market for the period 2010–2019; The top twenty results are highlighted in red, while the bottom twenty are highlighted in green. The missing values are negative values that are not displayed.
Table 15.
Return on sales for each company assigned to the ATX Prime market for the period 2010–2019; The top twenty results are highlighted in red, while the bottom twenty are highlighted in green. The missing values are negative values that are not displayed.
| Company/Year | 2019 | 2018 | 2017 | 2016 | 2015 | 2014 | 2013 | 2012 | 2011 | 2010 |
|---|---|---|---|---|---|---|---|---|---|---|
| Andritz AG | 10.1% | 5.4% | 6.1% | 6.8% | 6.4% | 5.4% | 1.6% | 6.4% | 7.0% | 6.9% |
| AT & S | 5.5% | 12.9% | 7.7% | - | 10.0% | 13.6% | 8.8% | 3.2% | 6.4% | 9.5% |
| Bawag Group AG | 36.4% | 37.0% | 37.9% | 44.3% | 29.5% | 21.9% | 11.2% | - | - | - |
| CA Immobilien Anlagen AG | - | 36.4% | 66.8% | 30.5% | 30.0% | 27.1% | 14.0% | 8.5% | 5.3% | 8.8% |
| DO & CO AG | 2.8% | 5.9% | 5.6% | 5.7% | 5.5% | 7.9% | 7.2% | 7.3% | 8.3% | 7.3% |
| Erste Group Bank AG | 26.3% | 27.7% | 26.2% | 25.1% | 21.6% | 9.4% | 8.7% | 10.1% | 7.2% | 12.8% |
| Immofinanz AG | 34.0% | 27.0% | 31.7% | - | - | - | 17.3% | - | - | 26.5% |
| Lenzing AG | 8.3% | 9.7% | 15.7% | 13.8% | 8.4% | 5.6% | 2.1% | 14.1% | 17.3% | 12.0% |
| Mayr-Melnhof Karton AG | 10.1% | 9.3% | 8.8% | 9.2% | 8.8% | 8.0% | 7.2% | 7.9% | 8.6% | 9.1% |
| OMV AG | 15.8% | 15.6% | 14.9% | 7.0% | 4.7% | 5.7% | 6.8% | 7.6% | 7.3% | 10.0% |
| Österreichische Post AG | 10.5% | 9.5% | 11.9% | 9.4% | 9.1% | 8.1% | 8.5% | 8.4% | 8.6% | 4.5% |
| Raiffeisen Bank International | 23.1% | 26.1% | 22.8% | 13.1% | 10.1% | 4.3% | 11.0% | 13.0% | 17.3% | 15.4% |
| S Immo AG | 27.6% | 35.1% | 11.7% | 8.6% | 14.2% | 1.5% | 12.9% | 7.6% | 13.7% | 5.5% |
| Schoeller-Bleckmann | 10.6% | 13.7% | 5.7% | - | 0.4% | 21.0% | 19.6% | 22.1% | 19.2% | 14.9% |
| Telekom Austria Group | 12.1% | 8.2% | 7.8% | 8.5% | 9.7% | 6.1% | 6.4% | 7.3% | 6.0% | 9.0% |
| Uniqa Insurance Group AG | 5.3% | 5.5% | 5.1% | 5.0% | 7.7% | 6.4% | 5.0% | 4.1% | - | 2.4% |
| Verbund AG | 19.1% | 17.7% | 18.3% | 18.7% | 14.0% | 12.6% | 19.4% | 24.1% | 16.0% | 20.6% |
| Vienna Insurance Group AG | 5.9% | 5.5% | 5.1% | 4.5% | 4.5% | 6.0% | 4.9% | 5.8% | 6.4% | 5.6% |
| Voestalpine AG | - | 4.1% | 7.4% | 5.3% | 6.5% | 5.6% | 5.6% | 5.2% | 3.6% | 6.7% |
Disclaimer/Publisher’s Note: The statements, opinions and data contained in all publications are solely those of the individual author(s) and contributor(s) and not of MDPI and/or the editor(s). MDPI and/or the editor(s) disclaim responsibility for any injury to people or property resulting from any ideas, methods, instructions or products referred to in the content. |
© 2024 by the author. Licensee MDPI, Basel, Switzerland. This article is an open access article distributed under the terms and conditions of the Creative Commons Attribution (CC BY) license (https://creativecommons.org/licenses/by/4.0/).
Share and Cite
MDPI and ACS Style
Hangl, C. Influence of Digitalisation on Business Success in Austrian Traded Prime Market Companies—A Longitudinal Study. Econometrics 2024, 12, 4. https://0-doi-org.brum.beds.ac.uk/10.3390/econometrics12010004
AMA Style
Hangl C. Influence of Digitalisation on Business Success in Austrian Traded Prime Market Companies—A Longitudinal Study. Econometrics. 2024; 12(1):4. https://0-doi-org.brum.beds.ac.uk/10.3390/econometrics12010004
Chicago/Turabian StyleHangl, Christa. 2024. "Influence of Digitalisation on Business Success in Austrian Traded Prime Market Companies—A Longitudinal Study" Econometrics 12, no. 1: 4. https://0-doi-org.brum.beds.ac.uk/10.3390/econometrics12010004
Note that from the first issue of 2016, this journal uses article numbers instead of page numbers. See further details here.